Article

Environmental Conflict Risk Assessment Based on AHP-FCE: A Case of Jiuhua Waste Incineration Power Plant Project

1
The School of Resource, Environment and Safety Engineering, Hunan University of Science and Technology, Xiangtan 411201, China
2
South China Institute of Environmental Science, MEP, Guangzhou 510655, China
3
School of Computer Science and Engineering, Hunan University of Science and Technology, Xiangtan 411201, China
*
Author to whom correspondence should be addressed.
Sustainability 2018, 10(11), 4095; https://doi.org/10.3390/su10114095
Submission received: 9 October 2018 / Revised: 3 November 2018 / Accepted: 5 November 2018 / Published: 8 November 2018

Abstract

:
The risk assessment of environmental conflicts has been an integral part of measuring the operability of projects as well as the happiness of the affected population. With the current situation of environmental crises, environmental conflict has an effect on society. In order to maintain the stable development of society, we used the fuzzy comprehensive evaluation method and the analytic hierarchy process to study the risk of a population being affected by a project producing environmental pollution. Furthermore, we provided an approach that had the potential to quantify as well as give a risk assessment of the environmental impact. The results classified 0.397, 0.202, and 0.295 as medium, relatively high, and highest risk, respectively. We deemed that the conflict mode between people, government, and enterprise is actually the confrontation between benefit gainers and benefit losers to a great extent. In subtle ways, this conflict mode has several roles. The solution of environmental conflicts lies in how the roles of government and enterprises change and how the interests of the public are considered. Environmental risks can be safely mitigated without violence by managing relationships between people, governments and businesses.

1. Introduction

Since the 1980s, environmental transformation has attracted special attention in the emergence of sustainable development paradigms [1]. Inhibiting factors of sustainable development include the haphazard sprawl of built-environment, land-use conflicts, natural resource depletion, environmental pollution, ecological destruction, and public health impacts [2]. In particular, Asian countries—led by China—have the most serious environmental problems. With the rapid development of China’ economy, many kinds of projects have become consecutively established and have more or less polluted the surrounding environment, causing a kind of impact called environmental conflict. Environmental conflict occurs when conflicts between human activities and geographic circumstances are generated in different areas, ways, and forms in a shifting society [3]. So far, environmental conflicts have been increasing rapidly each year by 20% [4]. They often accompany the engineering and development of programs and projects, as evidenced by studies related to social environmental conflicts on hydropower [5], Natura 2000 sites [6], and environmental resource management in coastal metropolitan areas [7]. Against this background, traditional mechanisms for environmental conflict resolution (ECR), such as using the juridical system, are increasingly considered to be insufficient to meet this challenge.
So far, environmental conflict resolution has been mostly carried out using qualitative approaches based on public participation, such as those shown by Sun, Zhu, and Chan, who compared related analyses in Shanghai and Hong Kong to measure the implementation of public participation [8], or by Li and his partners [9], who revealed the knowledge of the application of conflict based on government response. In addition, there are also quantitative methods for ECR. For instance, Li used a quantitative approach to determine weights based on indicators of the project [10]. Meanwhile, some scholars proposed a combination of qualitative and quantitative methods for the assessment of environmental impact, as evidenced by the study of Li and Chen [11], who put forward a combined method (analytic hierarchy process and Borda) and well-presented evaluation results of an atmospheric environment. Although the combination of qualitative and quantitative methods is generalized, its potential as a research method for environmental conflict is rarely taken into account. In this paper, we apply a method that combines analytic hierarchy process (AHP) and fuzzy comprehensive evaluation (FCE) to study environmental conflict risk assessment, as a reinforcement of the conventional qualitative and quantitative methods.
AHP supports the weight of qualitative indicators and the rationality of the subjective factors, as identified by Feng, Zhu, and Sun [12], who analyzed the suitability of coastal reclamation. Analytic hierarchy process is beneficial to the initial stage of environmental conflict resolution because its environmental conflict factor correlation can be quantified to strengthen the guiding role of the index. Moreover, it is important that the fuzzy comprehensive evaluation method should be taken according to the principle of factor standard and fully summarize the positive or negative effect of the indicator information, as reflected by the study of Pu [13]. Another study showed that FCE is a crucial step in the assessment of the risk of environmental conflicts. It not only solved the problem of the fuzzy concept but also combined with AHP to form a complete set of evaluation systems [14,15]. However, few studies have applied this method to evaluate environmental conflict as the core concept. In addition, better technology and practices of addressing environmental conflict can be borrowed from foreign countries [16,17,18]. Moreover, China’s waste incineration power generation has entered the golden age of industrial development. It has also represented a stage of environmental accumulation, thus this problem will be concentrated [19]. Therefore, exploring how environmental conflict caused by waste incineration is addressed is a research area that has not been fully developed in the literature.
This paper established the index system and a combined AHP and FCE model, which is based on the relationship between the risk index and risk factors, according to qualitative and quantitative mathematical analyses. The AHP and FCE models are used to evaluate the degree of risk for waste incineration environmental conflicts. Its purpose is to answer the following questions: How should environmental conflicts be judged? How can environmental conflicts be managed through the selected indicators? Given that the subject of environmental conflict is public, subjective factors are particularly focused on the survey of public attitudes.

2. Methods

2.1. Selection of Risk Factors

The identification of risk factors of environmental conflict is the initial stage of risk assessment and the basis of the whole risk assessment stage [20]. It is related to the reliability and authenticity of the evaluation stage. In the early phase, environmental conflicts are the environmental problems of individual group events. Various factors in the complex social background evolved into multi-factor environmental group events. Therefore, environmental conflicts must be placed in the real social stability system. According to a social risk stability study of Li and Zhao, there are six categories in a social risk warning index system [21]: subsistence security, economic support, social distribution, social control, and social psychology. Li and Zhao noted that subsistence security and economic support were the majority and this represented the lifeblood of controlling social stability in the risk system. Once the social stability structure is broken, the scope of this influence will gradually expand. As Barrow noted, people cannot feel the impact of social instability until it really exists [22]. The environmental conflict should draw on the social risk stability early warning index system in the selection of risk factors. The social psychological indicators can map other system indexes from objective reality and emotional levels. As evidenced by Iojă, environmental conflict is a subjective social process [4]. Therefore, social psychology is divided into subjective factors and objective factors to select environmental conflict risk factors.
In terms of subjective factors, the subject of environmental conflict plays a big part. Moreover, the promotion of public environmental awareness has a direct impact on environmental conflict and can be attributed to the social impact of past environmental events [19]. The public has the right to know about the treatment of facilities and the supervision of incinerators. However, many government departments are reluctant to disclose real information [23]. In the end, the public can only judge the environment around them by the actual conditions that they have experienced, whether they are satisfied with the government departments and local enterprises or not. This is related to the risk of environmental conflict. Objectively speaking, the occurrence of environmental conflict is positively related to the national GDP. Namely, the number of environmental conflicts has increased with the increase of the gross regional product (GRP) over the past 10 years. The number of environmental conflicts is positively correlated with industrial emissions and industrial solid emissions. This indicates that the more emissions of industrial waste gas and solid objects, and the more environmental conflict arise [24]. So, the risk factors of environmental conflict must consider the environment itself, which means that the degree of environmental pollution directly affects the surrounding environment and causes people’s dissatisfaction. According to mass incidents in the environmental conflict early-warning index system and an empirical analysis of 150 of China’s major environmental group incidents, improving the system of assessment of a green GDP can fundamentally change the pattern of economic growth to keep environmental pollution to a minimum. Therefore, the risk factors of environmental conflict must consider a green GDP as a proportion of the traditional GDP. The proportion of green GDP is closely related to the degree of environmental pollution.
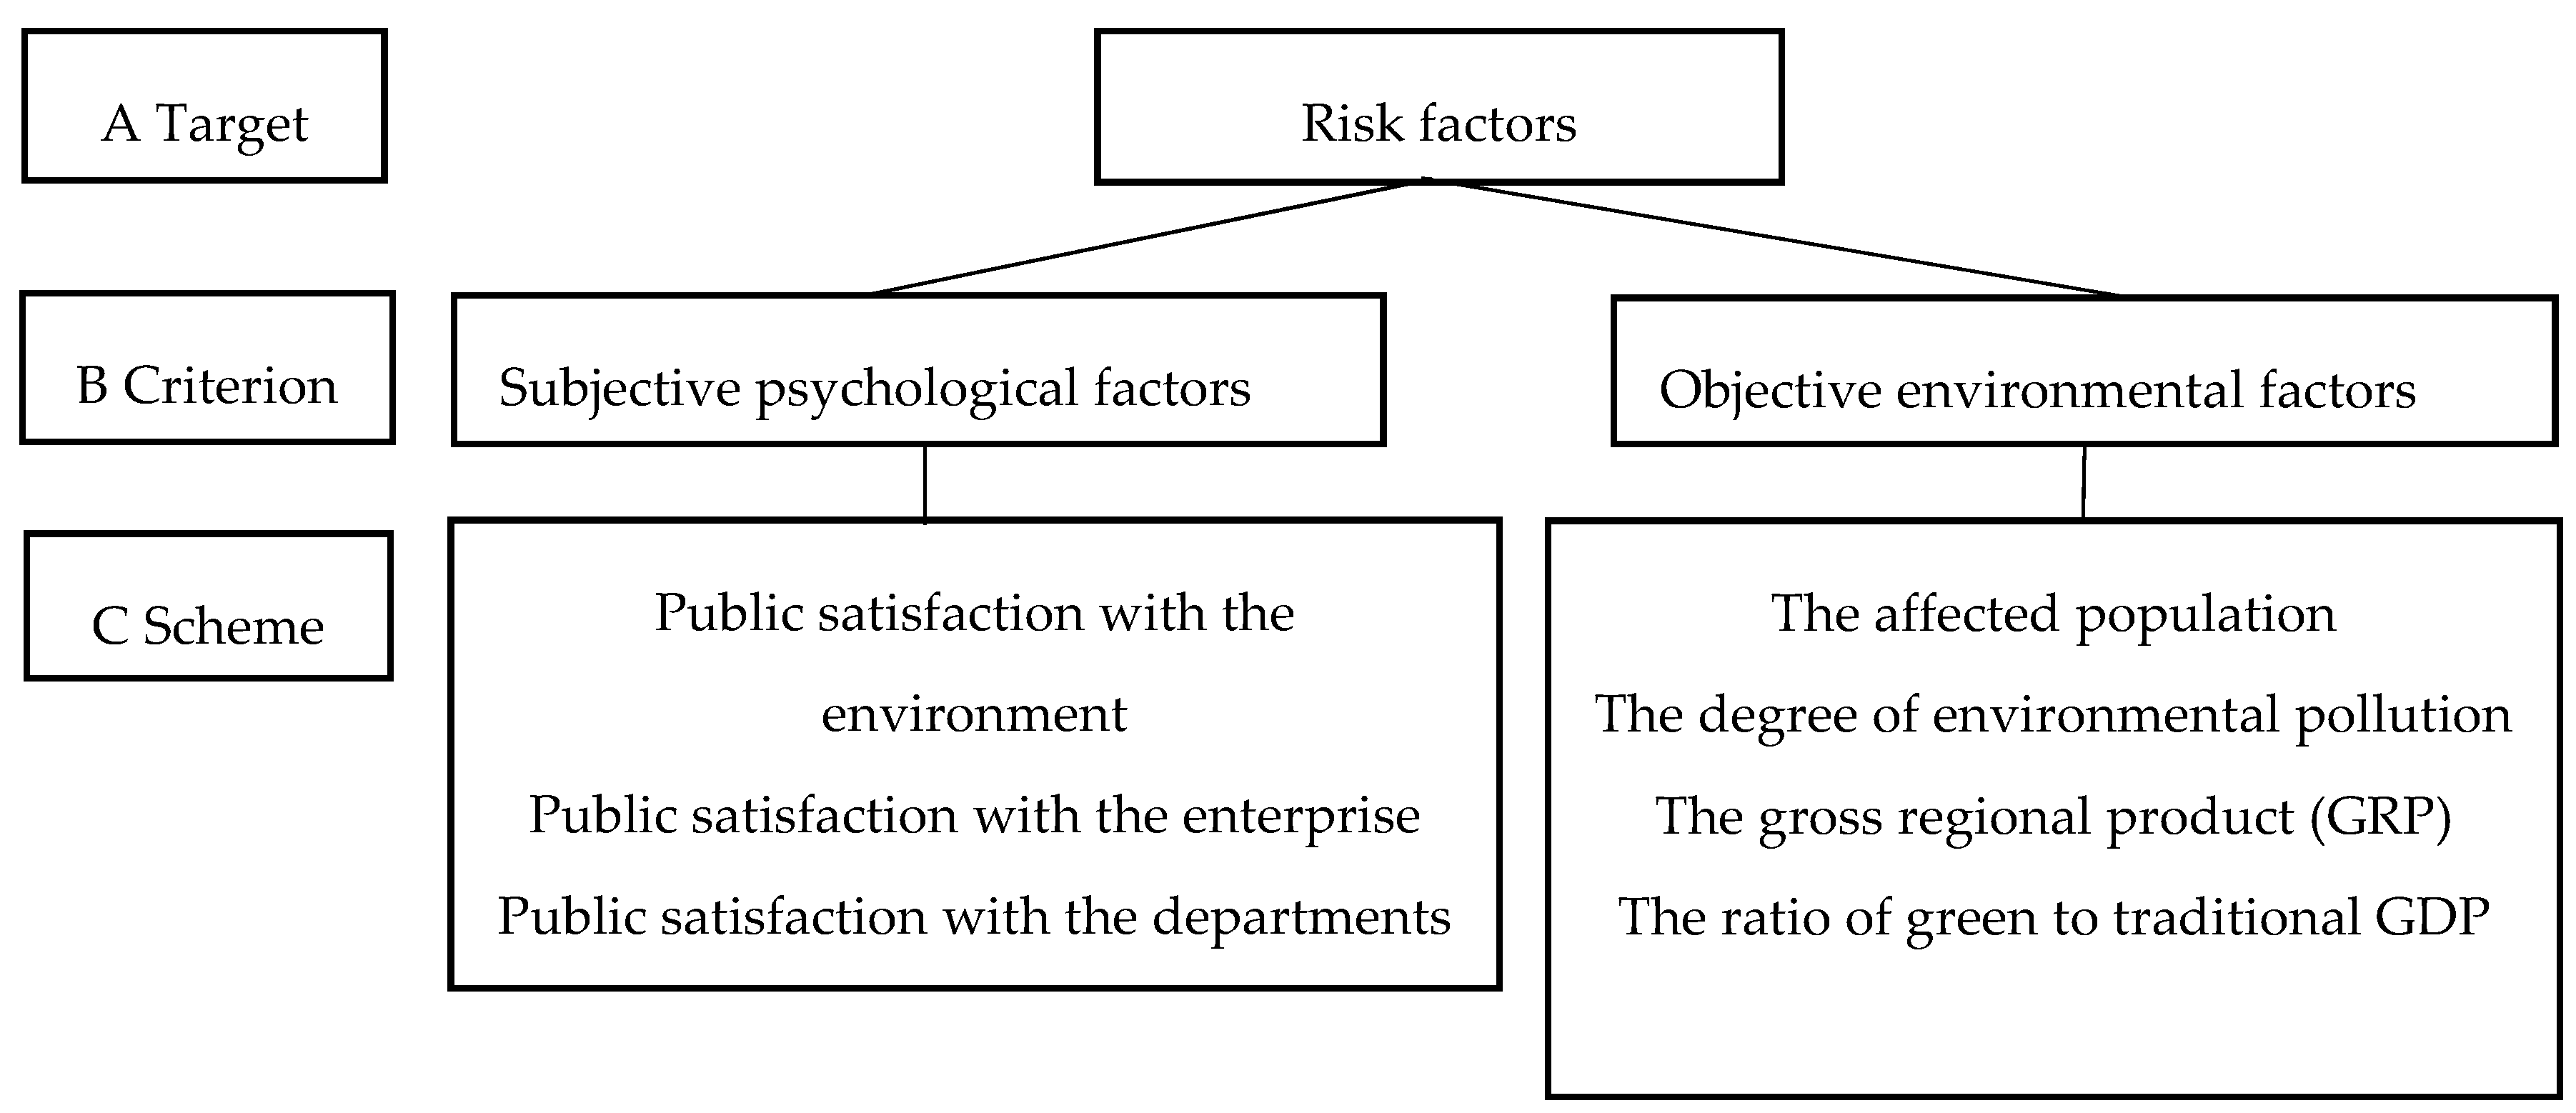
The conflict risk factors induced by environmental pollution projects are divided into two main categories: the first is subjective psychological factors, while the second is objective environmental factors. According to the social stability risk warning index system and relevant weights [21], the subjective psychological factors are as follows: (1) public satisfaction with the environment; (2) public satisfaction with the enterprise; and (3) public satisfaction with the relevant departments. According to the empirical analysis of 150 major environmental group events in China, the objective environmental factors are as follows: (4) the affected population; (5) the degree of environmental pollution; (6) the gross regional product (GRP); and (7) the ratio of green GDP to traditional GDP.

2.2. Analytic Hierarchy Model

There are some different evaluation layers in the AHP method, such as the target layer, index layer, and scheme layer. Quantitative and qualitative analyses run throughout the evaluation process from top to bottom. Based on the analysis of risk factors, the hierarchical model is divided into three layers. The top layer refers to the target layer, which involves only one factor. The middle layer is the index layer, while the bottom layer refers to the scheme layer, which contains seven factors. In the evaluation system, A, B, and C represent different levels. At the same level, digital numbers (1, 2, 3 etc.) represent different factors. Thus, seven factors were used as evaluation elements in order to construct a set of risk factors. The schematic diagram of the hierarchy model of the risk evaluation is shown in Figure 1.

2.3. Establishment of the FCE Model

The FCE model was established based on a five-step process [25].
Step 1: Establish a factor set U. Each element in the factor set U is a factor that affects the risk of environmental conflict, as shown by Equations (1)–(3).
U = { u 1 , u 2 }  
u 1 = { u 1 1 , u 12 , u 13 }  
u 2 = { u 21 , u 22 , u 23 , u 24 }  
where U is the factor set; u1 and u2 are subjective and objective factors; u11, u12, and u13 are factors representing public satisfaction with the environment, enterprise, and departments; u21, u22, u23, and u24 are the factors representing the affected population, degree of environmental pollution, GRP, and the ratio of green GDP to traditional GDP. For each element in U, there is a fuzzy mathematical relationship, expressed by the comments set V.
Step 2: Establish a comment set V. The comment set is applied to judge the results of the evaluation. It is a collection of evaluations, such as good, bad, and general, which is a relatively obscure language. This is expressed as Equation (4) and is shown in Table 1.
V = { V 1 , V 2 , V 3 , V 4 , V 5 }  
where V is the comments set; V1, V2, V3, V4, and V5 are comments representing low risk, relatively low risk, medium risk, relatively high risk, and high risk. On the basis of reference to other warning hierarchies, risk assessment warning is divided into five levels in this paper, namely levels I (low risk), II (relatively low risk), III (medium risk), IV (relatively high risk), and V (high risk). They are labeled using five colors: green, blue, yellow, orange, and red, respectively.
1. V1 (level I)
It shows that the public’s attitude toward the events is normal and the event will not cause harm to society.
2. V2 (level II)
It shows that the public’s attitude toward the event is a bit sensitive; the incident will cause some social impact.
3. V3 (level III)
It shows that the public’s attitude toward the event is sensitive although the social impact is not big. The warning level indicates that the impact of the event has increased, and has even made some of the citizens upset. At this time, there is a certain risk, and the government needs to give attention to the relevant regulations.
4. V4 (level IV)
When the alert level reaches a relatively high risk, it indicates that the public’s attention to the conflict is greatly increased and the influence scope is gradually expanded. The construction of the project itself causes widespread dissatisfaction; meanwhile, when people’s dissatisfaction towards the conflict is high, it can lead to group polarization. Therefore, when the project influence reaches this stage, the public is more sensitive, emotionally unstable, and emotionally intense. However, at this time, if the government can appease the public and strictly control the project, it can still control the direction of the conflict.
5. V5 (level V)
Once the conflict reaches high risk, the incident has received great attention from the public. The public’s speech and behavior will be unfavorable to the society, and on an extreme note, it may gradually rise from merely discussing an event to questioning the government’s credibility, which severely damages the public image of the government. At the same time, people’s emotions fluctuate greatly, and their emotions may easily become out of control, which will trigger deeper and hidden social contradictions and may rise to the level of confrontation between the masses and the government and enterprises, which is extremely dangerous.
Step 3: Determine a weights vector W. The weight of risk factors is measured by the AHP method, which can be attributed to the quantitative and qualitative analyses and the quantification of the constructed hierarchical model. The assessment index weights vector is determined as in Equation (5).
W = { w 1 , w 2 , w 3 , w 4 , w 5 , w 6 , w 7 } ,   ( i = 1 5 w i = 1 , w i 0 )  
where W is the weight vector; w1, w2, w3, w4, w5, w6, and w7 are the weights for u11, u12, u13, u21, u22, u23, and u24, respectively,
Step 4: Calculate single factor membership. For u11, u12, and u13, the single factor membership is derived from the questionnaire, and those of u21, u22, u23, and u24 are calculated by Equations (6)–(10) [26].
Y 1 = { 1 , x < a b x b a , a < x < b 0 , x > b  
Y 2 =   { a x a b , a < x < b c x c b , b < x < c 0 , x > c , x < a  
Y 3 =   { b x b c , b < x < c d x d c , c < x < d 0 , x > d , x < c  
Y 4 =   { c x c d , a < x < d e x e d , d < x < e 0 , x < d , x > e  
Y 5 =   { d x d e , d < x < e f x f e , e < x < f 0 , x < e , x > f  
where Y1, Y2, Y3, Y4, and Y5 respectively represent the memberships of V1, V2, V3, V4, and V5, while a, b, c, d, e, and f represent the ranges of the standard values of V1, V2, V3, V4, and V5. The units of a, b, c, d, e, and f are different due to different factors.
Step 5: Establish a fuzzy comprehensive assessment matrix L, as in Equation (11)
L = W × R
where L is the fuzzy comprehensive assessment matrix; R is the fuzzy membership matrix.

2.4. Determination of Assessments Weight

In AHP, the judgment matrix is used to determine the assessment weight. In this paper, the judgment matrix of factors can be generated from the survey completed by selected experts. Assessments weight was established as shown in Equations (12) and (13).
A = ( a i j ) n × n  
a i j ¯ = a i j / k = 1 n a i j , i , j = 1 , 2 , , n  
where A is the judgment matrix, a i j ¯ is the result of normalization.
The judgment matrix A is judged by experts. The matrix result is shown in Table 2. Certainly, it is necessary to maintain objectivity between data in the analytic hierarchy process. Thus, use the matrix theory to verify the weight through the consistency check [27]. A matrix consistency check is shown in Equations (14) and (15).
λ max = 1 n i = 1 n ( A w ) i w i  
C I = ( λ max n ) / ( n 1 )  
where λ max is the maximum characteristic root; CI is the consistency index.
The random consistency is different at different scales, so Saaty introduced the consistency ratio (CR) [28], which is the consistency evaluation index, as is shown in Equation (16).
C R = C I R I  
where R I is the random consistency index, the specific value for which is shown in Table 2. When C R < 0.10 , the judgment matrix has acceptable consistency. When C R 0.10 , it is necessary to adjust the judgment matrix in order to meet an acceptable consistency.

3. Case Study

3.1. Description of the Case Study

In 2003, the Xiangtan Jiuhua economic and technological development zone was established. Jiuhua is one of the five demonstration areas of the national two-oriented social construction comprehensive supporting reform pilot zones in the Changzhutan city cluster, with a population of 132,000. In 2011, it was upgraded to a state-level economic and technological development zone. Along with the urbanization process in the entire Changzhutan area, resulting in unsustainable production and consumption of goods and services, the city’s production of waste has increased and the city is unable to dispose of it by traditional methods such as landfills. On 30 April 2014, Jiuhua government and Sande enterprise started the process of selecting the location of a waste incineration site and finally set up the Jiuhua demonstration industrial park in Xiangtan. Various participants subsequently contributed to the planning and construction of waste incineration power plants.

3.2. Weight Calculation—Experts Rating

Back in 2013, Zheng and others argued that the environmental impact assessment was a worthy example of public participation [29]. However, the method of engaging public participation was decided in the early stages of the policy process and the lack of well-designed participation was criticized by Zheng [30]. Thus, AHP-FCE data samples were established based on field visits and literature review.
The risk data of this environmental conflict were based on the results of the index factors in the questionnaire completed by 18 selected experts. These data were employed to establish an evaluation system. The questionnaire is detailed in Appendix A. Du, Pang, and Wu proposed that the number of samples of the AHP-FCE analysis should be within the range of 10–50. This can achieve reasonable accuracy in the general evaluation system [31]. The experts rated the difference between two factors. The average scores for the indexes are calculated by Equation (17), and these scores are used to give the priority order of the indexes. The results of the survey are presented in Table 3.
X = n 1 × 1 + n 2 × 3 + n 3 × 5 + n 4 × 7 + n 5 × 9 + n 6 × 1 3 + n 7 × 1 5 + n 8 × 1 7 + n 9 × 1 9  
where X is average score; n1, n2, n3n9 represent the value of Uij.
By matrix A consisting of the average scores, the calculation process is presented as follow:
(1)
a ¯ = [ a 11 a 12 a 21 a 22 ] = [ 1 1 5 5 1 ]
(2)
w ˜ = [ w 11 w 12 w 21 w 22 ] = [ 1 6 1 6 5 6 5 6 ]
(3
w = [ w 1 w 2 ] T = [ 0.1667 0.8333 ] T
(4)
A W = [ 1 1 5 5 1 ] [ 0.1667 0.8333 ] T = [ 0.3334 1.6668 ] T
(5)
λ max = 1 n i = 1 n ( A w ) i w i = 1 2 × ( 0.3334 0.1667 + 1.6668 0.8333 ) = 2.000
(6)
C I = ( λ max n ) / ( n 1 ) = 2 2 1 = 0.000 , R I = 0
(7)
C R = C I R I = 0.000 < 0.1
In this case, the consistency test of matrix A is acceptable. The above equation was realized in MATLAB using an established special computer analysis program.
C I = 0.1667 × 0.163 + 0.8333 × 0.0702 = 0.0790  
C R = 0.1667 × 0.58 + 0.8333 × 0.90 = 0.8467  
C R = C I R I = 0.0790 0.8467 = 0.0933 < 0.1  
Through the above calculations, all consistency checks of judgment matrixes are acceptable. By running this process, the weight of the secondary index and the consistency of the matrix shown in Table 4 can be obtained. According to the above, the importance of each factor is summarized and the scores are compared. These results of factor weighting are shown in Table 5.
The above table shows the weight of each index. The weights of enterprises and departments are the smallest, accounting for 1.95% and 3.33%, respectively. The largest indicators reached 45.54% and 22.08%, respectively representing the affected people and the degree of environmental pollution. The weight shows the degree of importance of factors. Objective factors are accumulating environmental conflicts. For conflicts involving social problems, we must consider the public attitude. Finally, the risk of environmental conflict is evaluated by establishing an evaluation set.

3.3. Membership Calculation—Public Survey

In the membership calculation, the subjective factor data were obtained from the public survey. The public’s attitude plays a prominent role in the outbreak of environmental conflict. As Wu noted, both objective and subjective factors are important [32]. When assessing the risk of environmental conflict with membership, the public is treated as a subjective factor. An investigation was launched into people living near the project, including 150 local residents, 300 students and 50 other individuals.
The detailed questionnaire can be found in Appendix A. The number of respondents and the percentage of respondents expressing satisfaction to some degree are shown in Table 6 and Figure 2.
The respondents’ satisfaction with the local environment was 55%, indicating that the environment in Jiuhua area was excellent, according to the Figure. However, the satisfaction with the local departments or enterprises was only 17%, and the respondents’ dissatisfaction was almost 57%. A good attitude towards the environment is a common aspiration of the people, while public dissatisfaction with enterprises and departments can lead to indirect environmental conflicts. In such a high-risk context, the risk of environmental conflict is significantly increased. The obtained risk factors evaluation criteria based on data and statistical yearbooks are shown in Table 7. The objective factor conditions come from the literature review. Objective factor data information is shown in Table 8.

3.4. Calculation Case of Final Fuzzy Comprehensive Assessment Matrix L

Using the data shown in Table 4 and Table 5 and based on the membership function in Equations (6)–(10), the fuzzy matrix R was obtained.
R = [ 0.15 0.4 0.05 0.15 0.25 0.125 0.037 0.275 0.3375 0.225 0.05 0.1 0.4 0.3 0.15 0 0 0 0 1 0 0 0.8 0.2 0 0.7 0.3 0 0 0 0 0 0.1 0.9 0 ]  
Using Equation (13), the fuzzy comprehensive assessment of environmental conflict was calculated through Equation (11) and Equation (21).
L = W × R  
L = ( 0.071 0.071 0.397 0.202 0.295 )  
It can be seen from Equation (21) that the value of l (0.397) is the largest. The assessment results in the comments that V can be determined by the maximum value lj, where j = 3; the warning level is medium risk; the assessment grade is yellow alert.

3.5. Results Analysis

On the basis of the questionnaire survey, filled out by 18 experts and 500 people, the risk evaluation system was established by the combined AHP-FCE method. A shown in Table 5, the results of the AHP method show that the weight of subjective factors was mainly about 80%. Obviously, the weight of subjective factors was lower than that of objective factors. In terms of objective indicators, the index of environmental pollution reached 45.5%. On the other hand, the index weight of environmental satisfaction was also the highest among subjective factors. It is obvious that environmental pollution was the cause of all conflicts.
In addition, the FCE method was used to establish evaluation sets and risk levels. The results are shown using Equation (21). The results show that the final result of the risk level was a moderate risk of 0.397. High risk was second only to moderate risk, at 0.295. The difference was about 0.102. The risk level was assessed as a yellow warning. If the risk measures are not adjusted in a timely manner, more conflicts may be triggered and the warning may even reach the red level. According to this trend, conflict management is particularly important.

4. Discussion

In analyzing the subjective data, we realized that the subjective factor membership data comes from the public survey, which is limited. When several interviewees were interviewed, they were mostly non-committal because this subject did not reflect their own interests. This may be the normal behavior of the uninterested, a kind of silence of their own, or the influence of their own opinions. As it is affected by other factors, the acquisition of information by public survey mostly presents subjective characteristics. In addition, individual indicators can sometimes affect respondents, leading to a deviation. For example, the respondents’ satisfaction with the environment is affected by the place where they live, and they are more satisfied with the environment when they stay away from the incinerator. Whether this is a common phenomenon or not, it happened in nimby facilities. In this study, the governance of conflicts is only viewed from the perspective of administration or the nature of events. We need methods to analyze environmental conflicts by combining the influence of subjective factors and objective factors. We have to evaluate objective data.
In general, our findings reveal that the AHP-FCE method can provide the basis for democratic participation, so as to better resolve environmental conflicts from the perspective of risk management and public policy. We believe that there exists a simple and regular form of interaction between the public and the government, and this form just reveals the cognition, resource interests, and information of both parties in conflict, promoting democratic participation mechanisms and public development. In contrast, what we found was a process of perfecting democratic politics, not a single system. Our risk assessment results revealed a more comprehensive democratic participation mechanism than traditional risk governance, which is different from the research of Delgado and Romero [34]. Since we found that such evaluation systems mainly attract environmentally conscious participants, we recommend that project organizers change their traditional evaluation philosophy to reach a wider range of respondents.
Compared with previous conflict management approaches, we found that we increased the level of importance of public surveys. Namely, the role of the public as a subject in the risk assessment of environmental conflicts is very important. In other words, the public is an important part of the environmental conflict and plays a major role in the conflict. However, in this case, we quantified the public’s opinion so as to improve people’s trust in government; to make it possible for people to participate in the issue at hand. We also noticed that when people protest against government and enterprise and try to stop the government, it often leads to a dissonance of communication between the people and the government. The higher the level of dissatisfaction, the more conflict occurs. Most respondents believed that the information shared by enterprises and government departments was lacking. The project started before the public had received all relevant information [35]. The government department did not meet the requirements of the environmental impact assessment method. We hold the opinion that a complete information publishing platform should be one of the means of government information disclosure at all levels. Using intelligent technology, such as official software, real-time environmental information can be released, and public opinion monitoring and network information collection mechanisms should be strengthened. Moreover, the authenticity and comprehensive information proposed by Liu also affected the public’s attitude toward environmental events [29]. There is no perfect public participation law in China [36]. Studies conducted abroad have reported the development of technology transfer to reduce the negative impact of polluting facilities in surrounding areas, so as to eliminate the public’s concerns of NIMBY and prevent conflict, which is different from China’s domestic situation [29]. However, technological progress is not something that can be achieved in a short time. Therefore, seeking economic and political means is also an important approach, just as Davis suggested the combined use of public survey and technology [37]. Public participation is not only essential at the construction stage, but also should contribute to the site selection, as expressed by Wang, who advocated a solution from the conflict of space and the perspective of planning [38].
Our results show that the level of environmental pollution is an important cause of conflict, which is consistent with our results analysis. Although the environment appears highly consistent with the expert response, the whole process is not dominated by a single response. The greatest beneficiaries of a good environment are the people, and the greatest victims of a bad environment are the people. However, in China’s environmental conflict governance literature, only a third party is guaranteed to intervene in the evaluation of technical issues, as reported by Yan [39]. This study provides a broader answer which requires further theoretical and practical work to conceptualize and explain this point. In an empirical sense, these findings indicate that the roles of social actors change with the interests, and even the multiple identities of third parties intervene to complicate the management of conflicts.

5. Conclusions

In this paper, we conducted an assessment of the environmental impact of the Jiuhua waste incineration plant, using experimental and survey data from 18 experts and 500 respondents. In the process, we found that the combined AHP and FCE method for environmental risk assessment provides a system support. Specifically, FCE provided an important theoretical basis for the quantification of the fuzzy concept. In addition, in the system’s data, we found that the public has a strong condemnation of government and enterprise due to environmental conflicts, including the fact that the government and enterprise do not release information about the project to the public in time for their true participation in project planning and construction. Our study found that there is little public interest in the conflict itself. There is no doubt that a facade makes NIMBY facilities a difficult issue to address. This paper provides new evidence for qualitative and quantitative methods of environmental conflict assessment and suggests a new direction for conflict resolution. This research underscores the importance of public opinion on environmental conflicts and provides better information on environmental assessment items and environmental conflict resolution. Specifically, there has been a sharp increase in concerns and investment in waste incineration projects.

Author Contributions

Conceptualization, Y.L. (Yaqin Liao) and G.Y.; Methodology, Y.L. (Yaqin Liao) and G.Y.; Software, Y.L. (Yaqin Liao); Validation, Y.L. (Yaqin Liao); Formal Analysis, Y.L. (Yan Liao); Investigation, Y.L. (Yaqin Liao); Resources, G.Y., L.J. and X.L.; Data Curation, Y.L. (Yaqin Liao); Writing-Original Draft Preparation, Y.L. (Yaqin Liao); Writing-Review & Editing, Y.L. (Yaqin Liao) and Y.L. (Yan Liao); Visualization, Y.L. (Yan Liao) and L.J.; Supervision, Y.L. (Yan Liao), L.J. and X.L.; Project Administration, G.Y.

Funding

This research was funded by National Planning Office of Philosophy and Social Science through the National Social Science Fund, Project 15BSH038.

Acknowledgments

The authors acknowledge support from 18 experts and 500 respondents who completed the questionnaire in the research work.

Conflicts of Interest

The authors declare no conflict of interest.

Appendix A

1. Analytic hierarchy process expert survey questionnaire.
(1)
Criteria: Please follow the table scale standard (scale values reflect a measure of the relative importance of each element), and mark the questionnaire in Table A1 based on the relative importance between various indexes.
(2)
Score instructions: Each row of the table is a judgment on the relative importance of two indicators, and a √ is given when it is considered to be a relation of relative importance.
Table A1. Scale standard.
OrderRank of ImportanceScore
1i and j are equally important1
2i is slightly more important than j3
3i is significantly more important than j5
4i is strongly more important than j7
5i is extremely more important than j9
6i is slightly less important than j1/3
7i is obviously less important than j1/5
8i is strongly less important than j1/7
9i is extremely less important than j1/9
2. Public survey questionnaire
For the risk factors of subjective psychological factors, the satisfaction of the people in Xiangtan city (especially Jiuhua residents and students) was investigated regarding the local environment, enterprises, and departments.
The method of this survey: paper questionnaire survey.
The purpose of the questionnaire survey was to analyze the satisfaction of the people in Xiangtan city regarding the environment, enterprises, and departments.
Number of questionnaires: 500 (500 valid)
Questionnaire survey location: Jiuhua district and near Hunan University of Science and Technology.
Questionnaire name: Satisfaction about Jiuhua Waste Incineration Power Plant
The questionnaire content:
(1)
What is your occupation?
(2)
Do you live near Jiuhua?
(3)
Are you satisfied with your current environment?
(4)
How much do you know about garbage incinerators?
(5)
Do you agree to set up a waste incineration power plant in Jiuhua?
(6)
Are you satisfied with the government’s information disclosure work?
(7)
What do you think of the disclosure of the project?
(8)
Have you or the people around you engaged in public participation in the project?
(9)
How satisfied are you with the department (environmental protection department)?
Table A2. Importance level of index.
IndexImportance Level
Normal (1)Slightly Important (3)Significantly Important (5)Strongly Important (7)Extremely Important (9)Not Important Slightly (1/3)Not Important Significantly (1/5)Not Important Strongly (1/7)Not Important Extremely (1/9)
Subjective (U1)/objective (U2)
Public satisfaction with the environment (u11)/Public satisfaction with the enterprise (u12)
Public satisfaction with the environment (u11)/Public satisfaction with the relevant departments (u13)
Public satisfaction with the enterprise (U12)/Public satisfaction with the relevant departments (u13)
The affected population (u21)/degree of environmental pollution (u22)
The affected population (u21)/gross regional product (GRP) (u23)
The affected population (u21)/the ratio of green GDP to traditional GDP (u24)
Degree of environmental pollution (u22)/GRP (u23)
Degree of environmental pollution (u22)/the ratio of green GDP to traditional GDP (u24)
GRP (u23)/the ratio of green GDP to traditional GDP (u24)

References

  1. Phattraporn, S.; Ranjith, P. Use of GIS Tools for Environmental Conflict Resolution at Map Ta Phut Industrial Zone in Thailand. Sustainability 2014, 6, 2435–2458. [Google Scholar] [CrossRef] [Green Version]
  2. Hardoy, J.E.; Mitlin, D.; Satterthwaite, D. Environmental Problems in an Urbanizing World; Earthscan Publications: London, UK, 2001. [Google Scholar]
  3. Mu, C.R.; Yang, Q.Y.; Liu, X.H. Research on environmental conflict analysis and its signification in geography. Acta Geogr. Sin. 1998, 53, 186–192. [Google Scholar]
  4. Yan, Y.; Liu, Z.Y. The problem of “environmental conflict” and its collaborative governance under the risk social theory paradigm. J. Nanjing Norm. Univ. Soc. Sci. Ed. 2014, 3, 120–126. [Google Scholar]
  5. González, B.A.; Navas, G.; Brun, C.; Umaña, A.A.; Cerdán, P. Socio-environmental conflicts on hydropower: The São Luiz do Tapajós project in Brazil. Environ. Sci. Policy 2017, 73, 21–28. [Google Scholar] [CrossRef]
  6. Iojă, I.C.; Hossu, C.A.; Niţă, M.R.; Onose, D.A.; Badiu, D.L.; Manolache, S. Indicators for Environmental Conflict Monitoring in Natura 2000 Sites. Procedia Environ. Sci. 2016, 32, 4–11. [Google Scholar] [CrossRef]
  7. Bramati, M.C.; Musella, F.; Alleva, G. What drives environmental conflicts in coastal areas? An econometric approach. Ocean Coast. Manag. 2014, 101, 63–78. [Google Scholar] [CrossRef]
  8. Sun, L.L.; Zhu, D.J.; Chan, E.H.W. Public participation impact on environment NIMBY conflict and environmental conflict management: Comparative analysis in Shanghai and Hong Kong. Land Use Policy 2016, 58, 208–211. [Google Scholar] [CrossRef]
  9. Li, Y.W.; Vincent, H.B.; Martin, D.J.; Joop, K.J. Government responses to environmental conflicts in urban China: The case of the Panyu waste incineration power plant in Guangzhou. J. Clean. Prod. 2016, 134, 354–361. [Google Scholar] [CrossRef]
  10. Li, Y.P.; Qiao, Q.; Chai, H.F.; Yao, Y.; Bai, L.; Hu, X.W. Study on Environmental Risk Assessment Index Weight of Industrial Park Based on the Analytic Hierarchy Process. Res. Environ. Sci. 2014, 27, 334–340. [Google Scholar] [CrossRef]
  11. Li, D.H.; Chen, J.J. Assessment Atmospheric Environmental Quality with Hierarchic Analysis-Fuzzy Group Dicision Method. Environ. Prot. Chem. Ind. 1998, 4, 237–241. [Google Scholar]
  12. Feng, L.; Zhu, X.D.; Sun, X. Assessing coastal reclamation suitability based on a fuzzy-AHP comprehensive evaluation framework: A case study of Liangyunggang, China. Mar. Pollut. Bull. 2014, 89, 102–111. [Google Scholar] [CrossRef] [PubMed]
  13. Pu, H.X.; Luo, K.L.; Zhang, S.X. Risk assessment model for different foodstuff drying methods via AHP-FCE method: A case study of “coal-burning” fluorosis area of Yunan and Guizhou Province, China. Food Chem. 2018, 263, 74–80. [Google Scholar] [CrossRef] [PubMed]
  14. Wang, W.L.; Dong, C.L.; Dong, W.P.; Yang, C.X.; Ju, T.T.; Huang, L.H.; Ren, Z.M. The design and implementation of risk assessment model for hazard installations based on AHP–FCE method: A case study of Nansi Lake Basin. Ecol. Inform. 2016, 36, 162–171. [Google Scholar] [CrossRef]
  15. Monitto, M.; Pappalardo, P.; Tolio, T. A new fuzzy AHP method for the evaluation of automated manufacturing systems. CIRP Ann. 2002, 51, 395–398. [Google Scholar] [CrossRef]
  16. Salazar, D.J.; Alper, D.K. Perceptions of power and the management of environmental conflict: Forest politics in British Columbia. Soc. Sci. J. 1996, 33, 381–399. [Google Scholar] [CrossRef]
  17. Buchanan, K.S. Contested discourses, knowledge, and socio-environmental conflict in Ecuador. Environ. Sci. Policy 2013, 30, 19–25. [Google Scholar] [CrossRef]
  18. Drazkiewicz, A.; Challies, E.; Newig, J. Public participation and local environmental planning: Testing factors influencing decision quality and implementation in four case studies from Germany. Land Use Policy 2015, 44, 211–222. [Google Scholar] [CrossRef]
  19. Liu, J.Q. Annual Report on Environment Development of China; Social Sciences Academic Press: Beijing, China, 2013; pp. 26–27. [Google Scholar]
  20. Tchankova, L. Risk identification-basic stage in risk management. Environ. Manag. Health 2002, 13, 290–297. [Google Scholar] [CrossRef]
  21. Li, D.W.; Zhao, L.M. The research on social stability and risk early warning mechanism. Econ. Restruct. 2006, 2, 29–32. [Google Scholar]
  22. Barrow, C.J. How is environmental conflict addressed by SIA. Environ. Impact Assess. Rev. 2010, 30, 295–297. [Google Scholar] [CrossRef]
  23. Wang, J.L. Maoming PX Environmental Conflict Event: The Role of the Government, the Public and the Media in Environmental Risk Communication; Shanxi Normal University: Xi’an, China, 2015. [Google Scholar]
  24. Rong, T.; Xie, Y.G. The occurrence, transmission and response of environmental group events—Based on the empirical analysis of the events of China’s major environmental groups from 2003 to 2014. J. Rev. 2015, 6, 72–79. [Google Scholar] [CrossRef]
  25. Xie, Q.J.; Ni, J.Q.; Su, Z.B. Fuzzy comprehensive evaluation of multiple environmental factors for swine building assessment control. J. Hazards Mater. 2017, 340, 463–471. [Google Scholar] [CrossRef] [PubMed]
  26. Zhang, X.; Xiao, X.L.; Xu, G.Y. Determination and Analysis of Fuzzy Membership for SVM. J. Image Graph. 2006, 11, 1188–1192. [Google Scholar]
  27. Zhang, X.H.; Yang, J.J.; Zhao, X.D. Optimal study of the rural house space heating systems employing the AHP and FCE methods. Energy 2018, 150, 633–638. [Google Scholar] [CrossRef]
  28. Zhang, B.J. Analytic Hierarchy Process and Its Application Cases; Electronic Industry Press: Beijing, China, 2014. [Google Scholar]
  29. Liu, C. Urban NIMBY: An empirical study based on the Hunan Xiangtan Jiuhua waste incineration plant incident. J. Jishou Univ. 2016, 5, 95–100. [Google Scholar] [CrossRef]
  30. Zheng, W. Predicament of public participation in the planning of NIMBY facilities in China: A case study on planning of garbage incineration power plant in Liulitun, Beijing. City Plan. Rev. 2013, 37, 66–71. [Google Scholar]
  31. Du, D.; Pang, Q.H.; Wu, Y. Modern Comprehensive Evaluation Method and Case Selection; Tsinghua University Press: Beijing, China, 2016. [Google Scholar]
  32. Wu, X.Y. Causes and countermeasures of environmental conflict. Sci. Technol. Innov. Her. 2010, 19, 140–141. [Google Scholar] [CrossRef]
  33. Huang, S.Q. A Waste incineration power plant, the dioxin in Xiamen on human health risk assessment. Energy Environ. 2015, 1, 56–57. [Google Scholar]
  34. Delgado, A.; Romero, I. Environmental conflict analysis using an integrated grey clustering and entropy-weight method: A case study of a mining project in Peru. Environ. Model. Softw. 2016, 77, 108–121. [Google Scholar] [CrossRef] [Green Version]
  35. Tang, J.F.; Wang, W.B.; Luo, X.Y. Study on public participation in environmental assessment planning of xiangtan nimby facilities—A case study of Xiangtan waste incineration plant planning. Econ. Res. Guide 2015, 12, 167–169. [Google Scholar]
  36. Sun, L.L.; Yung, E.H.K.; Chan, E.H.W.; Zhu, D.J. Issues of NIMBY conflict management from the perspective of stakeholders: A case study in Shanghai. Habit. Int. 2016, 53, 133–141. [Google Scholar] [CrossRef]
  37. Chen, B.S. The history, current situation and enlightenment of studies on nimby conflict in foreign countries. J. Anhui Norm. Univ. 2013, 41, 184–190. [Google Scholar] [CrossRef]
  38. Wang, D.L.; Xu, Q.Q. Attribute analysis and governance of nimby conflict—Based on the analysis of nimby research review. Chin. Public Adm. 2012, 12, 83–86. [Google Scholar]
  39. Xiong, Y. The analysis and countermeasure of the NIMBY group events—A case study of Beijing. J. Beijing Adm. Inst. 2011, 3, 41–43. [Google Scholar] [CrossRef]
Figure 1. Risk factor hierarchy model.
Sustainability 10 04095 g001
Figure 2. The percentage of respondents expressing satisfaction.
Sustainability 10 04095 g002
Table 1. Comments set.
VV1V2V3V4V5
comments(level I)(level II)(level III)(level IV)(level V)
warning levellow riskrelatively low riskmedium riskrelatively high riskhigh risk
warning colorgreenblueyelloworangered
Table 2. Random consistency index (RI) of the judgment matrix.
n123456789
RI000.580.90 1.121.241.321.441.45
Table 3. Survey results for importance level of the index.
Important LevelIndex
U1/U2u11/u12u11/u13u12/u13u21/u22u21/u23u21/u24u22/u23
normal (n1)11233202
slightly important (n2)03365126
significantly important (n3)07621152
strongly important (n4)01415453
extremely important (n5)03210451
not important slightly (n6)22032301
not important significantly (n7)81101211
not important strongly (n8)70011122
not important extremely (n9)00010000
average score0.2374.4374.9552.073.2784.1966.1853.376
Table 4. The results of the judgment matrix.
IndexSecondary Indicators
Judgment hierachyU1 (u11,u12,u13)U2 (u21,u22,u23,u24)
W(0.683,0.200,0.117)(0.546,0.265,0.086,0.103)
λmax3.02464.2106
N34
CI0.01230.0702
RI0.580.9
CR0.0210.078
Consistency checkpasspass
Table 5. Factor weights.
FactorsSubjective Psychological Factors (%)
Environment11.39%
Enterprise1.95%
Department3.33%
FactorsObjective Environmental Factors (%)
Affected population22.08%
Degree of environmental pollution45.54%
GRP7.17%
Green GDP accounts for the share of traditional GDP8.54%
Table 6. Survey respondents.
IndicatorsSatisfaction
SatisfiedMore SatisfiedGeneralNot SatisfiedMore Dissatisfied
Environment (u11)75200257575
Enterprise (u12)6320135170112
Department (u13)284720514575
Table 7. Evaluation criteria for risk factors.
FactorsV1V2V3V4V5
u11satisfiedMore satisfiedgeneralNot satisfiedmore dissatisfied
u12satisfiedMore satisfiedgeneralNot satisfiedmore dissatisfied
u13satisfiedMore satisfiedgeneralNot satisfiedmore dissatisfied
u21 (number)≤50005000–10,00010,000–50,00050,000–100,000≥100,000
u22 (ng/m3)≤0.250.25–0.50.5–11–1.5≤1.5
u23 (¥/billion)<100100–200200–300300–400>400
u24 (%)>2015–2010–155–10<5
Table 8. Objective factor data information.
Risk FactorData SourcesData Information
Affected numbers (u21)Reference [29]0.15 million people
The degree of pollution (u22)—dioxinsReference [33]1.11TE Qng/m3 (Excessive multiples)
GRP (u23)Hunan statistical yearbook128.239 billion
The proportion of green GDP to traditional GDP (u24)The green GDP index of 300 provinces and cities in China5.5%

