Abstract
Even if urban catchments are adequately drained by sewer infrastructures, flooding hotspots develop where ongoing development and poor coordination among utilities conspire with land use and land cover, drainage, and rainfall. We combined spatially explicit land use/land cover data from Luohe City (central China) with soil hydrology (as measured, green space hydraulic conductivity), topography, and observed chronic flooding to analyze the relationships between spatial patterns in pervious surface and flooding. When compared to spatial–structural metrics of land use/cover where flooding was commonly observed, we found that some areas expected to remain dry (given soil and elevation characteristics) still experienced localized flooding, indicating hotspots with overwhelmed sewer infrastructure and a lack of pervious surfaces to effectively infiltrate and drain rainfall. Next, we used curve numbers to represent the composite hydrology of different land use/covers within both chronic flooding and dry (non-flooding) circles of 750 m diameter, and local design storms to determine the anticipated average proportion of runoff. We found that dry circles were more permeable (curve number (mean ± std. error) = 74 ± 2, n = 25) than wetter, flooded circles (curve number = 87 ± 1). Given design storm forcing (20, 50, 100 years’ recurrence interval, and maximum anticipated storm depths), dry points would produce runoff of 26 to 35 percent rainfall, and wet points of 52 to 61 percent of applied rainfall. However, we estimate by simulation that runoff reduction benefits would decline once infiltration-excess (Hortonian) runoff mechanisms activate for storms with precipitation rates in excess of an average of 21 mm/h, contingent on antecedent moisture conditions. Our spatial metrics indicate that larger amounts and patches of dispersed green space mitigate flooding risk, while aggregating buildings (roofs) and green space into larger, separate areas exacerbates risk.
1. Introduction
A dramatic increase in the global frequency and intensity of flooding disasters has been attributed to the interaction between urbanization and climate change [,,,,]. Many large- and medium-sized cities in China are rapidly urbanizing, driven by a shift of China’s population from rural areas to cities; 11% of its population lived in cities in 1949, rising to 56% in 2015 []. The increase in impervious surfaces, resulting from rapid development of new urban core areas, has contributed to chronic flooding during the rainy season (May to October) [,]. In 2008–2010, 168 of the nation’s cities experienced flooding, and 137 cities experienced major flooding three or more times per year. Furthermore, recent statistics indicate that major storm floods are becoming more common, and directly impact an estimated 2.55 million people per year []. These trends prompted the Chinese government to initiate a nation-wide “Sponge Cities” program in 2015 to address urban flooding issues [].
Intense rainfall events, combined with increased impervious surface areas, drive larger volumes of direct runoff to centralized collection systems over short time spans, often resulting in overwhelmed civic wastewater and flood control infrastructure [,,]. Conventional stormwater management (via drains and pipes) emphasizes the rapid evacuation of runoff from urban areas, with minimal opportunity for infiltration before draining to a receiving water body (e.g., stream or lake). While more modern, context-sensitive urban designs incorporate infiltration-type management practices (e.g., rain gardens, dry retention basins, etc.), most are primarily focused on proportionally small lot and project scales, with inadequate integration at the larger city and watershed scales []. However, cities often maintain larger parcels of green space that are dedicated to recreation and right-of-way. Although the general relationship between stormwater runoff and amount of impervious cover is well-known [], patterns of runoff and flooding as related to the spatial interspersion of impervious surfaces and pervious green spaces have not been well-assessed [,,,].
Urban neighborhoods that seem similar in land use, cover patterns, and stormwater infrastructure may experience profoundly different flooding patterns within the same storm event, suggesting that stormwater management requires a multi-scale perspective and treatment []. In this study, we expand on the objectives of Zhang et al. [] by determining the spatial extent and distribution of green spaces, characterizing the general surface hydrology of these spaces, then testing for whether these green spaces may moderate flood risk in Luohe, China. We carry out this analysis by comparison of flooding hotspots—which ostensibly occur due to inadequate drainage infrastructure, lack of infiltrative green space, or both factors—with habitually dry areas, to assess the potential moderating influence of green spaces and their spatial patterns.
2. Materials and Methods
As an overview of our methods, we began with two parallel tracks: (1) Classifying remote sensing data from an unmanned aerial vehicle (UAV) into land use/land cover to measure pervious surface amount and distribution, and; (2) utilizing data on soils, rainfall, elevation, and land cover to calculate per m2 infiltration rates. We identified 25 areas where chronic flooding was recorded by the local government and 25 random areas where flooding was absent, and compared their land use/cover characteristics (e.g., extent and structure of green spaces) to understand which of these factors may contribute to vulnerability of flooding. Those areas with observed, chronic flooding that were not otherwise expected to flood indicated sites were either less permeable overall, inadequately drained by sewer collection infrastructure, or both. Areas in high flooding-risk areas with no observed flooding may indicate areas with adequate stormwater infrastructure (pipes and/or pervious areas).
2.1. Study Area
Luohe is located in the south of China’s Henan province (Figure 1). The political boundaries of Luohe encompass 2617 km2, with 76 km2 dedicated to urban land use that supports approx. 2.5 million people, with about half living in the central urban core. Our study area focused on this central core of 157.94 km2 where the average population density is 973.42 ind./km2. The floodplain setting of the city is relatively flat, though enhanced embankments along the confluence of the Sha and Li rivers capitalize on increased channel capacity to protect the city from most river-cresting events. The built-up area of Luohe increased from 24 km2 in 1999 to 76 km2 in 2016, with an annual expansion rate of 3.25 km2. Green space (delineated in urban plans as purposeful vegetated areas) accounts for 39.7% of the city’s land area, with 11.6 m2 of green space per capita. While the extent of green space increased from 37.4% in 1999 to 39.7% in 2016, this was mainly due to the expansion of the city boundary rather than increased green space within the city itself, and the distribution of green space still remains uneven []. These green spaces are underlain by a wide variety of soils, and according to the U.S. soil taxonomy, they include Alfisols, Entisols, wet Spodisols, Ultisols, and Oxisols (Ferrasols). The permeability of these soils underlying green space may play a role in regulating runoff production and therefore adding detention capacity to various points around the city.
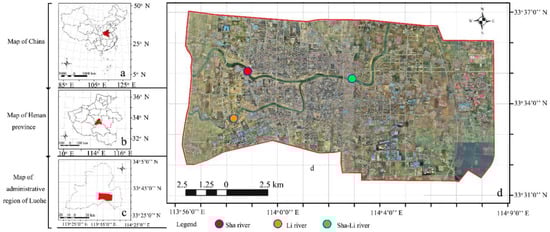
Figure 1.
Study site (Luohe city); (a) the location of Henan province in China; (b) the Luohe administrative region within Henan province; (c) Luohe city within the Luohe administrative region; (d) classified unmanned aerial vehicle (UAV) imagery of Luohe city, illustrating the core city area surrounding the confluence of two rivers.
Luohe is located at the southern edge of China’s warm temperate zone, characterized by a monsoon climate where winters are cold and dry (winter precipitation average: 48.0 mm, 6.0% of the average annual precipitation), and summers are hot and wet (summer precipitation average: 428.6 mm, 53.3% of the average annual precipitation). Over the past 50 years, spring and autumn precipitation has decreased while precipitation has increased in summer, so that the combined spring and summer rainfall rate (when flooding is most common) is now more than twice that in the fall and winter []. The rainfall pattern in the larger catchment area is apportioned as an average annual surface water runoff in the watershed of ca. 370 million cubic meters, with a total shallow groundwater supply of ca. 520 million cubic meters [].
2.2. Land Use and Cover Classification
We generated the digital land use/land cover map using a Red-Green-Blue (RGB) aerial photography image from a Trimble UX5 HP, fixed-wing, unmanned aerial vehicle (UAV), with a 36 megapixels resolution, full width, 0.058 m GSD (ground resolution), using a 25mm focal length lens. The total extent of the image was 157.94 km2: north-to-south 9 km by east-to-west 18 km (Figure 2). Details of these UAV flights include: flight height of 300 m; single flight range of 3.7 km2; flight mode for the ‘Z’ type channel; 5:1 aspect ratio of a rectangular block; and 80% horizontal overlap rate. The post-processed kinematic (PPK) and Global Navigation Satellite System (GNSS) technology in the UAV system established accurate image locations (precision > 0.15 m). To obtain a clear land classification and patch boundary identification, overflights were conducted in leaf-off, winter season 2016 (17–26 January, 2–8 February, 24–29 February), with a wind speed of 5.5–7.9 m/s, and with 4–6 flights each day.
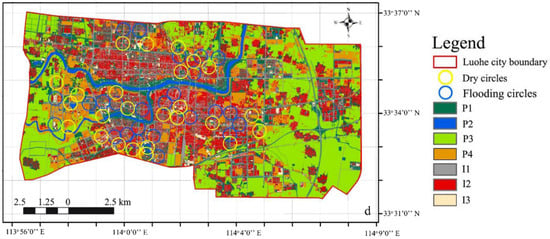
Figure 2.
Land use and land cover classification from UAV data, with observed chronic flooding points (in green, top). The overlap among 750 m diameter circles (flooding and dry) was 6.5% (bottom). Key to legend: P1 = open space (green space, lawns, wood lots, forest); P2 = water areas; P3 = cultivated land (crop cover, pasture); P4 = unimproved areas (bare soil, construction site, no vegetation); I1 = streets and roads (driveway, pavement, open ditches); I2 = roofs; I3 = comprehensive public venues (commercial plaza, park square, paved parking lots).
The UAV raster images were converted to vector layers for ease of classification into land use and land cover classes, which were interpreted and verified manually using updated planning maps and Google Earth images (Figure 2). This work was completed in ArcGIS 10.2. The image was categorized into seven land use/land cover classes, then allocated into two groups: permeable (group 1) and impermeable (group 2). While land use (classified by dominant human land use) and land cover (classified by predominant ecosystem or habitat type) do require distinction based on their influence of flooding, here we differentiated them by their hydraulic conductivity. The permeable group included: open space (#P1; green space, lawns, wood lots, forest), water areas (#P2), cultivated land (#P3; crop cover, pasture), and unimproved areas (#P4; bare soil, construction site, no vegetation). The impermeable group included: streets and roads (#I1; driveway, pavement, open ditches), roofs (#I2), and comprehensive public venues (#I3; commercial plaza, park square, paved parking lots) (Figure 2). Although construction sites (35% of #P4) often have impeded permeability due to soil compaction, we included this class in the permeable group since the worked soil surface is typically rough and infiltrates rainfall, at least prior to weathering and subsequent sealing of the soil’s surface.
2.3. Drainage and Green Space Hydrology
For areas that are sewered, we assumed uniform routing of runoff flows and drainage capacity, as well as geographic coverage. However, sewer collection systems are not necessarily maintained evenly nor equally across districts, and are differentially affected by urban development and re-development that occurred after the original system was installed or retrofit (Figure 3). Luohe has recently experienced more intense rainfall events; for example, the largest rainstorm in Luohe occurred on April 21, 2010, with 187 mm of rainfall falling in 2 h. Other rain events meeting or exceeding 50 mm per event occurred on August 24, 2013, and on multiple days in 2016 (June 20, 23; July 15, 19; and September 26). We therefore used longer rainfall event return intervals (resulting in greater event rainfall depth) to force the curve number model. In addition, we used these longer return intervals derived from the synthetic historical rainfall record to balance historic versus higher anticipated rainfall depths. We developed a suite of rainfall event depths corresponding to different return periods specific to Luohe. The rainfall intensity formula used for our hydrology model was derived from local intensity-duration-frequency (IDF) curves (Supplementary File, Figure S1).
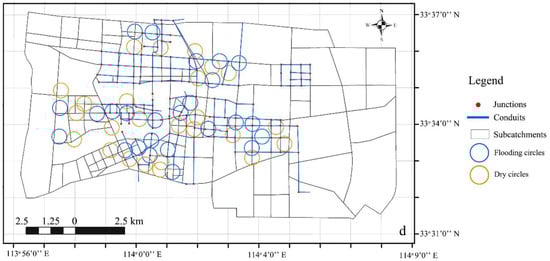
Figure 3.
Subcatchment and pipe network division with a) flooding circles, and b) dry circles. (Subcatchments and arrangement of municipal conduits are referenced from the status map of urban drainage from Overall Urban Planning of Luohe city (2012–2030)).
We used rainfall intensity formula curves (from 1980 to 2013) to simulate a generalized rainfall depth (mm) (Luohe City Municipal Engineering Design Institute, 2014). The rainfall prediction model assumes that the study area is small with consistent geographical and environmental characteristics, thus projecting a uniform spatial distribution for 24 h rainfall events with different return periods. []. Three return periods (20 years (T20), 50 years (T50), 100 years (T100)) were scaled against a maximum possible rainfall depth of 93.5 mm (Tmax) (maximum rainfall in past decade observed on July 17, 2010, between 12:30–14:30; Figure 4).
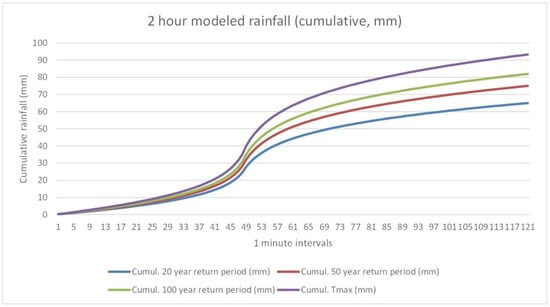
Figure 4.
2 h event cumulative rainfall curves generated by rainfall intensity prediction model.
Urban centers are a mosaic of impervious and pervious areas, soil characteristics, and existing stormwater infrastructure, complicating the accurate modeling of hydrologic processes that affect the frequency and severity of flooding. In pervious areas, runoff was generated by either infiltration excess (rainfall rate exceeds infiltration rate) or saturation excess (where a shallow water table leaves little capacity for storage in surface soils); these processes are regulated by land use and underlying soil characteristics [,]. To estimate green space (i.e., P3) surface soil saturated hydraulic conductivity, we collected 12 soil cores (7.5 cm diameter) to a depth of 60 cm from a suite of Luohe green spaces, or land use/covers otherwise classified as permeable. The soil profiles were assessed for restrictive layers or other taxonomic cues that may impact soil hydrology. Finding none in the top 15 cm of the soil profile, we then employed a laboratory constant-head technique [] to estimate the saturated hydraulic conductivity of the top 15 cm of the soil profile. We then used this hydraulic conductivity data to select permeable surface curve numbers, as well as curve numbers for other land covers (Table 1). Well-established curve number-based calculation techniques (Technical Release 55 Urban Hydrology for Small Watersheds, June 1986. Natural Resources Conservation Service, United States Department of Agriculture; Hawkins et al., 2002) were used to estimate runoff volume from different land use, given 24 h rainfall events with the different return periods calculated for Luohe rainfall patterns. Composite curve numbers were developed from proportional land use within each of the circles, as per the values in Table 1.

Table 1.
US Soil Conservation Service model curve number (CN) value by land classification of Luohe city.
2.4. Landscape Patterns of Permeable and Impermeable Surfaces
As the area of directly connected impermeable surface increases, surface runoff is generated and either routed to the local wastewater collection system, or otherwise routed to disconnected permeable surfaces [,]. The hydrology of permeable areas is regulated by intrinsic characteristics, such as the hydraulic conductivity (which we estimate in this study), and also by antecedent and hydrologic conditions. We used the curve number model as a way to represent simple routing from land cover with different levels of imperviousness that is counterbalanced by detention capacity in pervious areas. However, the spatial distribution of pervious and impervious surfaces also matters—well-connected and clustered impervious areas, situated within a predominant pervious matrix, can reduce surface runoff []. Linear patches with longer, more interspersed edges are able to intercept more surface sheet flow and allow for a greater number of infiltration opportunities []. At small spatial scales, decreased connectivity and proximity of pervious areas may lead to increased local flooding, as impervious areas will be present in larger, more contiguous patches. Higher connectivity of pervious areas may also mitigate flooding, especially at larger scales [].
To characterize the spatial arrangement of permeable surfaces, we utilized four landscape metrics at the class level that previous studies have identified as influencing urban flood mitigation [,,]: percent land area (PLAND), mean patch size (MPS), connectivity (CONNECT), and Landscape Shape Index (LSI, a measure of use/cover type aggregation). Landscape indices at the class level were calculated in Fragstats 4.2 [].
where: i indicates patch cover type, j indicates number of patches, k indicates number of cover types, and:
- aij = area of patch ij
- A = total landscape area
- ni = number of patches of i cover type
- cijk = connection between patch j and k (0 not connected, 1 connected) of patch cover type i
- ei = total edge length of class i
- min ei = minimum edge length of class i
To identify relationships between patterns of pervious areas and observed flooding, we compared the four landscape metrics within 750 m diameter circles around each of the 25 flooding points (as recorded by the city government from 2014–2016 as having observable surface flooding; Figure 2a,b), and within randomly chosen 750 m diameter circles with no recorded flooding. Moran’s I was used to identify spatial autocorrelation in the metrics values among the circles (none was detected; see Supplementary File, Tables S1 and S2). Not all circles had all seven land use types in the same amounts (4 pervious, 3 impervious), therefore we used Welch’s ANOVA (which allows for unequal samples and unequal variances) to compare landscape metrics of each class between flooding and dry circles.
3. Results
The saturated hydraulic conductivity of the urban green spaces was 15.2 ± 6.5 mm/h (mean, SD). The measured green space saturated hydraulic conductivity translates to an “A” type hydrologic soil group, from which we then tabulated the corresponding curve number (CN) value of our general Luohe P3 cover, and the other land use classes (Table 1) [,]. A composite curve number for each circle was generated (Supplementary File, Table S3). Not surprisingly, we found that drier circles were more permeable (curve number (mean ± std. error) = 74 ± 2, n = 25) than wetter, flooded circles (curve number = 87 ± 1, n = 25). Given design storm forcing (20, 50, 100 years recurrence interval, and maximum anticipated storm depths), dry points would produce runoff ranging from 26 to 35 percent rainfall, and wet points from 52 to 61 percent of applied rainfall.
The runoff thus generated via the composite curve number implicitly accounts for a fixed, relatively dry antecedent condition, which may actually be dynamic for permeable surfaces. We also adapted the CN runoff calculation as per [] as initial abstraction in these urban green spaces (which may both be compact and interspersed with impervious areas) to be likely much less than 0.20, and more likely shallower at 0.05 []. This means that green space soils may reach infiltration excess conditions faster for soils in a wet antecedent condition, and more slowly for drier soils. Any sensitivity in runoff production due to antecedent conditions is put in context by the average saturated hydraulic conductivity of green spaces. We estimate by measurement that runoff reduction benefits would decline once infiltration excess (Hortonian) runoff mechanisms activate for storms with precipitation rates in excess of a maximum of ca. 21 mm/h, contingent on antecedent moisture conditions. A minimum threshold of infiltration excess runoff production would occur for an instantaneous rainfall rate exceeding ca. 8.7 mm/h, and the maximum threshold likewise estimated at 21.7 mm/h. For a lower threshold, soils would respond to rainfall more like “B” hydrologic soil by downgrading the curve number, thus furthermore decreasing infiltration, and proportionally increasing runoff (see Supplementary File for CN Metrics).
The Spatial Distribution of Green Space and Flood Factors
Welch’s ANOVA identified significant differences in the amount and configuration of permeable and impermeable land-use types between flooded and dry circles. Flooding circles had a higher percentage of land use in streets and roofs, and a lower percentage of land use in green space and bare areas (Figure 5). A measure of patch aggregation or clustering, the Landscape Shape Index of roofs and green space differentiated flooded and dry circles, with flooded circles displaying a greater aggregation of patches of roofs and green space than dry circles (Figure 6). The mean patch size of roofs was larger in flooded circles, and the green space patch size was, on average, smaller (Figure 7). The connectivity metric was not useful in distinguishing between flooded and dry circles for any land-use type, suggesting that green space connectivity is not as important as other configuration characteristics for flooding mitigation (Figure 8).
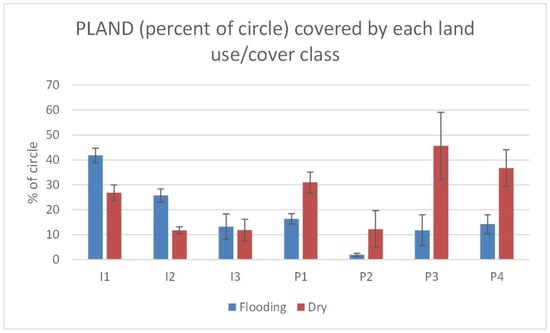
Figure 5.
Landscape differences between chronic flooding circles versus dry circles, as related to percent land use in roads (I1), roofs (I2), plazas and parking (I3), green space (P1), open water (P2), cultivated (P3), and unimproved/bare (P4). * indicates significant differences in means between flooding (blue) and dry (red) circles using Welch’s ANOVA (p < 0.05).
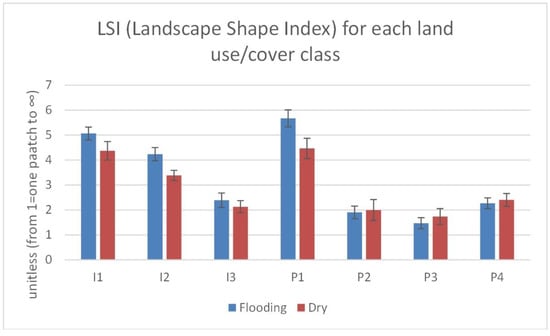
Figure 6.
Landscape differences between chronic flooding circles versus dry circles, as related to the Landscape Shape Index metric measured for roads (I1), roofs (I2), plazas and parking (I3), green space (P1), open water (P2), cultivated (P3), and unimproved/bare (P4). * indicates significant differences in means between flooding (blue) and dry (red) circles using Welch’s ANOVA (p < 0.05).
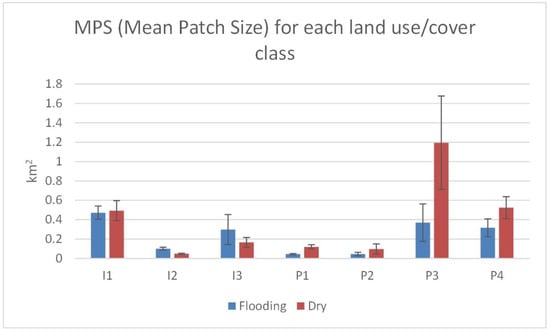
Figure 7.
Landscape differences between chronic flooding circles versus dry circles, as related to mean patch size of roads (I1), roofs (I2), plazas and parking (I3), green space (P1), open water (P2), cultivated (P3), and unimproved/bare (P4). Black bursts indicate significant differences in means between flooding (blue) and dry (red) circles using Welch’s ANOVA (p < 0.05).
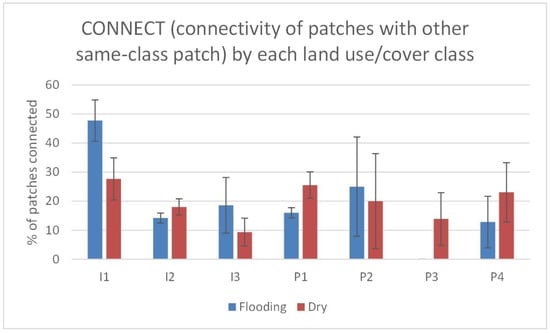
Figure 8.
Landscape differences between chronic flooding circles versus dry circles, as related to connectivity of patches of roads (I1), roofs (I2), plazas and parking (I3), green space (P1), open water (P2), cultivated (P3), and unimproved/bare (P4). Black bursts indicate significant differences in means between flooding (blue) and dry (red) circles using Welch’s ANOVA (p < 0.05).
4. Discussion
Our results demonstrated the positive, cumulative impact of permeable land use/cover on mitigating runoff from roads and rooftops in Luohe city. As expected, areas with chronic flooding were characterized by the dominance of spatially aggregated impervious surfaces, such as roads and rooftops, often in large and dense patches. Green space was reduced, separated, and sometimes isolated from these impervious patches, and this distance from runoff sources and sinks likely lowered its ability to mitigate runoff as effectively. Where improvements to the sewerage infrastructure is impossible or too expensive, we would recommend that more pervious surfaces be added and at least interspersed with impervious areas. Our spatial metrics results are consistent with several previous studies of urban areas in China that have demonstrated the impacts of landscape patterns of permeable land use on flooding. For example, [] observed that a decrease in spatial aggregation of green space (measured by the Fragstats “Aggregation Index”) in Beijing was correlated with increased summer runoff, similar to our observed relationship between green space aggregation (measured by LSI) and chronic flooding (Figure 6). The spatial orientation (e.g., LSI, CONNECT) and dominance (e.g., PLAND, MPS) of pervious areas such as forests and bare land dramatically influenced the hydrology (and hence urban flooding) of the Minjiang River [] and in the Dongting Lake area []. Finally, a study in Texas also found that an increase in percent pervious area (PLAND) was negatively correlated with rainwater runoff (Figure 5) [].
Incomplete and unplanned urbanization in Chinese cities exacerbates flood disasters by increasing the complexity and uncertainty of the disaster and recovery process, particularly given the increasing populations and decline in ecosystem services in the presence of ongoing development (aggravating runoff production). Coupled with climate change, the observed extremes and storm frequency are greater than would have been predicted [,]. Our results speak to the need to prioritize planning or retrofitting green infrastructure systems to mitigate flooding risk in the most flood-prone areas of the city, but also in “hotspots” of very localized flooding due to poor drainage. Improving and increasing permeable surfaces at the local level can mitigate flood risks at that level, and should aggregate up into some flooding reduction, especially at larger scales. One of the first steps is to increase the connectivity of permeable surfaces at progressively larger scales, and therefore address flooding risks at the city-wide level. Additionally, given the large proportion of impervious areas represented by rooftops, a progressive stormwater mitigation strategy should include green roofs [], which not only reduce runoff, but also reduce air pollution and energy use (heating and cooling), all while having the potential to support and maintain local biodiversity.
The effectiveness of permeable land as a stormwater mitigation strategy can be influenced by geographical conditions, as well as the intrinsic hydrological conditions that are predominantly regulated by soil infiltration dynamics. In our study, the capacity of the volume of runoff reduction by permeable land use decreased with increasing rainfall intensity. We speculate that this is due to permeable areas reaching a threshold of Hortonian runoff which is driven by infiltration-excess processes, and in these complex urban landscapes, regulated by specific site conditions and landscape microtopography. Yet, our analysis is restricted to surficial, landscape-level processes which deal with modeled rainfall, forcing a lumped rainfall runoff model. We assume that infiltration excess (Hortonian) is the primary mode of runoff formation, and that specific landscape positions (e.g., Landscape Shape Index) and attributes (e.g., percent of landscape (PLAND), mean patch size) serve to either mitigate or concentrate runoff and route these flows to areas that are, overall, largely predisposed to ponding. Thus, the limitations of our method prevented us from assessing runoff formation by saturation excess, a bottom-up process where knowledge is required of spatially explicit, antecedent soil moisture conditions and local groundwater table dynamics. Our results raise the point that very little is known about the interactions between underground characteristics and processes (e.g., soils, drainage via sewer networks, subsurface flow) in urban areas, which may play a factor in the mismatches between observed flooding areas and our simulations at small scales.
The coupling of local stormwater drainage infrastructure data with soil hydrologic conditions and groundwater table dynamics would likely improve the specificity of our results, as well as the planning outcomes. Our methodology can provide a proof-of-concept for the general direction of green infrastructure implementation or retrofit policy []. This case study points to the need for more productive arrangements of pervious surfaces to collect and infiltrate rain where it falls []. Green infrastructure for stormwater management must be as integrated into development plans at all scales (e.g., sites, neighborhoods, cities) at the same intensity as gray infrastructure (e.g., roads, stormwater pipes and drains, etc.).
5. Conclusions
Recent decades of mass urbanization, accompanied by poor urban planning, have increased urban vulnerability to flooding hazards. A decrease of permeable surfaces has increased surface runoff and reduced infiltration, both of which contribute to flooding. Increasing the area and interspersion of a city’s permeable surface will more effectively utilize permeable surfaces for mitigating flooding risks. We found that the segregation and aggregation of impervious and pervious surfaces into different areas of a neighborhood or city leads to increased observed flooding; however, designating green space around the periphery of a city, no matter how much area it might represent, does nothing in terms of mitigating flooding within the city. In particular, the contribution of many clustered rooftops can be mitigated with green roofs and other small, dispersed areas of green space. The lack of high-resolution data on stormwater managed by the sewer infrastructure prevented us from clearly attributing flooding to runoff from higher adjacent areas and/or inadequate sewer infrastructure. We recommend that future studies endeavor to secure spatially explicit information on sewer infrastructure, and to combine it with topography, soils, and land use/land cover for a clearer understanding of the flood mitigation contribution potential of green space at various spatial scales (e.g., streets, neighborhoods, precincts, cities).
Supplementary Materials
The following are available online at http://www.mdpi.com/2071-1050/10/10/3584/s1, Table S1: Moran’s I spatial autocorrelation analysis of spatial metrics for 25 flooding circles, Table S2: Moran’s I spatial autocorrelation analysis of spatial metrics for 25 dry circles, Table S3: Curve numbers metrics.
Author Contributions
Conceptualization, T.B., G.T. and A.L.M.; Methodology, T.B., A.L.M., and W.D.S.; Software, T.B.; Validation, T.B. and W.D.S.; Formal Analysis, T.B., A.L.M., and W.D.S.; Resources, G.T.; Data Curation, T.B.; Writing-Original Draft Preparation, T.B.; Writing-Review & Editing, A.L.M. and W.D.S.; Visualization, T.B.; Supervision, G.T.; Project Administration, G.T.; Funding Acquisition, G.T.
Funding
This research was supported by the National Natural Science Foundation of China (No. 31470029), International Talent Cooperation Projects of Henan Province (No. 2016GH04), Science and Technology Research Project of Henan Province (No. 112102110027), and Ph.D. abroad joint training fund of Henan Agricultural University (No. 200613).
Acknowledgments
We thank the Luohe city municipal engineering design institute for rainfall data and rainstorm formulas. We also thank GuiFang Wang, Muqing Lin, Ni Xian, and Huamei Shao for assistance with classifying UAV imagery, and Yawen Wu for additional input. Amy Prues at Pegasus Technical Services, Inc. assisted with spatial autocorrelation analysis. Although a USEPA employee contributed to this article, the research presented was not performed or funded by and was not subject to USEPA’s quality system requirements. Consequently, the views, interpretations, and conclusions expressed in this article are solely those of the authors and do not necessarily reflect or represent USEPA’s views or policies.
Conflicts of Interest
The authors declare no conflict of interest. The funders had no role in the design of the study; in the collection, analyses, or interpretation of data; in the writing of the manuscript, and in the decision to publish the results.
References
- Marsalek, J.; Jimenez-Cisneros, B.; Karamouz, M.; Malmquist, P.A.; Goldenfum, J.; Chocat, B. Urban Water Cycle Processes and Interactions; Taylor & Francis: Leiden, The Netherlands, 2008; pp. 2–5. [Google Scholar]
- Jennings, D.B.; Taylor Jarnagin, S. Changes in anthropogenic impervious surfaces, precipitation and daily stream flow discharge: A historical perspective in a mid-Atlantic subwatershed. Landsc. Ecol. 2002, 17, 471–489. [Google Scholar] [CrossRef]
- Franci, F.; Mandanici, E.; Bitelli, G. Remote sensing analysis for flood risk management in urban sprawl contexts. Geomat. Nat. Hazards Risk 2015, 6, 583–599. [Google Scholar] [CrossRef]
- Zhang, B.; Xie, G.D.; Li, N.; Wang, S. Effect of urban green space changes on the role of rainwater runoff reduction in Beijing, China. Landsc. Urban Plan. 2012, 140, 8–16. [Google Scholar] [CrossRef]
- Semadeni-Davies, A.; Hernebring, C.; Svensson, G.; Gustafsson, L.G. The impacts of climate change and urbanisation on drainage in Helsingborg, Sweden: Suburban stormwater. J. Hydrol. 2008, 350, 114–125. [Google Scholar] [CrossRef]
- National Bureau of Statistics of China. The National Bureau of Statistics of the People’s Republic of China; China Statistics Press: Beijing, China, 2016; pp. 147–892.
- Guo, C.A.; Deng, L.M. Analysis and countermeasure of waterlogging in central urban area of Guangzhou. China Water Wastewater 2011, 27, 25–28. [Google Scholar]
- Guo, X.L.; Xu, J.W.; Lu, X.G. Effect of spatial structure of typical urban underlying surface on rainfall infiltration rate. J. Soil Water Conserv. 2007, 21, 60–63. [Google Scholar]
- Yang, P.; Jin, J.; Zhao, D.; Li, J. An Urban Vulnerability Study Based on Historical Flood Data: A Case Study of Beijing. Sci. Geogr. Sin. (China) 2016, 36, 733–741. (In Chinese) [Google Scholar]
- Beijing University of Architecture. Technical Guidelines for Sponge City Construction: Low Impact on Development of Rainwater System Construction: Trial; China Construction Industry Press: Beijing, China, 2015. [Google Scholar]
- Fletcher, T.D.; Shuster, W.; Hunt, W.F.; Ashley, R.; Butler, D.; Arthur, S.; Trowsdale, S.; Barraud, S.; Semadeni-Davies, A.; Bertrand-Krajewski, J.L.; et al. SUDS, LID, BMPS, WSUD and more—The evolution and application of terminology surrounding urban drainage. Urban Water J. 2015, 12, 525–542. [Google Scholar] [CrossRef]
- Shuster, W.D.; Dadio, S.; Drohan, P.; Losco, R.; Shaffer, J. Residential demolition and its impact on vacant lot hydrology: Implications for the management of stormwater and sewer system overflows. Landsc. Urban Plan. 2014, 125, 48–56. [Google Scholar] [CrossRef]
- Malmqvist, P.A. Strategic Planning of Sustainable Urban Water Management; IWA Publishing: London, UK, 2006; pp. 1–10. [Google Scholar]
- Arnold, C.L., Jr.; Gibbons, C.J. Impervious surface coverage: The emergence of a key environmental indicator. J. Am. Plan. Assoc. 1996, 62, 243–258. [Google Scholar] [CrossRef]
- Water, M. WSUD Engineering Procedures: Stormwater; CSIRO Publishing: Collingwood, Australia, 2005; pp. 1–6. [Google Scholar]
- Roy, A.H.; Shuster, W.D. Assessing impervious surface connectivity and applications for watershed management. J. Am. Water Resour. Assoc. 2009, 45, 198–209. [Google Scholar] [CrossRef]
- Gill, S.E.; Handley, J.F.; Ennos, A.R.; Pauleit, S. Adapting cities for climate change: The role of the green infrastructure. Built Environ. 2007, 33, 115–133. [Google Scholar] [CrossRef]
- Kim, H.W.; Park, Y. Urban green infrastructure and local flooding: The impact of landscape patterns on peak runoff in four Texas MSAs. Appl. Geogr. 2016, 77, 72–81. [Google Scholar] [CrossRef]
- Zellner, M.; Massey, D.; Minor, E.; Gonzalez-Meler, M. Exploring the effects of green infrastructure placement on neighborhood-level flooding via spatially explicit simulations. Comput. Environ. Urban Syst. 2016, 59, 116–128. [Google Scholar] [CrossRef]
- Cao, C. Luohe City Government Work Report in 2016 (China); Luohe City Government Press: Luohe, Henan Province, China, 2016; pp. 1–12. [Google Scholar]
- Cheng, J.; Hu, Y.; Hui, F.; Wang, Y.; Yin, G.; Dong, Y.; Shan, T. Relationship between rainfall amount and rain clouds in Luohe. Meteorol. Environ. Sci. 2007, 30, 59–60. (In Chinese) [Google Scholar]
- Lei, Q.; Song, S.; Ai, X.-L. Situation and Countermeasures of Exploitation& Utilization of Water Resources in Luohe City. Ground Water 2004, 26, 63–64. (In Chinese) [Google Scholar]
- Luohe City Municipal Engineering Design Institute. Luohe City Rainstorm Intensity Formula; Luohe City Municipal Engineering Design Institute: Luohe, Henan Province, China, 2014; pp. 1–17. [Google Scholar]
- Shuster, W.D.; Pappas, E.; Zhang, Y. Laboratory-scale simulation of runoff response from pervious-impervious systems. J. Hydrol. Eng. 2008, 13, 886–893. [Google Scholar] [CrossRef]
- Battiata, J.; Collins, K.; Hirschman, D.; Hoffmann, G. The runoff reductionmethod. J. Contemp. Water Res. Educ. 2010, 146, 11–21. [Google Scholar] [CrossRef]
- Oosterbaan, R.J.; Nijland, H.J.; Ritzema, H.P. Determining the saturated hydraulic conductivity. Drain. Princ. Appl. 1994, 50, 834–835. [Google Scholar]
- Shuster, W.D.; Bonta, J.; Thurston, H.; Warnemuende, E.; Smith, D.R. Impacts of impervious surface on watershed hydrology: A review. Urban Water J. 2005, 2, 263–275. [Google Scholar] [CrossRef]
- Blessing, R.; Sebastian, A.; Brody, S.D. Flood risk delineation in the United States: How much loss are we capturing? Nat. Hazards Rev. 2017, 18, 04017002. [Google Scholar] [CrossRef]
- Ziegler, A.D.; Giambelluca, T.W.; Plondke, D.; Leisz, S.; Tran, L.T.; Fox, J.; Vien, T.D.; Pinthong, J.; Maxwell, J.F.; Evett, S. Hydrological consequences of landscape fragmentation in mountainous northern Vietnam: Buffering of Hortoniam overland flow. J. Hydrol. 2007, 337, 52–67. [Google Scholar] [CrossRef]
- Boyd, M.J.; Bufill, M.C.; Knee, R.M. Pervious and impervious runoff in urban catchments. Int. Assoc. Sci. Hydrol. Bull. 1993, 38, 463–478. [Google Scholar] [CrossRef]
- McGarigal, K.S.; Cushman, S.A.; Neel, M.C.; Ene, E. FRAGSTATS: Spatial Pattern Analysis Program for Categorical Maps. 2002. Available online: https://www.umass.edu/landeco/research/fragstats/fragstats.html (accessed on 1 October 2018).
- Mishra, S.K.; Singh, V.P. SCS-CN methodpart-1: Derivation of SCS-CN based models. Acta Geophys. Pol. 2002, 50, 457–477. [Google Scholar]
- Muthu, A.C.L.; Santhi, M.H. Estimation of surface runoff potential using SCS-CN method integrated with GIS. Indian J. Sci. Technol. 2015, 8. [Google Scholar] [CrossRef]
- Hawkins, R.H.; Jiang, R.; Woodward, D.E.; Hjelmfelt, A.T.; Van Mullem, J.A. Runoff Curve Number Method: Examination of the Initial Abstraction Ratio. In Proceedings of the Second Federal Interagency Hydrologic Modeling Conference, Las Vegas, NV, USA, 28 July–2 August 2002. [Google Scholar]
- Lim, K.J.; Engel, B.A.; Muthukrishnan, S.; Harbor, J. Effects of initial abstraction and urbanization on estimated runoff using CN technology. J. Am. Water Resour. Assoc. 2016, 42, 629–643. [Google Scholar] [CrossRef]
- Liang, X.J.; Jiang, H.; Zhu, Q.A.; Huang, M.L. Modelling hydrological response to different land-use and climate change scenarios in the upper reach of Minjiang river. Res. Soil Water Conserv. 2008, 15, 30–33. [Google Scholar]
- Liu, N.; Wang, K.; Duan, Y. Analysis on the responses of flood storage capacity of Dongting Lake to the changes of landscape patterns in Dongting lake area. Acta Ecol. Sin. 2012, 32, 4641–4650. [Google Scholar] [CrossRef]
- Olsson, J.; Gidhagen, L.; Gamerith, V.; Gruber, G.; Hoppe, H.; Kutschera, P. Downscaling of short-term precipitation from regional climate models for sustainable urban planning. Sustainability 2012, 4, 866–887. [Google Scholar] [CrossRef]
- Rogers, D.P. Global Assessment Report on Disaster Risk Reduction; United Nations Office for Disaster Risk Reduction: Geneva, Switzerland, 2011. [Google Scholar]
- Oberndorfer, E.; Lundholm, J.; Bass, B.; Coffman, R.R.; Doshi, H.; Dunnett, N.; Gaffin, S.; Köhler, M.; Liu, K.K.Y.; Rowe, B. Green roofs as urban ecosystems: Ecological structures, functions, and services. Bioscience 2007, 57, 823–833. [Google Scholar] [CrossRef]
- Yang, C.; Wang, Q.; Jin, X.; Pan, S. GIS-based simulation study on community rainstorm waterlogging in Shanghai municipality. J. Nat. Disasters 2015, 24, 195–202. [Google Scholar]
- Dietz, M.E. Low impact development practices: A review of current research and recommendations for future directions. Water Air Soil Pollut. 2007, 186, 351–363. [Google Scholar] [CrossRef]
© 2018 by the authors. Licensee MDPI, Basel, Switzerland. This article is an open access article distributed under the terms and conditions of the Creative Commons Attribution (CC BY) license (http://creativecommons.org/licenses/by/4.0/).