Abstract
This study proposes a dynamic braking force distribution strategy based on a PID algorithm for Formula Student electric racing cars, addressing the limitations of fixed-ratio distribution methods in adapting to dynamic braking conditions. The strategy utilizes a PID controller targeting the desired slip ratio to dynamically adjust the braking force distribution coefficient (β) between the front and rear axles. The proposed method was validated through co-simulation using CarSim and Simulink, as well as real vehicle testing. Simulation results show a 7.7% reduction in braking distance under emergency braking at 100 km/h with the PID control strategy, while real vehicle testing confirmed a braking distance of 30 m, with a 5.6% deviation from the simulation. Additionally, both yaw and roll angles were significantly reduced, improving vehicle stability during braking. Experimental data confirmed that the system dynamically maintains an optimal pressure difference of approximately 1.6 MPa between the front and rear axles, effectively preventing rear wheel lock-up and ensuring stable braking performance. The research demonstrates that this PID-based brake-by-wire distribution strategy significantly enhances both braking efficiency and driving stability, providing valuable insights for the development of high-performance electric vehicles.
1. Introduction
With the establishment of carbon peak goals in the automotive industry, electric vehicles have emerged as both symbolic and leading products in the ongoing automotive transformation. Pure electric vehicles demand significantly higher standards for safety, reliability, and stability compared to traditional internal combustion engine vehicles, which makes their safety system design inherently more complex. Brake-by-wire (BBW) technology [1] provides a key solution to these challenges by enabling precise electronic control systems. This technology holds considerable application value, particularly in pure electric vehicles. The BBW system, which consists of sensors, an ECU, and actuators, replaces traditional mechanical components by transmitting braking commands through electrical signals to the actuators. By utilizing optimized braking force distribution strategies and advanced control algorithms, the brake-by-wire system can greatly improve braking efficiency.
For electric Formula racing cars, the brake-by-wire system offers several significant advantages [2]. Firstly, it delivers exceptional responsiveness and high precision in braking force distribution. Secondly, it enables superior coordination between braking and energy recovery. The system leverages the ECU to seamlessly manage both hydraulic braking force and motor regenerative braking. This integration ensures smooth transitions between the two braking modes, preventing torque disruptions that could cause vehicle attitude fluctuations and maintaining a consistent driving rhythm. Given the high braking intensity and stringent active safety requirements in electric Formula racing, optimizing braking force distribution is of critical importance [3].
Silva [4], based on empirical data from FSAE racing brake systems, developed a numerical model to ensure four-wheel lock-up after pedal force application and load transfer. Static tests were conducted on the racing car using an Arduino platform, controlling braking forces on the front and rear axles via a balance bar mechanism, achieving the target of four-wheel lock-up. Following FSAE regulations, Gupta [5] performed design and simulation analyses of braking system components, focusing on performance enhancement and lightweighting. Using MATLAB (version 2021b), calculations for brake pedal leverage ratio, braking torque, brake disc thermal load, and required clamping force were made to ensure stable deceleration at maximum braking intensity. The Stauch [6] team conducted thermal analysis on the 2019 Formula Student racing car from Esslingen University of Applied Sciences. Based on simulation results, they evaluated several geometric configurations and cooling duct designs, providing effective solutions for managing the braking system’s thermal load under high-performance conditions.
While existing literature has thoroughly explored the braking systems of Formula racing cars, research on braking force distribution for specialized vehicles remains relatively limited. Racing cars that use fixed-ratio braking force distribution often face challenges in adapting to complex and dynamic real-world conditions due to their lack of dynamic adjustment capabilities. The extremely high braking forces and stringent safety standards of electric Formula racing cars make the study of inter-axle braking force distribution crucial for improving braking performance and ensuring driver safety. This area of research holds significant theoretical and engineering value.
Although significant progress has been made in the field of braking systems for Formula racing cars, the research on dynamic braking force distribution for specialized vehicles—particularly high-performance racing cars—remains underdeveloped. A review of recent literature reveals that most studies have focused on regenerative braking and basic distribution strategies for electric vehicles [7,8,9]. However, systematic research on the dynamic braking force distribution mechanisms for special-purpose racing cars, which operate under more extreme conditions and are sensitive to parameters, is lacking. Racing cars employing fixed-ratio braking force distribution often exhibit limited adaptability due to their lack of real-time adjustment capabilities, particularly when facing complex track conditions and severe load transfer. In the FSAE competitions, inter-axle braking force distribution not only directly influences braking performance but also impacts driver safety and race outcomes. Therefore, optimizing this distribution system holds significant theoretical and engineering value.
In the control process of brake-by-wire systems, nonlinearities and uncertainties are prevalent, primarily arising from factors such as nonlinear tire characteristics, variations in vehicle load, dynamic brake responses, and complex road conditions. As a result, the system imposes stringent robustness requirements on the controller. In response, several advanced control strategies have been developed for brake-by-wire applications, including fuzzy-PID control, sliding mode variable structure control, adaptive fuzzy control, and multi-objective optimization with weighted coordination strategies.
Yang et al. [10] proposed a braking-intention-based torque coordination strategy for electro-hydraulic composite braking in four-wheel-drive electric vehicles. By combining PID control with fuzzy logic, the system precisely regulates hydraulic braking torque and compensates for hydraulic lag with motor braking torque, reducing fluctuations and vehicle impact during mode transitions. Li et al. [11] developed an adaptive fast terminal sliding mode controller for slip ratio tracking, based on the Burckhardt tire model. By integrating an improved tracking differentiator and adaptive law, this method ensures high accuracy and robustness under disturbances. Liu et al. [12] introduced an adaptive braking force distribution strategy that adjusts the electro-hydraulic braking force ratio based on vehicle speed, battery charge, and braking intensity, enhancing stability, energy recovery, and adaptability. Zhang et al. [13] addressed time delays and parameter variations in EHB system mode switching, proposing a torque coordination strategy with motor compensation, NSGA-II optimization, and RBF-Smith-based delay compensation. Experimental results confirmed its effectiveness in mitigating delays and stabilizing switching. Despite promising performance in simulations, these methods require further validation for reliability, real-time performance, and environmental adaptability in real vehicle applications.
Existing control methods face several limitations in engineering applications. Fuzzy-PID control [14] suffers from strong dependence on rule design and insufficient high-frequency real-time performance. Sliding mode variable structure control [15] is prone to chattering and requires high precision from actuators. Adaptive fuzzy control [16] imposes heavy computational burdens, leading to command delays. Multi-objective optimization strategies [17] are challenged by complex weight design and poor adaptability to varying operating conditions.
Although significant progress has been made in the field of linear control for braking systems, there remain notable gaps in dynamic braking force distribution under extreme conditions, such as those encountered by FSAE racing cars. Advanced control strategies are often computationally complex and fail to meet real-time control requirements. Many methods do not fully account for the high-intensity braking and complex track conditions unique to racing vehicles, and the potential of classical PID control in this domain has yet to be systematically explored. To address these issues, this paper proposes a dynamic braking force distribution strategy based on an optimized PID algorithm. By improving the control structure and parameter tuning method, the strategy significantly enhances system response speed while maintaining control accuracy. A comprehensive CarSim-Simulink co-simulation platform was developed to validate the control strategy within a highly realistic vehicle dynamics model. Experimental and simulation data comparison (with a deviation of only 5.6%) confirmed the effectiveness and reliability of the proposed strategy in real-world applications. This study not only fills the gap in systematic research on classical PID control for specialized vehicle braking systems but also provides an efficient and practical technical solution for real-time braking force distribution under high-dynamic conditions.
2. Braking System Design Process
2.1. Vehicle Force Analysis
In accordance with FSAE competition rules, the vehicle was required to accelerate to a specified speed within a designated area and then perform braking, ensuring that all four tires achieved simultaneous lock-up without instability, such as fishtailing, sideslipping, or spinning, during the process. This study used the self-developed electric Formula racing car from Yancheng Institute of Technology as the research subject. Key technical parameters and tire specifications are listed in Table 1. Figure 1 presents the simplified force diagram of the vehicle during braking on a flat road surface. To streamline the analysis, rolling resistance, aerodynamic drag, and inertial moments from rotational mass deceleration were excluded [18]. In Figure 1, Fxb1 and Fxb2 represent the braking forces on the front and rear tires, respectively. u is the vehicle speed, and the tire model is Hoosier 16 × 7.5-10R25 B.

Table 1.
Vehicle Technical Parameters of the Racing Car.
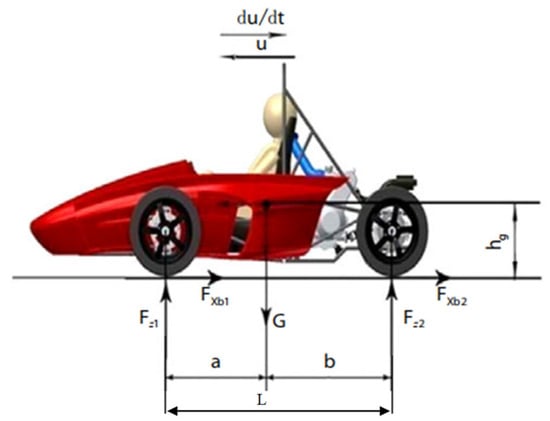
Figure 1.
Vehicle Force Diagram.
Taking moments about the contact points between the front and rear wheels and the ground, respectively, the following equations were derived:
In the equations, FZ1 represents the normal reaction force from the ground on the front wheel (N); FZ2 denotes the normal reaction force on the rear wheel (N), and du/dt is the vehicle’s deceleration (m/s2).
Furthermore, since , where z represents the braking intensity, the normal reaction forces of the ground can be expressed as:
When braking on road surfaces with varying adhesion coefficients, if both the front and rear wheels reach lock-up (simultaneously or sequentially) [19], the normal reaction forces on the front and rear wheels can be expressed as:
where φ represents the adhesion coefficient. The adhesion coefficient directly limits the maximum braking force a vehicle can apply before the wheels lock.
2.2. Braking Force Distribution Analysis
In vehicle braking system design, the front-to-rear axle braking force distribution ratio is a critical design parameter. The ideal static braking force distribution aims to achieve synchronized slip between the front and rear wheels, reducing the risk of tire slip through optimized slip rate control, thereby maximizing ground adhesion. The relationship between the front and rear braking forces is typically referred to as the ideal braking force distribution curve for the front and rear wheels. On any surface with adhesion coefficient φ, the condition for simultaneous wheel lock-up at both the front and rear wheels is: the sum of the front and rear braking forces equals the available adhesion, and the braking force of each axle is equal to its respective adhesion force, i.e.,
where and represent the braking forces on the front and rear brakes, respectively.
Combining Equations (5)–(7), the ideal braking force distribution relationship between the front and rear wheels is derived as:
Substituting the racing car parameters from Table 1 into Equation (8), the calculation yields:
The distribution line that allocates braking force between the front and rear wheels according to a fixed ratio is known as the β-line. The braking force distribution coefficient β is defined as the ratio of the front brake force to the total braking force of the vehicle , expressed as:
The slick tires used on the racing car can achieve a maximum adhesion coefficient of 1.4 with the track surface [20]. By incorporating the racing car parameters, the braking force distribution coefficient is calculated as β = 0.68. Figure 2 illustrates the relative positional relationship between the fixed-ratio distribution line (the β-line) and the ideal braking force distribution curve (I-curve). The red line represents the I-curve, which is fitted from Equation (9), while the green line represents the β-line, fitted from Equation (10).
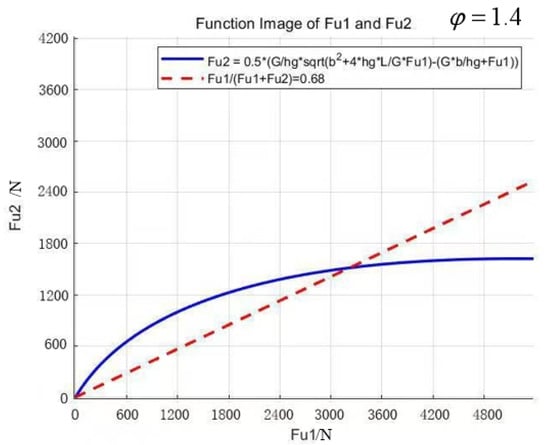
Figure 2.
Braking Force Distribution Curve of the Racing Car.
When the β-line lies below the I-curve, the front wheels will lock before the rear wheels during braking, which, although stable, results in a loss of steering capability [21]. Conversely, when the β-line lies above the I-curve, the rear wheels will lock first, potentially causing vehicle skidding and loss of directional stability. Therefore, optimal braking efficiency and directional stability can only be achieved when the actual braking force distribution curve (β-line) intersects the I-curve at the point corresponding to the current adhesion coefficient, ensuring four-wheel simultaneous lock-up during braking [22].
2.3. Braking System Configuration Selection
Assuming simultaneous lock-up of both the front and rear wheels during emergency braking, the required braking torque for the front and rear axles can be calculated using the following formulas:
where represents the effective tire radius.
For the formula racing car, with a 10-inch rim specification, the brake disc diameter D0 is selected to be between 70% and 79% of the rim diameter and is initially determined as 190 mm [23]. The brake disc thickness h must balance mass and heat dissipation requirements. Excessive thickness increases mass, while insufficient thickness compromises heat dissipation. The final thickness is determined to be 4 mm.
The braking system pressure P is set to 5 MPa, which is within the brake pipeline system’s upper limit of 10 MPa [24]. The coefficient of friction between the friction pads and the brake disc is set to μ = 0.4, within the range of 0.35–0.45. Under the condition of uniform force distribution across the left and right wheels, the clamping force of the wheel cylinder Fn and the effective friction force Fb satisfy the following relationship:
where R represents the effective radius of the brake pads, with the selected friction pads having an R-value of 93 mm. Based on this formula, the brake piston diameters for the front and rear wheels are calculated. Considering both the structural layout and braking force requirements, the final configuration is determined to be a four-piston caliper with a piston diameter of d1 = 15 mm for the front wheels, and a two-piston caliper with a piston diameter of d2 = 20 mm for the rear wheels.
The working volume of the brake wheel cylinder can be calculated using the following formula:
where n represents the number of pistons in the wheel cylinder, and δ = 2 mm is the clearance between the brake lining and the brake disc.
Each brake master cylinder is connected to two wheel cylinders on the same axle. The working volume of the master cylinder Vm, is calculated as:
where the brake pipeline expansion coefficient a = 1.1, and the piston stroke S is set to 1.0 times the master cylinder diameter D. Substituting the data yields calculated values of mm and mm. Considering the symmetrical arrangement of the brake master cylinders and the necessary safety margin, a standardized master cylinder with a diameter of mm is selected. Both master cylinders are arranged vertically for optimal performance.
The brake pedal force Fp is given by:
where i = 6 is the transmission ratio of the brake pedal mechanism, and η = 0.85 is the mechanical efficiency of the pedal mechanism. According to standard requirements, the pedal must not fail under a stepping force of 600 N, and the system must withstand a force of 2000 N without damage [25]. Substituting the values into the calculation, the actual required pedal force is calculated as = 307.84 N, which satisfies the design requirements.
The assembly model of the braking system is shown in Figure 3. It features an independent dual-circuit layout for the front and rear axles, with each axle equipped with a separate brake master cylinder. An ABS module is integrated in series within the system. To reduce the weight of the brake discs, weight-saving holes are uniformly distributed across the discs. The two brake master cylinders are arranged vertically to minimize the length of the front end. The brake pedal and accelerator pedal are mounted on a base with hinges, and the base is evenly fitted with multiple mounting holes. By adjusting the installation positions of the brake and accelerator pedals, the system accommodates drivers of different heights, ensuring ergonomic comfort.
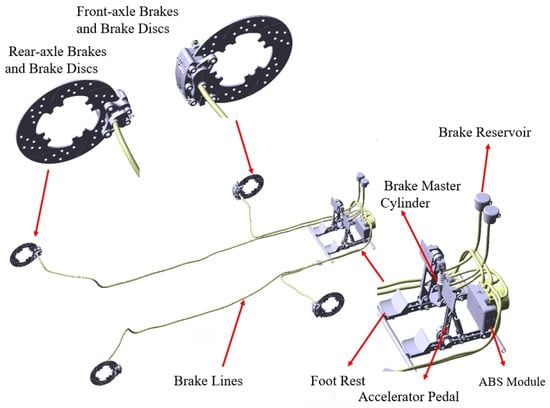
Figure 3.
Braking System Assembly.
3. Braking Force Distribution Coefficient Optimization
3.1. PID Control Algorithm
PID control is widely used in industrial automation due to its straightforward algorithm, strong robustness, and high reliability. Typical applications include vehicle dynamics control, precision hovering of unmanned aerial vehicles, and robotic motion systems. The PID controller employs proportional (P), integral (I), and derivative (D) actions to achieve rapid and stable adjustment of system deviations. Its basic structure is illustrated in Figure 4. The PID control algorithm takes the error between the ideal and actual slip ratios as input. The corrective braking pressure caused by this deviation is converted into the vehicle’s braking torque, providing high-precision closed-loop control of the slip ratio. This ensures that, during braking, the slip ratio remains stable and closely tracks the desired value.
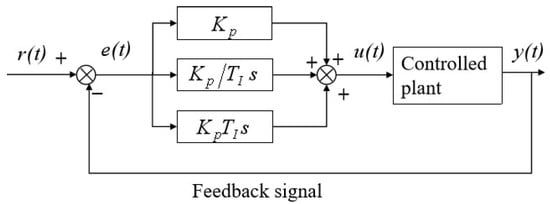
Figure 4.
PID Controller Schematic Diagram.
In the diagram, represents the system target value; denotes the control deviation, where , and is the output of the controlled object. The mathematical expression of the PID control law is:
where , , and represent the proportional, integral, and derivative coefficients, respectively. In practical systems, systematic tuning of these three parameters is essential for achieving optimal control performance.
PID parameter tuning methods commonly used in engineering can be broadly categorized into theoretical calculation-based tuning and empirical engineering tuning. Due to the significant nonlinearities and uncertainties inherent in brake-by-wire systems, this study combines both approaches and adopts the empirical engineering tuning method for parameter finalization [26], as it offers greater applicability and ease of implementation.
3.2. Establishment of CarSim-Simulink Co-Simulation Model
This study uses the deviation between the actual and target slip rates of the front wheels as input to the PID controller, dynamically adjusting the braking force distribution coefficient β through real-time computation. During braking, the system calculates the total required braking force for the vehicle based on the established pedal travel-to-target deceleration mapping. Using the distribution coefficient β, the braking torques for the front and rear axles are computed and input into CarSim for co-simulation. Simultaneously, the four-wheel speeds and vehicle speed output by CarSim are fed back into the slip rate calculation module, completing the closed-loop control system.
To validate the effectiveness of the braking force distribution strategy under straight-line driving conditions, a CarSim-Simulink co-simulation platform was developed (Figure 5). The platform adopts a modular architecture: CarSim is responsible for high-fidelity vehicle dynamics modeling, incorporating key parameters such as mass distribution, suspension K&C characteristics, and tire properties, while solving the vehicle’s six-degree-of-freedom motion states in real time. Simulink, on the other hand, builds the control model for the brake-by-wire system, enabling bidirectional data exchange via an S-function interface. In this system, CarSim receives the braking torques of the four wheel cylinders as input and outputs key dynamic parameters, including longitudinal acceleration and wheel speeds, through virtual sensors. The data exchange step size between CarSim and Simulink is set to 0.0005 s, with a sampling frequency of 2000 Hz. This high-frequency data exchange improves the stability and accuracy of the control system simulations. The small step size ensures the control algorithm operates with high temporal resolution, minimizing delays and enhancing the responsiveness of the braking force distribution strategy. This ultimately contributes to maintaining controller stability, particularly during dynamic braking conditions.
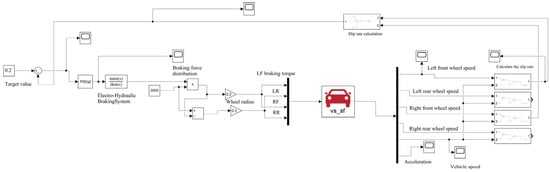
Figure 5.
Co-simulation Model.
The transmission mechanism and brake components of the vehicle braking system were modeled separately. As the core element of the transmission mechanism, the hydraulic system receives control signals via solenoid valves and regulates braking pressure based on the current magnitude. Due to the complexity of the hydraulic braking system, several factors, such as hysteresis effects in hydraulic transmission and the nonlinearities of solenoid valve springs, are neglected for the purpose of simplifying the analysis. The system is represented by a model consisting of a first-order inertial element (which captures the dynamics of the solenoid valve) connected in series with an integral element [27]. The solenoid valve receives control commands and adjusts the braking pressure, while the integral element represents the dynamic response characteristics of the system. The transfer function G(s) is given by:
where tr is the time constant of the system, and K is the proportional coefficient. The solenoid valve response time tr is set to 0.005 s, as its response time does not exceed 5 ms, and the proportional coefficient K is defined as 100.
The brake model describes the relationship between hydraulic pressure and braking torque. Neglecting environmental interference and thermal decay effects, the brake is considered an ideal component, and its theoretical output braking torque is given by:
where P is the brake pressure, and Kd is the brake factor. It is defined that Md > 0 represents driving torque, while Md < 0 represents braking torque.
In CarSim, parameters such as the vehicle’s mass, center of gravity height, wheelbase, track width, and suspension type were configured. The established vehicle model is shown in Figure 6. The moments of inertia of the vehicle are 36 kg·m2, 83.24 kg·m2, and 47.15 kg·m2 about the X, Y, and Z axes, respectively.
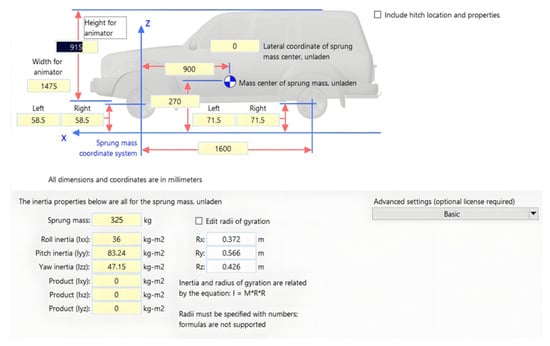
Figure 6.
CarSim Vehicle Modeling.
To establish the relationship between wheel slip rate and road adhesion coefficient, tire modeling is essential. Common modeling approaches include physics-based models and empirical formula-based models. In the context of racing car braking force distribution research, widely used models include the Burckhardt model, the Magic Formula, and the bilinear model. Among these, the Magic Formula tire model is the most commonly used due to its high accuracy and strong applicability [28,29]. Its expression is as follows:
In the Magic Formula tire model, represents the longitudinal adhesion coefficient of the tire, and denotes the adhesion coefficient during wheel rolling, which is generally set to 0. The parameters A, B, C, and D are fitting coefficients that depend on road conditions, while s represents the slip ratio. The specific values for these parameters are as follows: Peak Factor A = 1.4, Shape Factor B = 1.8, Stiffness Factor C = 1.0, and Curvature Factor D = 0.5.
Figure 7 illustrates the characteristic curves of longitudinal force versus slip ratio for racing slick tires under varying loads, with a tire pressure of 100 kPa and a camber angle of 0°. These curves serve as the foundational tire mechanical model for both the brake system design and the validation of control strategies.
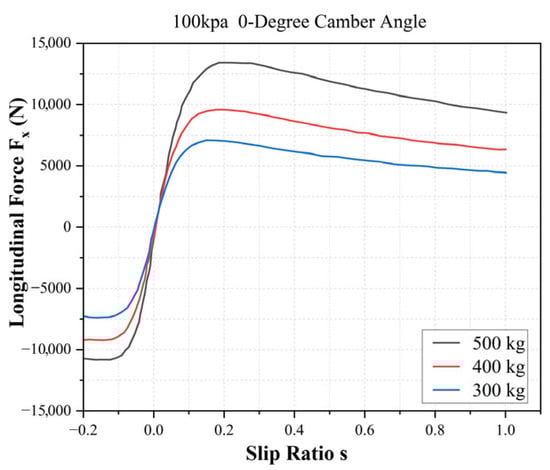
Figure 7.
Variation in Tire Longitudinal Force with Slip Ratio.
4. Simulation and Experimental Results Analysis
4.1. Simulation Results
A control model built in Simulink was co-simulated with CarSim, with the vehicle performing an emergency braking maneuver on a straight road at an initial speed of 100 km/h. Figure 8 shows a 3D animation snapshot of the braking process, where the blue car represents the racing vehicle with dynamic braking force distribution (denoted as BBW), and the purple car represents the vehicle with fixed braking force distribution (denoted as No-EBD). The simulation results demonstrate that adopting the PID-based braking force distribution strategy significantly improves the racing car’s braking performance. As shown in the braking distance versus time curve in Figure 9, the BBW racing car achieves a braking distance of 28.3 m, which is 2.2 m shorter than the No-EBD racing car, representing a 7.7% reduction in braking distance.
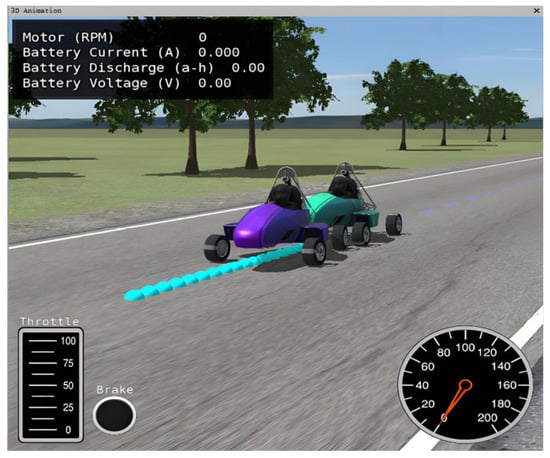
Figure 8.
Three-dimensional Animation of Braking Process.
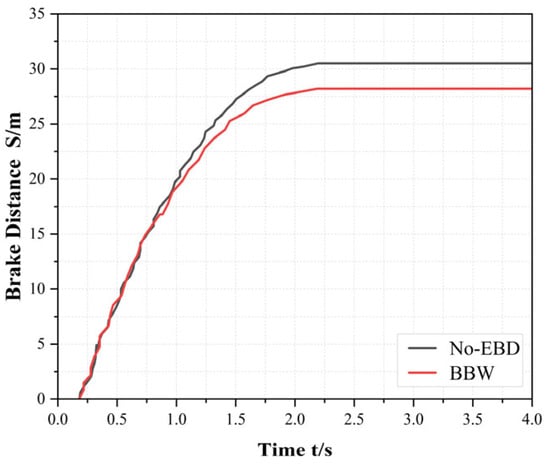
Figure 9.
Braking Distance vs. Time Relationship.
The comparison of vehicle speed and wheel deceleration for the two cars is shown in Figure 10. From the graph, it can be observed that, during the braking deceleration phase, the curves of both vehicles are nearly identical. The BBW-equipped vehicle’s braking deceleration reaches −13.5 m/s2 at 0.6 s and remains relatively constant until the vehicle approaches a stop. In contrast, the maximum braking deceleration of the No-EBD vehicle is −8.5 m/s2. The BBW-equipped vehicle reduces its speed more quickly. At around 1.5 s, the No-EBD vehicle experiences wheel lock-up at both the front and rear axles, and the braking deceleration drops to −6 m/s2, indicating an unstable condition.
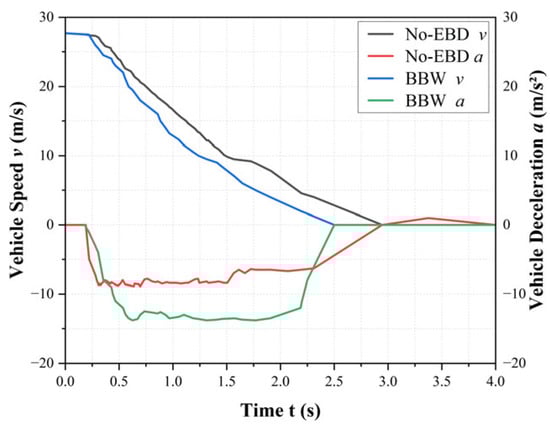
Figure 10.
Velocity and Acceleration vs. Time Relationship.
Figure 11 illustrates the variation in the vehicle roll angle over time during braking. Due to the straight-line braking, between 1.2 and 2.2 s, the roll angle of the No-EBD vehicle changes from 0.28° to −0.24°, with minimal lateral displacement of the center of gravity. The BBW-equipped vehicle has a maximum roll angle of 0.03°, with a much more limited fluctuation range, indicating better and more stable control of rotational motion around the vertical axis during braking. The small roll angles of both vehicles can be attributed to the reasonable stiffness of the suspension springs, the inclusion of high-performance anti-roll bars, and the low center of gravity [30].
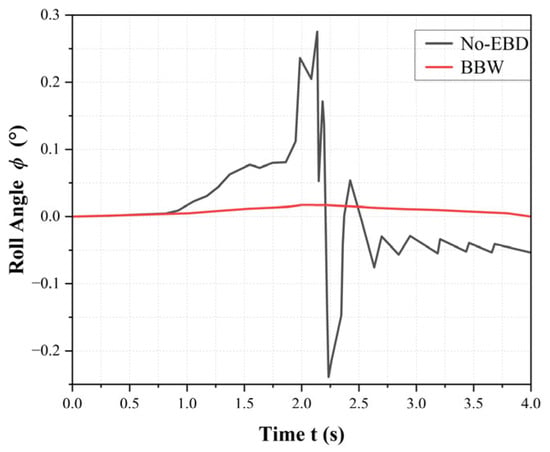
Figure 11.
Vehicle Roll Angle vs. Time.
As shown by the yaw angle variation curve in Figure 12, the No-EBD vehicle exhibits a linearly increasing yaw angle, reaching a maximum of 9.5°, indicating significant vehicle sideslip. In contrast, the BBW-equipped vehicle maintains consistently lower yaw angles with gradual changes, demonstrating more stable attitude control and effectively reducing the risks of skidding and fishtailing. These results clearly highlight the advantages of the BBW system in dynamic braking force distribution, emphasizing its substantial contribution to improving overall vehicle braking stability.
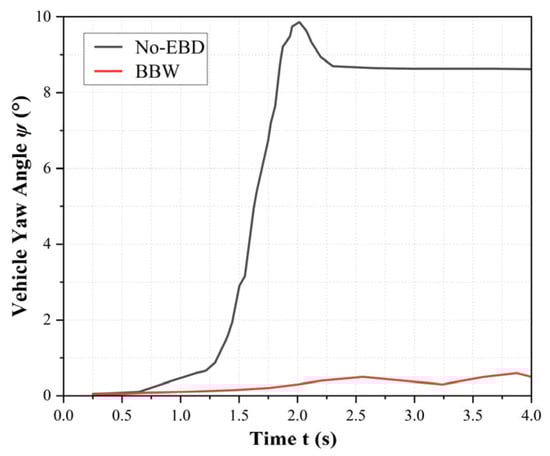
Figure 12.
Vehicle Yaw Angle vs. Time.
4.2. Experimental Verification
The braking force distribution strategy was validated using the electric Formula racing car developed by Yancheng Institute of Technology as the test platform. The vehicle features a dual master cylinder design, with four-piston brake calipers (model RS Racing RS4) on the front wheels and two-piston brake calipers (model RS Racing RS2) on the rear wheels, integrated with an MKC200 ABS assembly (Figure 13). During testing, the reference timing was established from the moment the driver first engaged the brake pedal. Considering the use of slick tires on the racing car, a pre-test warm-up was conducted to bring the tires to their optimal operating temperature. The ambient temperature was 35 °C, tire pressure was 1.1 bar at a gas temperature of 90 °C, and tread temperature was 70 °C. The test was conducted on a dry asphalt road surface with a friction coefficient of 0.9. Data was collected using a SIRIUS I-ACC8 system with a sampling frequency of 200 kHz per channel. The sensors used had an accuracy within ±0.5%.
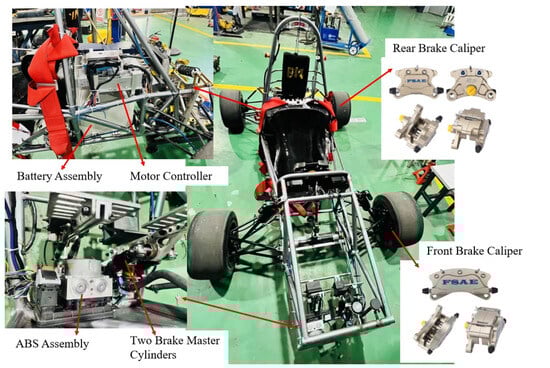
Figure 13.
Test Vehicle.
Figure 14 illustrates the brake pressure build-up process during emergency braking at an initial speed of 100 km/h. A pressure delay of approximately 0.55 s is observed, primarily due to the initial clearance elimination between the brake master cylinder and the pedal, as well as the time required for brake fluid to fill the hydraulic pipeline gaps. During braking, the front axle pressure is regulated within the range of 3–5 MPa, while the rear axle pressure varies between 1.5–2.5 MPa. The average rear axle pressure is about 1.6 MPa lower than that of the front axle. This pressure difference is actively controlled by the ABS, which suppresses rear axle braking force to prevent premature rear wheel lock-up and ensure vehicle stability during braking.
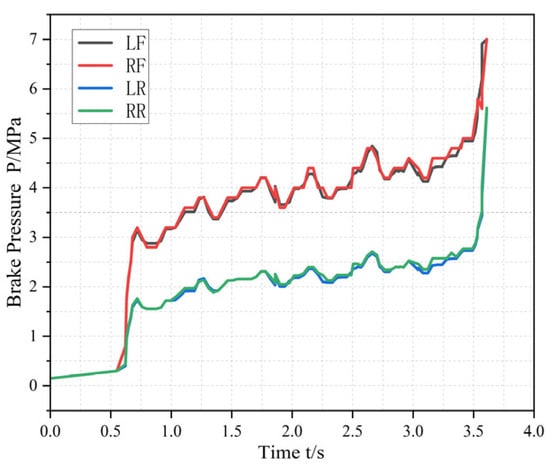
Figure 14.
Brake Pressure Build-up Process.
The pressure oscillations are relatively small and smooth, as expected for a well-calibrated brake system. This smoothness can be attributed to the inherent signal filtering and damping effects in the brake system, along with the ABS control mechanism that stabilizes pressure fluctuations during braking. While the high sampling frequency of the data acquisition system (200 kHz per channel) ensures precise capture of the pressure build-up, it does not directly cause the smoothness of the pressure curve. Instead, the ABS works to maintain uniform braking force and ensure that both front and rear wheels trigger ABS control almost simultaneously, contributing to the uniformity of the pressure buildup.
The experimental vehicle and the simulation model use the same PID control parameters. A comparison between the experimental and simulated braking distances (Figure 15) reveals the following: at an initial speed of 100 km/h, the measured braking distance is 30 m, which is 1.7 m longer than the simulated value, with a relative deviation of 5.6%. At an initial speed of 70 km/h, the measured braking distance is 13.75 m, exceeding the simulation result by 1.25 m, with a relative deviation of 9%. During testing, due to brake pressure delay, the experimental curve does not start at the same point as the simulation curve. The overall longer braking distances in the experiments can be attributed to several factors: first, the brake discs and friction pads of the test vehicle have experienced some wear; second, the test road surface may have local variations in the adhesion coefficient or slight slopes; and third, the additional test equipment on the vehicle increases its total mass, requiring more braking force and resulting in longer stopping distances.
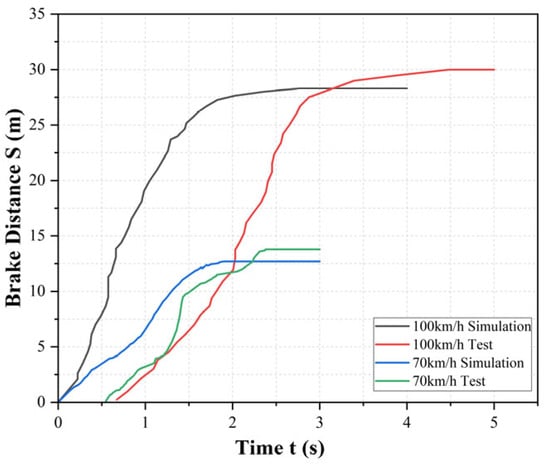
Figure 15.
Braking Distance: Simulation vs. Experimental Curves.
As depicted in Figure 16, which shows the variations in vehicle speed and wheel speed, the PID-based braking force distribution control strategy enables the ABS to precisely regulate the braking pressure at each wheel based on the vehicle’s dynamics, braking safety requirements, and tire adhesion limits. During braking, the rear wheel speeds are consistently maintained slightly higher than the front wheel speeds, effectively preventing instability phenomena such as fishtailing caused by rear wheel lock-up occurring before the front wheels. The experimental vehicle’s speed variation trend closely matches the curve shown in Figure 10.
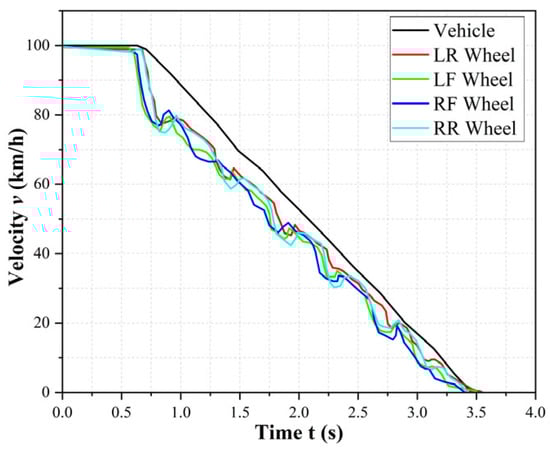
Figure 16.
Vehicle Speed and Wheel Speed Curves.
From the slip ratio variation curves in Figure 17, it can be observed that the slip ratio curves of all four wheels essentially overlap. During braking, the slip ratios of the four wheels quickly converge to the ideal range of 0.12 to 0.2. This indicates that the ABS effectively achieves a balanced distribution and regulation of braking forces across all wheels. As a result, the vehicle maintains a stable attitude during braking, with no significant imbalance in braking force distribution between the left-right sides or front-rear axles. At lower vehicle speeds, the slip ratio fluctuation range is wider; however, once the vehicle comes to a smooth stop, the wheels synchronize with the vehicle and come to rest, resulting in a slip ratio of 1.
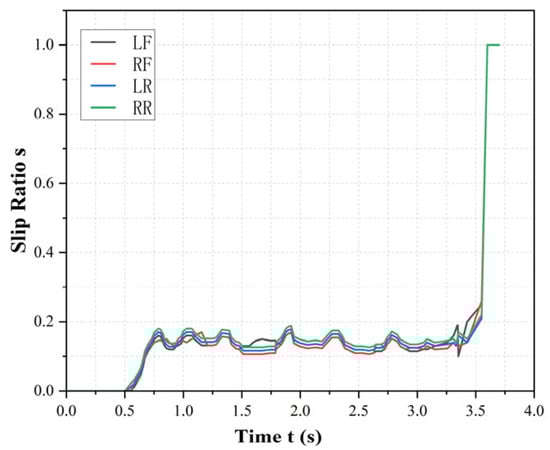
Figure 17.
Slip Ratio Variation Curves.
These results demonstrate that the proposed control strategy not only improves braking efficiency but also enhances vehicle stability, providing a solid foundation for future development in brake-by-wire systems for high-performance electric vehicles.
5. Conclusions
This study presents a PID algorithm-based brake-by-wire braking force distribution strategy for Formula Student electric racing cars, addressing the limitations of traditional fixed-ratio distribution in adapting to dynamic braking conditions and enhancing overall braking performance and vehicle stability.
The theoretical design of the braking system and key component selection were first completed based on vehicle parameters, establishing the ideal braking force distribution curve (I-curve) and specifying core components such as the brake master cylinder and wheel cylinders. Building on this foundation, a classic PID control algorithm was implemented, using the target slip ratio as the control objective to dynamically adjust the front-rear axle braking force distribution coefficient β in real time. The strategy was systematically validated via a CarSim–Simulink co-simulation platform.
Both simulation and experimental results demonstrate:
- (1)
- Enhanced braking efficiency: Under emergency braking from 100 km/h, the PID dynamic distribution strategy reduced the simulated braking distance by 7.7% compared to the fixed distribution strategy, indicating improved active safety.
- (2)
- Improved vehicle stability: The PID-controlled vehicle exhibited significantly reduced roll and yaw angle fluctuations during braking, effectively suppressing deviation and fishtailing, confirming enhanced directional stability.
- (3)
- Control strategy effectiveness and reliability: Experimental results showed closely overlapping slip ratio curves for all wheels, with the system maintaining a front-rear axle pressure difference of approximately 1.6 MPa in response to load transfer, preventing premature rear wheel lock-up. This validates the PID controller’s dynamic response and robustness, enabling near-ideal braking force distribution.
These findings confirm that the proposed PID-based brake-by-wire braking force distribution strategy effectively improves braking efficiency and driving stability for FSAE racing cars, offering significant theoretical insights and practical engineering value.
Author Contributions
Conceptualization, Y.H. and J.L.; methodology, Y.P.; validation, Z.Z.; writing—original draft preparation, Y.P. and J.L.; writing—review and editing, J.L. All authors have read and agreed to the published version of the manuscript.
Funding
This work was financially supported by the Laboratory Construction Fund of Yancheng Institute of Technology (Grant Number 1129703).
Data Availability Statement
Data will be made available upon request.
Acknowledgments
All authors have read and agreed to the published version of the manuscript. The authors would like to thank the anonymous reviewers for their valuable comments and suggestions.
Conflicts of Interest
The authors declare no conflicts of interest.
References
- Atia, M.R.A.; Haggag, S.A.; Kamal, A.M.M. Enhanced Electromechanical Brake-by-Wire System Using Sliding Mode Controller. J. Dyn. Syst. Meas. Control-Trans. ASME 2016, 138, 041003. [Google Scholar] [CrossRef]
- Todeschini, F.; Corno, M.; Panzani, G.; Fiorenti, S.; Savaresi, S.M. Adaptive Cascade Control of a Brake-By-Wire Actuator for Sport Motorcycles. IEEE-ASME Trans. Mechatron. 2015, 20, 1310–1319. [Google Scholar] [CrossRef]
- Zhang, L.; Wang, Q.; Chen, J.; Wang, Z.P.; Li, S.H. Brake-by-wire system for passenger cars: A review of structure, control, key technologies, and application in X-by-wire chassis. Etransportation 2023, 18, 100292. [Google Scholar] [CrossRef]
- Da Silva, P.H.M.; Idehara, S.J. Characterization of the brake system of a Formula SAE vehicle (Conference Paper). In Proceedings of the 2018 SAE Brasil Congress & Exhibition, São Paulo, Brazil, 3–5 September 2018. SAE Technical Papers. [Google Scholar]
- Gupta, E.; Bora, D.K.S.; Rammohan, A. Design and analysis of brake system for FSAE race car. Eng. Res. Express 2022, 4, 110–115. [Google Scholar] [CrossRef]
- Stauch, R.; Bog, J.; Grabant, S.; Konig, R.; Traub, D. Analysis of the cooling concept of the braking system of a formula student racing car using cfd simulation and 1d simulation. Defect Diffus. Forum 2021, 412, 115–129. [Google Scholar] [CrossRef]
- Zheng, Z.A.; Liang, C. Research on particle swarm optimization algorithm of electromechanical hybrid braking control strategy based on road surface recognition. Energy Sources Part A-Recovery Util. Environ. Eff. 2022, 47, 2027580. [Google Scholar] [CrossRef]
- Huang, G.Z.; Li, W.Z.; Gao, X.H.; Xiao, L.Y.; Yan, W.; Dong, H.L. Advancing the Regenerative Braking Systems of New Energy Vehicles: A Comprehensive State-of-the-Art Review. Int. J. Energy Res. 2025, 2025, 3460776. [Google Scholar]
- Liu, J.J.; Xu, H.L.; Luo, T.Q.; Yao, Y.F.; Han, W.B. Model-based fault detection for an electrohydraulic braking system with cooperative regenerative braking management. Proc. Inst. Mech. Eng. Part D-J. Automob. Eng. 2025, 09544070251323331. [Google Scholar] [CrossRef]
- Yang, Y.; He, Y.D.; Yang, Z.; Fu, C.Y.; Cong, Z.P. Torque Coordination Control of an Electro-Hydraulic Composite Brake System During Mode Switching Based on Braking Intention. Energies 2020, 13, 2031. [Google Scholar] [CrossRef]
- Li, J.; Wang, C.; Zhang, J.-X. Wheel slip tracking control of vehicle based on adaptive fast terminal sliding mode control method. J. Zhejiang Univ. (Eng. Sci.) 2021, 55, 169–176. [Google Scholar]
- Liu, J.A.; Bu, L.; Fu, B.; Zheng, J.; Wang, G.; He, L.; Hu, Y. Research on Adaptive Distribution Control Strategy of Braking Force for Pure Electric Vehicles. Processes 2023, 11, 1152. [Google Scholar] [CrossRef]
- Zhang, R.J.; Zhao, W.Z.; Wang, C.Y. Research on Coordinated Control of Braking Mode Switching for Enhancing Switching Quality Considering Communication Delay and Time-Varying Model Parameters. IEEE Trans. Intell. Veh. 2023, 8, 2494–2513. [Google Scholar] [CrossRef]
- Asiabar, A.N.; Kazemi, R. A direct yaw moment controller for a four in-wheel motor drive electric vehicle using adaptive sliding mode control. Proc. Inst. Mech. Eng. Part K-J. Multi-Body Dyn. 2019, 233, 549–567. [Google Scholar] [CrossRef]
- Sun, X.Q.; Wang, Y.J.; Cai, Y.F.; Wong, P.K.; Chen, L. An Adaptive Nonsingular Fast Terminal Sliding Mode Control for Yaw Stability Control of Bus Based on STI Tire Model. Chin. J. Mech. Eng. 2021, 34, 1–14. [Google Scholar] [CrossRef]
- Zhou, S.W.; Liu, J.S.; Wang, Z.L.; Sun, S.H. Research on Design Optimization and Simulation of Regenerative Braking Control Strategy for Pure Electric Vehicle Based on EMB Systems. Trans. FAMENA 2023, 47, 33–49. [Google Scholar] [CrossRef]
- Wan, J.H.; Ding, J.X. Study on the influence and optimization of blend braking strategy of train at gradient change point. J. Vib. Control 2025, 10775463251343328. [Google Scholar] [CrossRef]
- Zhisheng, Y. Theory of Automobile; China Machine Press: Beijing, China, 2018. [Google Scholar]
- Jian, W.; Haiying, L. Formula E Racing Design for College Students; Beijing Institute of Technology Press: Beijing, China, 2022. [Google Scholar]
- Kelly, D.P.; Sharp, R.S. Time-optimal control of the race car: Influence of a thermodynamic tyre model. Veh. Syst. Dyn. 2012, 50, 641–662. [Google Scholar] [CrossRef]
- Fujimoto, H.; Harada, S. Model-Based Range Extension Control System for Electric Vehicles with Front and Rear Driving-Braking Force Distributions. IEEE Trans. Ind. Electron. 2015, 62, 3245–3254. [Google Scholar] [CrossRef]
- Milliken, D.L. Race Car Vehicle Dynamics: Problems, Answers and Experiments; SAE International: Warrendale, PA, USA, 2003. [Google Scholar]
- Wheatley, G.; Zaeimi, M. On the design of a wheel assembly for a race car. Results Eng. 2021, 11, 100244. [Google Scholar] [CrossRef]
- Rigo, C.S.S.; Neto, A.D.R.D.F.; Grandinetti, F.J.; Castro, T.S.; Dias, E.X.; Martins, M.S. Development of the Steering System for a Formula SAE Prototype. In Proceedings of the 31st SAE BRASIL International Mobility Technology Congress and Exhibition, BRASILCONG 2024, Sao Paolo, Brazil, 16–17 October 2024; SAE International: Warrendale, PA, USA, 2024. [Google Scholar]
- Mohd, U.; Singhal, G. Design and Analysis of Braking System for FSAE. Int. J. Sci. Res. Dev. 2018, 6, 1877–1881. [Google Scholar]
- Zhang, Z.S.; Ma, R.H.; Wang, L.F.; Zhang, J.Z. Novel PMSM Control for Anti-Lock Braking Considering Transmission Properties of the Electric Vehicle. IEEE Trans. Veh. Technol. 2018, 67, 10378–10386. [Google Scholar] [CrossRef]
- Chuang, T.; He, H.; Lan, Y.; Tao, G.; Huifeng, W. Improved Aquila algorithm to optimize fuzzy PID control of vehicle ABS. J. Zhejiang Univ. (Eng. Sci.) 2025, 59, 1462–1470. [Google Scholar]
- Peitzmeier, F.; Mockenhaupt, J.; Reith, D. Optimum Real Time Estimation and Interfacing of Braking Points for Racing Car. IEEE Trans. Veh. Technol. 2023, 72, 1710–1719. [Google Scholar] [CrossRef]
- Transi, T.; Pereirinha, P.G.; Bouscayrol, A.; Degano, M. Study of regenerative braking effects in a small electric race car using energetic macroscopic representation. In Proceedings of the 3rd International Young Engineers Forum, YEF-ECE 2019, Caparica, Portugal, 10 May 2019; Institute of Electrical and Electronics Engineers Inc.: Piscataway, NJ, USA, 2019; pp. 106–111. [Google Scholar]
- Nam, K.; Oh, S.; Fujimoto, H.; Hori, Y. Estimation of Sideslip and Roll Angles of Electric Vehicles Using Lateral Tire Force Sensors Through RLS and Kalman Filter Approaches. IEEE Trans. Ind. Electron. 2013, 60, 988–1000. [Google Scholar] [CrossRef]


Disclaimer/Publisher’s Note: The statements, opinions and data contained in all publications are solely those of the individual author(s) and contributor(s) and not of MDPI and/or the editor(s). MDPI and/or the editor(s) disclaim responsibility for any injury to people or property resulting from any ideas, methods, instructions or products referred to in the content. |
© 2025 by the authors. Published by MDPI on behalf of the World Electric Vehicle Association. Licensee MDPI, Basel, Switzerland. This article is an open access article distributed under the terms and conditions of the Creative Commons Attribution (CC BY) license (https://creativecommons.org/licenses/by/4.0/).