Abstract
OpenStreetMap (OSM) is a recent emerging area in computational science. There are several unexplored issues in the quality assessment of OSM. Firstly, researchers are using various established assessment methods by comparing OSM with authoritative dataset. However, these methods are unsuitable to assess OSM data quality in the case of the non-availability of authoritative data. In such a scenario, the intrinsic quality indicators can be used to assess the quality. Secondly, a framework for data assessment specific to different geographic information system (GIS) domains is not available. In this light, the current study presents an extension of the Quantum GIS (QGIS) processing toolbox by using existing functionalities and writing new scripts to handle spatial data. This would enable researchers to assess the completeness of spatial data using intrinsic indicators. The study also proposed a heuristic approach to test the road navigability of OSM data. The developed models are applied on Punjab (India) OSM data. The results suggest that the OSM project in Punjab (India) is progressing at a slow peace, and contributors’ motivation is required to enhance the fitness of data. It is concluded that the scripts developed to provide an intuitive method to assess the OSM data based on quality indicators can be easily utilized for evaluating the fitness-of-use of the data of any region.
1. Introduction
Volunteered geographic information (VGI) offers an intuitive method for the collection of geographic information (GI) through volunteering at a very low cost [1,2,3,4,5]. Probably one of the best-known example of VGI is the OSM project, contributed by users of varying mapping experiences [6]. This has become possible due to the availability of geo-location devices and more user-friendly software. The major driving forces behind the establishment and growth of OSM are restrictions on use, non-availability of data by various map providers, a high cost of procurement and the recency of data. Further, the OSM data are available under an Open Data Commons Open Database license (ODbL) for reuse, which allows for sharing, creation and adapting of the data unless reuse is attributed [7]. OSM has encouraged 3,581,079 enthusiastic contributors across the globe to create 3,802,465,092 nodes, 401,428,744 ways and 4,885,160 relations [8]. It uses a topological data structure (XML format) that contains a block of nodes, ways and relations to represent spatial features. Further, it contains tags (key-value pairs) for storing metadata about features.
The OSM project produces a huge amount of labeled geographical data contributed by users. However, the data suffer from significant limitations that come naturally with VGI data. The first and foremost reason is uncertainty about the data availability i.e., when, which, how, from where and how much data will be contributed [9,10,11,12]. This is normally defined as the contribution patterns and contributor’s motive. Further, no knowledge about the contributors, their skills and motivation augments heterogeneous quality. Furthermore, the lack of unified standards and no top-down quality assurance model provides the risk that the contributed data often have a certain degree of error [13]. In addition, OSM provides an open classification tagging scheme (key-value pairs) that can lead to misclassification and reduction in data quality [14]. The issue of vandalism and data imputation further deepens the quality concern. Moreover, the lack of clarity in license terms and its definitions also deters organizations from incorporating VGI into their datasets. This is due to the lack of longitudinal research on legal aspects of utilizing VGI datasets [15]. These issues have raised a deep concern about the quality, reliability and fitness of data for GI application domains [16,17,18,19,20]. Many of these issues have been discussed in the vast literature. It is concluded that being affected by many limitations, VGI data are still reasonably credible [1]. Hence, for creating trust in OSM, the data need to be assessed. Various established quality standards (http://ncl.sbs.ohio-state.edu/ica/3_spatial.html, accessed on 13 September 2016) exist for assessment of data, but ISO TC211 [21] is primarily responsible for drafting international standards for quality assessment procedures. The data quality indicators identified by TC211 for the assessment of spatial data are completeness, logical or topological consistency, positional accuracy, semantic accuracy, attribute accuracy, temporal accuracy and lineage, which have been used in various studies [18,21,22,23,24,25]. For spatial data quality grading of OSM, all of these elements must be carefully assessed [4,26].
The lack of a suitable quality evaluation framework renders problems for potential users to assess OSM data [6,13]. The established quality evaluation procedures demand authoritative data to evaluate VGI. The latter case is not always possible because acquiring authoritative data is not an easy task. This may be due to non-availability of data, licensing terms and the high cost of acquiring the data [5]. It is suggested that under such a scenario, the existing quality measures become unsuitable for assessment [4,14]. Thus, for the analysis of VGI data in the case of the scarcity of authoritative dataset, researchers tend to identify intrinsic quality indicators, such as the development of nodes, contributors and their behavior [6,27,28,29,30] by considering the ‘Linus law’ as a benchmark [6].
In the spirit to fill in the research gap, the current study has extended the capabilities of the processing toolbox of QGIS in alignment with previous researchers [19,26,31]. The intrinsic indicators used in this study are network length completeness, attribute completeness, semantic accuracy and heuristic indicator to assess route navigability. The model developed utilizes the scripts developed in Python binding for QGIS (PYQGIS) and are simply plug-and-play workflows. For the demonstration of the developed models, a case study of the Punjab, India, OSM dataset has been assessed using intrinsic quality indicators, and the results are presented.
The paper is divided into six sections. The next section discusses the data quality parameters and related research work. Data preparation, the methodology to develop and extend QGIS processing toolbox by developing PYQGIS scripts, is described in the third section. The fourth section elaborates the results obtained from different models, and the limitations of the current study are discussed in the fifth section. The conclusions drawn from findings of the study are provided in the last section.
2. Data Quality Parameters and Related Work in OSM
The quality issue in VGI data is a clear challenge. Rigorous and longitudinal studies are required for creating trust in OSM data. There have been numerous research studies in recent years. Figure 1 presents the data of 485 papers collected from various bibliographic databases, such as the IEEExplore, Springer, MDPI, Mendeley and Zotero repositories. A review of these articles shows that many of them reported on the assessment of OSM data. In these studies, the quality of data has been judged based on the context of their application, which is a function of intangible properties represented using quality indicators [32,33]. Quantitative dimensions shared with GI review the completeness, logical consistency, positional, temporal and semantic consistency. Non-quantitative dimensions review lineage, purpose, usage and constraints. Further, dimensions exclusive for VGI review the believability, compliance and convergence [34]. The following sections discuss the related work by researchers to assess the completeness, attribute accuracy and semantic accuracy using intrinsic data quality indicators.
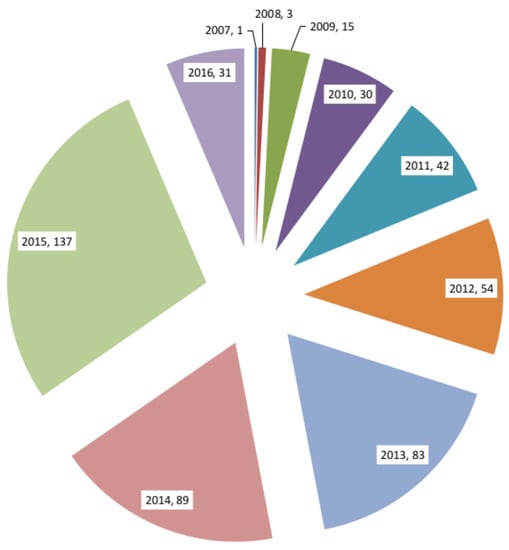
Figure 1.
Year-wise research publication data.
2.1. Completeness
The completeness of map data is the most important data quality element next to positional accuracy. Completeness of spatial data describes the existence of features [21,35,36,37] as compared to ground reality. Brassel et al. [35] have stated that the completeness of data focuses on the errors of omission and commission, whereas model completeness is an aspect of the fitness-of-use described under ‘semantic accuracy’ [38]. Further, completeness is divided into two parts: feature and attribute completeness [32,37]. Feature completeness presents the relative completeness of the percentage of features present in comparison to a reference dataset. Attribute completeness measures the relative completeness of attributes (e.g., the comparison of the road name in OSM to a reference dataset) in OSM and the reference dataset. Furthermore, the incompleteness of attributes has an impact on attribute accuracy, positional accuracy and logical consistency depending on their domains (geometric, topological, thematic, temporal, etc.).
For assessing the completeness, an established procedure is used to compare test data with reference data. The method requires external data that can be used as the ground truth, and for this reason, its measurement tends to be extrinsic. In this, the relative completeness of a road network is determined by calculating the total length of the roads of the test dataset within a predefined area and that is then compared to a reference dataset for the same area [39,40,41,42,43,44,45,46,47,48,49,50,51,52,53,54,55,56,57,58,59,60,61,62]. However, due to issues discussed earlier in Section 1, such comparisons are limited [18]. Therefore, suitable alternatives are necessary to assess completeness, based on intrinsic indicators, such as the OSM tags and their data’s history [6,63]. In the context of internal completeness quality analysis, Devillers et al. [64] have discussed meta-data and motivated developing and analyzing metadata [64,65]. Metadata in OSM are the count of tags, the current maximum version for each tag, etc. [29]. Further, information about contributors who upload and edit the map is also metadata. Researchers [6,27,39,40,66,67,68,69] have used various methods to assess the completeness of the OSM using various intrinsic indicators as discussed in Table 1.

Table 1.
Studies on intrinsic completeness assessment of OpenStreetMap (OSM) data.
2.2. Attribute Accuracy
Attribute accuracy describes the quality of quantitative attributes and the correctness of non-quantitative attributes [71]. The quantitative (or numeric) data can easily be compared, whereas qualitative (or text) data are more difficult to handle. The established metrics can be used to measure quantitative data. The non-quantitative attributes are not always rightly spelled or have abbreviations, especially in the OSM dataset, as contributors do not follow naming conventions. For measuring the similarity or lexicographical error between data, the text similarity approach is used. The results obtained for attribute accuracy are presented as the percentage correctness of numerical or text-based values associated with an attribute [34,46].
Various algorithms exist for text comparison, such as ‘Soundex’ and ‘Metaphone’. However, these need to be customized for different languages. The ‘Levenshtein’ algorithm [72] measures the similarity between two strings by calculating the least number of edits that is needed to modify one string to another [46,49,51,55,71]; whereas, ‘similar_text’ function is a much simpler and faster one, which returns the number of similar characters between the two strings [73]. Barron et al. [74] have assessed the attributes and quantitative information of data. A kappa index method [75,76] has been used to assess the quantitative attribute assessment based on the classification of classes in land use cover [57,62].
2.3. Semantic Accuracy
The semantic accuracy is the quality of spatial features and is described in accordance with the selected model [38]. This information is defined by features, their attributes, values and relationships between features. The quality assessment process of a dataset allows measuring the ‘distance’ between the data and the perceived reality. Here, distance implies both geometric distance and semantic distance. In OSM, the semantic accuracy of map entities is described through tags [1]. Further, the quality indicators for semantic accuracy can be categorized as data-centric, user-centric and context-centric [4].
The data-centric assessment is based on the extrinsic authoritative comparison and intrinsic assessment methods. Further, types of features and attributes of features are subjected to measure the semantic similarity [57,71,77]. Al-Bakri and Fairbairn [78] have performed semantic similarity for the possible integration ordnance survey (OS) and OSM project. Ballatore and Zipf [69] have presented a conceptual model to assess the data quality elements using intrinsic indicators. Further, Jilani et al. [79] have used a machine learning approach to assess the semantic quality of the London OSM dataset. The accuracy has been obtained by finding a relative number of correctly-predicted instances with the total number of actual instances. Mülligann et al. [80] have introduced the semantic similarity measure based on the changes in the history of OSM elements.
The user contribution-centric approach for assessing the semantic accuracy relies on the trusted contributors. Flanagin and Metzger [81] and Mooney and Corcoran [29] have identified and analyzed the motivations of contributors and their feature editing. Rehrl et al. [82] have elaborated the methods used by researchers to evaluate VGI data quality based on contributors’ motivations, experience, etc. There have been many studies that have examined the motivation of trusted individuals [2,48,83,84], but such studies are considered generic for evaluation. Further, Quattrone et al. [10] have presented the methodology to quantitatively measure the content bias in contributed data and maintenance efforts by the users to provide a deeper analysis of data. They have found that no content bias exists between two segments of users (power users and crowd users) for contribution, whereas significant geographic bias variation can occur with changes in culture. Quattrone et al. [11] have revealed that maintenance efforts of GI vary country-wise in terms of the spread of maintenance efforts, data, users involved, places of involvement and the motive that triggers users.
The third category to assess the semantic information is context-centric. It relies on the law of geography as discussed by Tobler [85] that “All things are related, but nearby things are more related than distant things”. For example, an off-ramp is required to depart from a freeway at a small angle in the direction of traffic flow, and freeways have strict limits for the radius of curvature based on design speed [1,80]. Further, the LinkedGeoData ontology represents information in the form of tree structures with objects being connected by relationships (e.g., ‘is_a’) [16,86,87]. OSMonto, an ontology-based tool, was designed for use in a navigation web service by Codescu et al. [88] for providing the context-centric assessment. Hopf et al. [89] have developed a methodology on the semantic assessment of prohibition signs in OSM data. Indeed, context-centric assessment rules are essential to provide an automated triage of a very large number of updates and corrections by contributors.
To summarize, researchers have used various established assessment methods by comparing OSM with authoritative datasets. However, very few studies have reported on the fitness-of-use of the dataset in developing countries [56,90,91,92,93] using established quality indicators. The established methods are unsuitable to assess OSM data quality in the case of the non-availability of authoritative data [14]. Hence, assessment through intrinsic quality indicators would certainly encourage researchers to have a deeper understanding of datasets. The recent developments of OSM have witnessed intrinsic quality indicators to assess the data using history files [29,69,74,94]. Three frameworks have been developed on these lines by Barron et al. [74], Ballatore and Zipf [69] and Rehrl and Gröchenig [94]. However, these frameworks suffer from various issues that pose a challenge before the researchers extend existing tools and identify more indicators to assess datasets. This study offers an extension to the processing toolbox of the QGIS framework for sufficiently assessing the data quality based on the intrinsic parameters by providing easy-to-use workflow models.
3. Methodology: Extending the Processing Toolbox
QGIS (Version 2.8.6) [95] is an open source GIS software and utilizes an object-oriented Python framework called the processing toolbox. This toolbox provides the ability to extend the capabilities of existing algorithms [96]. The PYQGIS bindings allow comfortable integration of Python code with Qtlibraries and eventually with QGIS. Further, the processing toolbox provides a graphical modeler for automating the complex workflow management of algorithms. The methodology used for the assessment of OSM data was developed in Python as processing scripts. These scripts were further used as components in the graphical modeler. The following section discusses the processing models developed to perform intrinsic quality assessment.
3.1. Network Length Completeness Model
As discussed in Section 2, the completeness of the data is vital to justify the fitness of data for various GI application domains. The network length assessment is an important intrinsic indicator to assess the completeness of road networks [31]. The processing model developed (Figure 2) requires two types of input: (1) the network graph; (2) the polygon layer of smaller regions with the region ID field. This model was used to calculate the length of roads class-wise as suggested by Graser et al. [31]. Firstly, the input graph was re-projected to a suitable coordinate system. Thereafter, the class-wise road network was extracted and presented to the “sum line lengths” processing algorithm to find road network statistics. OSM data contain many classes for “highway” tags (http://wiki.openstreetmap.org/wiki/India:Tags/Highway, accessed on 2 March 2017) with few classes representing links for connecting a higher order road from/to a lower order road. For example, trunk_link connects the trunk to/from the primary road. In the current study, for calculating the network length class-wise, the “links” were considered part of the same class of which they are represented, i.e., trunk_link would be considered as the same as trunk class [31].
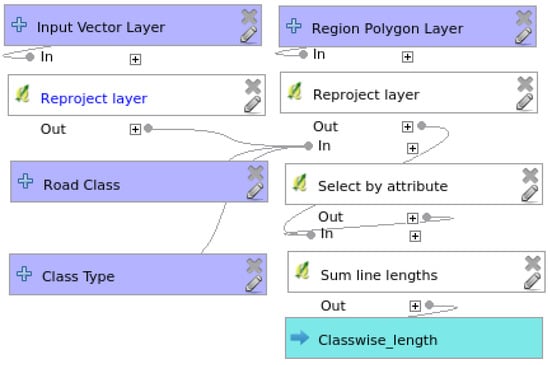
Figure 2.
Processing model for calculating the network length class-wise.
3.2. Attribute Completeness Model
OSM tags represent important information about the data. Hence, the assessment of OSM tags provides useful information about its fitness for various GI application domains. The processing model developed was used to assess the name tag, e.g., name of ways. Hence, the model was able to determine the attribute completeness (Figure 3) of input data [31]. This model used the “extract by attribute” processing algorithm to identify the features based on “expression”. Further, it classified the “field” in “expression” by the NULL or NOT NULL rule. The model took an input layer, a field to select the class, a road class as a text string, an expression to extract required features and the size of the vector grid and provided the sum of the length of features as the output. For example, to find the length of tertiary road class without a name, the expression passed would be (“name” IS NOT NULL).
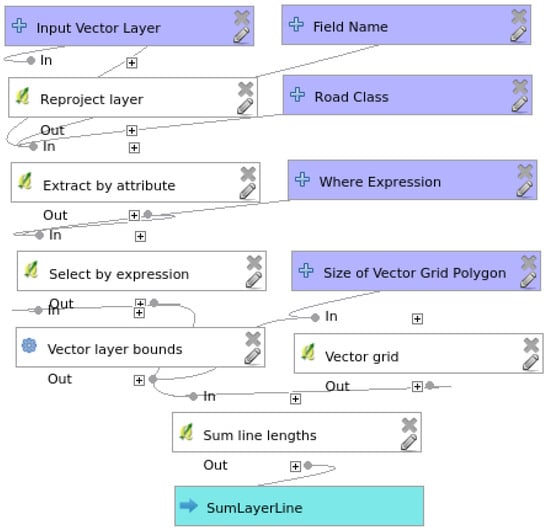
Figure 3.
Processing model to compute the class-wise length of features with “name” attributes.
3.3. Semantic Accuracy Assessment Model
The semantic accuracy of data for this current study was measured by assessing tags. The model was developed to analyze the user contribution patterns, e.g., the number of edits and the number of contributors, etc. A processing model (Figure 4) was developed based on intrinsic indicators [18,74] to answer the following questions:
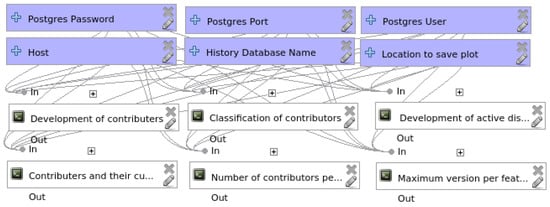
Figure 4.
Processing model for identifying user contribution using history data.
- How many contributors have made contributions to OSM data?
- What classes of contributors have edited the area under examination?
- How many distinct users have contributed chronologically to develop a feature?
- How has a feature developed over time, and what is its latest version number?
- How many distinct active contributors edited OSM data?
- Contributor-distribution of created OSM-features and OSM-feature-edits.
The history data used for assessment were prepared as discussed in Section 4.1. The model was developed for answering specific questions as outlined earlier. The Python script “development of contributors” was developed to find the number of contributors. This script read the history table of line features in the PostgreSQL database and identified and returned a list of contributors date-wise. The classification of contributors was done based on the number of edits made by them. Hence, the script provided more in-depth information about each user. The results were grouped by classifying three types of contributors: “senior-mappers”, “junior-mappers” and “non-recurring-mappers”, as suggested by Neis and Zipf [48]. The calculation was based on that these parameters may be prejudiced, as one mapper could be less active in a certain area while being very active in other areas. Thus, classification provided the rough estimate about the active members in the region. The script “contributors and their cumulated percentage of contributions” calculated the total amount and percentage of node-contributions by each contributor.
Another important indicator is the number of distinct users who have contributed in developing a feature. This indicator would provide the status of correctness (positional accuracy) of the feature as per Linus’s law. The script “number of contributors per feature” was developed to fetch each feature and listed all of the contributors that edited the respective feature. The latest edit was recorded with the date based on the timestamp. Further, the script “maximum version per feature” was added to the model for identifying the development of the feature over time and its valid maximum version. Mooney and Corcoran [29] and Haklay et al. [6] have suggested that the greater the number of edits per feature (at least 15 edits per feature), the better would be the accuracy of that feature. Hence, this script certainly helped with identifying the number of more complete and correct features lists.
3.4. Route Navigability Assessment Model
The route navigability assessment model (Figure 5) was developed to assess road network feature completeness by comparing point-to-point distances with actual OSM routing distance based on the heuristic method. This method depends on a sanity check that the routing distance length along a road network should never be shorter than the shortest distance between the two points. Hence, this approach was used to compare the relative difference in the shortest map distances from direct distances between the given origin-destination point pair. The shortest routing function was designed using inbuilt functions of pgRouting (http://pgrouting.org, accessed on 10 October 2016) (Version 2.2.3). In the current study, the geo-location of each random point was obtained by the geocoding plugin in QGIS. The origin-destination points table was used as the potential start and end points for calculating the shortest path routes. Further, it is possible that random points fetched may not be connected to the roads or on the roads. Hence, the KNN function from PostGIS (http://postgis.net, accessed on 10 October 2016) was used to select the nearest navigable point on the road dataset.
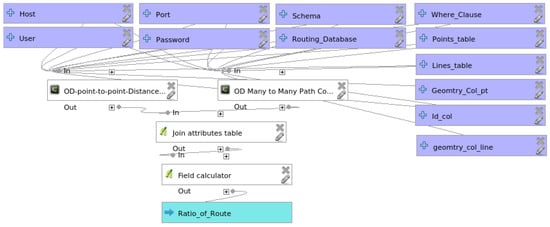
Figure 5.
The route navigability assessment model contains two submodels: “point-to-point direct distance model” and “origin-destination routable shortest distance model”.
This model (Figure 5) took two inputs: (1) routable graph; (2) points (origin-destination) data table. The first component created a matrix of origin-destination direct distances using the haversine algorithm; whereas, the second component created a matrix for the shortest routable distances between origin-destination points data using the Dijkstra algorithm. The outcomes of the point-to-point and shortest distance algorithm were given to the “joining attribute table” processing algorithm, for joining these tables based on the common parameter. Further, a field calculator was used to find the ratio of the shortest distance and point-to-point distance. The last component, based on the heuristic parameter, calculated the number of non-navigable routes due to the error of omission or incompleteness.
4. Case Study of Punjab OSM Data
This section elaborates the application of developed models, discussed in Section 3, to assess OSM data of Punjab (India) based on intrinsic quality indicators.
4.1. Data Preparation and Tools
During this study, two types of datasets were used: (1) history dump; (2) routing network data. The repositories were explored by downloading the required data, i.e., history planet dump (http://planet.openstreetmap.org/) and regular region-wise extracts (http://download.geofabrik.de/). Further, in this study, OSM data of the Punjab (India) region were used for analysis. The following sections elaborate the methods and tools for extracting the test data:
4.1.1. History Data Preparation
The OSM full history dump contains the entire history of the OSM data (http://planet.openstreetmap.org/planet/full-history/, accessed on 28 July 2016) sized 56 GB in pbf format. The tool OSM-history-splitter (https://github.com/joto/osm-history-splitter, accessed on 3 October 2016) was used to extract Punjab (India) data. This tool took two inputs: (1) history file; (2) polygon for the region. The polygon data (.poly format) for the region was created using the QGIS clip feature. The polygon was prepared from the administrative boundaries (.shp) of Indian districts collected during the census of 2011 (https://github.com/datameet/maps/tree/master/Districts/Census_2011, accessed on 26 June 2016). The steps followed for splitting are available at (https://github.com/joto/osm-history-splitter), and the obtained .osm.pbf format data were converted to .osh using the tool osmconvert (https://gitlab.com/osm-c-tools/osmctools, accessed on 3 October 2016). The converted data was imported into PostgreSQL (https://www.postgresql.org, accessed on 13 March 2016) database for the readiness of the data using the history importer module of OSM-history-renderer (https://github.com/MaZderMind/osm-history-renderer, accessed on 3 October 2016).
4.1.2. Routing Graph Preparation
Neis and Zipf [48] have suggested that the preparation of a routable OSM graph requires thorough preprocessing and conversion to a real topology. Shapefiles of proprietary datasets normally carry such information, but the database prepared from OSM-shapefiles using the shp2pgsql tool should be cautiously handled (http://pgrouting.org/docs/howto/shapefiles.html, accessed on 27 June 2016). In this study, India data in .osm.pbf format were downloaded from (http://download.geofabrik.de/osm/), and Punjab data were extracted using osmosis based on the polygon. A tool, osm2pgrouting (https://github.com/pgRouting/osm2pgrouting, accessed on 26 June 2016), was used to load the data to PostgreSQL database. It parsed OSM XML data and created a topologically-correct routing graph. Thereafter, it generated SQL files for PostGIS, which was compatible with pgRouting and QGIS. Further, pgRouting functions were used to assess the quality of routing graph data, i.e., pgr_analzeGraph() and pgr_nodeNetwork(), to fix some issues like noding of data for ensuring that intersections in the network are represented as the start or end of an edge, gaps, self-intersections and dead nodes, etc.
4.2. Results
4.2.1. Network Length Completeness
In this study, two datasets (OSM dataset downloaded on January 2016 and February 2017) were evaluated using the network model (Figure 2) for the road network completeness. The statistical analysis of the OSM road network concluded that the total mapped length of highway type features is 33,813,720.6453 m (old) and 38,147,564.3035 m (recent). Further, it was evaluated that 98.27% (old) and 92% (recent) of the data could be used for the navigation of cars, whereas the rest of data is suitable for other domains, including pedestrian and cycleways. Further, about 4,333,843.6582 m more road network data have been added during the period January 2016 to February 2017.
It was analyzed that for old data, there exists a total of 23 ways classes, and for recent data, this increased to 26. Further, few classes of ways diminished, and some new classes emerged from recent data, e.g., unclassified ways, earlier present in the data, have now been properly assigned tags and classified. The statistics of the resultant analysis are shown in Figure 6. Further, the two datasets were analyzed to find where geographic changes took place and found that during the period January 2016 to February 2017, rural area (in particular the areas around place name (Raikot) and geographic area, bounding box: 30.4842, 75.4376, 30.7961, 75.7892) has developed more as compared to urban area. In addition, it has been witnessed that the road network of the Malwa region of Punjab [97] is complete as compared to Doaba and Majha regions (Figure 9c).
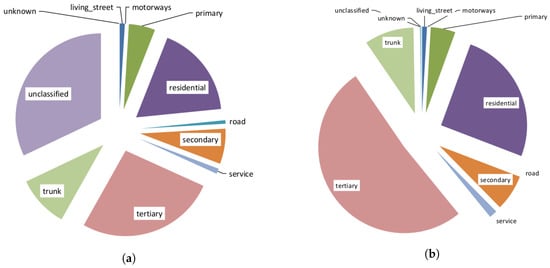
Figure 6.
Class-wise network statistics of OpenStreetMap (OSM) data till January 2016 and February 2017. (a) January 2016; (b) February 2017.
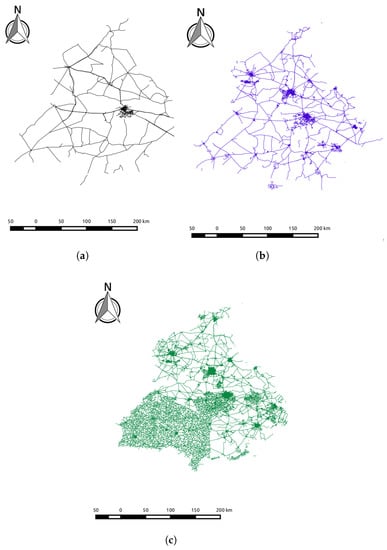
Figure 9.
Punjab OSM road network analysis over the years. (a) March 2008; (b) August 2012; (c) December 2016.
4.2.2. Attribute Completeness
The model (Figure 3) processed two datasets to identify the developments and current status of attribute completeness. Two tag attributes “name” and “maxspeed” were assessed. The old and recent data of OSM have been compared, and the results are presented in Table 2. This table depicts statistical information about the length of the feature type and the percentage of features with the “name” attribute. This revealed some interesting facts that the community in India is growing and focused on contributing to OSM. In spite of the increase in the total length of the OSM network by 4,333,843.6582 m, the length of certain network classes such as living_street, primary, secondary, has decreased. In addition, roads and unclassified classes have vanished from the recent network, whereas new classes have emerged from it, e.g., motorways, track grades and an unknown class type. The thorough analysis suggested that the motorway class was wrongly allocated to the network. The second parameter analyzed was the “maxspeed” tag, and it has been found that only 4 to 5% of features have “maxspeed” tag information, which makes it unsuitable for navigation without pre-processing.

Table 2.
Class-wise statistics of the attribute completeness of two datasets.
4.2.3. Semantic Accuracy
The model (Figure 4) was used to assess the history file of the area under examination. The analysis concluded that a total of 611 users (Figure 7a) have contributed through the period 2007 to 2016. They have contributed 634,173 nodes, 86,176 ways and 393 relations with very the first node added in September 2007. Figure 8 presents the historical development of three components of OSM data, whereas Figure 9 depicts the changes in OSM data over the years. Further, by analyzing the user contribution count, the categories of user are classified as suggested by Neis and Zipf [48]. Figure 7b depicts the graphical count of the class of contributor and calculated that 45.6%, 11.9% and 42.5% as junior, senior and non-recurring mappers exist for data under investigation. Figure 7f presents the number of active distinct contributor’s and provides a graphical analysis about the user activity in the region. Further, Figure 7e reveals the relationship between user feature edits and their percentage contributions.
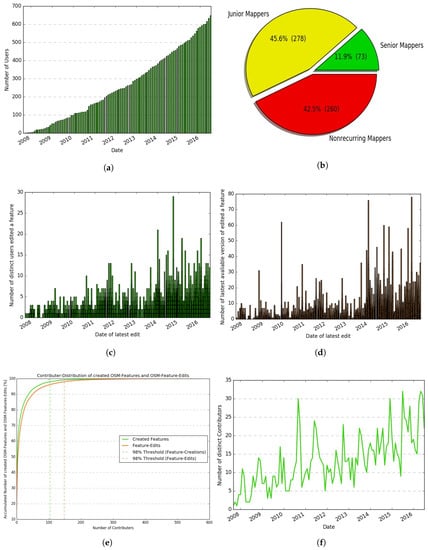
Figure 7.
Pictorial presentation of statistics obtained from the user contribution processing model. (a) Development of contributors; (b) classification of contributors; (c) number of contributors per feature; (d) maximum version per features; (e) contributors and their accumulated percentage of contributions; (f) development of active distinct contributors.
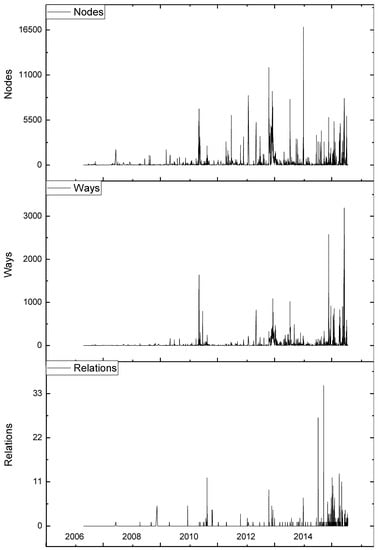
Figure 8.
Historical development of OSM Punjab (India) data.
The investigation of the number distinct contributors (Figure 7c), those who developed a feature out of a total 70,332 (line features), revealed that 8.45% of line features have been edited by more than 10 distinct users. Furthermore, the analysis of the maximum versions of features concluded that there are only 215 features, which are heavily edited, i.e., have a version more than or equal to 15, 71.13% features still exist with Version 1 status and 4.6% features have five or more than five, but less than five edits (Figure 7d).
4.2.4. Route Navigability Assessment
The model (Figure 5) used for the assessment of road navigability accepted two inputs: (1) routing network; (2) origin-destination points table. The origin-destination points dataset was prepared using the geocode plugin in QGIS, which uses Nominatim geocode services, to acquire the POIs for all districts of Punjab (India). The two inputs were given to the two components of the model, for finding the shortest OSM map distances (Figure 10) and direct distances between the points. In order to validate the results, a Python script was developed using the Google map distance matrix API to find the shortest routing distance between the same set of origin-destination points. Figure 11a,b present the plots of heuristic relative error used to measure the variation of shortest distances from direct distances obtained on OSM and Google maps, respectively. It was found that in the case of the district-to-district-based origin-destination matrix, nearly 69 routes had a distance more than 20% of the direct distances. Few longer routes were attributed to data preparation, as the neighboring state’s network was not included. Therefore, particularly for the district Pathankot, the routes were 30% to 40% longer approximately. As per the outcome of the model, it is concluded that the completeness of the primary roads was quite satisfactory, but other types of roads are less complete.
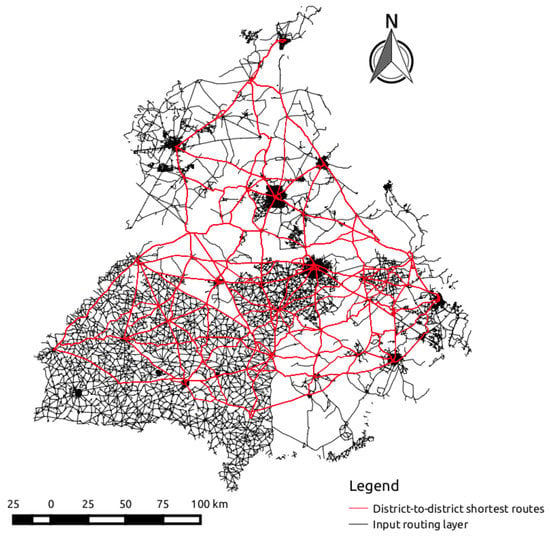
Figure 10.
Shortest routes created by the Dijkstra algorithm [98].
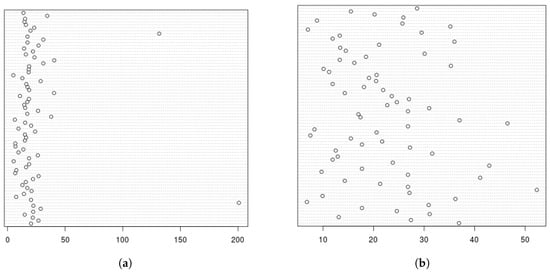
Figure 11.
Dot plots of relative difference (if more than 20%) of the shortest distances and direct distances. (a) OSM routing distances; (b) Google routing distances.
Further, it was witnessed that in Figure 11b, the roads’ variation in Google data is more as compared to OSM data. Firstly, this was due to the lazy computation used to find the approximate closest node to the locations of interest, and instead of taking the fraction length of the street, whole lengths were taken. Secondly, Google optimizes for time (cost based on time), which also considers traffic conditions, whereas our algorithm was optimized for distance only. Lastly, nearly in the whole of the OSM dataset, the turn restriction attribute was missing.
5. Limitations of the Study
The current study focuses on analyzing OSM data based on intrinsic quality indicators. However, only line type features have been assessed, whereas these models can be easily applied to other types of features (e.g., ways and relations), to assess their development, completeness and their fitness-of-use for various GI domains. Further, we have compared the OSM dataset of Punjab between two points in time, but the models can be easily adapted to assess and compare the urban and rural developments by preparing appropriate spatial datasets. Furthermore, the data were prepared using open source tools, and their weakness certainly would be reflected in data used for the study, e.g., Barron et al. [74] have reported that the OSM history importer carries a few bugs, and sometimes, the deleted ways and polygons are imported as if they had not been deleted. Another limitation of the current study is that the shortest routes are compared for the district-to-district level. More low-level origin-destination points data, e.g., village-to-village, may have revealed a clearer picture of the completeness of data. In addition to this, the routing algorithm computes the shortest path based on the availability of the route rather than other attributes, e.g., the maxspeed and traffic situation. Hence, the heuristic metrics defined for analyzing the completeness of data is a proxy measure, and longitudinal studies are required for the generalization of such heuristic measures.
6. Conclusions and Future Work
OSM provides a cost-effective solution for the community to develop the regions by crowdsourcing. Further, the OSM platform can work as a reliable, fast and efficient framework where the spatial data acquisition process by official mapping agencies is slow. Hence, OSM can enable quick visualization of the expanding road network in developing countries like India. Furthermore, it provides an opportunity for researchers to process a huge amount of labeled data for quality assessment. The thorough review of the literature revealed the need for the development of easy-to-use procedures for data assessment specific to different GI domains. Hence, to fill the gap, the current study has extended the functionality of the processing toolbox of QGIS. The developed models would pave the way to analyze the contributed data and identify deficiencies in the data. Thus, the community can easily perform a collaborative effort (mapping party) to rectify those issues. The models developed can be used to analyze street networks worldwide and can easily adapt to check for the completeness of other features. Further, easy-to-use models can encourage researchers to explore the regions in developing countries using intrinsic indicators. Hence, the models would help in overcoming the skewed distribution of studies in developing countries as compared to developed countries.
The intrinsic indicators used to assess the spatial dataset are network length completeness, attribute completeness, user contribution assessment and heuristic road navigability assessment. The case study of Punjab (India) has been taken to evaluate the models. Further, during the period January 2016 to February 2017, more rural area contribution has been observed as compared to the urban area, and also, the already existing class of roads has been renamed to other classes. Hence, a few old classes have diminished, and new classes have emerged during this period. The user contribution analysis model has revealed that although the count of users has increased over the period, only 11.2% of mappers are senior and active members. This count is in alignment with the fact that less than 20% contributes more than 80% of the data. The results have shown that OSM in the region is undergoing slow development, and there is a need to motivate local contributors by organizing mapping parties.
The results of heuristic road navigability analysis showed that the length of the shortest paths generated for navigation is affected by the completeness of the underlying dataset. Further, it has been observed that some street networks have a significant number of missing road networks. It is further revealed that turn-restrictions are totally missing, whereas low percentage maxspeed attributes are present in the data. The size of the origin-destination points sample used in this study was small to make definite statements about completeness. However, still, the model designed can be extended to any number of computations.
Further, computer science and geospatial researchers should view OSM as an opportunity to investigate computational research challenges. The future research would be focusing on the identification of heuristic intrinsic quality indicators for the assessment of OSM data and add more components to the existing script for the development of the QGIS plugin for assessing data specific to different GI domains. Furthermore, an effort would be made for the generalization of such heuristic methods through longitudinal studies.
Acknowledgments
The authors are grateful to the Guru Nanak Dev Engineering College, Ludhiana, for providing the essential infrastructure and facilities for conducting the study. The authors would like to thank Sumeet Kaur Sehra for proofreading our paper and the anonymous reviewers for their constructive comments and suggestions in improving the clarity of the article.
Author Contributions
Hardeep Singh Rai identified the need of such tool and Sukhjit Singh Sehra developed the models and obtained results. On reviewing results, Hardeep Singh Rai and Jaiteg Singh finalised the heuristics to make results more usable. Sukhjit Singh Sehra wrote the paper. Jaiteg Singh and Hardeep Singh Rai put efforts to enhance the presentation of content.
Conflicts of Interest
The authors declare no conflict of interest.
Abbreviations
The following abbreviations are used in this manuscript:
| GI | Geographic information |
| VGI | Volunteered geographic information |
| OSM | OpenStreetMap |
| QGIS | Quantum geographic information system |
References
- Goodchild, M.; Li, L. Assuring the Quality of Volunteered Geographic Information. Spat. Stat. 2012, 1, 110–120. [Google Scholar] [CrossRef]
- Haklay, M. Citizen science and volunteered geographic information: Overview and typology of participation. In Crowdsourcing Geographic Knowledge; Chapter Crowdsourcing Geographic Knowledge; Sui, D., Elwood, S., Goodchild, M., Eds.; Springer: Berlin/Heidelberg, Germany, 2013; pp. 105–122. [Google Scholar]
- Sehra, S.S.; Singh, J.; Rai, H.S. A systematic study of openstreetmap data quality assessment. In Proceedings of the IEEE 11th International Conference on Information Technology: New Generations (ITNG), Las Vegas, NV, USA, 7–9 April 2014; pp. 377–381. [Google Scholar]
- Vandecasteele, A.; Devillers, R. Improving volunteered geographic information quality using a tag recommender system: The case of OpenStreetMap. In OpenStreetMap in GIScience; Arsanjani, J.J., Zipf, A., Mooney, P., Helbich, M., Eds.; Springer: Cham, Switzerland, 2015; pp. 59–80. [Google Scholar]
- Antoniou, V.; Skopeliti, A. Measures and Indicators of VGI Quality: An Overview. ISPRS Int. Soc. Photogramm. Remote Sens. 2015, II-3/W5, 345–351. [Google Scholar] [CrossRef]
- Haklay, M.; Basiouka, S.; Antoniou, V.; Ather, A. How Many Volunteers Does It Take to Map an Area Well the Validity of Linus’ Law to Volunteered Geographic Information. Cartogr. J. World Mapp. 2010, 47, 315–322. [Google Scholar] [CrossRef]
- ODC Open Database License (ODbL), Version 1.0. Available online: https://opendatacommons.org/licenses/odbl/ (accessed on 30 March 2017).
- OpenStreetMap. Available online: http://www.openstreetmap.org/stats/data_stats.html (accessed on 30 March 2017).
- Poser, K.; Dransch, D. Volunteered geographic information for disaster management with application to rapid flood damage estimation. Geomatica 2010, 64, 89–98. [Google Scholar]
- Quattrone, G.; Capra, L.; Meo, P.D. There’s no such thing as the perfect map: Quantifying bias in spatial crowd-sourcing datasets. In Proceedings of the 18th ACM Conference on Computer Supported Cooperative Work & Social Computing-CSCW’15, Vancouver, BC, Canada, 14–18 March 2015. [Google Scholar]
- Quattrone, G.; Dittus, M.; Capra, L. Work Always in Progress: Analysing Maintenance Practices in Spatial Crowd-sourced Datasets. In Proceedings of the 2017 ACM Conference on Computer Supported Cooperative Work and Social Computing-CSCW’17, Portland, OR, USA, 25 February–1 March 2017. [Google Scholar]
- Chen, H.; Zhang, W.C.; Deng, C.; Nie, N.; Yi, L. Volunteered Geographic Information for Disaster Management with Application to Earthquake Disaster Databank and Sharing Platform. IOP Conf. Ser. Earth Environ. Sci. 2017, 57, 012015. [Google Scholar] [CrossRef]
- Hashemi, P.; Abbaspour, R.A. Assessment of logical consistency in openstreetmap based on the spatial similarity concept. In OpenStreetMap in GIScience; Arsanjani, J.J., Zipf, A., Mooney, P., Helbich, M., Eds.; Springer Lecture Notes in Geoinformation and Cartography; Springer: Cham, Switzerland, 2015; pp. 19–36. [Google Scholar]
- Senaratne, H.; Mobasheri, A.; Ali, A.L.; Capineri, C.; Haklay, M.M. A Review of Volunteered Geographic Information Quality Assessment Methods. Int. J. Geogr. Inf. Sci. 2016, 31, 1–29. [Google Scholar] [CrossRef]
- Rak, A. Legal Issues and Validation of Volunteered Geographic Information; Technical Report; Department of Geodesy and Geomatics Engineering, University of New Brunswick: Fredericton, NB, Canada, 2013. [Google Scholar]
- Ballatore, A.; Wilson, D.C.; Bertolotto, M. A survey of volunteered open geo-knowledge bases in the semantic web. In Quality Issues in the Management of Web Information; Pasi, G., Bordogna, G., Jain, L.C., Eds.; Springer: Heidelberg, Germany, 2013; Volume 50, pp. 93–120. [Google Scholar]
- Ali, A.L.; Schmid, F. Data quality assurance for volunteered geographic information. In Proceedings of the Geographic Information Science: 8th International Conference (GIScience 2014), Vienna, Austria, 24–26 September 2014; Duckham, M., Pebesma, E., Stewart, K., Frank, A.U., Eds.; Springer Lecture Notes in Computer Science. Springer: Cham, Switzerland, 2014; Volume 8728, pp. 126–141. [Google Scholar]
- Mooney, P.; Corcoran, P.; Winstanley, A.C. Towards quality metrics for openstreetmap. In Proceedings of the 18th ACM SIGSPATIAL International Symposium on Advances in Geographic Information Systems (GIS ’10), San Jose, CA, USA, 3–5 November 2010; pp. 514–517. [Google Scholar]
- Graser, A.; Straub, M.; Dragaschnig, M. Is osm good enough for vehicle routing a study comparing street networks in vienna. In Progress in Location-Based Services 2014; Gartner, G., Huang, H., Eds.; Springer Lecture Notes in Geoinformation and Cartography; Springer: Cham, Switzerland, 2015; pp. 3–17. [Google Scholar]
- Zhang, X.; Ai, T. How to model roads in OpenStreetMap a method for evaluating the fitness-for-use of the network for navigation. In Advances in Spatial Data Handling and Analysis; Harvey, F., Leung, Y., Eds.; Select Papers from the 16th IGU Spatial Data Handling Symposium; Springer Advances in Geographic Information Science; Springer: Cham, Switzerland, 2015; pp. 143–162. [Google Scholar]
- ISO. ISO 19157:2013: Geographic Information—Data Quality; Technical Report; International Organization for Standardization (ISO): Geneva, Switzerland, 2013. [Google Scholar]
- Longley, P.A.; Goodchild, M.F.; Maguire, D.J.; Rhind, D.W. (Eds.) Geographical Information Systems: Principles, Techniques, Management and Applications, 2nd ed.; Abridged, Wiley: Chichester, UK, 2005. [Google Scholar]
- Guptill, S.; Morrison, J. (Eds.) Elements of Spatial Data Quality, 1st ed.; Elsevier Science Ltd.: Exeter, UK, 1995. [Google Scholar]
- Joksić, D.; Bajat, B. Elements of Spatial Data Quality As Information Technology Support for Sustainable Development Planning. Spatium 2004, 11, 77–83. [Google Scholar] [CrossRef]
- Servigne, S.; Ubeda, T.; Puricelli, A.; Laurini, R. A Methodology for Spatial Consistency Improvement of Geographic Databases. GeoInformatica 2000, 4, 7–34. [Google Scholar] [CrossRef]
- Brovelli, M.A.; Minghini, M.; Molinari, M.; Mooney, P. Towards an Automated Comparison of Openstreetmap with Authoritative Road Datasets. Trans. GIS 2016, 21, 191–206. [Google Scholar] [CrossRef]
- Keßler, C.; de Groot, R.T.A. Trust as a Proxy Measure for the Quality of Volunteered Geographic Information in the Case of OpenStreetMap. In Geographic Information Science at the Heart of Europe; Vandenbroucke, D., Bucher, B., Crompvoets, J., Eds.; Springer Lecture Notes in Geoinformation and Cartography; Springer: Cham, Switzerland, 2013; pp. 21–37. [Google Scholar]
- De Groot, R.T.A. Evaluation of a Volunteered Geographical Information Trust Measure in the Case of OpenStreetMap. Mater’s Thesis, Institute of Formal Methods in Computer Science, University of Stuttgart, Brussels, Belgium, 2012. [Google Scholar]
- Mooney, P.; Corcoran, P. Characteristics of Heavily Edited Objects in Openstreetmap. Future Internet 2012, 4, 285–305. [Google Scholar] [CrossRef]
- Barta, D. Project OpenStreetMap as open and free source of geodata and maps. In Proceedings of the Eight International Symposium (GIS Ostrava 2011), Ostrava, Czech Republic, 24–26 January 2011; Jiri, H., Tomas, H., Jan, R., Lena, H., Otakar, C., Eds.; Technical University of Ostrava: Ostrava, Czech Republic; pp. 23–26. [Google Scholar]
- Graser, A.; Straub, M.; Dragaschnig, M. Towards an Open Source Analysis Toolbox for Street Network Comparison: Indicators, Tools and Results of a Comparison of Osm and the Official Austrian Reference Graph. Trans. GIS 2014, 18, 510–526. [Google Scholar] [CrossRef]
- Morrison, J.L. Spatial data quality. In Elements of Spatial Data Quality; Guptill, S.C., Morrison, J.L., Eds.; Elsevier Science Ltd.: Exeter, UK, 1995; Chapter one; pp. 1–12. [Google Scholar]
- Veregin, H. Data quality parameters. In Geographical Information Systems: Principles, Techniques, Management and Applications; Longley, P.A., Goodchild, M.F., Maguire, D.J., Rhind, D.W., Eds.; Wiley: Chichester, UK, 2005; Chapter twelve; pp. 177–189. [Google Scholar]
- Lopez-Pellicer, F.J.; Barrera, J. D19.1 Call 2: Linked Map Report on VGI Data Quality Factors; Technical Report; PlanetData: Zaragoza, Spain, 2014. [Google Scholar]
- Brassel, K.; Bucher, F.; Stephan, E.M.; Vckovski, A. Completeness. In Elements of Spatial Data Quality; Guptill, S.C., Morrison, J.L., Eds.; Elsevier Science Ltd.: Exeter, UK, 1995; Chapter five; pp. 81–108. [Google Scholar]
- Veregin, H. Quantifying Positional Error Induced by Line Simplification. Int. J. Geogr. Inf. Sci. 2000, 14, 113–130. [Google Scholar] [CrossRef]
- Oort, P.V. Spatial Data Quality: From Description to Application. Ph.D. Thesis, Wageningen University, Wageningen, The Netherlands, 2006. [Google Scholar]
- Salgé, F. Semantic accuracy. In Elements of Spatial Data Quality; Guptill, S.C., Morrison, J.L., Eds.; Elsevier Science Ltd.: Exeter, UK, 1995; Chapter seven; pp. 139–151. [Google Scholar]
- Kounadi, O. Assessing the Quality of OpenStreetMap Data. Mater’s Thesis, Department of Civil, Environmental and Geomatic Engineering, University College of London, London, UK, 2009. [Google Scholar]
- Ather, A. A Quality Analysis of OpenStreetMap. Mater’s Thesis, Department of Civil, Environmental & Geomatic Engineering, University College London, London, UK, 2009. [Google Scholar]
- Haklay, M. How Good Is Volunteered Geographical Information A Comparative Study of Openstreetmap and Ordnance Survey Datasets. Environ. Plan. B Plan. Des. 2010, 37, 682–703. [Google Scholar] [CrossRef]
- Zielstra, D.; Zipf, A. Quantitative studies on the data quality of OpenStreetMap in Germany. In Proceedings of the Sixth International Conference on Geographic Information Science, Zürich, Switzerland, 14–17 September 2010; pp. 20–26. [Google Scholar]
- Zielstra, D.; Hochmair, H. Comparative Study of Pedestrian Accessibility to Transit Stations Using Free and Proprietary Network Data. Transp. Res. Rec. J. Transp. Res. Board 2011, 145–152. [Google Scholar] [CrossRef]
- Ciepluch, B.; Mooney, P.; Jacob, R.; Zheng, J.; Winstanley, A.C. Assessing the Quality of Open Spatial Data for Mobile Location-based Services Research and Applications. Arch. Photogramm. Cartogr. Remote Sens. 2011, 1, 105–116. [Google Scholar]
- Hagenauer, J.; Helbich, M. Mining Urban Land-use Patterns from Volunteered Geographic Information by Means of Genetic Algorithms and Artificial Neural Networks. Int. J. Geogr. Inf. Sci. 2012, 26, 963–982. [Google Scholar] [CrossRef]
- Wang, A.; Hoang, C.D.V.; Kan, M.Y. Perspectives on Crowdsourcing Annotations for Natural Language Processing. Lang. Resour. Eval. 2013, 47, 9. [Google Scholar] [CrossRef]
- Zheng, S.; Zheng, J. Assessing the completeness and positional accuracy of OpenStreetMap in China. In Thematic Cartography for the Society; Bandrova, T., Konecny, M., Zlatanova, S., Eds.; Springer Lecture Notes in Geoinformation and Cartography; Springer: Cham, Switzerland, 2014; pp. 171–189. [Google Scholar]
- Neis, P.; Zipf, A. Analyzing the Contributor Activity of a Volunteered Geographic Information Project the Case of OpenStreetMap. ISPRS Int. J. Geo-Inf. 2012, 1, 146–165. [Google Scholar] [CrossRef]
- Ludwig, I.; Voss, A.; Krause-Traudes, M. A comparison of the street networks of Navteq and OSM in Germany. In Advancing Geoinformation Science for a Changing World; Geertman, S., Reinhardt, W., Toppen, F., Eds.; Springer Lecture Notes in Geoinformation and Cartography; Springer-Verlag: Berlin, Germany, 2011; Volume 1, pp. 65–84. [Google Scholar]
- Koukoletsos, T.; Haklay, M.; Ellul, C. Assessing Data Completeness of Vgi through an Automated Matching Procedure for Linear Data. Trans. GIS 2012, 16, 477–498. [Google Scholar] [CrossRef]
- Will, J. Development of an Automated Matching Algorithm to Assess the Quality of the OpenStreetMap Road Network. Mater’s Thesis, Department of Physical Geography and Ecosystem Science, Lund University, Sölvegatan, Sweden, 2014. [Google Scholar]
- Abdolmajidi, E.; Mansourian, A.; Will, J.; Harrie, L. Matching Authority and Vgi Road Networks Using an Extended Node-based Matching Algorithm. Geo-Spat. Inf. Sci. 2015, 18, 65–80. [Google Scholar] [CrossRef]
- Zielstra, D.; Hochmair, H. Using Free and Proprietary Data to Compare Shortest-path Lengths for Effective Pedestrian Routing in Street Networks. Transp. Res. Rec. J. Transp. Res. Board 2012, 2299, 41–47. [Google Scholar] [CrossRef]
- Mullen, W.F.; Jackson, S.P.; Croitoru, A.; Crooks, A.; Stefanidis, A.; Agouris, P. Assessing the Impact of Demographic Characteristics on Spatial Error in Volunteered Geographic Information Features. GeoJournal 2014, 80, 587. [Google Scholar] [CrossRef]
- Mashhadi, A.; Quattrone, G.; Capra, L. The impact of society on volunteered geographic information: The case of OpenStreetMap. In OpenStreetMap in GIScience; Arsanjani, J.J., Zipf, A., Mooney, P., Helbich, M., Eds.; Springer Lecture Notes in Geoinformation and Cartography; Springer International Publishing: Cham, Switzerland, 2015; pp. 125–141. [Google Scholar]
- Camboim, S.P.; Bravo, J.V.M.; Sluter, C.R. An Investigation into the Completeness of, and the Updates to, Openstreetmap Data in a Heterogeneous Area in Brazil. ISPRS Int. J. Geo-Inf. 2015, 4, 1366. [Google Scholar] [CrossRef]
- Arsanjani, J.J.; Vaz, E. An Assessment of a Collaborative Mapping Approach for Exploring Land Use Patterns for Several European Metropolises. Int. J. Appl. Earth Obs. Geoinf. 2015, 35 Pt B, 329–337. [Google Scholar] [CrossRef]
- Jackson, S.P.; Mullen, W.; Agouris, P.; Crooks, A.; Croitoru, A.; Stefanidis, A. Assessing Completeness and Spatial Error of Features in Volunteered Geographic Information. ISPRS Int. J. Geo-Inf. 2013, 2, 507. [Google Scholar] [CrossRef]
- Törnros, T.; Dorn, H.; Hahmann, S.; Zipf, A. Uncertainties of Completeness Measures in Openstreetmap—A Case Study for Buildings in a Medium-sized German City. ISPRS Ann. Photogramm. Remote Sens. Spat. Inf. Sci. 2015, II-3-W5, 353–357. [Google Scholar]
- Hecht, R.; Kunze, C.; Hahmann, S. Measuring Completeness of Building Footprints in Openstreetmap Over Space and Time. ISPRS Int. J. Geo-Inf. 2013, 2, 1066. [Google Scholar] [CrossRef]
- Fan, H.; Zipf, A.; Fu, Q.; Neis, P. Quality Assessment for Building Footprints Data on Openstreetmap. Int. J. Geogr. Inf. Sci. 2014, 28, 700–719. [Google Scholar] [CrossRef]
- Dorn, H.; Törnros, T.; Zipf, A. Quality Evaluation of VGI Using Authoritative Data—A Comparison with Land Use Data in Southern Germany. ISPRS Int. J. Geo-Inf. 2015, 4, 1657–1671. [Google Scholar] [CrossRef]
- Van Exel, M.; Dias, E.; Fruijtier, S. The impact of crowdsourcing on spatial data quality indicators. In Proceedings of the Sixth International Conference on Geographic Information Science, Zürich, Switzerland, 14–17 September 2010; p. 213. [Google Scholar]
- Devillers, R.; Gervais, M.; Bédard, Y.; Jeansoulin, R. Spatial data quality: From metadata to quality indicators and contextual end-user manual. In Proceedings of the OEEPE/ISPRS Joint Workshop on Spatial Data Quality Management, Istanbul, Turkey, 21–22 March 2002; pp. 45–55. [Google Scholar]
- Devillers, R.; Bédard, Y.; Jeansoulin, R.; Moulin, B. Towards Spatial Data Quality Information Analysis Tools for Experts Assessing the Fitness for Use of Spatial Data. Int. J. Geogr. Inf. Sci. 2007, 21, 261–282. [Google Scholar] [CrossRef]
- Razniewski, S.; Nutt, W. Assessing the completeness of geographical data. In Big Data; Springer Lecture Notes in Computer Science; Springer: Berlin/Heidelberg, Germany, 2013; Volume 7968, pp. 228–237. [Google Scholar]
- Bégin, D.; Devillers, R.; Roche, S. Assessing Volunteered Geographic Information VGI Quality Based on Contributors’ Mapping Behaviours. Int. Arch. Photogramm. Remote Sens. Spat. Inf. Sci. 2013, XL-2/W1, 149–154. [Google Scholar]
- Gröchenig, S.; Brunauer, R.; Rehrl, K. Estimating completeness of VGI datasets by analyzing community activity over time periods. In Connecting a Digital Europe Through Location and Place; Huerta, J., Schade, S., Granell, C., Eds.; Springer Lecture Notes in Geoinformation and Cartography; Springer: Cham, Switzerland, 2014; pp. 3–18. [Google Scholar]
- Ballatore, A.; Zipf, A. Spatial Information Theory; A Conceptual Quality Framework for Volunteered Geographic Information; Springer Lecture Notes in Computer Science; Springer: Cham, Switzerland, 2015; Volume 9368, pp. 89–107. [Google Scholar]
- Forghani, M.; Delavar, M.R. A Quality Study of the Openstreetmap Dataset for Tehran. ISPRS Int. J. Geo-Inf. 2014, 3, 750. [Google Scholar] [CrossRef]
- Girres, J.F.; Touya, G. Quality Assessment of the French Openstreetmap Dataset. Trans. GIS 2010, 14, 435–459. [Google Scholar] [CrossRef]
- Navarro, G. A Guided Tour to Approximate String Matching. Comput. Surv. 2001, 33, 31–88. [Google Scholar] [CrossRef]
- Koukoletsos, T. A Framework for Quality Evaluation of VGI Linear Datasets. Ph.D. Thesis, University College London (UCL), London, UK, 2012. [Google Scholar]
- Barron, C.; Neis, P.; Zipf, A. A Comprehensive Framework for Intrinsic Openstreetmap Quality Analysis. Trans. GIS 2014, 18, 877–895. [Google Scholar] [CrossRef]
- Congalton, R.G. A Review of Assessing the Accuracy of Classifications of Remotely Sensed Data. Remote Sens. Environ. 1991, 37, 35–46. [Google Scholar] [CrossRef]
- Cohen, J. A Coefficient of Agreement for Nominal Scales. Educ. Psychol. Meas. 1994, 20, 37–46. [Google Scholar] [CrossRef]
- Fan, H.; Zipf, A.; Fu, Q. Estimation of building types on openstreetmap based on urban morphology analysis. In Connecting a Digital Europe Through Location and Place; Huerta, J., Schade, S., Granell, C., Eds.; Springer Lecture Notes in Geoinformation and Cartography; Springer: Castellon, Spain, 2014; pp. 19–35. [Google Scholar]
- Al-Bakri, M.; Fairbairn, D. Assessing Similarity Matching for Possible Integration of Feature Classifications of Geospatial Data from Official and Informal Sources. Int. J. Geogr. Inf. Sci. 2012, 26, 1437–1456. [Google Scholar] [CrossRef]
- Jilani, M.; Corcoran, P.; Bertolotto, M. Automated highway tag assessment of openstreetmap road networks. In Proceedings of the 22nd ACM SIGSPATIAL International Conference on Advances in Geographic Information Systems, Dallas/Fort Worth, TX, USA, 4–7 November 2014; pp. 449–452. [Google Scholar]
- Mülligann, C.; Janowicz, K.; Ye, M.; Lee, W.C. Analyzing the spatial-semantic interaction of points of interest in volunteered geographic information. In Spatial Information Theory, Proceedings of the 10th International Conference, COSIT 2011, Belfast, ME, USA, 12–16 September 2011; Egenhofer, M., Giudice, N., Morat, R., Worboys, M., Eds.; Springer Lecture Notes in Computer Science; Springer: Berlin/Heidelberg, Germany, 2011; Volume 6899, pp. 350–370. [Google Scholar]
- Flanagin, A.J.; Metzger, M.J. The Credibility of Volunteered Geographic Information. GeoJournal 2008, 72, 137. [Google Scholar] [CrossRef]
- Rehrl, K.; Gröchenig, S.; Hochmair, H.; Leitinger, S.; Steinmann, R.; Wagner, A. A conceptual model for analyzing contribution patterns in the context of VGI. In Progress in Location-Based Services; Krisp, J.M., Ed.; Springer Lecture Notes in Geoinformation and Cartography; Springer: Berlin/Heidelberg, Germany, 2013; pp. 373–388. [Google Scholar]
- Goodchild, M. Citizens as Sensors: The World of Volunteered Geography. GeoJournal 2007, 69, 211. [Google Scholar] [CrossRef]
- Budhathoki, N.R. Participants’ Motivations to Contribute Geographic Information in an Online Community. Ph.D. Thesis, University of Illinois at Urbana-Champaign, Urbana, IL, USA, 2010. [Google Scholar]
- Tobler, W.R. A Computer Movie Simulating Urban Growth in the Detroit Region. Econ. Geogr. 1970, 46, 234. [Google Scholar] [CrossRef]
- Auer, S.; Lehmann, J.; Hellmann, S. Linkedgeodata: Adding a spatial dimension to the web of data. In Proceedings of the Semantic Web—ISWC 2009, Chantilly, VA, USA, 25–29 October 2009; Bernstein, A., Karger, D.R., Heath, T., Feigenbaum, L., Maynard, D., Motta, E., Thirunarayan, K., Eds.; Springer Lecture Notes in Computer Science. Springer: Chantilly, VA, USA, 2009; Volume 5823, pp. 731–746. [Google Scholar]
- Ballatore, A.; Wilson, D.C.; Bertolotto, M. The similarity jury: Combining expert judgements on geographic concepts. In Advances in Conceptual Modeling, Proceedings of the ER 2012 Workshops CMS, ECDM-NoCoDA, MoDIC, MORE-BI, RIGiM, SeCoGIS, WISM, Florence, Italy, 15–18 October 2012; Castano, S., Vassiliadis, P., Lakshmanan, L.V., Lee, M.L., Eds.; Springer Lecture Notes in Computer Science; Springer: Berlin/Heidelberg, Germany, 2012; Volume 7518, pp. 231–240. [Google Scholar]
- Codescu, M.; Horsinka, G.; Kutz, O.; Mossakowski, T.; Rau, R. DO-ROAM: Activity-oriented search and navigation with openstreetmap. In GeoSpatial Semantics, Proceedings of the 4th International Conference, GeoS 2011, Brest, France, 12–13 May 2011; Claramunt, C., Levashkin, S., Bertolotto, M., Eds.; Springer Lecture Notes in Computer Science; Springer: Berlin/Heidelberg, Germany, 2011; Volume 6631, pp. 88–107. [Google Scholar]
- Hopf, K.; Dageförde, F.; Wolter, D. Identifying the geographical scope of prohibition signs. In Spatial Information Theory, Proceedings of the 12th International Conference, COSIT 2015, Santa Fe, NM, USA, 12–16 October 2015; Fabrikant, I.S., Raubal, M., Bertolotto, M., Davies, C., Freundschuh, S., Bell, S., Eds.; Springer Lecture Notes in Computer Science; Springer: Cham, Switzerland, 2015; Volume 9368, pp. 247–267. [Google Scholar]
- Haklay, M. Haiti—How Can VGI Help? Comparison of OpenStreetMap and Google Map Maker. 2010. Available online: https://povesham.wordpress.com/2010/01/18/haiti-how-can-vgi-help-comparison-of-openstreetmap-and-google-map-maker/ (accessed on 10 April 2017).
- Poiani, T.H.; dos Santos Rocha, R.; Degrossi, L.C.; de Albuquerque, J.P. Potential of collaborative mapping for disaster relief: A case study of OpenStreetMap in the Nepal earthquake 2015. In Proceedings of the 2016 49th Hawaii International Conference on System Sciences (HICSS), Koloa, HI, USA, 5–8 January 2016. [Google Scholar]
- Mahabir, R.; Stefanidis, A.; Croitoru, A.; Crooks, A.; Agouris, P. Authoritative and Volunteered Geographical Information in a Developing Country: A Comparative Case Study of Road Datasets in Nairobi, Kenya. ISPRS Int. J. Geo-Inf. 2017, 6, 24. [Google Scholar] [CrossRef]
- Ahmouda, A.; Hochmair, H.H. Using Volunteered Geographic Information to measure name changes of artificial geographical features as a result of political changes: A Libya case study. GeoJournal 2017. [Google Scholar] [CrossRef]
- Rehrl, K.; Gröchenig, S. A Framework for Data-centric Analysis of Mapping Activity in the Context of Volunteered Geographic Information. ISPRS Int. J. Geo-Inf. 2016, 5, 37. [Google Scholar] [CrossRef]
- QGIS Development Team. QGIS Geographic Information System. Open Source Geospatial Foundation, 2016. Available online: http://qgis.org/ (accessed on 10 April 2016).
- Graser, A.; Olaya, V. Processing: A Python Framework for the Seamless Integration of Geoprocessing Tools in QGIS. ISPRS Int. J. Geo-Inf. 2015, 4, 2219–2245. [Google Scholar] [CrossRef]
- Government of Punjab. Know Punjab. Available online: http://punjab.gov.in/know-punjab (accessed on 4 April 2017).
- Cormen, T.H.; Leiserson, C.E.; Rivest, R.L.; Stein, C. Dijkstra’s algorithm. In Introduction to Algorithms, 2nd ed.; MIT Press: Cambridge, MA, USA, 2001; Section 24.3; pp. 595–601. [Google Scholar]
© 2017 by the authors. Licensee MDPI, Basel, Switzerland. This article is an open access article distributed under the terms and conditions of the Creative Commons Attribution (CC BY) license (http://creativecommons.org/licenses/by/4.0/).