Abstract
Network Music Performance (NMP) refers to network-based remote collaboration when applied to music performances, such as musical education, music production and live music concerts. In NMP, the most important parameter for the Quality of Experience (QoE) of the participants is low end-to-end audio delay. Increasing delays prevent musicians’ synchronization and lead to a suboptimal musical experience. Visual contact between the participants is also crucial for their experience but highly demanding in terms of bandwidth. Since audio compression induces additional coding and decoding delays on the signal path, most NMP systems rely on audio quality reduction when bandwidth is limited to avoid violating the stringent delay limitations of NMP. To assess the delay and quality tolerance limits for NMP and see if they can be satisfied by emerging 5G networks, we asked eleven pairs of musicians to perform musical pieces of their choice in a carefully controlled laboratory environment, which allowed us to set different end-to-end delays or audio sampling rates. To assess the QoE of these NMP sessions, each musician responded to a set of questions after each performance. The analysis of the musicians’ responses revealed that actual musicians in delay-controlled NMP scenarios can synchronize at delays of up to 40 ms, compared to the 25–30 ms reported in rhythmic hand-clapping experiments. Our analysis also shows that audio quality can be considerably reduced by sub-sampling, so as to save bandwidth without significant QoE loss. Finally, we find that musicians rely more on audio and less on video to synchronize during an NMP session. These results indicate that NMP can become feasible in advanced 5G networks.
1. Introduction
The social distancing requirements imposed during the SARS-CoV-2 pandemic brought to the forefront the value of real-time collaboration applications. One such application is Network Music Performance (NMP), which refers to musicians performing when connected over a network. All real-time human-to-human applications require low delays; for example, in voice telephony, the goal is for the end-to-end delay to not exceed 150 ms, otherwise the conversation becomes unnatural and the quality of their experience is significantly reduced. NMP is far more challenging: studies of human participants trying to synchronize their hand claps over a network found that synchronization failed, with delays exceeding 25–30 ms [1].
Such requirements are so hard to meet that, to many researchers, NMP seems like an unattainable goal. However, musicians often state that when using specialized NMP tools, they can actually collaborate, at least over moderate distances. To assess the validity of such claims, we performed a small pilot study with four pairs of musicians, which indicated that higher levels of delay may be tolerable in actual musical performances [2]. Considering the higher bandwidths and lower latencies promised by 5G networks, this can bring NMP within the realm of feasibility.
The evidence that NMP may be possible over larger delays, coupled with the need to save bandwidth to allow adding video over the, normally more limited, uplink, made us reconsider the question of what is the tolerance to delay for NMP for rhythmic performances and to what extent can we sacrifice audio quality to save bandwidth without increasing delay? Audio quality is relevant, since NMP-specific tools commonly rely on raw audio to avoid the delays introduced by audio coding; even Opus, which is optimized for low delay, introduces delays of at least 5 ms with reduced quality, under ideal conditions [3]. Unlike previous studies that either focused on hand clap synchronization or very small numbers of musicians, considering only delay and not quality, we designed a series of experiments where pairs of musicians played music, while we modified the delay and audio quality, using questionnaires to assess the Quality of User Experience (QoE) in a subjective manner. We also recorded audio and video of all the performances for possible future processing and analysis.
In this paper, after presenting the experimental setup and the questionnaire used, we provide an analysis of the musicians’ responses, including their statistical significance, as well as a discussion of the implications of the results and some guidance on implementing similar experiments. Our main research questions are:
- How does varying the one-way audio delay, from near zero up to around 60 ms, affect the musicians’ QoE?
- How does reducing the audio sampling rate (from 88.2 kHz down to 8 kHz) impact the QoE of NMP participants?
We hypothesize that: (H1) musicians can tolerate higher one-way delays for actual performed pieces than earlier rhythmic hand-clapping studies have suggested; and (H2) reducing audio quality by sub-sampling is not detrimental to their overall QoE. The null hypotheses are that (N1) any delay above 25–30 ms is intolerable, and (N2) lowering the sampling rate will reduce the QoE. Our results support the rejection of these null hypotheses under the particular conditions described.
The contributions of this paper are as follows:
- We show that the QoE of NMP for rhythmic performances is acceptable for delays of up to 40 ms, rather than the 25–30 ms found in previous work, which focused on hand-clap synchronization; this makes NMP borderline feasible for 5G networks [4].
- We show that the QoE of NMP is not significantly affected when reducing the sampling rate from studio-level quality to telephone quality (an order of magnitude).
- We show that in NMP sessions where both audio and video channels are available, musicians rely far more on audio for synchronization, even when video has a lower delay.
- We present the largest NMP study with actual musicians and performances that we are aware of and the first ever study covering audio quality for NMP.
The remainder of this paper is structured as follows. We present related work in Section 2. Section 3 describes our experimental setup, while Section 4 presents our questionnaire. Section 5 presents and analyzes the subjective results from our experiments, while Section 6 offers a discussion on the study’s findings and some lessons learned. We summarize our findings and discuss future work in Section 7. An extended version of this work is available in the PhD thesis of Konstantinos Tsioutas, Quality of Musicians’ Experience in Network Music Performance, Department of Informatics, Athens University of Economics and Business, 2022.
2. Related Work
A large amount of research considers the QoE for NMP, evaluating it from diverse points of view. An overview of such research can be found in Rottondi et al. [5]. The most common approach is to manipulate a parameter (such as delay) over a set of NMP sessions and subjectively evaluate the resulting QoE via questionnaires; we adopt the same approach.
Schuett [1] investigated the effect of latency on musical synchronization and introduced the concept of the Ensemble Performance Threshold (EPT), defined as the one-way delay below which synchronization remains achievable. The study set this threshold to 20–30 ms. Chafe [6], through hand-clapping experiments with musicians, found a similar EPT, also noting that latencies below 11 ms could lead to tempo acceleration.
Driessen [7] examined two musicians performing hand claps without a metronome and reported that increasing delay caused a gradual slowdown in tempo. Farner [8] expanded on this by studying eleven musically trained pairs trying to synchronize their hand claps, finding a linear relationship between delay and tempo reduction.
Gurevich [9] also investigated the relationship between latency and tempo, using seventeen pairs of hand clapping participants. The study revealed that 74% of performances sped up when the delay was below 11.5 ms, whereas 85% of sessions with delays above 14 ms experienced a tempo slowdown.
Barbosa [10] conducted experiments with four musicians playing bass, percussion, piano, and guitar, concluding that all participants tolerated higher delay values when playing at slower tempos, regardless of their instrumental skills or instrument type. In a follow-up study, Barbosa [11] examined the influence of note attack time on tempo. Using cello and violin performances, the study found that pieces with fast attack times generally maintained a higher tempo, but in both fast and slow attack conditions, tempo decreased with increased delay.
Rottondi [12] further explored how delay interacts with musical content, involving seven pairs of musicians in varying settings of latency, jitter, tempo, and instrumental combinations. The study reported that perceived delay was strongly affected by the rhythmic and timbral characteristics of the instruments, with noisier or more rhythmically complex combinations being more sensitive to delay. These findings highlight that the enjoyability and feasibility of NMP are not determined by latency alone but also by the musical context.
Carôt [13] examined ten professional musicians, five drummers and five bassists, performing in pairs. The study reported an overall latency threshold ranging from 5 ms to 65 ms, with no single acceptance value across all participants, emphasizing the subjective variability in latency tolerance.
Olmos [14] studied a conductor with six singers performing together over a network. Despite the technical limitations, singers were generally able to adapt to various delay levels and reported forming emotional connections with each other. Bartlette [15] asked two pairs of musicians to perform Mozart duets under different latency conditions. While the musicians employed various coping strategies, they noted that delays of 100 ms or more made performances feel unmusical and non-interactive, leading them to rely more on self-monitoring than on active listening.
Monache [16] investigated the subjective experience of ten participants playing instruments such as mandolin, accordion, guitar, percussion, harp, flute, and alto saxophone in duos. The study confirmed that latency negatively affected musical involvement and caused noticeable distress among musicians. However, participants also showed a willingness to find coping mechanisms to mitigate the disruptive effects of delay.
Collectively, the hand clapping studies indicate that when delay exceeds 30 ms, synchronization fails. On the other hand, when actual musical performances are tested, the results are far more diverse, indicating that musicians may be able to adapt to growing delays, possibly by reducing their tempo; the results may also depend on the music genre and the instruments used.
To date, there appears to be no study specifically investigating how audio quality influences NMP. The majority of research in this area emphasizes latency, often selecting an acceptable audio quality level based on network conditions. Since compression is generally avoided in NMP to limit latency, we explored the impact of audio quality by varying the sampling rate. Notably, this method directly influences the transmission bitrate without adding delay; however, it does not uniformly degrade quality across the spectrum. Instead, it eliminates all frequencies above the Nyquist frequency (i.e., half the sampling rate). While prior work has linked spectral properties of NMP recordings to musicians’ perceived Quality of Experience (QoE) [12], such studies focus on the perception of delay rather than audio quality itself.
A range of objective methodologies for assessing audio quality is reviewed in [17]. Widely adopted metrics include Basic Audio Quality (BAQ), Perceptual Evaluation of Audio Quality (PEAQ), and several others [18,19]. These typically involve subjective evaluations, where participants compare a reference (ideal) audio sample with a test sample and rate the latter on a 5-point Likert scale. In domains such as voice telephony, objective models exist that estimate these quality scores without human listeners [20,21].
Another relevant question is whether musicians rely more heavily on auditory or visual cues for synchronization. A number of studies suggest that the human brain is more effective at processing auditory stimuli than visual ones in timing-related tasks. When exposed to unimodal stimuli, either auditory or visual, individuals generally exhibit more accurate synchronization with auditory cues such as beeps, compared to visual cues like light flashes [22,23]. Furthermore, research indicates that synchronization performance improves when both auditory and visual stimuli are presented together (i.e., bimodal stimuli), as this tends to reduce temporal variability compared to either modality presented alone.
A final question is whether the latency tolerances of NMP can be met by existing networks. The emergence of 5G networks, with their promises of ultra-low latencies and high bandwidth availability, make them a promising candidate for NMP [24]. A recent measurement study showed that a commercial 5G Non-Standalone network can provide median one-way delays for audio transmission only slightly over 40 ms within a cell [4]. The expectation is that 5G Standalone networks will exhibit latencies below 40 ms, which may be acceptable for NMP.
3. Experimental Setup
For our experiments, we utilized two acoustically and visually isolated rooms located on the same floor of the main building at the Athens University of Economics and Business. Musicians performed in separate rooms, communicating via headphones for audio and 32” monitors for video. We investigated two experimental conditions: in Scenario A, we varied the audio delay while maintaining constant audio quality, whereas in Scenario B, we varied the audio quality while keeping the audio delay fixed. The overall setup remained similar across both scenarios, with slight modifications depending on the parameters being tested.
In Scenario A, illustrated in Figure 1, each room was equipped with an 8-channel audio mixer responsible for routing, monitoring, and recording audio. Audio was captured using condenser microphones, and monitoring was achieved through closed-type headphones. Video was recorded using a camera in each room and transmitted as a composite analog video signal to a 32″ display in the other room (represented by red lines in the figure). The network cables from both rooms were connected directly to each other, using a twisted pair from a UTP bundle to carry the analog composite video signal, bypassing any switching equipment.
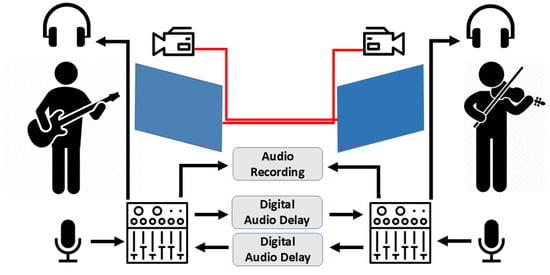
Figure 1.
Scenario A experimental setup (variable delay).
The use of composite video aimed to minimize visual latency. Analog video transmission displays content line-by-line, avoiding the buffering and processing delays inherent in digital video, which must capture, encode, transmit, decode, and render full frames. To measure round-trip video latency, we positioned a smartphone displaying a running timer in front of the video camera in one room and directed the camera in the other room at its monitor, thereby reflecting the timer image back. A separate camera recorded both the original and reflected timers. Frame-by-frame analysis of the recording showed a round-trip video delay of 30 ms, corresponding to a one-way delay of approximately 15 ms.
The audio mixers in both rooms were also connected via direct analog cabling, avoiding digital processing altogether. This configuration enabled us to achieve precise, low-latency audio transmission, with fixed delays even below 10 ms, something not feasible when routing through digital devices or switches. To control delay, we used two AD-340 analog audio delay units by Audio Research, allowing us to set exact delay values in each direction.
In Scenario B, the configuration was modified as shown in Figure 2. Audio outputs from the mixers were routed into Linux-based PCs (Intel i7 CPUs, 12 GB RAM), which ran our custom NMP software, Aretousa; this software is available upon request from the authors. The software was used solely to adjust the audio sampling rate. Importantly, no compression or additional signal processing was applied. The video setup remained identical to Scenario A, preserving the one-way delay of 15 ms. PCs were interconnected via the building’s Fast Ethernet LAN, which included three Ethernet switches along the path. Under these conditions, we measured a one-way audio delay of approximately 10 ms.
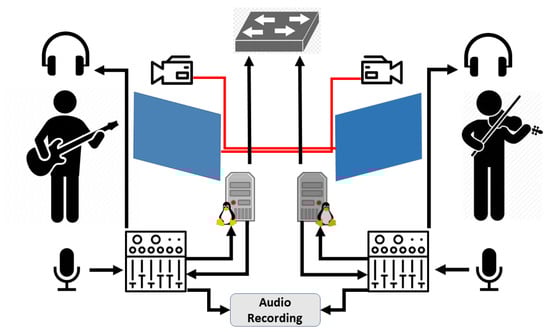
Figure 2.
Scenario B experimental setup (variable quality).
Most studies on the effects of delay on NMP focus on the one-way delay between two participants; in an audio context, we call this the Mouth to Ear (M2E) delay, as it represents the delay from the microphone of one musician to the headphones of the other musician. In practice, M2E delay is extremely hard to measure, as it requires very fine clock synchronization between the endpoints, which is only feasible with sophisticated equipment [25]. For this reason, in this work we measured My Mouth to My Ear (MM2ME) delay, which is basically the two-way version of M2E, as shown in Figure 3. MM2ME delay is easy to measure accurately, by simply reflecting the audio signal and then looking at the outgoing and incoming signal in an audio analysis application. MM2ME incorporates the possible asymmetry between the two directions; if the two directions are symmetric, which is always the case in our experiments, M2E delay is exactly half of MM2ME delay. For simplicity and easier comparison with previous work, in the rest of the paper, we only talk about and show (one-way) M2E delays, even though we measured (two-way) MM2ME delays.
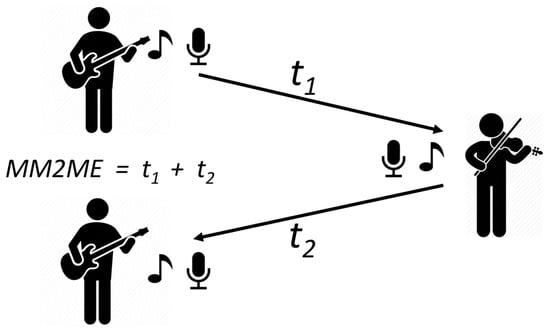
Figure 3.
My Mouth to My Ear delay.
A total of 22 musicians participated in the study, performing in pairs (11 pairs in total), with each pair consisting of musicians playing different instruments. Each duo performed a one-minute musical piece of their own choosing, following their natural tempo, and repeated it ten (10) times, each repetition corresponding to a distinct M2E audio delay setting. The specific delay values used are listed in Table 1.

Table 1.
Scenario A: M2E delays.
Subsequently, the same musical piece was performed another ten (10) times by each pair—this time under varying audio sampling rates, as shown in Table 2. No metronome or external synchronization aids were employed during the performances, allowing musicians to rely solely on the audio-visual feedback provided by the system.
Table 2.
Scenario B: sampling rates.
Following each repetition, participants completed an electronic questionnaire using a tablet’s touchscreen. The content of the questionnaire remained consistent across repetitions but was tailored based on whether the experiment varied audio delay or sampling rate (see Section 4 for details).
The musicians were not aware of the goals of the experiment or the variable manipulated in each experiment. We deliberately chose the sequence of audio delays and sampling rates so that it would appear to be random, rather than increasing or decreasing. By using a short musical piece (less than one minute) and minimal questionnaires that could be completed from where the musicians were sitting, we tried to minimize the time the musicians spent in the experiments. Our intention was to avoid tiring the musicians and prevent the introduction of any biases.
For audio delay, we used values between 0 and 60 ms. It is important to note here that musicians are used to non-zero delays due to relatively low propagation of sound compared to light: the speed of sound is 343 m/s, so in 10 ms sound travels 3.43 m. As a result, two musicians located in the same room at a reasonable distance from each other could very well experience M2E delays of 10 ms, a band on a small stage could expect M2E delays of maybe 20 ms, while a symphonic orchestra on a large stage faces delays so high that it needs a conductor to provide visual synchronization cues. The range of delays tested focused mostly on low delays to assess up to which point the QoE remains acceptable, as well as a few higher delays to see how musicians would cope with them.
On the other hand, for audio quality we used a range of standard sampling rates, plus some intermediate values. At the low end, we have voice telephony quality at 8 kHz, while at the high end, we have CD Audio quality at 44.1 kHz and Digital Audio Tape quality at 48 kHz, commonly used in motion pictures, plus 88.2 kHz, which is common in studio recording and high-end digital audio. Linear sampling with 16-bit samples was used throughout. For single channel audio, these sampling rates lead to bitrates from 128 kbps to 1.411 Mbps, which can really make a difference for the limited uplink speeds of residential DSL lines.
4. Subjective Evaluation Design
Given the diverse settings and outcomes in prior work, we chose not to rely solely on the standard Mean Opinion Score (MOS) metric for evaluating sessions. Instead, we developed a more comprehensive questionnaire to assess multiple dimensions of user perception regarding the quality and overall experience of NMP. An initial version of the questionnaire was tested in a pilot study involving four musician pairs [2]. While the pilot included more detailed questions about the participants’ musical background, we found that longer surveys led to fatigue and disengagement. Therefore, for the main study, we refined the questionnaire to focus on aspects less frequently explored in existing literature, such as feelings of irritation, anxiety, and preference between audio and video cues.
To minimize fatigue and potential bias due to repetition, we used different question sets depending on the experimental scenario: delay-related questions were used for Scenario A, and quality-related ones for Scenario B. Since each scenario included 10 repetitions, we aimed to keep the questionnaire concise and engaging. We conducted Scenario A (which involved more questions) before Scenario B.
The following subsections detail the questionnaire items, grouped into three categories: questions common to both scenarios, questions specific to Scenario A, and those specific to Scenario B.
4.1. Questions Common to Both Scenarios
Evaluate your satisfaction. The Perception of Satisfaction (PoSat) variable corresponds to the widely used MOS metric, assessed on a 5-point Likert scale (1 = very dissatisfied, 5 = very satisfied). Given the complexity of musical satisfaction, we complemented this metric with other perceptual dimensions.
Did you feel anxiety? and Did you feel irritation? Since some participants may have limited familiarity with NMP technology, we included questions addressing emotional responses. Anxiety might stem from using unfamiliar equipment, while poor audio quality or high delay could lead to irritation. Both variables were measured using a 5-point Likert scale (1 = not at all, 5 = very much).
4.2. Questions Specific to Scenario A
Evaluate the degree of delay you perceived. The Perception of Audio Delay (PoAD) variable asked participants to rate the perceived audio delay on a 5-point scale (1 = no delay, 5 = excessive delay). This helped us evaluate the alignment between actual delay settings and subjective perception.
Evaluate the degree of synchronization. Synchronization is critical in NMP. The Perception of Synchronization Degree (PoSD) metric captured the musicians’ subjective evaluation of their ability to play in sync, rated from 1 (not at all synchronized) to 5 (perfectly synchronized).
To what degree did you follow your partner? The Trying to Follow (TTF) variable assessed whether musicians adjusted their tempo to align with their partner’s playing. Prior studies suggest that higher delays lead musicians to adopt such compensatory strategies. This was rated on a scale from 1 (not at all) to 5 (completely followed).
Did you focus on video or audio? As visual cues may support synchronization [12], we examined which modality participants relied on more. Given that video delay was constant and only audio delay varied, musicians indicated their primary focus on a scale from 1 (only video) to 5 (only audio).
4.3. Questions Specific to Scenario B
Evaluate the audio quality. The Perception of Audio Quality (PoAQ) variable measured the perceived quality of the audio stream on a 5-point Likert scale (1 = very poor, 5 = excellent). Although we controlled the audio quality through sampling rate adjustments, subjective feedback was crucial. In earlier work focused solely on delay, participants sometimes misattributed degraded synchronization to poor audio quality [26].
5. Evaluation Results
We carried out NMP sessions with 22 musicians, organized into 11 duets. They performed using a diverse range of instruments, such as piano, acoustic and electric guitar, electric bass, violin, and flute, as well as traditional instruments such as the lute, toumberleki, santouri, and oud, in a variety of genres, including folk, rock and classical. Table 3 presents the musical genre selected by each duet, followed by the instruments played by the musicians. It is worth noting that the musical pieces were chosen by the musicians, allowing their performances to be aligned with their preferences and expertise.
Table 3.
Performance details for each duet.
The remainder of this section includes a representative selection of result graphs from both scenarios. Each figure shows circular dots representing the answers for each variable against the controlled variable in each case (delay for Scenario A and quality for Scenario B); the size of these dots is proportional to the number of answers we received for each value, with larger circles indicating more responses. In addition, we show the linear regression results (using the ordinary least squares method) with a blue line in each graph and a gray area indicating the 95% confidence intervals for the predicted mean, with the adjusted R2 given in the caption. The regression is performed by treating Likert scores as numeric values (1–5), which is a common practice in QoE studies; although, strictly speaking, these values are not ordinal, hence the need to show how the values are scattered using the size of the dots. Unless otherwise indicated, each graph reflects the results from all participating musicians. The graphs were created by RStudio Desktop, version 2023.03, by Posit PBC (free downloadable version), including the calculation of the linear regression lines and confidence intervals.
5.1. Scenario A: Audio Delay
The study of the effects of audio delay was the main focus of our work; therefore, the musicians responded to an extended questionnaire (see Section 4)—the results from which are presented below.
Figure 4 shows the answers to the Perception of Synchronization Degree (PoSD) question against the M2E delay; higher values indicate better synchronization. The regression line shows a clear negative relation to delay, starting at 4.3 and ending at 3, confirming that higher delays cause more synchronization problems. These results indicate a loss of synchronization when the M2E delay exceeded 40 ms, as opposed to the 25–30 ms previously reported, as the average PoSD only drops slightly between 30 and 40 ms (from 3.75 to 3.5) and the variance at 30 and 40 ms is quite similar.
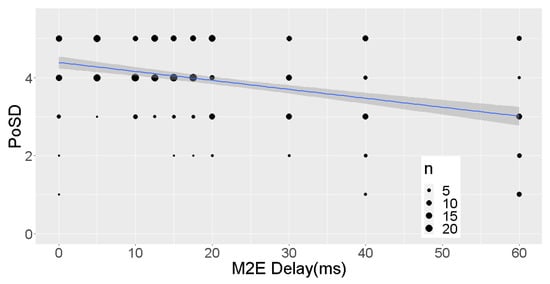
Figure 4.
Perception of synchronization degree (N = 22), 95% confidence, Adj. R2 = 0.89.
Figure 5 shows the results for the Perception of Audio Delay (PoAD) variable; higher values indicate more delay. The regression line now has a slightly increasing slope, starting at 1.4 and ending at 2.4. We again see a small change between the results for M2E delays of 30 and 40 ms (both very close to 2), which implies that a one-way delay of 40 ms is nearly as acceptable as 30 ms. Note that the confidence intervals around the fitted line are wider than for the PoSD variable but still quite narrow for most M2E delay values.
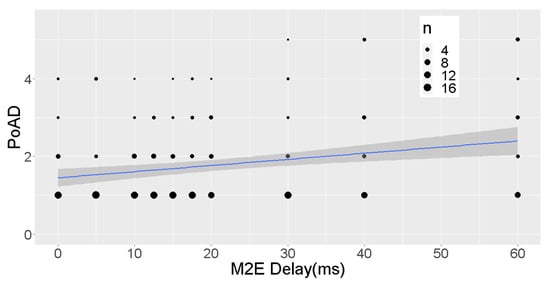
Figure 5.
Perception of Audio Delay (N = 22), 95% confidence, Adj. R2 = 0.85.
Focusing specifically on the sessions that involved pianists (duets 1, 2, and 5), the responses from both the pianists and their partners (a total of six participants), presented in Figure 6, reveal a steeper increase in perceived delay, from 1.5 to 3.4. The corresponding confidence intervals are broader, reflecting the smaller sample size and greater variability in responses. This finding suggests that the perception of delay is context-dependent; in particular, the presence of a pianist in the ensemble appears to heighten performers’ sensitivity to audio delay.
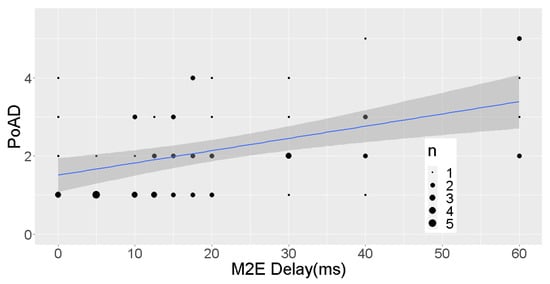
Figure 6.
Perception of audio delay (pianists and partners, N = 6), 95% confidence, Adj. R2 = 0.79.
Arguably, the most critical variable in our study is the Perception of Satisfaction (PoSat), which effectively corresponds to the widely used MOS metric. As illustrated in Figure 7, the regression line exhibits a gentle downward trend, decreasing from an initial score of 4 to approximately 3.4. The difference in perceived satisfaction between 30 ms and 40 ms one-way delays is minimal, suggesting that musicians generally tolerate delays up to 40 ms without significant discomfort. While the decline from 40 ms to 60 ms is also modest, the contrast between 30 ms and 60 ms is more pronounced. These results indicate that, rather than a sharp threshold at 30 or 40 ms, satisfaction decreases progressively with increasing delay. Nonetheless, 40 ms emerges as a practical upper bound for maintaining synchronous performance in rhythmically demanding musical contexts.
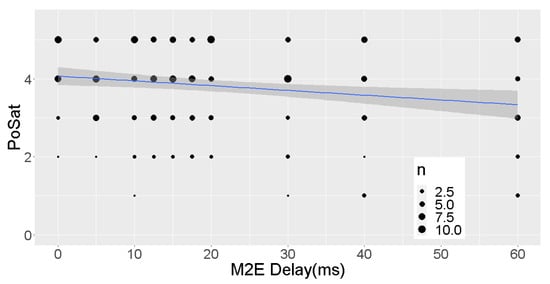
Figure 7.
Perception of satisfaction (N = 22), 95% confidence, Adj. R2 = 0.86.
When we focus again on pianists and their partners for the PoSat variable, Figure 8 shows a regression line with a steeper slope, starting at 4.7 and ending at slightly less than 2.9, again with wider confidence intervals, confirming the lower tolerance to delay that was also indicated by the responses to the PoAD variable.
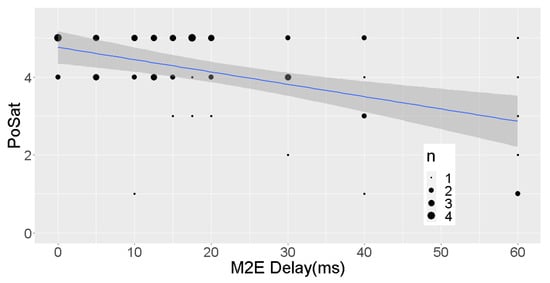
Figure 8.
Perception of satisfaction (Pianists and Partners, N = 6), 95% confidence, Adj. R2 = 0.88.
In Figure 9, we can see the results for the I was Trying to Follow my partner (TTF) question. The regression line has a positive slope, similar to that of PoAD in Figure 5, but starting from 2.8 and ending at 3.9. The responses are widely spread for all M2E delays, as indicated by the dispersion and sizes of the dots, showing a split between leading and following; this is similar to what we would see in a non-NMP scenario. However, at 40 ms, and even more clearly at 60 ms, we see more answers with higher scores, indicating that as synchronization is lost, each musician relies more on the other one.
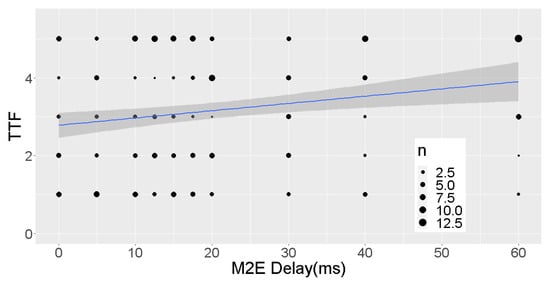
Figure 9.
Results for the ‘I was trying to follow my partner’ question (N = 22), 95% confidence, Adj. R2 = 0.85.
An issue that has not been considered in previous studies is whether musicians focus more on aural or visual contact during an NMP session. Figure 10 shows the answers to the Did you focus on audio or video? question. The regression line is nearly flat at 4.3 with low variance, implying a very strong preference for audio contact, even though the video delay was only 15 ms, while the audio delay increased all the way up to 60 ms. This is clear evidence that musicians in an NMP setting mostly rely on aural rather than visual cues for synchronization, amplifying the conclusions of previous research indicating that synchronization relies more on aural cues.
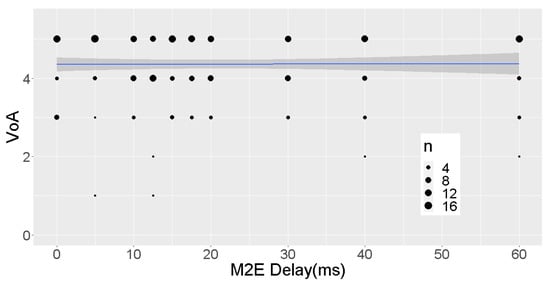
Figure 10.
Focus on audio or video (N = 22), 95% confidence, Adj. R2 = −0.14.
Figure 11 shows the results for the Did you feel anxiety? question, where the regression line is almost horizontal at 1.2, indicating nearly zero anxiety. This is complemented by Figure 12, which shows the results for the Did you feel irritation? question, where the regression lines go from 1 to 1.7, even at the largest M2E delay values, indicating no to minor irritation. These responses show that the musicians felt comfortable performing with our NMP setup, thus allowing us to place more trust in the responses to the other results, as past studies have found that when participants are uneasy during their performance, they provide lower scores to other (often, unrelated) questions.
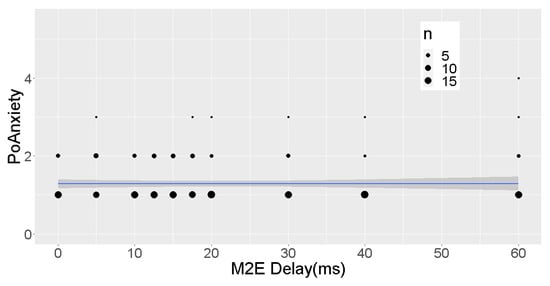
Figure 11.
Perception of anxiety (N = 22), 95% confidence, Adj. R2 = −0.06.
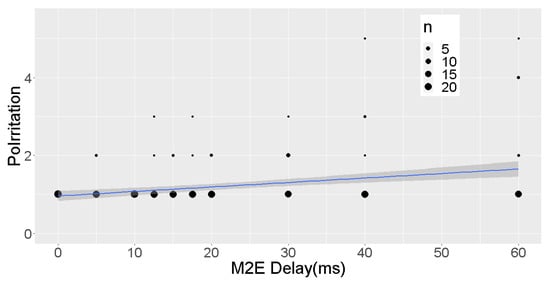
Figure 12.
Perception of irritation (N = 22), 95% confidence, Adj. R2 = 0.96.
To assess the statistical significance of our findings, we conducted a repeated measures ANOVA study. The independent variable in this analysis was the audio delay, while the dependent variables included Perception of Synchronization Degr (PoSD), Perception of Audio Delay (PoAD), Perception of Satisfaction (PoSat), and Trying to Follow (TTF). We excluded the remaining variables from this analysis, as their regression trends did not suggest any correlation with delay. The results, encompassing all 22 participants, are presented in Table 4.
Table 4.
ANOVA results: delay vs. subjective results.
As shown, most p-values fall below the standard significance threshold of 0.05, suggesting a strong likelihood of correlation between the respective variable and audio delay. The only exception is PoSat, which yielded a p-value of 0.819. This lack of statistical significance can be explained by the generally high satisfaction scores observed across all delay conditions, even the largest ones.
5.2. Scenario B: Audio Quality
The investigation of audio quality effects was a secondary objective in our study. Our primary aim was to determine the extent to which musicians can tolerate audio quality degradation in NMP scenarios, thereby avoiding the additional delays introduced by audio compression and decompression. Consequently, the audio quality experiments were conducted after the audio delay tests and employed a shorter questionnaire (see Section 4); the corresponding results are presented in this section.
Figure 13 illustrates the results for the Perception of Audio Quality (PoAQ) in relation to the sampling rate. It is important to note that, in this case, the experimental conditions improve towards the right side of the figure (i.e., higher sampling rates). The regression line displays a very slight positive slope, with ratings remaining close to three across all sampling rates. This suggests that the perceived improvements in audio quality were minimal for most participants. However, when examining only the pianists and their partners, Figure 14 reveals a more noticeable upward trend, indicating that this subgroup was more sensitive to variations in audio quality.
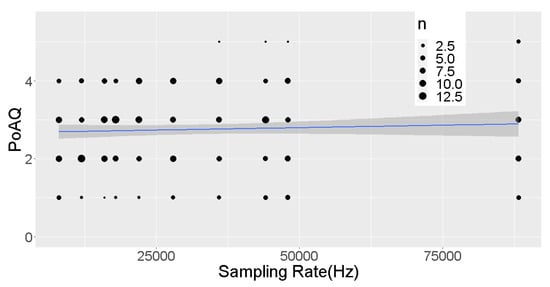
Figure 13.
Perception of audio quality (N = 22), 95% confidence, Adj. R2 = 0.17.
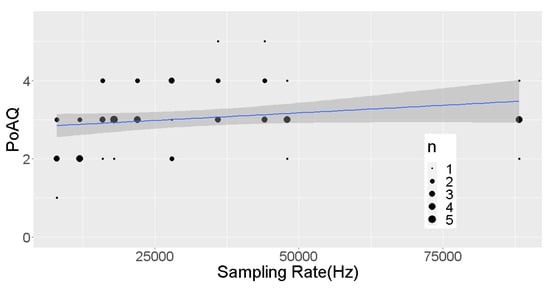
Figure 14.
Perception of audio quality (pianists and partners, N = 6), 95% confidence, Adj. R2 = 0.03.
Similarly, Figure 15 presents the results for the Perception of Satisfaction (PoSat), our MOS indicator, as a function of the sampling rate. The regression line also shows a modest positive trend, with scores ranging from 3.2 to 3.5. Interestingly, when focusing on pianists and their partners, the trend becomes almost flat, as shown in Figure 16, suggesting that audio quality had little influence on their overall satisfaction. This further supports the observation that changes in audio quality had a limited impact, even though the sampling rate varied by an order of magnitude.
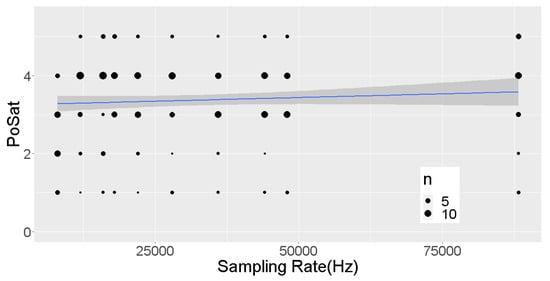
Figure 15.
Perception of satisfaction (N = 22), 95% confidence, Adj. R2 = 0.17.
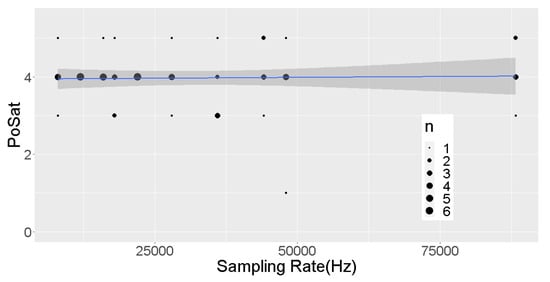
Figure 16.
Perception of satisfaction (pianists and partners, N = 6), 95% confidence, Adj. R2 = 0.03.
To ensure that musicians were not negatively affected by the experimental setup itself, we also measured their perceived levels of anxiety (Figure 17) and irritation (Figure 18) throughout the sessions. Both regression curves exhibit a slight negative slope, and average scores remain consistently close to 1, indicating little to no anxiety or irritation. This strengthens the reliability of the reported findings by confirming that participant discomfort did not influence the results.
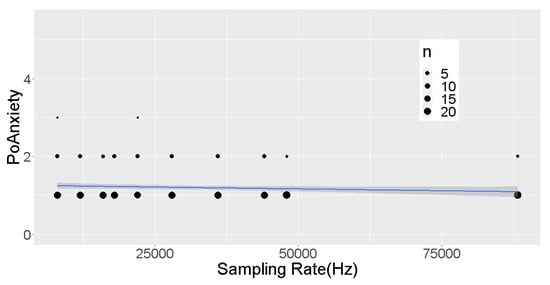
Figure 17.
Perception of anxiety (N = 22), 95% confidence, Adj. R2 = 0.47.
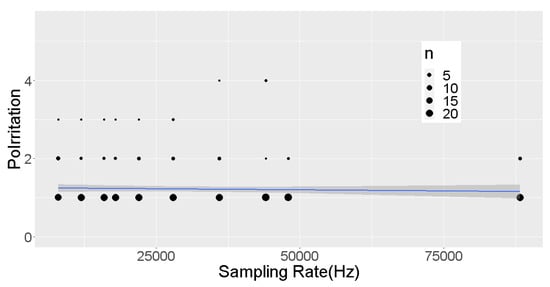
Figure 18.
Perception of irritation (N = 22), 95% confidence, Adj. R2 = −0.01.
Finally, we assessed the statistical significance of these results by performing an ANOVA study for repeated measures; the independent variable was audio quality (i.e., sampling rate,) and the dependent variable was PoAQ or PoSat. As in the audio delay tests, we did not run the variables that were clearly uncorrelated with audio quality. We show the results for these variables (including all 22 participants) in Table 5. We can see that both p values are greater than 0.05, which is what we would expect from the very slight slopes in the regression lines shown in the graphs above. This implies that we can reduce the sampling rate in NMP without significantly reducing the QoE of the musicians. This is a very interesting observation, as reducing the audio bitrate without the delays induced by compression makes NMP more practical in limited bandwidth scenarios.
Table 5.
ANOVA results: quality vs. subjective results.
6. Discussion
Below, we discuss the statistically significant results for the QoE against audio delay (scenario A) and the QoE against quality (scenario B) and then provide some guidance on setting up future experiments based on our experience.
6.1. Audio Delay
PoSD reflects the musicians’ perception of synchronization issues when performing with variable delay. Our study shows a relatively high tolerance for delay among musicians, higher than that found in previous studies of synchronized hand-clapping with non-musicians. We can attribute this tolerance to enhanced cognitive flexibility [27] developed during their training. Because of this flexibility, musicians could effectively use their cognitive resources to deal with audio delays during the performances in this study. It seems, however, that delays above 40 ms one-way were more problematic; unfortunately, we did not test delays between 40 and 60 ms. At this point, the cognitive load to constantly adjust performance for the delay becomes too great, making it challenging to continue playing. While the enhanced cognitive flexibility plays a significant role, other factors such as the musician’s adaptability, the complexity of the musical piece and the specific context of the performance in the lab also affected how musicians handled the synchronization challenges caused by audio delay in the study.
The PoAD variable measures musicians’ perception of audio delays, which impact their timing and rhythm during performances. The study found a threshold of 40 ms one-way audio delay as acceptable for music performances, higher than that considered acceptable for synchronized hand-clapping. This threshold might show the limit to which the human sensorimotor system can adapt without impacting the perception of musical rhythm [28]. Delays under this threshold could be small enough for the brain’s timing mechanisms to compensate, enabling musicians to adjust during their performance. Entrainment is how the brain synchronizes with the music’s rhythm. Predictive coding allows the brain to use past experiences to predict future events [29,30]. Combining these two mechanisms facilitates the coordination of motor responses, even with slight delays. However, beyond the threshold, musicians start noticing the delays and find them disruptive, which hinders their rhythm perception and synchronization with their peers.
TTF captures the efforts of musicians to synchronize with their peers in the face of variable delays. When the delay exceeds 40 ms one way, musicians must use more cognitive resources, like sustained attention and cognitive control, to keep up with their peers. Up to this specific threshold of 40 ms one way, musicians can handle complex synchronization tasks like TTF because of their musical training [31]. Musicians have enhanced abilities for tasks that need cognitive flexibility and control, which are crucial in complex synchronization tasks like TTF. Past the threshold, synchronization becomes more challenging, possibly because the cognitive load is too high to handle effectively while maintaining other parts of the musical performance (e.g., expression, accuracy and technical precision).
6.2. Audio Quality
Our study found statistically significant results on the impact of delay on the QoE of musicians, but not on the audio quality. The lack of statistical significance could be due to several reasons:
- Limitations of the subjective evaluation: The questionnaires used in the study were not explicitly designed to capture the emotions of musicians during the performance of a musical piece. Therefore, there may be a gap in understanding how varying audio quality affected the emotional dimensions of musical performances (e.g., dynamics, articulation, and timbre) [32]. The impact of audio quality on these elements could, in turn, significantly influence the emotional connection among musicians.
- Nature of NMP: In NMP, real-time interaction and coordination are more critical than audio quality. Musicians could adapt to less-than-perfect audio quality as long as they could maintain the necessary temporal coordination for their performance.
- Sensitivity to delay vs. audio quality: Musicians are typically more sensitive to timing issues than audio quality. While high audio quality is desirable, the ability to play in time with a peer is more critical for a successful performance [33]. Therefore, variations in delay are likely to have a more significant impact on QoE than audio quality.
- Focus and adaptation: Musicians focusing on timing and coordination may be less attuned to audio quality. Also, they may adapt to the variable audio quality while performing, reducing its perceived impact.
- The perceptual threshold for audio quality: The changes in audio quality were within what musicians considered acceptable. The quality degradation did not cross the threshold of what musicians would find troubling, leading to insignificant findings related to its impact on QoE.
6.3. Lessons Learned
Our study of the effects of audio delay and audio quality on the QoE of NMP took place with actual musicians that had no previous experience with such studies or with remote performance. Some of the tips that we could offer to researchers undertaking similar studies are the following:
- Start with a small pilot study. Studies where the participants must travel to your premises to run experiments are costly to organize and execute, therefore it is critical to first test your setup with fewer participants. This allows you to debug your experimental setup (does the audio and video get recorded properly?) and assess your questionnaire (are all the questions relevant?).
- Manage the expectations of participants. Explain to the participants what they need to know (you will perform with your own instrument, you will be recorded, there will be 20 repetitions of the performance, the experiment will take 30 min), without telling them what they should not know (we will be changing the audio delay) to avoid bias.
- Fine-tune your experimental setup. Participants get easily bored during experiments; therefore, it is important that the questionnaires are short (otherwise, participants start providing random answers) and the setup between experiments is streamlined (otherwise, mistakes may be made, causing delays and the need for additional repetitions). This is where the pilot study helps.
- Record everything. Most usability studies rely on questionnaires, but the cost of also recording audio and video is low enough to allow recording everything (of course, the participants must provide informed consent for this). Having these recordings allows troubleshooting (why did I get odd answers to this questionnaire?) and may even allow different modes of analysis (such as audio tempo evolution, which we did not even consider before the experiments).
- Consider alternative experimental designs. Future work could unify delay and sampling rate variations in a single setup, allowing the application of MANOVA or factor analysis on a reduced set of dependent variables. This might reveal interactions between delay and quality that were impossible to notice in our study where two different setups were used to vary audio delay and audio quality.
7. Conclusions and Future Work
This paper presents the results from a controlled NMP experiment with 11 pairs of musicians (22 musicians in total), where we varied either the audio delay or the audio quality between the participants and measured multiple quality of experience variables via questionnaires. The musicians played different instruments in different musical genres. To the best of our knowledge, this was the largest NMP study where actual musicians played real musical pieces and the analysis was performed with multi-faceted questionnaires.
The questionnaires completed by the participants indicate that even though growing delays between the musicians affect their quality of experience, the tolerance level of musicians to delay can be higher than what has previously been reported by studies relying on synchronized hand clapping. While there is no abrupt threshold, we found that one-way (M2E) delays of 40 ms still yielded a positive QoE for many participants. The participants in our NMP study found that their performances were synchronized and satisfactory even when the one-way (M2E) delay reached 40 ms. This indicates that the Ensemble Performance Threshold (EPT) for NMP is at least 40 ms, for a wide range of instruments and musical pieces, rather than the 25–30 ms previously cited in the literature, which was based on hand-clapping studies. This supports our initial hypothesis H1, rejecting N1.
We also found that reducing audio quality did not affect the quality of experience of the musicians, even when the sampling rate dropped from 88.2 kHz to 8 kHz, an order of magnitude decrease in bitrate. However, certain subsets of participants (notably pianists) were more sensitive to these changes, suggesting that recommended sampling rates may need to account for timbral detail and instrument type. This implies that when the available bandwidth for an NMP session is limited, or when low-latency CPU processing is a priority, we can save bandwidth by reducing the audio sampling rate, with no appreciable loss in QoE and without introducing an audio compression/decompression algorithm that would impose additional delay. This supports our initial hypothesis H2, rejecting N2.
We have also analyzed the audio files recorded during our variable delay experiments, using signal processing techniques, in order to detect the musician’s tempo, observe how it changes throughout each session and compare it with the actual delay used [34]. We verified that musicians slow down their tempo when delay grows, something observed in many previous studies. In addition, we found that most musicians could synchronize and maintain a stable tempo when the delay was up to 40 ms but not when it grew to 60 ms. This strengthens the results of the QoE analysis in this paper (hypothesis H1), i.e., that the delay threshold for NMP when actual musical pieces are performed, is closer to 40 ms. As the 40 ms EPT is very close to what we have measured that a commercial 5G Non-Standalone network can provide in real-world conditions [4], we expect that as 5G Standalone networks are deployed, offering improved and more predictable latencies, mobile NMP will become a reality.
As future work, exploring the relationship between the instrument, style and tempo and the QoE is an obvious direction; we already saw that pianists and their partners were more influenced by delay in this study, an observation that we attribute to their lengthier and more formal training. However, this analysis requires performing a much larger number of experiments in order to allow for statistically significant results. Ideally, our setup will be duplicated by other research groups, adding more observations to our data set. We are also analyzing the videos recorded during our experiments with machine learning-based emotion recognition tools, which first recognize facial features and then translate them into emotions.
Furthermore, in future studies we plan to introduce compressed audio, using the Opus codec [3], especially after finding that musicians are quite tolerant of reduced audio quality. We will use the Perceptual Evaluation of Audio Quality (PEAQ) tool [35] and possibly the more advanced Multiple Stimuli with Hidden Reference and Anchor (MUSHRA) [36] to objectively measure how compression and encoding impact perceived QoE in a performance context, while also analyzing the additional delays from low-latency encoders. This approach should help us better determine which types of audio compression are most likely to affect human musicians in an NMP setting.
Author Contributions
Conceptualization, K.T. and G.X.; methodology, K.T. and I.D.; software, K.T.; validation, K.T., G.X. and I.D.; writing—original draft preparation, K.T.; writing—review and editing, K.T. and G.X.; visualization, K.T.; supervision, G.X. All authors have read and agreed to the published version of the manuscript.
Funding
This research received no external funding.
Data Availability Statement
The original data presented in the study are openly available in GitHub, at https://github.com/mmlab-aueb/nmp/tree/master/Datasets/audio, accessed on 18 July 2025.
Conflicts of Interest
The authors declare no conflict of interest.
References
- Schuett, N. The Effects of Latency on Ensemble Performance. Bachelor’s Thesis, CCRMA Department of Music, Stanford University, Stanford, CA, USA, 2002. [Google Scholar]
- Tsioutas, K.; Xylomenos, G.; Doumanis, I.; Angelou, C. Quality of Musicians’ Experience in Network Music Performance: A Subjective Evaluation. In Proceedings of the 148th Audio Engineering Society Convention, Online, 2–5 June 2020. [Google Scholar]
- Valin, J.; Vos, K.; Terriberry, T. Definition of the Opus Audio Codec; Technical Report; RFC6716; Internet Engineering Task Force: Fremont, CA, USA, 2021. [Google Scholar] [CrossRef]
- Tsioutas, K.; Thomas, Y.; Bistas, F.; Barous, I.; Xylomenos, G.; Polyzos, G.C. Network Music Performance Beyond 4G. In Proceedings of the 21st International Wireless Communications and Mobile Computing Conference (IWCMC), Abu Dhabi, United Arab Emirates, 12–16 May 2025. [Google Scholar]
- Rottondi, C.; Chafe, C.; Allocchio, C.; Sarti, A. An Overview on Networked Music Performance Technologies. IEEE Access 2016, 4, 8823–8843. [Google Scholar] [CrossRef]
- Chafe, C.; Gurevich, M. Network Time Delay and Ensemble Accuracy: Effects of Latency, Asymmetry. In Proceedings of the 117th Audio Engineering Society Convention, San Francisco, CA, USA, 28–31 October 2004. [Google Scholar]
- Driessen, P.F.; Darcie, T.E.; Pillay, B. The Effects of Network Delay on Tempo in Musical Performance. Comput. Music J. 2011, 35, 76–89. [Google Scholar] [CrossRef][Green Version]
- Farner, S.; Solvang, A.; Sæbø, A.; Svensson, U.P. Ensemble Hand-Clapping Experiments under the Influence of Delay and Various Acoustic Environments. J. Audio Eng. Soc. 2009, 57, 1028–1041. [Google Scholar]
- Gurevich, M.; Chafe, C.; Leslie, G.; Tyan, S. Simulation of Networked Ensemble Performance with Varying Time Delays: Characterization of Ensemble Accuracy. In Proceedings of the International Computer Music Conference, Miami, FL, USA, 1–6 November 2004. [Google Scholar]
- Barbosa, A.; Cardoso, J.; Geiger, G. Network Latency Adaptive Tempo in the Public Sound Objects System. In Proceedings of the International Conference on New Interfaces for Musical Expression, Vancouver, BC, Canada, 26–28 May 2005; pp. 184–187. [Google Scholar]
- Barbosa, A.; Cordeiro, J. The Influence of Perceptual Attack Times in Networked Music Performance. In Proceedings of the AES International Conference, San Diego, CA, USA, 18–20 November 2011. [Google Scholar]
- Rottondi, C.; Buccoli, M.; Zanoni, M.; Garao, D.; Verticale, G.; Sarti, A. Feature-Based Analysis of the Effects of Packet Delay on Networked Musical Interactions. J. Audio Eng. Soc. 2015, 63, 864–875. [Google Scholar] [CrossRef]
- Carôt, A.; Werner, C.; Fischinger, T. Towards a Comprehensive Cognitive Analysis of Delay-Influenced Rhythmical Interaction. In Proceedings of the International Computer Music Conference, Montreal, QC, Canada, 16–21 August 2009. [Google Scholar]
- Olmos, A.; Brulé, M.; Bouillot, N.; Benovoy, M.; Blum, J.; Sun, H.; Lund, N.W.; Cooperstock, J.R. Exploring the role of latency and orchestra placement on the networked performance of a distributed opera. In Proceedings of the Annual International Workshop on Presence, Los Angeles, CA, USA, 11–13 November 2009. [Google Scholar]
- Bartlette, C.; Headlam, D.; Bocko, M.; Velikic, G. Effect of Network Latency on Interactive Musical Performance. Music Percept. Interdiscip. J. 2006, 24, 49–62. [Google Scholar] [CrossRef]
- Delle Monache, S.; Buccoli, M.; Comanducci, L.; Sarti, A.; Cospito, G.; Pietrocola, E.; Berbenni, F. Time is not on my side: Network latency, presence and performance in remote music interaction. In Proceedings of the XXII Colloquium on Musical Informatics (CIM), Udine, Italy, 20–23 November 2018; pp. 20–23. [Google Scholar]
- Torcoli, M.; Kastner, T.; Herre, J. Objective Measures of Perceptual Audio Quality Reviewed: An Evaluation of Their Application Domain Dependence. IEEE/ACM Trans. Audio Speech Lang. Process. 2021, 29, 1530–1541. [Google Scholar] [CrossRef]
- Vincent, E.; Jafari, M.; Plumbley, M. Preliminary guidelines for subjective evaluation of audio source separation algorithms. In Proceedings of the UK ICA Research Network Workshop, Liverpool, UK, 18–19 September 2006. [Google Scholar]
- ITU-R. BS.1534-3: Method for the Subjective Assessment of Intermediate Quality Level of Audio Systems; Technical Report; ITU Radiocommunication Standardization Sector: Geneva, Switzerland, 2015. [Google Scholar]
- ITU-T. P.862: Perceptual Evaluation of Speech Quality (PESQ): An Objective Method for End-to-End Speech Quality Assessment of Narrowband Telephone Networks and Speech Codecs; Technical Report; ITU Telecommunication Standardization Sector: Geneva, Switzerland, 2001. [Google Scholar]
- Bergstra, J.A.; Middelburg, C.A. ITU-T Recommendation G.107: The E-Model, a Computational Model for Use in Transmission Planning; Technical Report; ITU Telecommunication Standardization Sector: Geneva, Switzerland, 2003. [Google Scholar]
- Repp, B.H.; Penel, A. Auditory dominance in temporal processing: New evidence from synchronization with simultaneous visual and auditory sequences. J. Exp. Psychol. Hum. Percept. Perform. 2002, 28, 1085–1099. [Google Scholar] [CrossRef]
- Repp, B.H.; Penel, A. Rhythmic movement is attracted more strongly to auditory than to visual rhythms. Psychol. Res. 2004, 68, 252–270. [Google Scholar] [CrossRef] [PubMed]
- Baratè, A.; Haus, G.; Ludovico, L. Advanced Experience of Music through 5G Technologies. IOP Conf. Ser. Mater. Sci. Eng. 2018, 364, 012021. [Google Scholar] [CrossRef]
- Carôt, A.; Hoene, C.; Busse, H.; Kuhr, C. Results of the Fast-Music Project—Five Contributions to the Domain of Distributed Music. IEEE Access 2020, 8, 47925–47951. [Google Scholar] [CrossRef]
- Tsioutas, K.; Doumanis, I.; Xylomenos, G. A Framework for Understanding and Defining Quality of Musicians Experience in Network Music Performance Environments. In Proceedings of the 146th Audio Engineering Society Convention, Dublin, Ireland, 20–23 March 2019. [Google Scholar]
- Hao, J.; Zhong, Y.; Pang, Y.; Jing, Y.; Liu, Y.; Li, H.; Li, J.; Zheng, M. The relationship between music training and cognitive flexibility: An ERP study. Front. Psychol. 2023, 14, 1276752. [Google Scholar] [CrossRef] [PubMed]
- Ross, J.M.; Balasubramaniam, R. Time perception for musical rhythms: Sensorimotor perspectives on entrainment, simulation, and prediction. Front. Integr. Neurosci. 2022, 16, 916220. [Google Scholar] [CrossRef] [PubMed]
- Tierney, A.; Kraus, N. Neural entrainment to the rhythmic structure of music. J. Cogn. Neurosci. 2015, 27, 400–408. [Google Scholar] [CrossRef] [PubMed]
- Millidge, B.; Seth, A.; Buckley, C.L. Predictive coding: A theoretical and experimental review. arXiv 2021, arXiv:2107.12979. [Google Scholar]
- Zuk, J.; Benjamin, C.; Kenyon, A.; Gaab, N. Behavioral and neural correlates of executive functioning in musicians and non-musicians. PLoS ONE 2014, 9, e99868. [Google Scholar] [CrossRef] [PubMed]
- Marchant, N.; Grüning, D.J.; Kaemmerer, M.; Luminet, O. Perceiving emotions in music: Effects of sound quality, alexithymia, and empathy. PsyArXiv 2023. [Google Scholar] [CrossRef]
- Gabrielsson, A. Timing in music: Performance and experience. J. Acoust. Soc. Am. 1987, 81, S90–S91. [Google Scholar] [CrossRef]
- Tsioutas, K.; Xylomenos, G. Assessing the Effects of Delay to NMP via Audio Analysis. Springer Nat. Comput. Sci. 2023, 4, 126. [Google Scholar] [CrossRef] [PubMed]
- Delgado, P.M.; Herre, J. Can we still use PEAQ? A performance analysis of the ITU standard for the objective assessment of perceived audio quality. In Proceedings of the Twelfth International Conference on Quality of Multimedia Experience (QoMEX), Athlone, Ireland, 26–28 May 2020; IEEE: Piscataway, NJ, USA, 2020; pp. 1–6. [Google Scholar]
- Goot, D.K.; Chaubey, H.; Hsu, T.Y.; Deal, W.S. A perceptual evaluation of music real-time communication applications. IEEE Access 2023, 11, 46860–46870. [Google Scholar] [CrossRef]
Disclaimer/Publisher’s Note: The statements, opinions and data contained in all publications are solely those of the individual author(s) and contributor(s) and not of MDPI and/or the editor(s). MDPI and/or the editor(s) disclaim responsibility for any injury to people or property resulting from any ideas, methods, instructions or products referred to in the content. |
© 2025 by the authors. Licensee MDPI, Basel, Switzerland. This article is an open access article distributed under the terms and conditions of the Creative Commons Attribution (CC BY) license (https://creativecommons.org/licenses/by/4.0/).