Abstract
Network digital twins (NDTs) are emerging as key enablers of 6G networks integrating artificial Intelligence (AI) techniques. NDT systems offer novel features, including real-time monitoring, simulation, enhanced network planning, autonomous management, seamless integration with emerging technologies such as extended reality (XR), among others. When NDTs converge with XR, NDTs can be customized with additional interactive services that are not available in the original network. In this work, artificial intelligence (AI) strategies are applied to a set of XR functions within federated NDTs. While existing NDT approaches follow a one-to-one (1:1) model, where a single NDT instance is deployed from an original network, the one-to-many (1:N) federation model requires the orchestration of multiple XR-tailored NDT instances. The federation of NDTs can be applied across diverse 6G use cases, including telemedicine, UAV management, Industry 4.0, and the remote driving of complex vehicles. Ensuring the optimal operation of the NDT federation requires a methodology tailored to the requirements of each use case. This paper introduces a score-based performance analysis to quantify the benefits achieved through NDT federation. Unlike existing models for the digital twin (DT) federation, this paper introduces a KPI-based rational model that quantifies the trade-off between federation benefits and the associated operational complexity. A mathematical analysis is performed to validate the consistency of the score formula both in general terms and within the context of each specific use case.
1. Introduction
The evolution of the digital twin concept [] applied to communication networks has led to the emergence of the network digital twin (NDT) paradigm [,,], envisioned as a key enabler for 6G networks. The motivation for applying the DT paradigm to communication networks lies in the search for intelligent, real-time, and automated network management for future AI-based 6G networks. Recent studies highlight the potential of DT-based solutions to address the growing complexity of communication network management. Article [] proposes a DT framework in multi-UAV networks that enables collaboration, distribution of processing tasks, and reduced processing costs. Paper [] introduces a federated learning (FL) system empowered by DTs to mitigate delay effects in edge-enabled computing power networks. In [], the utilization of DT modeling is proposed to offload computational tasks by industrial Internet of Things (IIoT) devices to edge stations to reduce transfer delay and optimize spectrum utilization. The key features of NDTs include zero-touch management, optimized network planning, network simulation, network prediction, and adaptability. The NDT architecture provides flexibility for integration with different technologies. The combination of NDTs with extended reality (XR) transforms them from simple replicas of the original network (ON) into custom XR systems tailored for specific interactive and remote collaborative tasks. Therefore, XR-NDTs are introduced as powerful tools for optimizing network operations while offering XR services that are exclusively deployed in the NDT and for which their actions are then replicated in the ON. The implemented XR functions provide immersive and intuitive control of operations for different use cases, such as telemedicine and healthcare, space exploration, autonomous and assisted driving, and even AI operations.
The NDT concept has emerged recently and has not yet been widely exploited. Typically, NDTs are realized in a one-to-one (1:1) model: From the ON, a single NDT instance is deployed. It should be emphasized that in the 1:1 model, multiple NDT instances may run in parallel; however, they operate independently mainly for simulation-based analyses rather than collaboratively. Then, the one-to-many (1:N) model is introduced to fully exploit the potential of collaborative XR-NDTs; from a single ON, multiple and simultaneous NDT instances are deployed, with each replica customized with specific XR functions. Therefore, the 1:N model enables the deployment of collaborative real-time remote scenarios that could be exploited in practical and industrial use cases such as telemedicine and telesurgery, UAV-assisted control, Industry 4.0, and smart cities, among others. However, the coexistence of multiple NDTs must ensure both consistency and safe, non-blocking operation, which motivates the introduction of the NDT federation concept. To achieve XR-NDT federation, two main entities are required: the digital twin manager (DTM) and the extended reality manager (XRM) []. The XRM, deployed for each NDT replica, handles resource provisioning and XR services deployment for tailored tasks, while the DTM ensures individual NDT operation (1:1 mode) and federation consistency across all NDT instances. Figure 1 shows the expanded 1:N model; note that each NDT has its own XRM, while all XR-NDTs are federated by a single DTM.
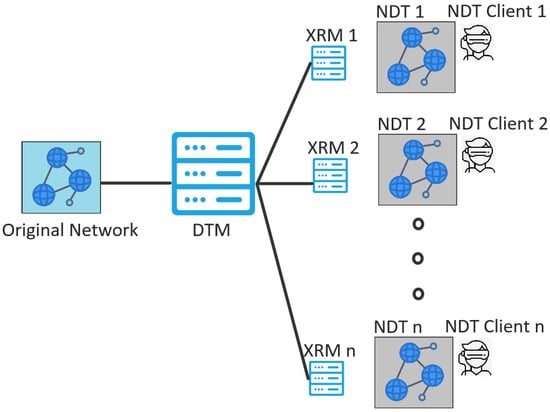
Figure 1.
Expanded network digital twin (1:N).
As previously stated, the federation of multiple XR-NDTs results in an immersive, real-time, and remote collaborative environment intended to reduce operational costs, minimize intervention times, and provide intuitive interactions, among many other benefits. Nevertheless, federation introduces extra complexity, higher communication and computational costs, and additional signaling overheads, among others; therefore, it is necessary to determine the total profit achieved with the federation. Subsequently, this paper introduces a general rational equation based on heterogeneous key performance indicators (KPIs) to compute federation performance as a score and estimate the maximum number of NDTs that can be orchestrated simultaneously.
The main contributions of this paper are summarized as follows:
- A novel methodology to quantify the performance of a federated DT environment is proposed, supported by a rational equation. The proposal is applied to an expanded specific DT application: an XR-NDT system.
- The proposed rational equation is based on KPIs. On the one hand, KPIs provide insight about the enhancements provided by an NDT federated system while considering the integration of XR technology with the NDT paradigm. On the other hand, KPIs related to the constraints for supporting a federated ecosystem are considered. Therefore, the rational model provides a cost–benefit relationship that results in more accurate performance quantification.
- A stochastic analysis based on the beta probability density function (PDF) is developed to realize KPI variability and their relevance to the global federation score.
- A mathematical study of the rational model is conducted, including convexity and concavity analyses, as well as envelope functions that define upper and lower performance boundaries as the number of XR-NDT instances increases.
- Validation of 6G Use Cases: The proposed model is applied to three relevant 6G scenarios: tele-surgery, space exploration, and smart city control. This validation demonstrates the adaptability of the score model.
The remainder of this paper is organized as follows. Section 2 introduces the background and state of the art. Section 3 presents the model of the equation to compute the global XR-NDT federation score. Section 4 develops a stochastic analysis to characterize the impact of each KPI on the performance score. Section 5 presents some mathematical properties of the score model. Section 6 applies the model score equation to different use cases. Finally, Section 7 discusses the conclusions and future work.
2. Background and Related Work
The network digital twin (NDT) is an emerging paradigm derived from the application of the DT concept to communication networks; thus, the NDT is realized as a mirror of an existing (ON) network that can be physical or virtual []. Their flexible architecture and their enhanced features position NDTs as a key enabler for 6G networks and future applications [,,]. Coupling DTs with XR enables immersive and intuitive applications; this integration can be extended to NDTs due to their flexible architectures. Among the different applications that can be improved through DT-XR integrations are smart cities, healthcare, autonomous and assisted driving, space exploration, and Internet of Things (IoT) scenarios []. In [], an efficient mechanism for resource allocation is proposed in vehicular NDT systems based on multi-agent AI-based learning models and edge computing techniques, optimizing DT maintenance and offloading processing capabilities.
Current studies have focused on the concept of a federation of DTs; although this paper discusses the federation of NDTs, previous studies provide a useful baseline. Several DT federation architectures have been proposed, such as the federated DT system introduced in [] to manage interconnected digital systems. Reference [] discusses a “horizontal” architecture that allows stakeholders to share DT data and enrich other models collaboratively based on the concept of information aggregation. Paper [] proposes a vertical hierarchical DT architecture for Society 5.0, enhancing the granularity of the model by integrating physical and virtual ecosystems. A DT federation platform is presented in [] based on DevOps platforms to automate the management and validation of multiple and simultaneous DT models. The heterogeneity among multiple DTs is addressed in [] using federated learning and deep neural networks to improve computational efficiency. The performance of the DT federation process proposed in previous references mainly uses linear models.
The definition of key performance indicators (KPIs) requires the realization of measurable parameters that intuitively characterize the behavior of a system. In [], the use of weighted KPIs for the management of mobile communication networks, classifying them into categories such as accessibility, mobility, and integrity and combining them to form composite indicators. Reference [] addresses the optimization of communication networks using fractional performance equations that express benefit–cost ratios supported by a technique known as the quadratic transform. Papers [,] leverage ratio equations to measure performance in complex systems, balancing benefits and costs. This work categorizes the KPIs into benefits and constraints, focusing on their cost–benefit relationship for an XR-NDT federated ecosystem.
Unlike previously cited works [,,,,] focused on the federation of DT systems, this paper expands the concept toward the emerging XR-NDT paradigm. Moreover, while related articles commonly estimate DT federation performance through linear equations of parameters, the present article proposes a rational equation that facilitates a more comprehensive evaluation of the federated system’s performance. The proposed model provides a balanced and realistic evaluation framework by contrasting the benefits and capacities achieved with the enrichment of a system with the inclusion of more instances against the costs and constraints of maintaining such a federated environment. Table 1 summarizes the contributions and limitations of the cited works, highlighting how this paper covers their gaps.

Table 1.
Summary of existing digital twin federation approaches and comparison with the proposed KPI-based rational model.
3. Federated XR-NDT Performance Model
To evaluate XR-NDT performance, a novel model has been introduced that differs from existing DT federation approaches. The performance model has been developed to intuitively capture the benefits of a federated XR-NDT system, taking into account the associated operational costs and constraints. The model relies on multiple KPIs that represent the essential aspects of federated XR-NDT systems.
3.1. Performance Model Notations
Before defining the performance model, several context-relevant concepts are introduced that support the definitions of the KPI introduced. Table 2 contains the notation that will be necessary in the definition of KPIs.
Table 2.
Notations for KPI definition.
3.2. Definition of Key Performance Indicators
The use of KPIs for modeling systems is supported by articles [,,]. The KPIs that are introduced in this article are previous standardized metrics that have been carefully selected to model the score of the federated XR-NDT system and adapted according to the requirements of this context. In the federated ecosystem, two types of KPIs are identified. The first category includes metrics that reflect capacities, benefits, and advantages. In contrast, the second category encompasses metrics that reflect overheads and complexities that are unavoidable during the federation process and restrict the scalability and performance of the system. Therefore, KPIs are classified into two categories: capability () and constraints (). This classification facilitates the implementation of a performance model that is distinguished from the performance models outlined in the preceding papers examined in Section 2; those studies presented a linear aggregation of system metrics. With the implementation of capability and constraint KPIs, it is possible to elaborate a more comprehensive model that enables determining a cost–benefit ratio while maintaining a certain level of simplicity.
3.2.1. Capability KPIs
- Accuracy (): The concept of accuracy is defined as the mean of the average error between the ON and all XR-NDT instances. The error is computed by leveraging the Euclidean distance between the instance state () and the ON state (), and it is evaluated with respect to the ON state. In article [], a similar analysis is presented to measure accuracy with respect to the difference in the estimated position and the real position in an XR environment. It has to be emphasized that this Euclidean distance is a vector operation and not a scalar operation. It is paramount to implement a federated XR-NDT system with sufficient accuracy to minimize cumulative errors and ensure the safe execution of both critical and non-critical tasks. Finally, the total accuracy in % is the mean accuracy in the all-instances set, as presented in Equation (1):
- The federation scalability () metric is a representation of the capacity of the DTM to handle the scaling-up operation in the federated system (increasing the number of NDT instances) in terms of the number of successful operations processed. This KPI is computed as the ratio between the two previously defined operations counters: and . This definition is in compliance with article [], in which the capacity of a federated system is characterized in terms of the capacity to process and schedule operations in large-scale volumes. The , calculated in Equation (2), requires coordinating the execution of non-blocking actions; this task might be difficult if the number of NDT and the complexity of actions that are executed in each instance increase.
- The decision-making time (DM) KPI is defined as a time budget required for the system to evolve into a particular state (). Then, the time budget in any instance can be defined as the difference between the max time state and the time state . Finally, the KPI, measured in milliseconds, can be realized as the average decision-making time among all instances. A larger budget guarantees that the operations for evolving into any state can be correctly performed. It is mandatory to be compliant with ETSI recommendations. According to [], it is essential to guarantee an end-to-end delay on the order of a few milliseconds (ms) for XR applications. It may be necessary to define an upper bound time () in order to discard actions that can take longer to be processed, with the objective of avoiding accumulative errors. This KPI is explained via Equation (3):
- The responsiveness () KPI, measured in ms−1, is defined as the DTM’s capability to react to an incoming system operation error in any instance and prevent it. Then, responsiveness in an instance is defined as the difference between the time of correction and the time of detection . Responsiveness is typically associated with zero-touch networks. According to article [], which defines the autonomous management capabilities of an NDT, the NDT can perform real-time simulations with up-to-date data to detect possible operative errors and mitigate them by taking different actions, including network traffic re-shaping, policies modifications, extra resource requests, and scaling down, among others. It is essential to maintain each NDT instance’s proper operation to satisfy QoE requirements; this implies that the system is able to react and prevent failed and incorrect operations. The global , defined in Equation (4), considers the average of the responsiveness in all instances:
3.2.2. Constraint KPIs
- The transmission cost () parameter, measured in Mbps, is realized as the total bandwidth required to maintain the communication/synchronization operations between the ON and all XR-NDT instances. The bandwidth is increased due to the extra transmission overhead (uplink and downlink) that is required to satisfy the system’s operation. The overhead increases according to the number of NDT instances in order to become federated, since additional signaling is required to orchestrate all instances and maintain synchronism. The overhead is considerably increased due to the XR information (3D graphics and video, sensor/haptic information, among others) that is transmitted from the XRM towards the DTM []. Since transmission links have limited bandwidth, it is crucial to optimize the transmission of the extra overhead with trade-off mechanisms and data compression, while efficient DTM coordination is essential to minimize retransmissions due to blocking operations. The global KPI is defined in Equation (5) as the average bandwidth in all set instances:
- Computational cost () is defined as the total amount of computational resources consumed to orchestrate the entire NDT set and generate and process the XR content. An XR-customized NDT requires robust CPUs, GPUs, RAMs, and storage capacity. The addition of more XR-NDT instances, as well as the creation of more complex and immersive NDTs, increases computational resource demands []. The computational cost depicted in Equation (6) can be calculated as the average ratio between the consumption of the resource and the total resource :
3.3. Federation Score Performance Model
Following the presentation of the model’s KPIs, the subsequent stage of the process is the introduction of the federation score model. This work contributes to the advancement of the modeling of the performance of the federated system by introducing a rational equation composed of two linear terms. The use of rational equations facilitates a more profound comprehension of the system’s behavior by contrasting its advantages with the expenses associated with its maintenance [,,]. The proposed model is defined by parameters and (Equations (7) and (8)). Each KPI is scaled by its corresponding weight (), which already includes the normalization effect, ensuring a consistent comparison between different KPIs, in which the KPIs are ranged in [0, 1]:
Therefore, the score model introduces the capacities of the federation system, such as the number of simultaneously handled XR-NDT instances, accuracy, response time, etc. However, the score function is penalized by constraints that include computational and transmission costs; these constraints degrade the performance of each individual-capacity KPI, as well as the global federation score. The federation score (), shown in Equation (9), is the ratio between and . The mathematical properties of this model are further analyzed in Section 4 and Section 5. The notation presented in previous equations paves the path towards further analyses, facilitating the inclusion and removal of KPIs. Furthermore, Equation (9) is a general model that can be applied in both the 1:1 model (just one instance of XR-NDT) and the 1:N model:
3.4. Federated Score Model Comparison
The federation score model (Equation (9)), which constitutes the main contribution of this paper, is conceptually different from existing DT federation proposals, which are commonly based on linear formulations that estimate federation performance. Conversely, the rational equation relies on KPIs that are reformulated to comply with the XR-NDT context. Furthermore, the equation classifies KPIs in two types: those that provide enrichment and benefits and those that represent a constraint in the overall operation. This formulation allows for a comprehensive cost–benefit trade-off analysis. Furthermore, this framework can be applied to any 1:1 or 1:N XR-NDT configuration and extended with additional KPIs when required.
4. Stochastic Analysis and Confidence Intervals for KPI-Based Federation Score
This section statistically models the federation score as the number of XR-NDT instances increases and derives a stochastic boundary for the maximum feasible number of federated instances.
4.1. Random Variable Study
In this section, each weighted KPI (both capacity and constraint) is modeled as a random variable. This analysis assesses how the uncertainty of a KPI affects the overall stability and reliability of the federation score. In real 6G deployments, KPI measurements, such as latency, bandwidth, or resource utilization, are variable in nature. Modeling each weighted KPI as a random variable following a distribution allows the quantification of this natural variability and the determination of the fluctuations of each KPI and their impact on the total score. This analysis models the KPIs using a PDF; specifically, the beta distribution is selected for its properties. The beta distribution is the most suitable choice since its range [0, 1] matches the weighted KPI interval. Although the normal distribution is bounded in [], making it suitable for unbounded variability, the log-normal distribution is defined in [] and models positively biased phenomena. Furthermore, the beta distribution can represent symmetric, biased, or unimodal shapes, offering the flexibility required to model KPI variability. The beta PDF is defined as , with and . The parameters and can be interpreted as success and failure factors, providing an intuitive representation of KPI behavior, as discussed in [,]. The expected value (mean) and uncertainty (variance) of each KPI under the beta distribution are defined in Equations (10) and (11), respectively:
Thus, the behavior of the system can be defined according to application-specific expectations of mean and variance. Given the desired mean and variance for a specific use case, and can be derived using Equations (12) and (13). Both equations must meet conditions and :
Thus, with both previous equations, it is possible to model the behavior of each KPI (under the beta distribution) by setting the expected values of the mean and variance according to the design that will be provided to the XR-NDT federation system. Figure 2, Figure 3, Figure 4, Figure 5, Figure 6 and Figure 7 illustrate the beta probability density functions obtained for each KPI, highlighting their expected variability and relative stability within the federation. This analysis is relevant for the establishment of KPIs’ weights since the analysis provides insight about which KPIs are robust or critical:
- The distribution is narrow and concentrated near 1, indicating low variance and high confidence that the XR-NDT replicas maintain close synchronization with ON and proper XR operations with minimal deviations.
- The beta distribution of shows a moderate spread, which indicates that this KPI is sensitive as the number of XR-NDT instances increases, mainly due to the overhead required for coordination.
- The distribution is centered near 1 but wider than the distribution, which means that is a robust KPI, but its performance can be degraded if the system suffers instability due to an increase in the number of instances.
- The beta distribution of exhibits a behavior similar to that of . is a robust metric that might suffer from deviations.
- and beta distributions demonstrate broad and positively skewed distributions. Their variability confirms that communication and processing overheads are the most unstable components in large-scale XR-NDT deployments. Therefore, the impact of both metrics is considerable, and future studies that address these factors are required to minimize them.

Figure 2.
Expected distributions for accuracy.

Figure 3.
Expected distributions for federation scalability.

Figure 4.
Expected distributions for decision-making time.

Figure 5.
Expected distributions for responsiveness.

Figure 6.
Expected distributions for transmission cost.

Figure 7.
Expected distributions for computational cost.
4.2. Federation Score Approximation
The total capacity equals the sum of individual-capacity KPIs, and the overall constraint equals the sum of individual-constraint KPIs. The total federation score is the ratio between these aggregated values. As defined in Equations (7) and (8), the mean values of capacity and constraint are expressed in Equations (14) and (15); in contrast, variances are defined in Equations (16) and (17):
In real 6G deployments, in the current presented KPIs, as well as the new added KPIs, dependencies can be found among the KPI set. However, this article assumes statistical independence between KPIs according to isolated definitions of KPIs (Equations (1)–(6)), despite a lower dependency level that can be neglected. Therefore, it is possible to assume statistical independence between and ; thus, Equations (16) and (17) are simplified accordingly, This assumption is crucial and must be considered a design requirement to ensure system reliability. However, dependencies among KPIs may emerge during the system’s deployment; future work will investigate these relationships in depth. Equation (18) presents the simplified variance in and :
Moreover, and are the weighted sum of variables according to Equations (7) and (8). Subsequently, both terms can be approximated as normal distributions using the central limit theorem (CLT), as shown in Equation (19):
The federation score is defined as , with expected value and variance . Then, the confidence interval (CI) can be derived using Equation (20). Including confidence intervals introduces a quantitative measure of uncertainty, yielding a more robust estimation of the federation score. CI for different confidence levels is obtained by adjusting the critical value from the Gaussian distribution:
5. Score Function Properties
This section presents the mathematical evaluation of Equation (9) and discusses key analytical considerations.
5.1. Restrictions
5.2. Envelope Functions
This section defines the envelope functions used to determine the upper and lower limits of the federation score based on the number of federated XR-NDT instances. In principle, both envelope functions are designed to increase in magnitude as the number of instances increases. It is important to note that the total score is a comparison of the capabilities of the system with its constraints. In future work, the increase in both envelopes should be studied, and an envelope for the score should be determined that allows the maximum limit of instances to be determined, thus allowing for greater benefit over the constraints.
5.2.1. Capacity Envelope
The capacity envelope function as the number of XR-NDT instances is defined in Equation (22), where:
- is the base capacity when only a single XR-NDT instance is operating (that is, there is no federation). This value can be obtained directly from experimental measurements or simulations of the isolated system.
- is the capacity gain coefficient that represents the improvement contributed by the inclusion of additional instances. It can be derived from experimental measurements or simulations of the isolated system.
- is an efficiency factor that quantifies the efficiency with which new instances contribute to the overall capacity of the system. The lower values of p represent diminishing returns due to partial interdependence or shared resource limitations, while the higher values imply nearly linear scalability. The value of p can be estimated from experimental or simulated data.
5.2.2. Constraint Envelope
The constraint envelope function as the number of XR-NDT instances is defined in Equation (23), where the following is the case:
- is the base constraint that represents the minimal signaling overhead required to support a single XR-NDT instance (there is no federation). The value can be determined with experimental measurements or simulations.
- is the interference coefficient that captures the rate at which resource occupation increases when new instances are added. This parameter can be determined with observations of the system.
- is the growth factor of the interference that reflects the intensity in the interference and the dependency between instances. This parameter can be derived either with simulations or empirically with system observations:
5.2.3. Score Boundaries and CA-CO Contrasting
As mentioned above, both envelopes (Equations (22) and (23)) are presented as increasing according to the number of federated instances. Given the observed growth of both CA and CO, in a future work it will be required to establish an upper limit on the number of instances in order to optimize the benefits while ensuring that the system’s constraints are not exceeded.
The score boundaries can thus be defined in Equation (24) using the envelope functions introduced previously:
5.3. First-Derivative Analysis
The first-derivative analysis evaluates how the overall federation score responds to variations in each KPI. This analysis is relevant for identifying the differences in the variation in and KPIs.
5.3.1. First Derivative of Score with Respect to CA KPIs
Applying the first derivative of the score to the capacity KPIs, the next general form of Equation (25) is obtained. The equation expresses that the partial derivative of the federation score with respect to any KPI (, , , and ) is directly proportional to its weight and inversely proportional to the total term . Conceptually, this equation represents that improvements in parameters produce a linear and positive increase in the federation score. In practice, this derivative analysis indicates that, under controlled constraints, improvements in KPIs produce significant enhancements in the system’s operation.
5.3.2. First Derivative of Score with Respect to CO KPIs
Applying the first derivative of the score to the cost KPIs produces the general form of Equation (26). This equation demonstrates that the derivative is negative and inversely proportional to the square of . This fact indicates that as transmission or computational costs grow, the overall score decreases following a non-linear, inverse-square trend. Therefore, communication and computational overhead are the most critical limitations for large-scale XR-NDT federations:
5.3.3. First-Derivative Conclusions
Modifications in the or terms have asymmetric impacts. While increases in KPIs produce a proportional enhancement, KPIs penalize the system in a non-linear fashion. This asymmetry reflects the practical reality that resource consumption grows faster than efficiency gains when the system scales up, confirming that the model realistically captures the trade-off between benefit and cost.
5.4. Convexity and Concavity Analysis
The convexity or concavity of Equation (9) describes the rate at which the federation score changes with respect to each KPI.
5.4.1. Capability KPIs
Applying the second derivative of the score function with respect to the capacity KPIs produces Equation (27). The fact that this derivative is zero indicates that the changes in KPIs produce consistent and predictable increases in the federation score.
5.4.2. Constraint KPIs
Equation (28) is obtained after the use of the second derivative of the score function with respect to the constraint KPIs. The second derivative is positive, which means that the score function (Equation (9)) is convex with respect to the term . Consequently, as terms increase, their negative impact on the federation score is gradually reduced. This convex behavior describes the natural stabilization of performance loss once the system reaches its operational limits:
5.4.3. Overall Interpretation
The mathematical analysis of this section aligns with the expected behavior of a real 6G system. KPIs scale linearly and predictably with performance improvements. KPIs have been shown to initially penalize performance but eventually reach a point of reduced influence. Figure 8 illustrates the first and second derivatives of the federation score with respect to the KPIs, reflecting the decrease in performance caused by higher transmission and computational costs. The orange dashed curve corresponds to the first derivative of the score, showing how the rate of change decreases non-linearly with KPIs. The green curve depicts the second derivative of the score with respect to the KPIs, highlighting the gradual stabilization of performance degradation as the system approaches its operational limit.
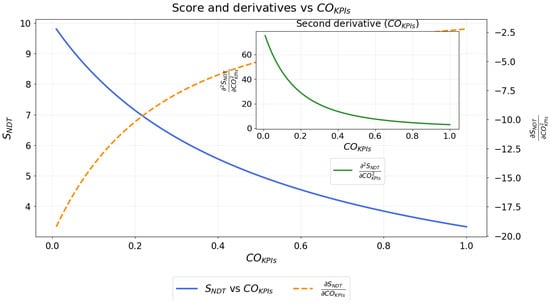
Figure 8.
First and second derivatives of the score with respect to term.
6. Use Case Score Evaluation
This section discusses the federation score () of three representative 6G scenarios: telesurgery, space exploration, and smart city control. Each case illustrates a specific context in which the XR-NDT federation provides tangible benefits and exposes distinct performance trade-offs. It should be emphasized that the KPI and weight values used in each use case are estimated values since there is no real XR-NDT federation system deployment. Future validation in real deployments or reliable simulations will confirm these approximations.
6.1. Reference Frameworks for KPI Values
Despite the lack of reference benchmarks for the present context, this section introduces references that are used to set coherent values of KPIs in a general manner. Then, the reference values can be adapted to the specific 6G application accordingly:
- : The system presented in [] estimates maximum spatial errors of 2.4 cm. This value can be extrapolated to a maximum error of 2.4%. Therefore, needs to be robust and higher in value. Moreover, 6G applications imply critical operations that require meeting these demanding precision levels. However, according to the application, the lower bound for can be degraded to avoid system stress.
- : According to article [], the success rates of non-blocking operations reach 98%. The paper mentions a pessimistic case, with successful operation rates of around 60%. In the federated XR-NDT system, the lower limit for the KPI is intended to be more restrictive, setting it to 80%.
- : According to the definition presented in this investigation for as the extra budget after reaching any state, the lower and upper bounds must be set depending on the demands of the application. Larger budgets mean that operations are executed faster; therefore, parallel operations can be scheduled. Although lower budgets imply that operations are being executed almost on time, this can lead to discontinuous operations and errors.
- : In paper [], reaction times below 1 ms were achieved using techniques such as frame replication and elimination for redundancy (FRER); traffic modeling systems; and AI-based fault detection algorithms, among others. Therefore, it is reasonable to set the margins between 0.005 ms−1 (20 ms reaction) and 1 ms−1 (1 ms reaction).
- : Data rates are highly variable according to the 6H application and the XR content transmitted. In [], it is mentioned that data rates in the range of [120–150] Mbps are required for tele-surgery operations. It is reasonable to estimate a considerable increased range ([300–2000] Mbps), since this tele-surgery scenario implies the transmission of XR content. In the worst-case application (space exploration), the ranges are considerably higher to compensate for channel disruption and lossy conditions.
- : Paper [] mentions a GPU utilization percentage of 78%. Research [] addresses the offloading of computational resources, reaching lower resource occupation at around 42%.
While weights for each KPI have been established according to the study conducted in Section 4.1. An attempt has been carried out to assign higher weights to KPIs that demonstrate superior performance, as evidenced by the observations in Figure 2, Figure 3, Figure 4, Figure 5, Figure 6 and Figure 7.
6.2. Tele-Surgery
The telesurgery use case involves real-time collaboration between multiple surgeons operating simultaneously on a remote patient. Ultra-low latency, extremely high accuracy, and reliable XR feedback are critical to patient safety and operational success.
The system requirements for this 6G application are defined as follows:
- : Surgical precision requires an accuracy above 98%. The system achieves 99.5% on average, reflecting highly stable synchronization among XR-NDT instances. A deviation greater than 2% in surgical XR operations could risk tissue damage. Higher precision specifications can be reached with the support of AI techniques.
- : With three XR-NDT instances for three surgeon specialists, the DTM must ensure non-blocking coordination. The achieved is 95%, close to the ideal 100%. It is mandatory for the system to ensure that at least 85% of the operations are executed properly. AI algorithms are essential for efficiently scheduling operations.
- : A maximum decision budget of 20 ms is imposed, with an average of 12 ms, ensuring real-time action confirmation. A budget lower than 2 ms will lead to desynchronization operations. AI learning models are enablers that optimize the rate of decision-making.
- : Rapid fault detection and correction are essential. The system achieves a responsiveness of 0.5 ms−1 (2 ms reaction), which means that faults are mitigated in milliseconds. A lower bound of 0.05 ms−1 (20 ms reaction) means slower recovery that can be risky in health interventions. In addition, AI learning models are required to have faster reactions.
- : High-definition haptic and video data generate heavy traffic, required for remote surgery. Data compression algorithms are required to optimize transmission costs. On average, the system requires a rate of 1500 Mbps. A range of [300–2000] Mbps is realistic.
- : The average GPU/CPU utilization rate is 85% to process complex XR data in real time. The lower limit (50%) represents a light operational load, while 90% corresponds to near-saturation without instability.
With these considerations, Table 3 is introduced with the lower and upper bounds, the KPI value, and a fixed weight for each KPI.
Table 3.
KPI values for the tele-surgery use case.
6.3. Space Exploration
This scenario involves coordination between an Earth-based ON and a lunar base, where astronauts and exploration robots are managed through federated XR-NDTs:
- : Long-distance communication and lossy channel conditions can compromise the synchronization between the ON and the instances. In this hypothetical scenario, the accuracy achieved is 90%, using AI models to guide and correct XR operations. A lower bound of 85% guarantees precision to prevent control instability under delay.
- : With two XR-NDT instances, for controlling the life support systems of the astronaut team and for manipulating exploration robots, the average success rate is 97%. The minimal bound of 85% ensures minimal operation loss during synchronization.
- : It is mandatory for the DTM to make fast decisions, as the probabilities of disruptions are higher under these conditions. The use of AI learning models is essential to allow the system to operate even if ON communication has been lost, leading to automated system operation and maintenance. On average, the budget is 30 ms. The ideal budget of 120 ms can massively guarantee the execution of parallel tasks. In contrast, a budget of 10 ms is the threshold for ensuring continuous operations.
- : The average value of 0.85 ms−1 allows the system to react quickly to anomalies thanks to AI-based prediction, even under delay conditions. The lower bound of 0.05 ms−1 (20 ms reaction) can represent manual recovery.
- : The long communication distance requires a robust channel bandwidth to compensate for the lossy channel. The XR content is not as demanding as in the tele-surgery application. The average bandwidth is 3000 Mbps, considering compressed XR telemetry, while the range of [2000–5000] Mbps covers expected variation due to retransmissions and adaptive coding. AI techniques are fundamental for channel predictions.
- : The average consumption of resources is 70%. The lower bound of 50% of this range indicates minimal computation on board (most processing that occurs on Earth), while the upper bound of 90% signifies the almost complete utilization of resources during intensive operations.
Taking into account the conditions of the previous scenario, Table 4 summarizes its conditions.
Table 4.
KPI values for the space exploration use case.
6.4. Smart City Control
This case models a large-scale XR-NDT federation that coordinates subsystems such as traffic control, energy distribution, and UAV monitoring within an urban environment.
- : The precision achieved is 96%, which guarantees proper operation in the digital–physical smart city system. The minimum limit of 93% means a lower level of tolerance for minor synchronization problems that could lead to fatal disasters. AI-based prediction algorithms can optimize accuracy.
- : The number of processed operations is degraded due to the large-scale system, which implies multiple subsystem coordination. The lower limit ensures operational continuity under congestion. The system reaches an value of 85%. AI scheduling mechanisms are required to optimize the rate of processed actions.
- : The average value of 18 ms fits with a real-time control threshold. The 2 ms budget can lead to non-processed operations. The upper limit guarantees that delayed actions do not affect stability.
- : A value of 0.9 ms−1 provides reactions close to 1 ms, exploiting AI learning models to automate system management. The 0.05 ms−1 range captures the transition from human-supervised to AI-driven fault management.
- : The system consumes around 1000 Mbps, considering dense data exchange among XR subsystems. The 300 to 2000 Mbps range represents minimum traffic in light-load hours and peaks under full urban activity.
- : The average utilization of resources is 70%, which balances distributed edge and cloud resources. The lower bound (50%) corresponds to off-loaded processing, and 90% indicates the maximum load under simultaneous tasks.
After describing the smart city scenario, Table 5 is introduced.
Table 5.
KPI values for smart city control use case.
6.5. Use Case Discussion
The computed federation scores prove that the performance of the federated XR-NDT system is strongly dependent on the 6G application. Each scenario imposes different requirements and specifications; prior to deployment phases, it will be necessary to conduct a study of the restrictions and requirements to achieve proper system operations.
Analyzing the scores (achieved, maximum, and minimum) in the three use cases, the highest performance is achieved in the smart city scenario, which is mainly constrained by and . The tele-surgery application exhibits similar performance and is mainly restricted by and . The space exploration case shows the lower performance score constrained by , , and .
As discussed in each 6G use case, AI techniques and algorithms are key enablers for the enhanced performance of each KPI. In addition, it is required to execute real-time score computations to take appropriate actions in front of any type of anomaly that can degrade the system. For achieving a real-time computation mechanism, the use of AI algorithms and models is essential, as these techniques provide mechanisms that dynamically adjust the KPIs’ weights in real time according to the conditions of any type of scenario. However, the utilization of real-time computing mechanisms can increase the complexity of the system. Therefore, AI algorithms can be supported by heuristic or meta-heuristic algorithms. In contrast, the utilization of these optimized algorithms is envisioned to result in negligible resource utilization. In future work, a complete analysis of real-time computation techniques is needed.
7. Conclusions
A rational KPI-based methodology for quantifying the performance of a federated XR-NDT system in AI-aware 6G networks was presented. The proposed model classifies KPIs into capacity and constraint metrics to allow a trade-off analysis of the benefits of federated XR-NDT system and the required operational costs. Thus, a rational formula was proposed that differs from previous DT federation works that commonly rely on linear aggregations.
The mathematical analysis demonstrated the limits of scalability in terms of efficiency in a multiple XR-NDT environment. A stochastic study showed the stability of the model under KPI variability. The application of the rational model across innovative 6G scenarios confirmed that the federation score strongly depends on the specific constraints of each scenario. Although capacity KPIs are robust and provide enhancements in the federated environment, transmission and computational costs are considerable limiting factors. The model requires real-time operations to react to anomalies, and by means of a feedback loop based on KPI weights, the focus is on strengthening the performance of KPIs to compensate the impact of constraints.
The model is a baseline for dynamic AI-assisted federation control, enabling the real-time adaptation of KPI weights and predictive optimization in future 6G testbeds. Future work will focus on implementing this model in real or simulated federated XR-NDT platforms, integrating adaptive and automated learning mechanisms to adjust score parameters according to network behavior and user experience metrics.
Author Contributions
Conceptualization, X.C.-H. and X.H.; methodology, X.C.-H. and X.H.; validation, X.C.-H. and X.H.; formal analysis, X.C.-H. and X.H.; investigation, X.C.-H. and X.H.; resources, X.H.; writing—original draft preparation, X.C.-H. and X.H.; writing—review and editing, X.C.-H. and X.H.; supervision, X.H.; project administration, X.H.; funding acquisition, X.H. All authors have read and agreed to the published version of this manuscript.
Funding
This work is part of the I+D+i project PID2022-137329OB-C41 and supported by MICIU/AEI/10.13039/501100011033 and FEDER, UE.
Data Availability Statement
The original contributions presented in this study are included in the article. Further inquiries can be directed to the corresponding author.
Conflicts of Interest
The authors declare no conflicts of interest.
Abbreviations
The following abbreviations are used in this manuscript:
| DT | Digital twin; |
| NDT | Network digital twin; |
| DTM | Digital twin manager; |
| XR | Extended reality; |
| XRM | Extended reality manager; |
| AI | Artificial intelligence; |
| KPI | Key performance indicator. |
References
- Grieves, M. Digital twin: Manufacturing excellence through virtual factory replication. White Pap. 2014, 1, 1–7. [Google Scholar]
- Zhou, C.; Yang, H.; Duan, X.; Concepts of Digital Twin Network (DTN). Internet-Draft Draft-Zhou-Nmrg-Digitaltwin-Network-Concepts-00, IETF. 2020. Available online: https://datatracker.ietf.org/doc/html/draft-zhou-nmrg-digitaltwin-network-concepts-00 (accessed on 16 October 2025).
- ETSI ISG ZSM. Zero-Touch Network and Service Management (ZSM); Network Digital Twin. ETSI Group Report GR ZSM 015 V1.1.1. February 2024. Available online: https://standards.iteh.ai/catalog/standards/etsi/5867716f-3f95-47bb-9972-a9daa753ae9c/etsi-gr-zsm-015-v1-1-1-2024-02 (accessed on 16 October 2025).
- ITU-T. Digital Twin Network—Requirements and Architecture. Recommendation ITU-T Y.3090. International Telecommunication Union: Geneva, Switzerland, February 2022. Available online: https://handle.itu.int/11.1002/1000/14852 (accessed on 19 October 2025).
- Wang, C.; Han, Y.; Zhang, L.; Jia, Z.; Zhang, H.; Hong, C.S.; Han, Z. Computing Power in the Sky: Digital Twin-Assisted Collaborative Computing With Multi-UAV Networks. IEEE Trans. Veh. Technol. 2025, 74, 14466–14482. [Google Scholar] [CrossRef]
- Zhang, L.; Wu, Z.; Xu, H.; Niyato, D.; Hong, C.S.; Han, Z. Digital Twin-Driven Federated Learning for Converged Computing and Networking at the Edge. IEEE Netw. 2025, 39, 20–28. [Google Scholar] [CrossRef]
- Zhang, L.; Wang, H.; Xue, H.; Zhang, H.; Liu, Q.; Niyato, D.; Han, Z. Digital Twin-Assisted Edge Computation Offloading in Industrial Internet of Things With NOMA. IEEE Trans. Veh. Technol. 2023, 72, 11935–11950. [Google Scholar] [CrossRef]
- Calle-Heredia, X.; Hesselbach, X. Digital Twin-Driven Virtual Network Architecture for Enhanced Extended Reality Capabilities. Appl. Sci. 2024, 14, 10352. [Google Scholar] [CrossRef]
- Almasan, P.; Ferriol-Galmés, M.; Paillisse, J.; Suárez-Varela, J.; Perino, D.; López, D.; Perales, A.A.P.; Harvey, P.; Ciavaglia, L.; Wong, L.; et al. Network Digital Twin: Context, Enabling Technologies, and Opportunities. IEEE Commun. Mag. 2022, 60, 22–27. [Google Scholar] [CrossRef]
- 3GPP. The 3GPP Progress of Network Digital Twins. 2024. Available online: https://www.3gpp.org/ftp/tsg_sa/wg5_tm/Joint_meetings/2025_07_ZSM_SA5_WS/The%203GPP%20progress%20of%20NDT.pdf (accessed on 17 October 2025).
- Yang, C.; Tu, X.; Autiosalo, J.; Ala-Laurinaho, R.; Mattila, J.; Salminen, P.; Tammi, K. Extended Reality Application Framework for a Digital-Twin-Based Smart Crane. Appl. Sci. 2022, 12, 6030. [Google Scholar] [CrossRef]
- Xie, Y.; Wu, Q.; Fan, P.; Cheng, N.; Chen, W.; Wang, J.; Letaief, K.B. Resource Allocation for Twin Maintenance and Task Processing in Vehicular Edge Computing Network. IEEE Internet Things J. 2025, 12, 32008–32021. [Google Scholar] [CrossRef]
- Vergara, C.; Bahsoon, R.; Theodoropoulos, G.; Yanez, W.; Tziritas, N. Federated Digital Twin. In Proceedings of the 2023 IEEE/ACM 27th International Symposium on Distributed Simulation and Real Time Applications (DS-RT), Singapore, 4–5 October 2023; pp. 115–116. [Google Scholar] [CrossRef]
- Papacharalampopoulos, A.; Christopoulos, D.; Karagianni, O.M.; Stavropoulos, P. Federation in Digital Twins and Knowledge Transfer: Modeling Limitations and Enhancement. Machines 2024, 12, 701. [Google Scholar] [CrossRef]
- Yu, T.; Li, Z.; Hashash, O.; Sakaguchi, K.; Saad, W.; Debbah, M. Internet of Federated Digital Twins: Connecting Twins Beyond Borders for Society 5.0. IEEE Internet Things Mag. 2024, 7, 64–71. [Google Scholar] [CrossRef]
- Frasheri, M.; Talasila, P.; Scherma, V. Towards Federated Digital Twin Platforms. Electron. Proc. Theor. Comput. Sci. 2025, 418, 32–38. [Google Scholar] [CrossRef]
- Yang, J.; Jiang, W.; Nie, L. Hypernetworks-Based Hierarchical Federated Learning on Hybrid Non-IID Datasets for Digital Twin in Industrial IoT. IEEE Trans. Netw. Sci. Eng. 2024, 11, 1413–1423. [Google Scholar] [CrossRef]
- Botella-Mascarell, C.; Perez, J.; Soria, J.; Roger, S. On the Use of Composite Indicators for Mobile Communications Network Management in Smart Sustainable Cities. Appl. Sci. 2021, 11, 181. [Google Scholar] [CrossRef]
- Shen, K.; Yu, W. Fractional Programming for Communication Systems—Part I: Power Control and Beamforming. IEEE Trans. Signal Process. 2018, 66, 2616–2630. [Google Scholar] [CrossRef]
- Kamariotis, A.; Tatsis, K.; Chatzi, E.; Goebel, K.; Straub, D. A metric for assessing and optimizing data-driven prognostic algorithms for predictive maintenance. Reliab. Eng. Syst. Saf. 2024, 242, 109723. [Google Scholar] [CrossRef]
- Cao, Y.; Lv, T.; Lin, Z.; Ni, W. Delay-Constrained Joint Power Control, User Detection and Passive Beamforming in Intelligent Reflecting Surface-Assisted Uplink mmWave System. IEEE Trans. Cogn. Commun. Netw. 2021, 7, 482–495. [Google Scholar] [CrossRef]
- ITU-T. Digital Twin Network—Capability Levels and Evaluation Methods. Recommendation ITU-T Y.3091; International Telecommunication Union: Geneva, Switzerland, December 2023; Available online: https://handle.itu.int/11.1002/1000/15736 (accessed on 19 October 2025).
- Arun, A.; Saruwatari, S.; Shah, S.; Bharadia, D. XRLoc: Accurate UWB Localization to Realize XR Deployments. In Proceedings of the 21st ACM Conference on Embedded Networked Sensor Systems (SenSys ’23), Istanbul, Turkey, 12–17 November 2023; pp. 459–473. [Google Scholar] [CrossRef]
- Zhang, Y.; Tang, B.; Luo, J.; Zhang, J. Deadline-Aware Dynamic Task Scheduling in Edge–Cloud Collaborative Computing. Electronics 2022, 11, 2464. [Google Scholar] [CrossRef]
- ETSI. ETSI TR 126 928 V18.0.0 - 3GPP TR 26.928 Release 18. Technical Report, May 2024. Available online: https://www.etsi.org/deliver/etsi_tr/126900_126999/126928/18.00.00_60/tr_126928v180000p.pdf (accessed on 19 October 2025).
- Lee, E.S.; Shin, B.S. Enhancing the Performance of XR Environments Using Fog and Cloud Computing. Appl. Sci. 2023, 13, 12477. [Google Scholar] [CrossRef]
- Wu, J.; Gao, S.; Teng, X.; Zhang, Z.; Dai, M.; Ge, H.; Cao, W. Beta Distribution Function-Based Cooperative Spectrum Sensing Against Byzantine Attack in Cognitive Wireless Sensor Networks. IEEE Sensors Lett. 2024, 8, 1–4. [Google Scholar] [CrossRef]
- Wang, W.; Liang, J. Research on Node Anomaly Detection Method in Smart Grid by Beta Distribution Theory. In Proceedings of the 2021 IEEE Conference on Telecommunications, Optics and Computer Science (TOCS), Shenyang, China, 10–11 December 2021; pp. 755–758. [Google Scholar] [CrossRef]
- Orive, A.; Agirre, A.; Truong, H.-L.; Sarachaga, I.; Marcos, M. Quality of Service Aware Orchestration for Cloud–Edge Continuum Applications. Sensors 2022, 22, 1755. [Google Scholar] [CrossRef] [PubMed]
- Seliem, M.; Pesch, D.; Roedig, U.; Sreenan, C. Resilient Time-Sensitive Networking for Industrial IoT: Configuration and Fault-Tolerance Evaluation. In Proceedings of the 2025 IEEE 30th International Conference on Emerging Technologies and Factory Automation (ETFA), Porto, Portugal, 9–12 September 2025. [Google Scholar]
- Takahashi, Y.; Hakamada, K.; Morohashi, H.; Akasaka, H.; Ebihara, Y.; Oki, E.; Hirano, S.; Mori, M. Verification of delay time and image compression thresholds for telesurgery. Asian J. Endosc. Surg. 2023, 16, 255–261. [Google Scholar] [CrossRef] [PubMed]
- Liu, S.; Wang, S.; Zhao, H. Realization and Experimental Research on Immersive Visual Communication System Based on Real-Time Rendering. In Proceedings of the 2025 2nd International Conference on Generative Artificial Intelligence and Information Security (GAIIS 2025), Hangzhou, China, 21–23 February 2025; ACM: New York, NY, USA, 2025; pp. 1–5. [Google Scholar] [CrossRef]
- Jiang, Q.; Pang, Y.; Sentosa, W.; Gao, S.; Huzaifa, M.; Zhang, J.; Perez-Ramirez, J.; Das, D.; Gonzalez-Aguirre, D.; Godfrey, B.; et al. RemoteVIO: Offloading Head Tracking in an End-to-End XR System. In Proceedings of the 16th ACM Multimedia Systems Conference (MMSys ’25), Stellenbosch, South Africa, 31 March–4 April 2025; ACM: New York, NY, USA, 2025; pp. 99–110. [Google Scholar]
Disclaimer/Publisher’s Note: The statements, opinions and data contained in all publications are solely those of the individual author(s) and contributor(s) and not of MDPI and/or the editor(s). MDPI and/or the editor(s) disclaim responsibility for any injury to people or property resulting from any ideas, methods, instructions or products referred to in the content. |
© 2025 by the authors. Licensee MDPI, Basel, Switzerland. This article is an open access article distributed under the terms and conditions of the Creative Commons Attribution (CC BY) license (https://creativecommons.org/licenses/by/4.0/).