In the original publication [1], there are some mistakes in the figures published. These errors were introduced during proofreading and were not noticed before publication. The corrected figures are shown below.
- Figure 6 has been updated and is shown below:

Figure 6.
Reproduced results for ls and chmod commands on D-151.
- A new Figure 7 has been added, as shown below:

Figure 7.
Reproduced results for ls and chmod commands on D-152.
- A new Figure 10 has been added, as shown below:

Figure 10.
Results with moving a small file as a noise, selecting CPU affinity.
- Figure A4 has been updated, as shown below:
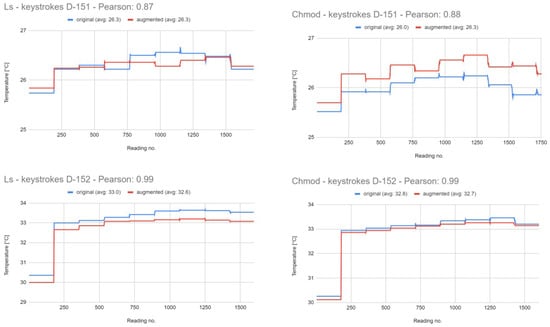
Figure A4.
Results obtained with keystrokes as a noise, selecting CPU affinity.
- Figure A5 has been updated, as shown below:
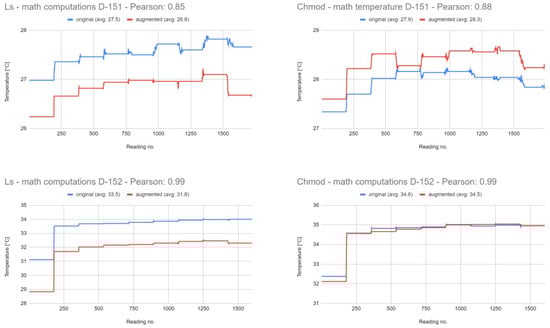
Figure A5.
Results obtained with mathematical computations as a noise, selecting CPU affinity.
Additionally, the original figures are reordered as follows:
| Original Figure Number | Reordered Figure Number |
| Figure 7 | Figure 8 |
| Figure 8 | Figure 9 |
| Figure 9 | Figure 11 |
| Figure 10 | Figure 12 |
| Figure 11 | Figure 13 |
| Figure 12 | Figure 14 |
| Figure 13 | Figure 15 |
| Figure 14 | Figure 16 |
| Figure 15 | Figure 17 |
| Figure 16 | Figure 18 |
| Figure 17 | Figure 19 |
| Figure 18 | Figure 20 |
| Figure 19 | Figure 21 |
| Figure 20 | Figure 22 |
| Figure 21 | Figure 23 |
| Figure 22 | Figure 24 |
Due to the change in figures, the mentions of figures in the paper have also been updated.
- Section 3.1, Paragraphs 1 and 3:
First, we aimed to reproduce the results from the original paper and to check whether the selected cores are a good option. In Figures 5–7, there are six plots, one for each command (i.e., ls and chmod) run on all systems (i.e., D-150, D-151, and D-152).
For the other two desktops, D-151 and D-152, the results in terms of Pearson correlation are all over 0.93. However, they are not so conclusive in terms of difference in the average temperature where we can only see 0.1 °C (see Figures 6 and 7).
- Section 3.2.2:
For moving files as a noise, we performed two experiments, one with a big file of 18.8 GB in size (results in Figure 9) and one with a small file of 3.3 MB in size (results in Figure 10). As seen in Figure 9, the correlation between the two temperature vectors is 0.66 for ls and 0.74 for chmod, with a difference in the average temperature of almost 2 °C. Even if the difference in temperature is visible, considering the lower correlation values, one cannot conclude whether there is or not an anomaly taking place.
However, the results for moving the small file are not necessarily the ones expected (see Figure 10), with a good correlation of 0.77 and 0.79; however, the average temperature of the original command is the same or higher than the one of the augmented one, and we attribute these results on the high probability of caching the small file.
The authors state that the scientific conclusions are unaffected. This correction was approved by the Academic Editor. The original publication has also been updated.
Reference
- Vasilas, T.; Bacila, C.; Brad, R. Beat the Heat: Syscall Attack Detection via Thermal Side Channel. Future Internet 2024, 16, 301. [Google Scholar] [CrossRef]
Disclaimer/Publisher’s Note: The statements, opinions and data contained in all publications are solely those of the individual author(s) and contributor(s) and not of MDPI and/or the editor(s). MDPI and/or the editor(s) disclaim responsibility for any injury to people or property resulting from any ideas, methods, instructions or products referred to in the content. |
© 2024 by the authors. Licensee MDPI, Basel, Switzerland. This article is an open access article distributed under the terms and conditions of the Creative Commons Attribution (CC BY) license (https://creativecommons.org/licenses/by/4.0/).