1. Introduction
Monitoring the temperature of a CPU is a very important detail in order to provide a reliable computing environment, execute at an optimal performance and preserve the health of the hardware. Temperature monitoring prevents overheating and thus a reduced lifespan for the hardware, maintains the performance by optimizing the cooling process, ensures the stability of the system to avoid crashes and unexpected shutdowns, improves the energy efficiency by dynamically adjust the power consumption, and improves the user experience by reducing fan noise. However, the spotlight of the benefits introduced by temperature monitoring is diminished by an interface that can be accessed by anyone, providing an attack opening as well as a detection tool.
A user process can use any of the existing system calls in an operation system while executing varied programs. If any of the executed programs interacts with a jeopardized syscall, it could breach the kernel space, potentially resulting in unauthorized data access, privilege escalation, system crashes, the leakage of internal kernel information, and other issues. These consequences can ultimately lead to the unauthorized acquisition of valuable and sensitive data.
Moreover, there is a correlation between the temperature of a CPU and the applied current and voltage, which means that one can detect the differences in temperature for the identical set of instructions but different operands [
1]. The above statement leads to the main idea of this study, that monitoring the temperature of a CPU while an original application and one that contains additional compromised code are running, must bring differences in temperature, but not in the pattern of the execution.
Hot-and-Cold [
2] is a technique that detects anomalies using the
ls and
chmod Linux commands, which shows a correlation up to 0.8 between an original and an augmented command, the second having a higher temperature due to the additional code. However, this technique was employed in a controlled environment, with zero noise, which in fact could not lead to a strong conclusion about the application of the technique in real-life scenarios.
Therefore, this research introduces BeatTheHeat technique, which builds upon the Hot-n-Cold anomaly detection technique, with the objective of making it work in more realistic computational environments. This is achieved by monitoring the CPU temperature to detect irregularities in the Linux command behavior. The innovative aspect of this approach is the inclusion of five types of noise during the operation of the attack detector. These noise types encompass user-specific activities such as moving files, performing extended mathematical computations, playing songs, and browsing the web. This added complexity simulates real-world conditions more accurately, boosting the robustness and practicality of the anomaly detection method.
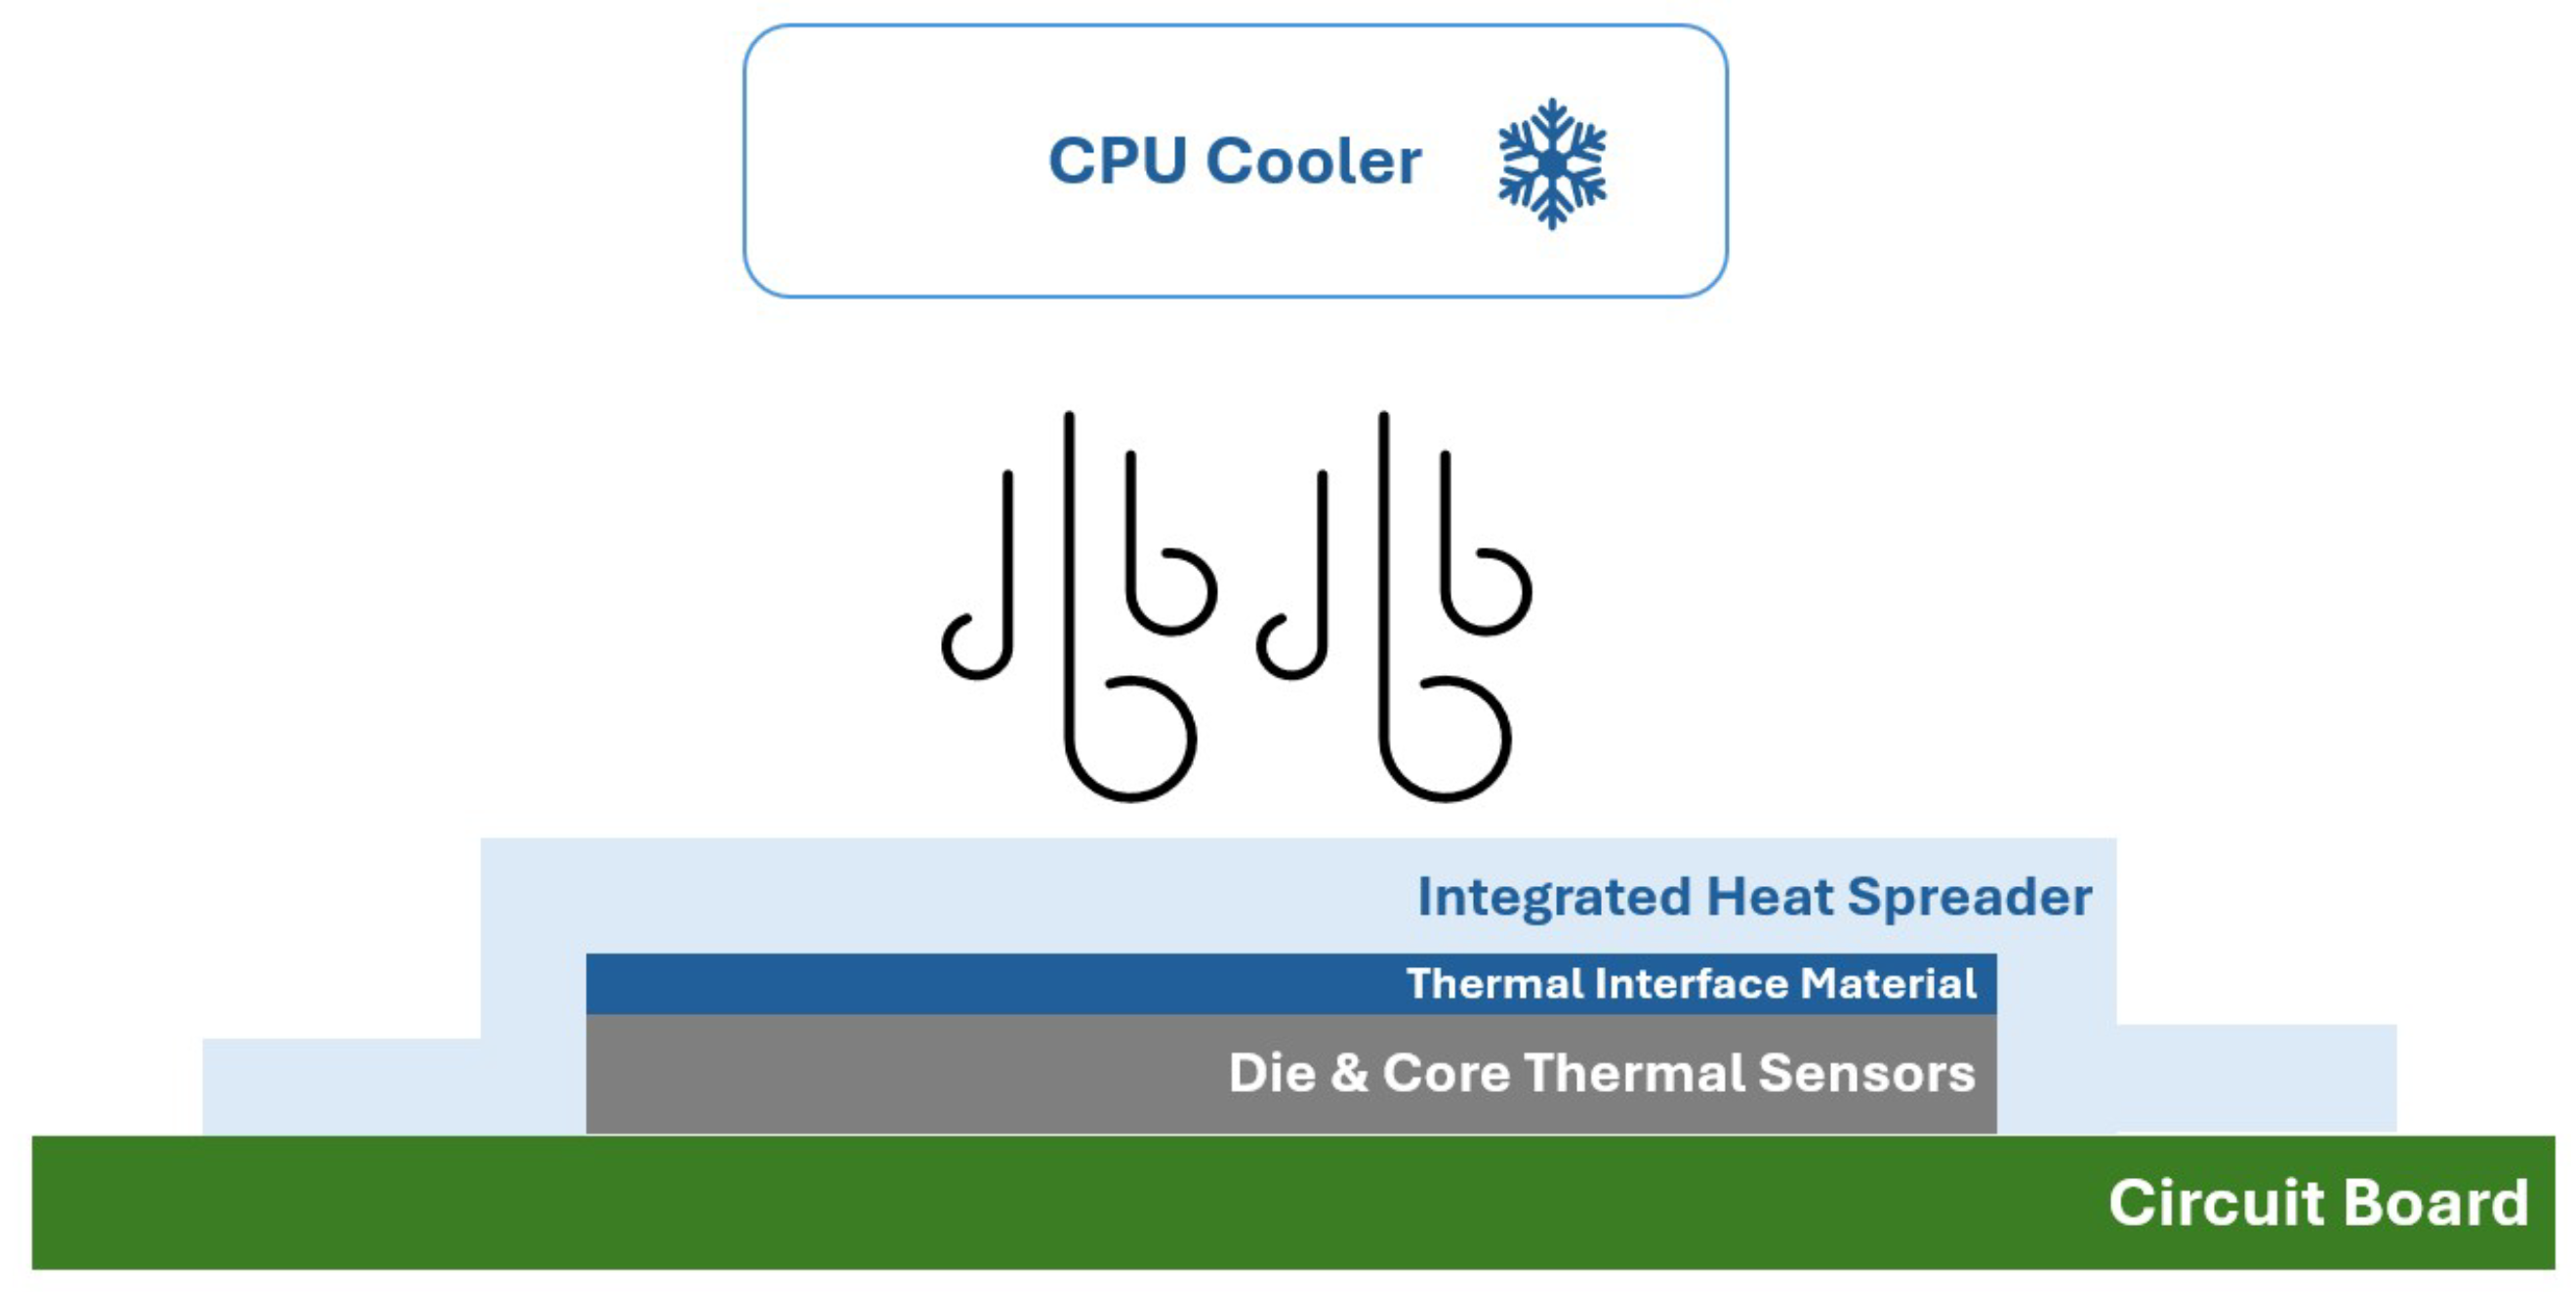
BeatTheHeat has the objective of identifying an attack created using crafted system calls that are added in the original code, in scenarios similar to real life. The hypothesis of the work is that an augmented command, containing additional code, will dissipate more heat; however, the pattern of the original and the modified command will be very similar. The temperature monitoring is performed via Intel digital sensors, which are integrated within Intel processors to monitor the temperature of the CPU. These sensors provide accurate and real-time temperature readings through the
hwmon interface [
3], which allows both users and system administrators to monitor and manage hardware health. The augmentation is performed based on the information from the Common Vulnerability and Exposures (CVE) database [
4]. To process and compare the two temperature vectors of the original and augmented with code commands, we used the method of correlation thermal analysis, which is a variation of the well-known correlation power analysis (CPA) technique, together with the Pearson correlation.
The novelty of
BeatTheHeat stands in the used approach, which reads the CPU temperature in order to
detect a possible attack. To the best of our knowledge, until now, no research was conducted in this direction. Some studies using CPU temperature were presented in [
1,
5]; however, they focus their study to
create attacks using the heat dissipation of a CPU.
Furthermore, in addition to the Correlation Thermal Analysis, we introduce a Machine Learning (ML) algorithm which helps us classify whether a command was augmented or not based on its thermal traces. This algorithm has an classification accuracy of up to 88%.
Moreover, to study the heat propagation through cores, we created a Covert-channel Attack, and we were able to reconstruct 80% of the secret data. Additionally, we proposed the layout of the CPU on the die by exploring how heat propagates to the nearby cores.
Certainly, the above technique can be further developed and applied while a program is running to automatically detect any anomalies throughout execution. This enhancement would involve converting the correlation, originally determined at the end of the experiments, into an automatic computation that runs concurrently with temperature readings and is recomputed in a recurrent way.
1.2. Related Work
Lately, two types of cybersecurity attacks have emerged, namely covert-channel and side-channel attacks. The first category, initially presented as an isolation issue [
6], uses processing to transmit (from a sender to a receiver), even though it was not created to communicate in this way [
7]. It can use all kinds of channels to transmit, channels that were not created in this scope, as thermal emanations, power, timing, and others [
8]. In the second category, the secret information is not transmitted from one to another. The leakage is created based on the normal usage of a system, as the unintended consequence of a system’s way of working [
9]. The difference between the two categories is that, in covert-channel attacks, both the sender and the receiver are managed by the attacker at some point. On the other hand, the side-channel attacks are more difficult to create because the victim is not managed by the attacker at any point, and it is not aware of the leakage [
8].
1.2.1. Thermal-Based Attacks and Countermeasures
The related work contains attacks which are constructed based on the different types of measuring the thermal dissipation of the CPU. The attacks are measured from hardware or software, and they use side channels or covert channels. RSA private key was recovered in [
10], using a fault side-channel attack which risen the temperature at a very high rate on AVR and PIC microcontrollers. Covert-channels were investigated in the context of IoT in [
11]; however, they did not conduct any further experiment regarding the thermal sensors. Correlation Power Analysis (CPA) and Deep Learning (DL) were adapted for heat dissipation in [
12], where the private key for the RSA algorithm was fully recovered; however, this kind of study is a hardware-based one, and physical access to the targeted device is needed, a procedure which is out of our scope. In [
5], two versions of covert channel attacks were implemented on a multi-core computing system, reaching a peak data rate of 12.5 bps. The attackers utilized the
coretemp filesystem in Linux to monitor the temperature of one core, which is affected by the temperature of an adjacent one. By doing so, they achieved a high correspondence between the temperatures of the cores while executing the RSA algorithm. In [
13,
14], the authors try to improve the error rate of the covert channel in [
5] by solving the thermal interference barrier. However, the covert channel limitation was defeated in ThermalBleed [
1], which constructed the first software-based thermal side-channel attack from Linux userspace. It leverages Intel’s digital thermal sensors on each CPU core to measure temperature under various conditions. Using this method, hits and misses in cache together with TLB address translations were identified, allowing for the breaching of the KASLR (Kernel Address Space Layout Randomization). Another side-channel attack on mobile devices was created in [
15], wherein a CNN which was based on computer vision was employed to foretell the passwords of different mobile devices. Thermal traces were used while the passwords were encrypted using an AES algorithm and then they were converted into images. By inputting the resulting images into the CNN network, they were able to predict the passwords. Other techniques test the predisposition of GPUs to leak information via temperature, power or frequency, by mounting a hybrid side-channel attack [
16].
1.2.2. Syscall-Based Attacks and Countermeasures
Most studies monitor system calls by utilizing a combination of static and dynamic analyses. Dynamic analysis involves extracting system calls from an executable during its real-time execution. While effective, this technique has a significant disadvantage: it cannot identify all system calls because not all execution paths are covered during runtime, as it only captures the system calls made during the specific execution scenarios that are observed. To address this limitation, static analysis is employed. Static analysis examines the entire codebase without executing it, ensuring that all potential execution paths are covered. This comprehensive approach can identify all possible system calls within the program. However, static analysis comes with its own drawback: it tends to generate false positives, identifying system calls that might not actually be executed in a real-world scenario. Despite this, the combination of both static and dynamic analyses provides a more thorough and accurate tracking of system calls than either method used alone.
Sysverify [
17] uses an approach that merges static and dynamic analysis to minimize the attack area in cloud docker containers. The static analysis generates a connection path from the system calls to the library API, whereas the dynamic analysis creates a connection path for syscalls resulting from indirect calls or for the syscalls that are seldom used. The combination of the two connection paths will show information about the security level of the syscall’s generation. Sifter [
18] constructs security filters for kernel modules in Android platforms, which are used to reject syscall patterns that are strange, taking in consideration the order of execution, the arguments, and their length or if the system call is out of use. The Tailor toolkit [
19] creates a system call whitelist for the Seccomp filter. The whitelist is created by combining two partial whitelists. The first one is created using three profilers which map the system calls originating either from functions, from the environment, or libraries. The second one is created by tracking system calls coming from assembly instructions or syscall functions, using static analysis. However, a fully automated machine learning-driven framework for detecting cryptomining activities is presented in [
20], which utilizes syscall patterns to identify anomalous events in comparison to the normal algorithms used in cryptocurrency operations. Other filtering techniques are SysXCHG [
21] which can adapt during execution, Nimos [
22] which explores syscall sequences, and Optimus [
23] which identifies the syscalls which are essential for containers, increasing their security.
1.3. Hot-n-Cold Technique
Hot-n-Cold [
2] is an anomaly detection technique which checks the correlation between an original command for Linux and an augmented one. Two Linux terminal commands were selected for the experiments, namely
ls and
chmod, which were modified by adding the
ioctl syscall. The method by which they were chosen has two important factors. Firstly, the authors extracted a list with the most used Linux terminal commands from a local system during one month and created a top 50. Additionally, they selected a list of the top most used in attacks and crafted system calls presented in the CVEs [
4]. Secondly, from the top of the commands, they extracted the ones that could be augmented with
ioctl syscall, meaning that they already have a file descriptor in their implementation that can be used as a parameter for
ioctl call, a list form in which only four commands remained, namely
ls,
chmod,
mv, and
cp. After the augmentation, only the two commands mentioned above continue to work as expected. The experiments were performed using scripts which run for about 5 min each, containing the calls of the respective command, with a pause of 10 ms, 100 ms, or 1000 ms between them, while the temperature was read every 2 ms. For each experiment, 30 traces were used for the final result. For the final results, they used Pearson correlation to compare the original and augmented command temperature vectors. They found a correlation up to 0.80 between the two commands, with a higher temperature for the augmented ones, leading to the conclusion that one can detect the anomaly based on the temperature footprint.
3. Results
This work aims to detect anomalies in the operation of a CPU based on the core temperatures. This is achieved by observing differences in the temperature of two Linux commands in their original and augmented states and similarities in their behavior. We will further present graphs with the results, containing a comparison of the vectors of temperatures for each command in both its states. In the following graphs, the blue line represents the array of values for the authentic command and the red line represents the vector of values for the modified command, augmented with
ioctl calls. All the figures contain the average temperature of the commands vector near the series naming in brackets (e.g.,
(avg: 28.4)). To compare the similarity in a pattern of the two vectors of temperature, we used the Pearson correlation index. A high correlation is considered if the Pearson correlation index is above 0.7 [
37]. If the two commands have a high correlation, and there is a difference in temperature between them, one can conclude that there was an anomaly in the respective command which was detected.
3.1. Reproducing Original Results
First, we aimed to reproduce the results from the original paper and to check whether the selected cores are a good option. In
Figure 5,
Figure 6 and
Figure 7, there are six plots, one for each command (i.e.,
ls and
chmod) run on all systems (i.e.,
D-150,
D-151, and
D-152).
For D-150, the results are the most accurate, and a high correlation can be seen between the vector values with the Pearson index at 0.85 for ls and 0.96 for chmod, respectively. Moreover, a difference can be seen in the average temperature between the authentic and the modified command of almost half a degree Celsius. The higher heat is dissipated by the augmented command, leading us to the conclusion that the reproduction of experiments was a successful one, and an anomaly was detected in the behavior of the command.
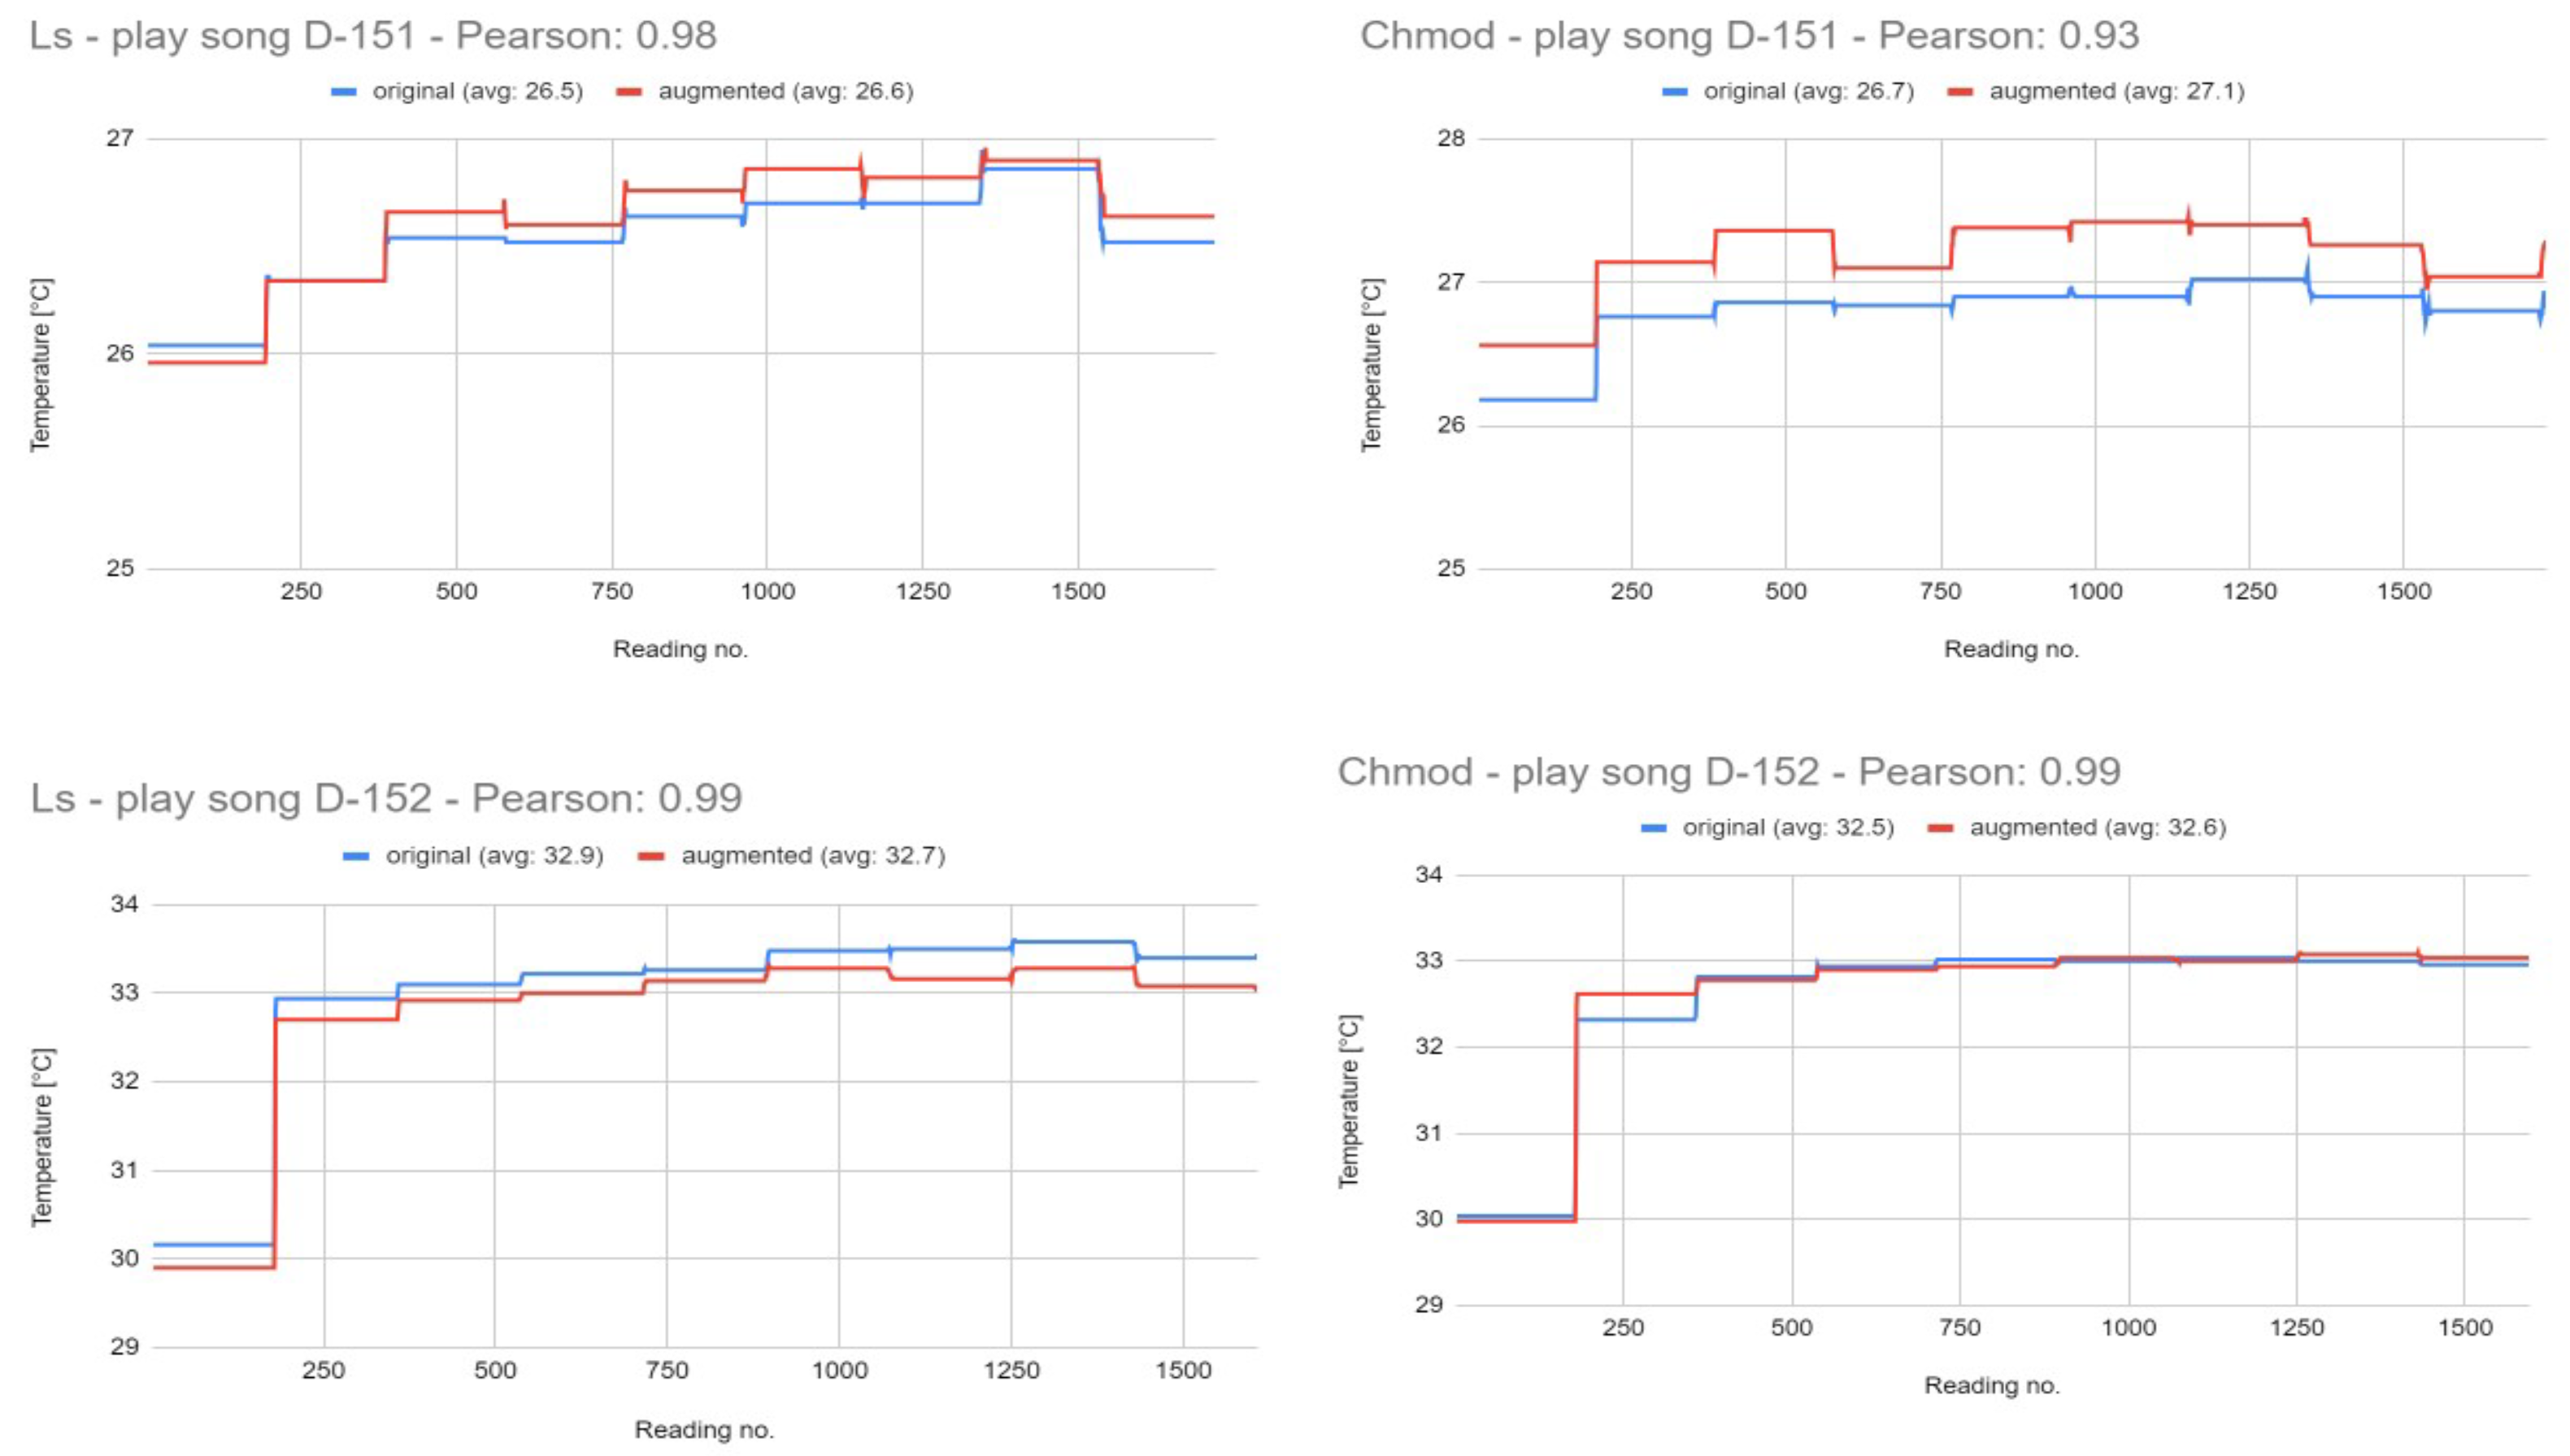
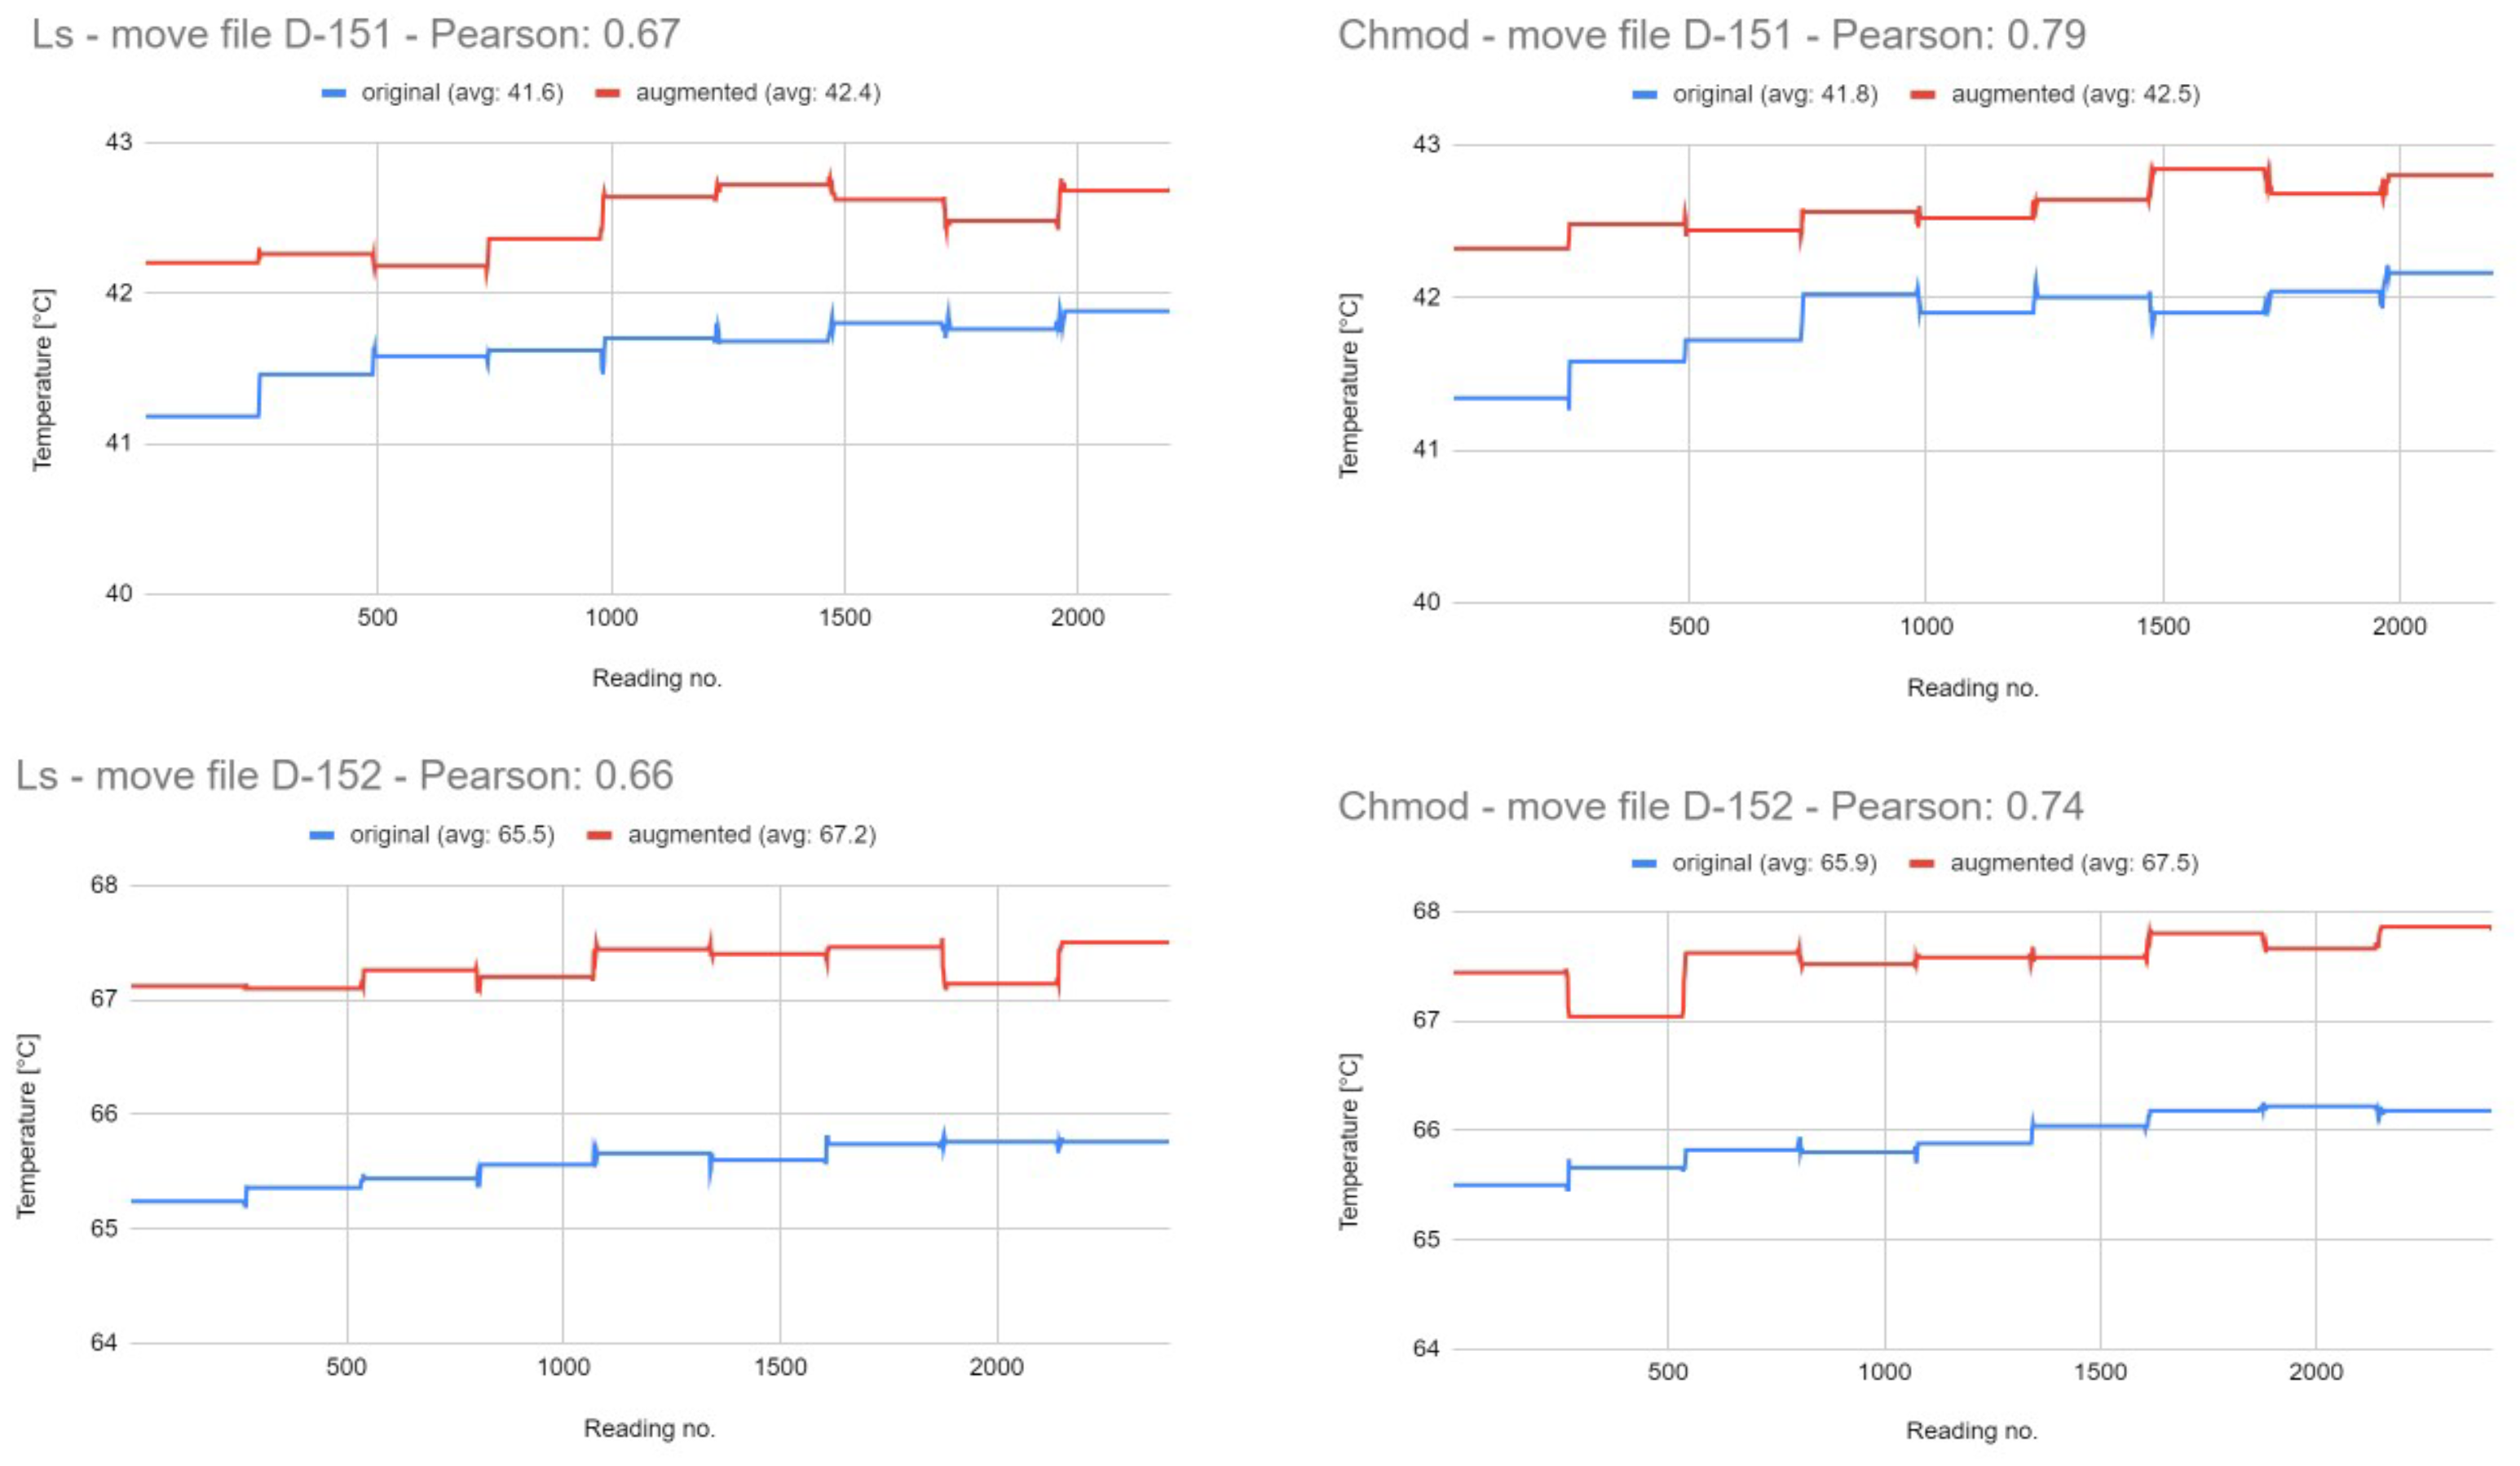
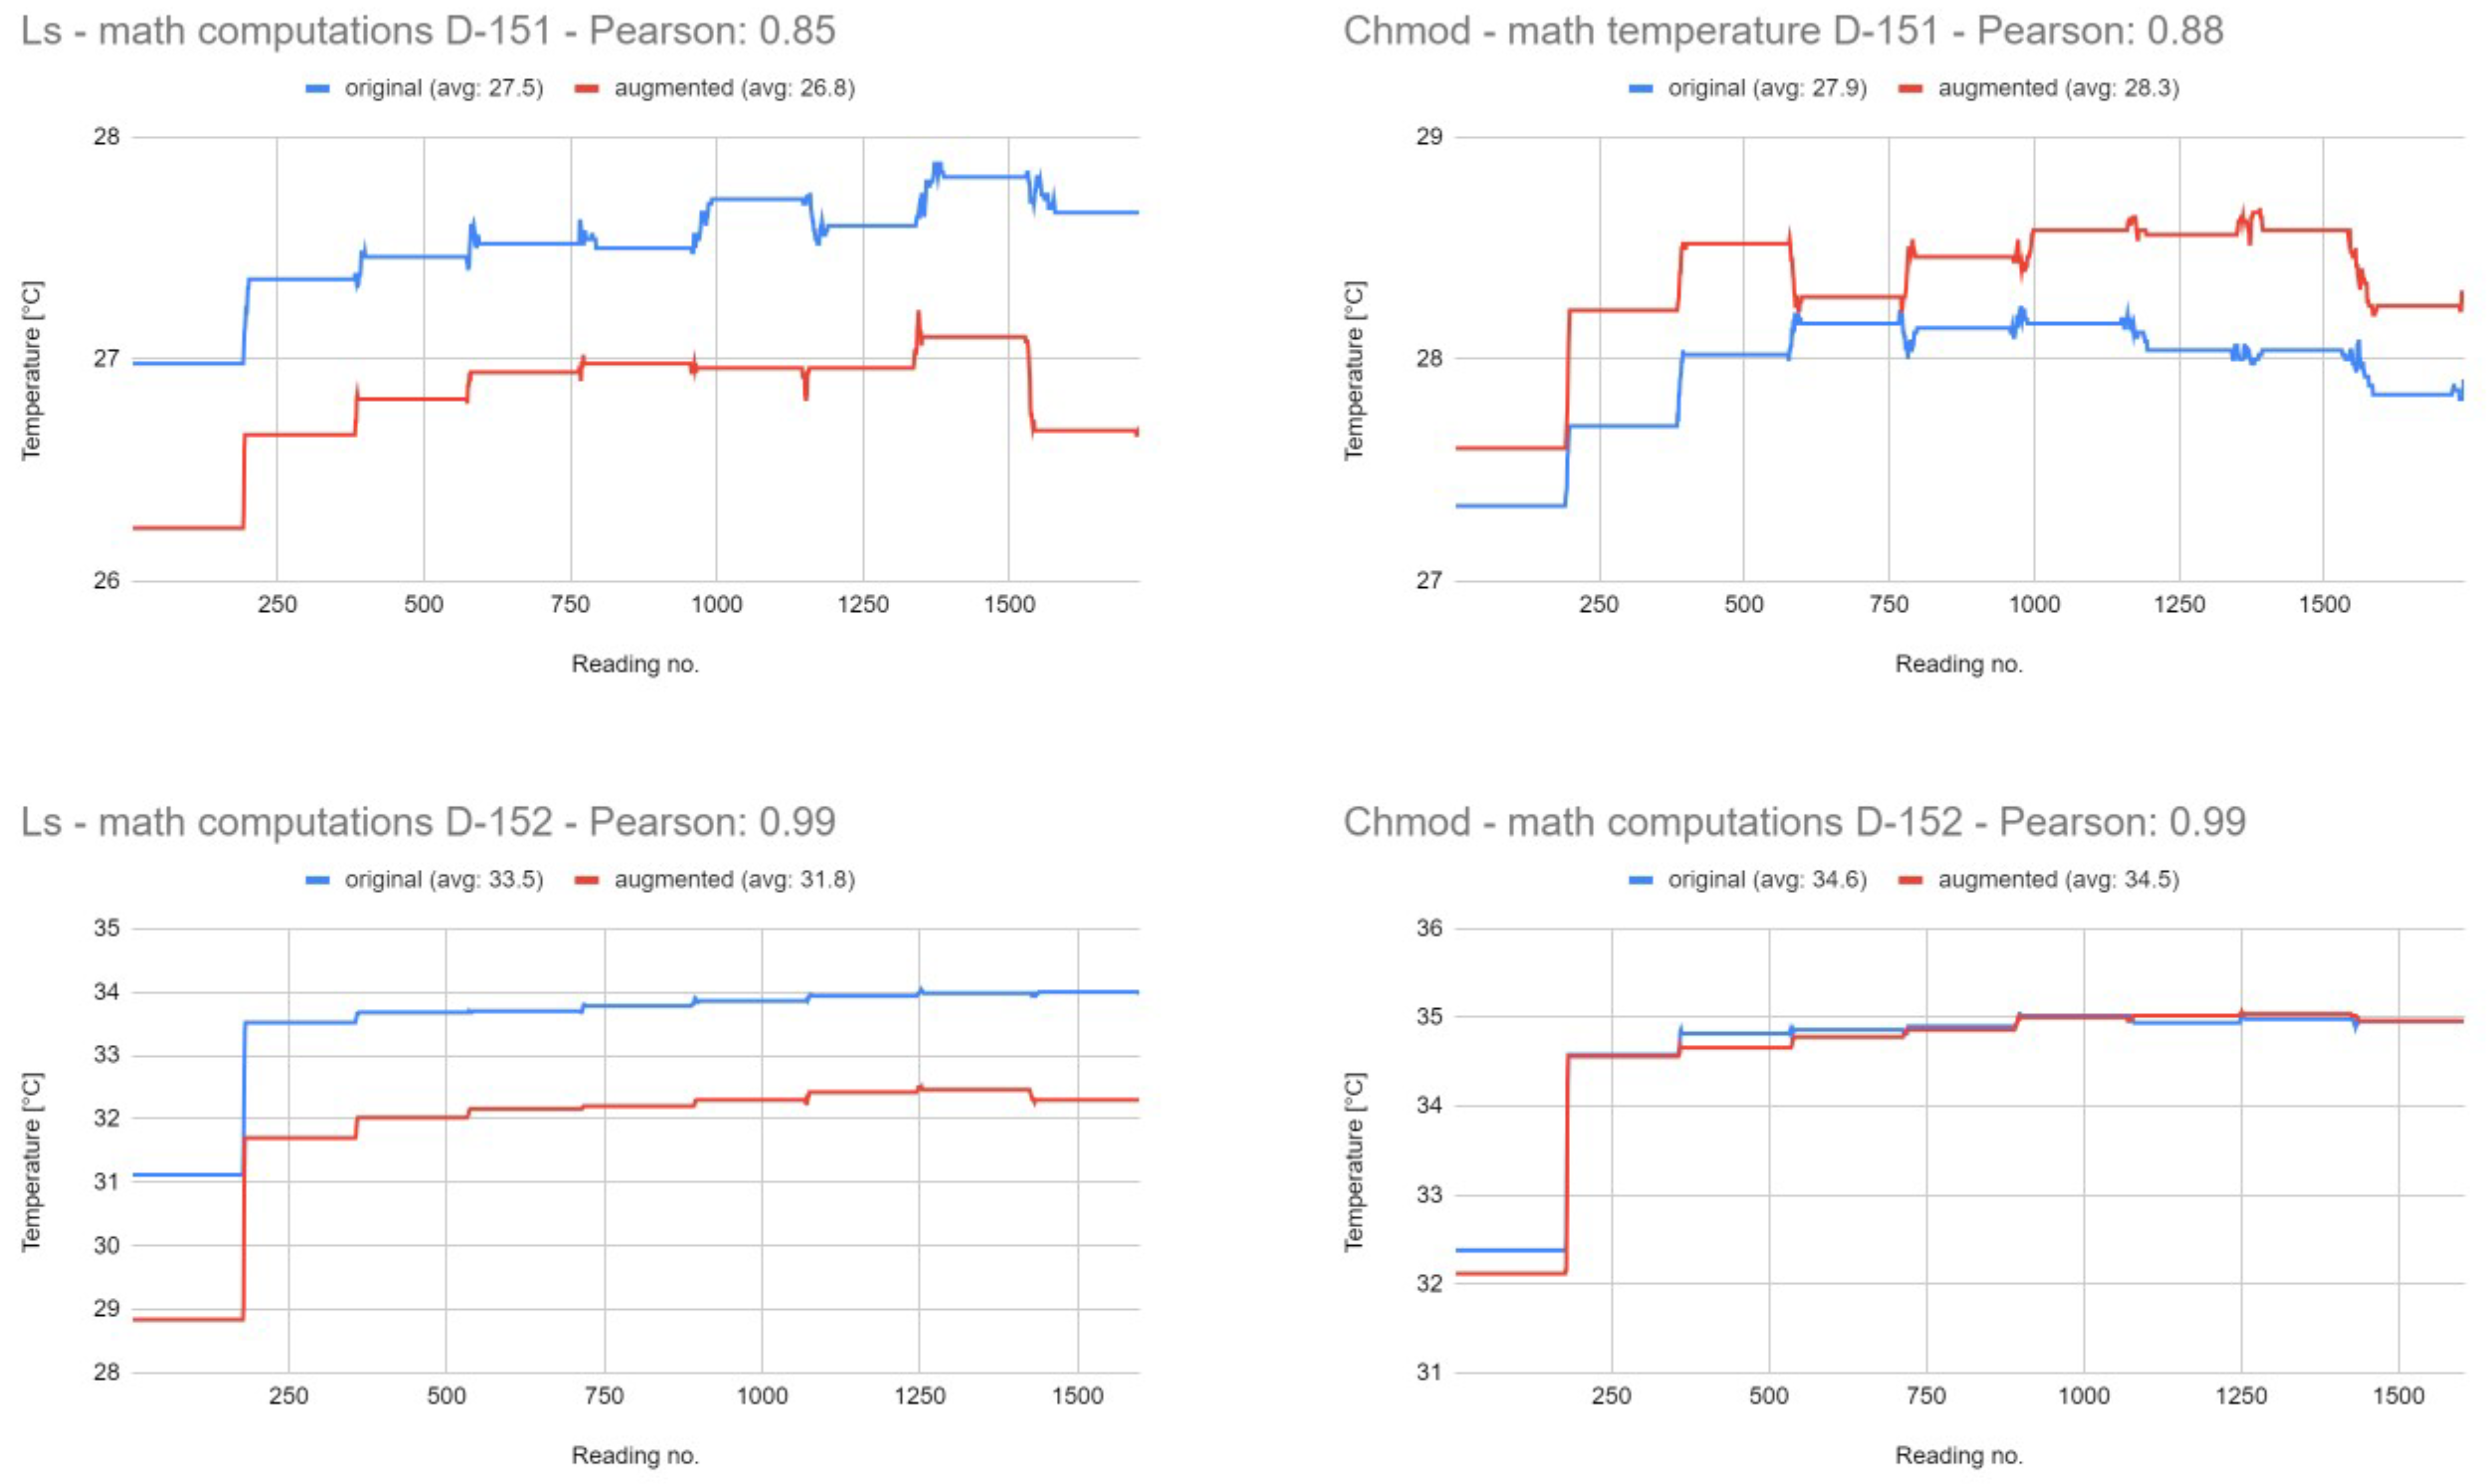
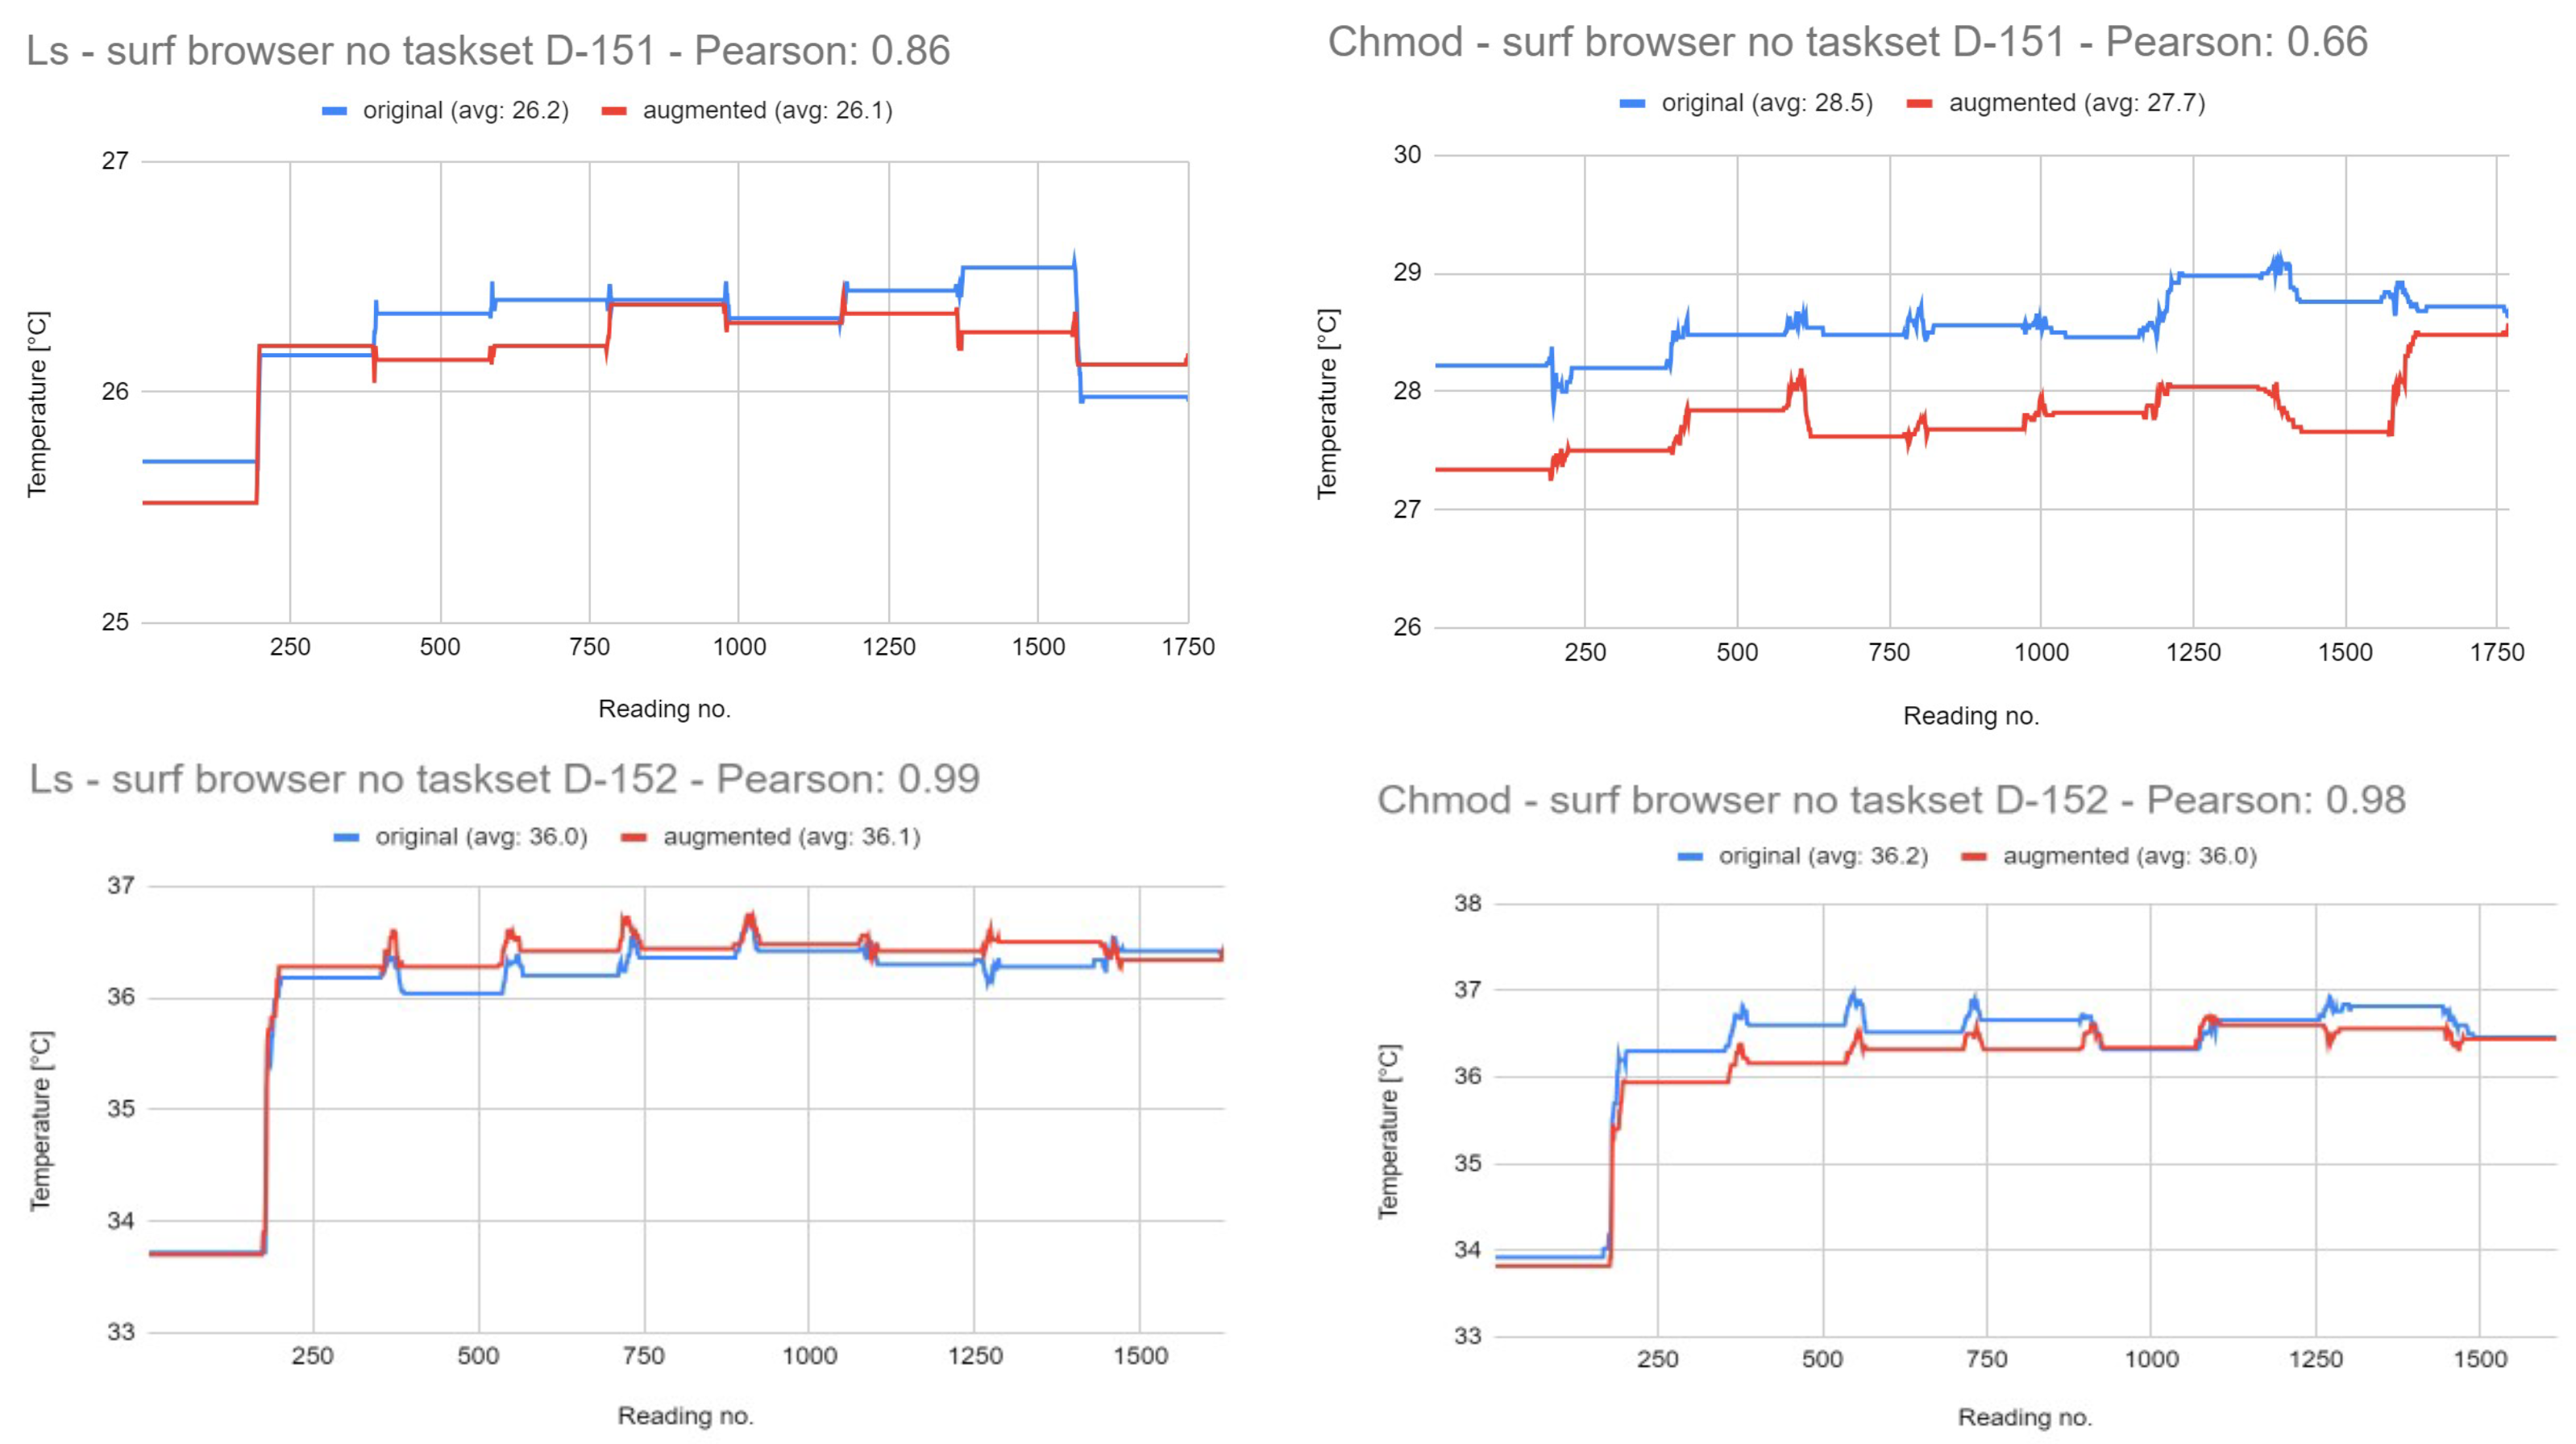
For the other two desktops,
D-151 and
D-152, the results in terms of Pearson correlation are all over 0.93. However, they are not so conclusive in terms of difference in the average temperature where we can only see 0.1 °C (see
Figure 6 and
Figure 7). We attribute these results to the older CPUs, which have thermal sensors with lower accuracy, and a small number of physical cores which can influence each other through heat dissipation. Further, we will present the results of
D-151 and
D-152 systems in the
Appendix A.
3.2. Results Using CPU Affinity
As we already mentioned, when we introduced the noise, we doubled the experiments. First, the noise was applied on the same core as the command, whose results are presented in this subsection. Second, noise was used without setting the CPU affinity, whose results are presented in the next subsection. By selecting the CPU affinity, there will be more noise on the respective core.
3.2.1. Noise: Playing Song
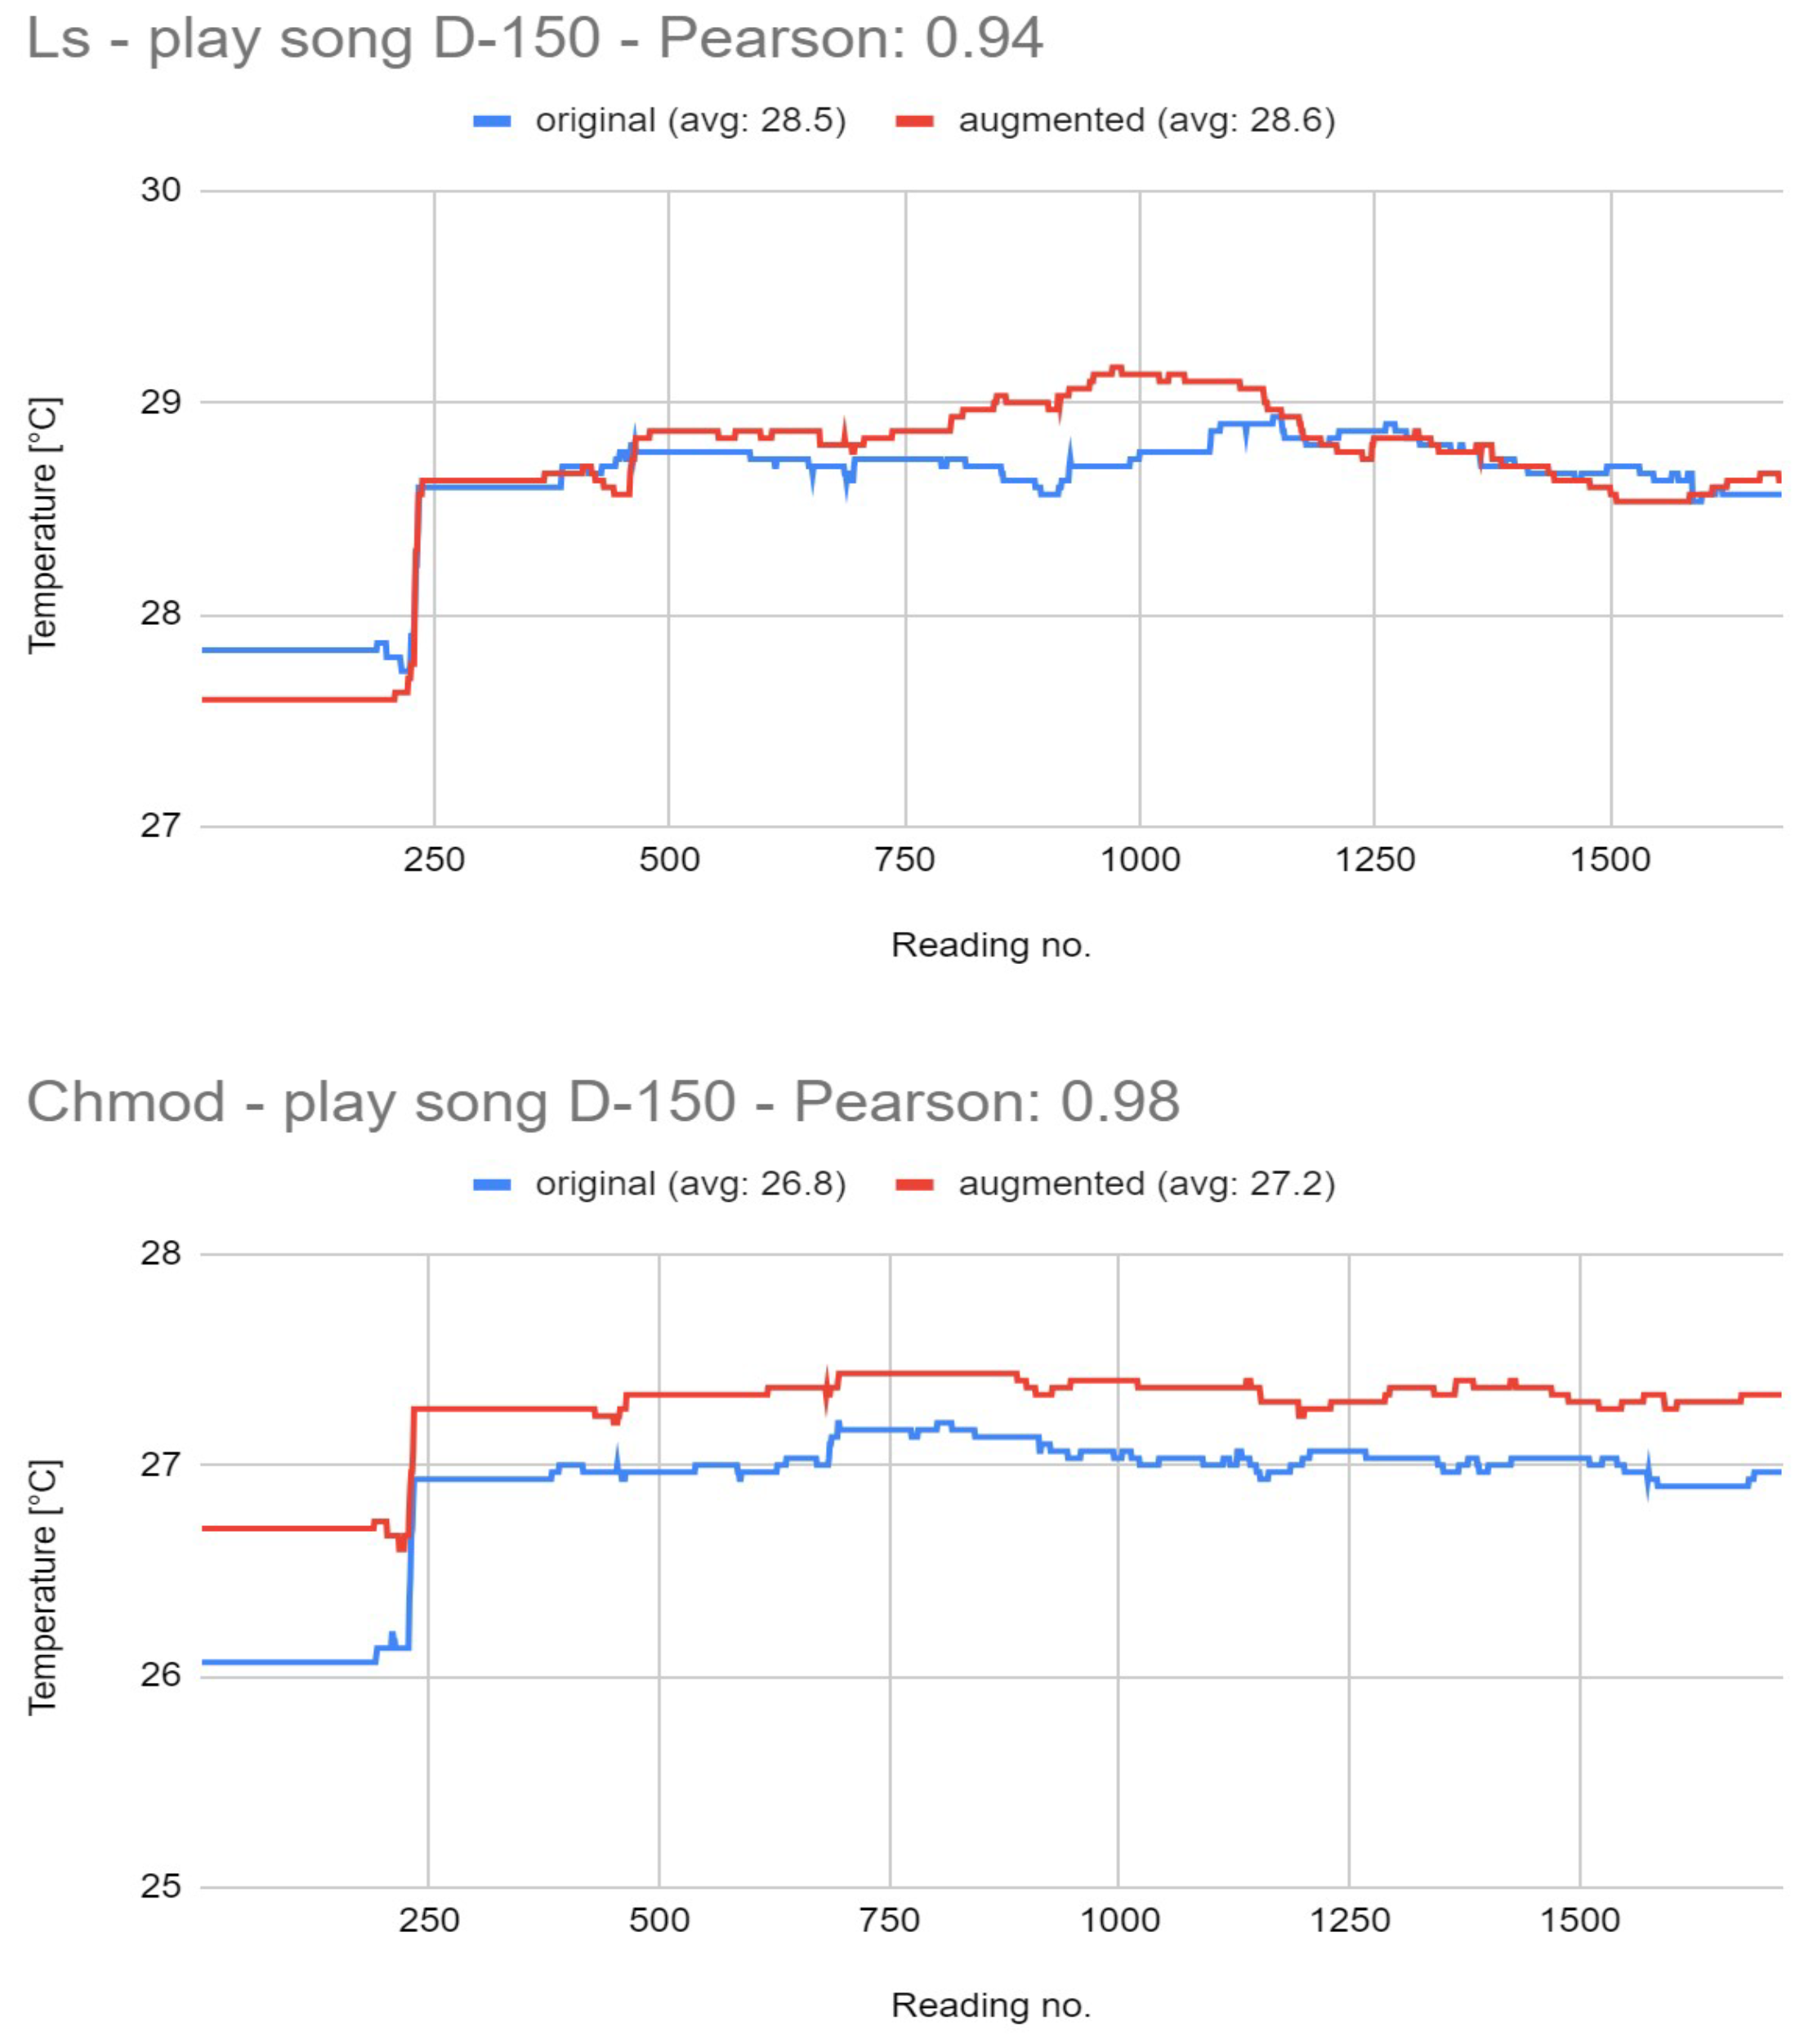
The experiments where the song was introduced lead to high correlations (see
Figure 8) of 0.94 for the
ls command and 0.98 for the
chmod command, respectively. We can see a difference in the average temperature between the authentic and augmented commands up to 0.4 °C, as a result of which the augmented command spreads more heat. The high correlation in the pattern of the commands and the augmented command having a higher temperature, lead to the conclusion that an anomaly was found. However, for the
chmod command, we see more accurate overall results.
3.2.2. Noise: Moving Files
For moving files as a noise, we performed two experiments, one with a big file of 18.8 GB in size (results in
Figure 9) and one with a small file of 3.3 MB in size (results in
Figure 10). As seen in
Figure 9, the correlation between the two temperature vectors is 0.66 for
ls and 0.74 for
chmod, with a difference in the average temperature of almost 2 °C. Even if the difference in temperature is visible, considering the lower correlation values, one cannot conclude whether there is or not an anomaly taking place.
However, the results for moving the small file are not necessarily the ones expected (see
Figure 10), with a good correlation of 0.77 and 0.79; however, the average temperature of the original command is the same or higher than the one of the augmented one, and we attribute these results on the high probability of caching the small file.
3.2.3. Noise: Browser Surfing
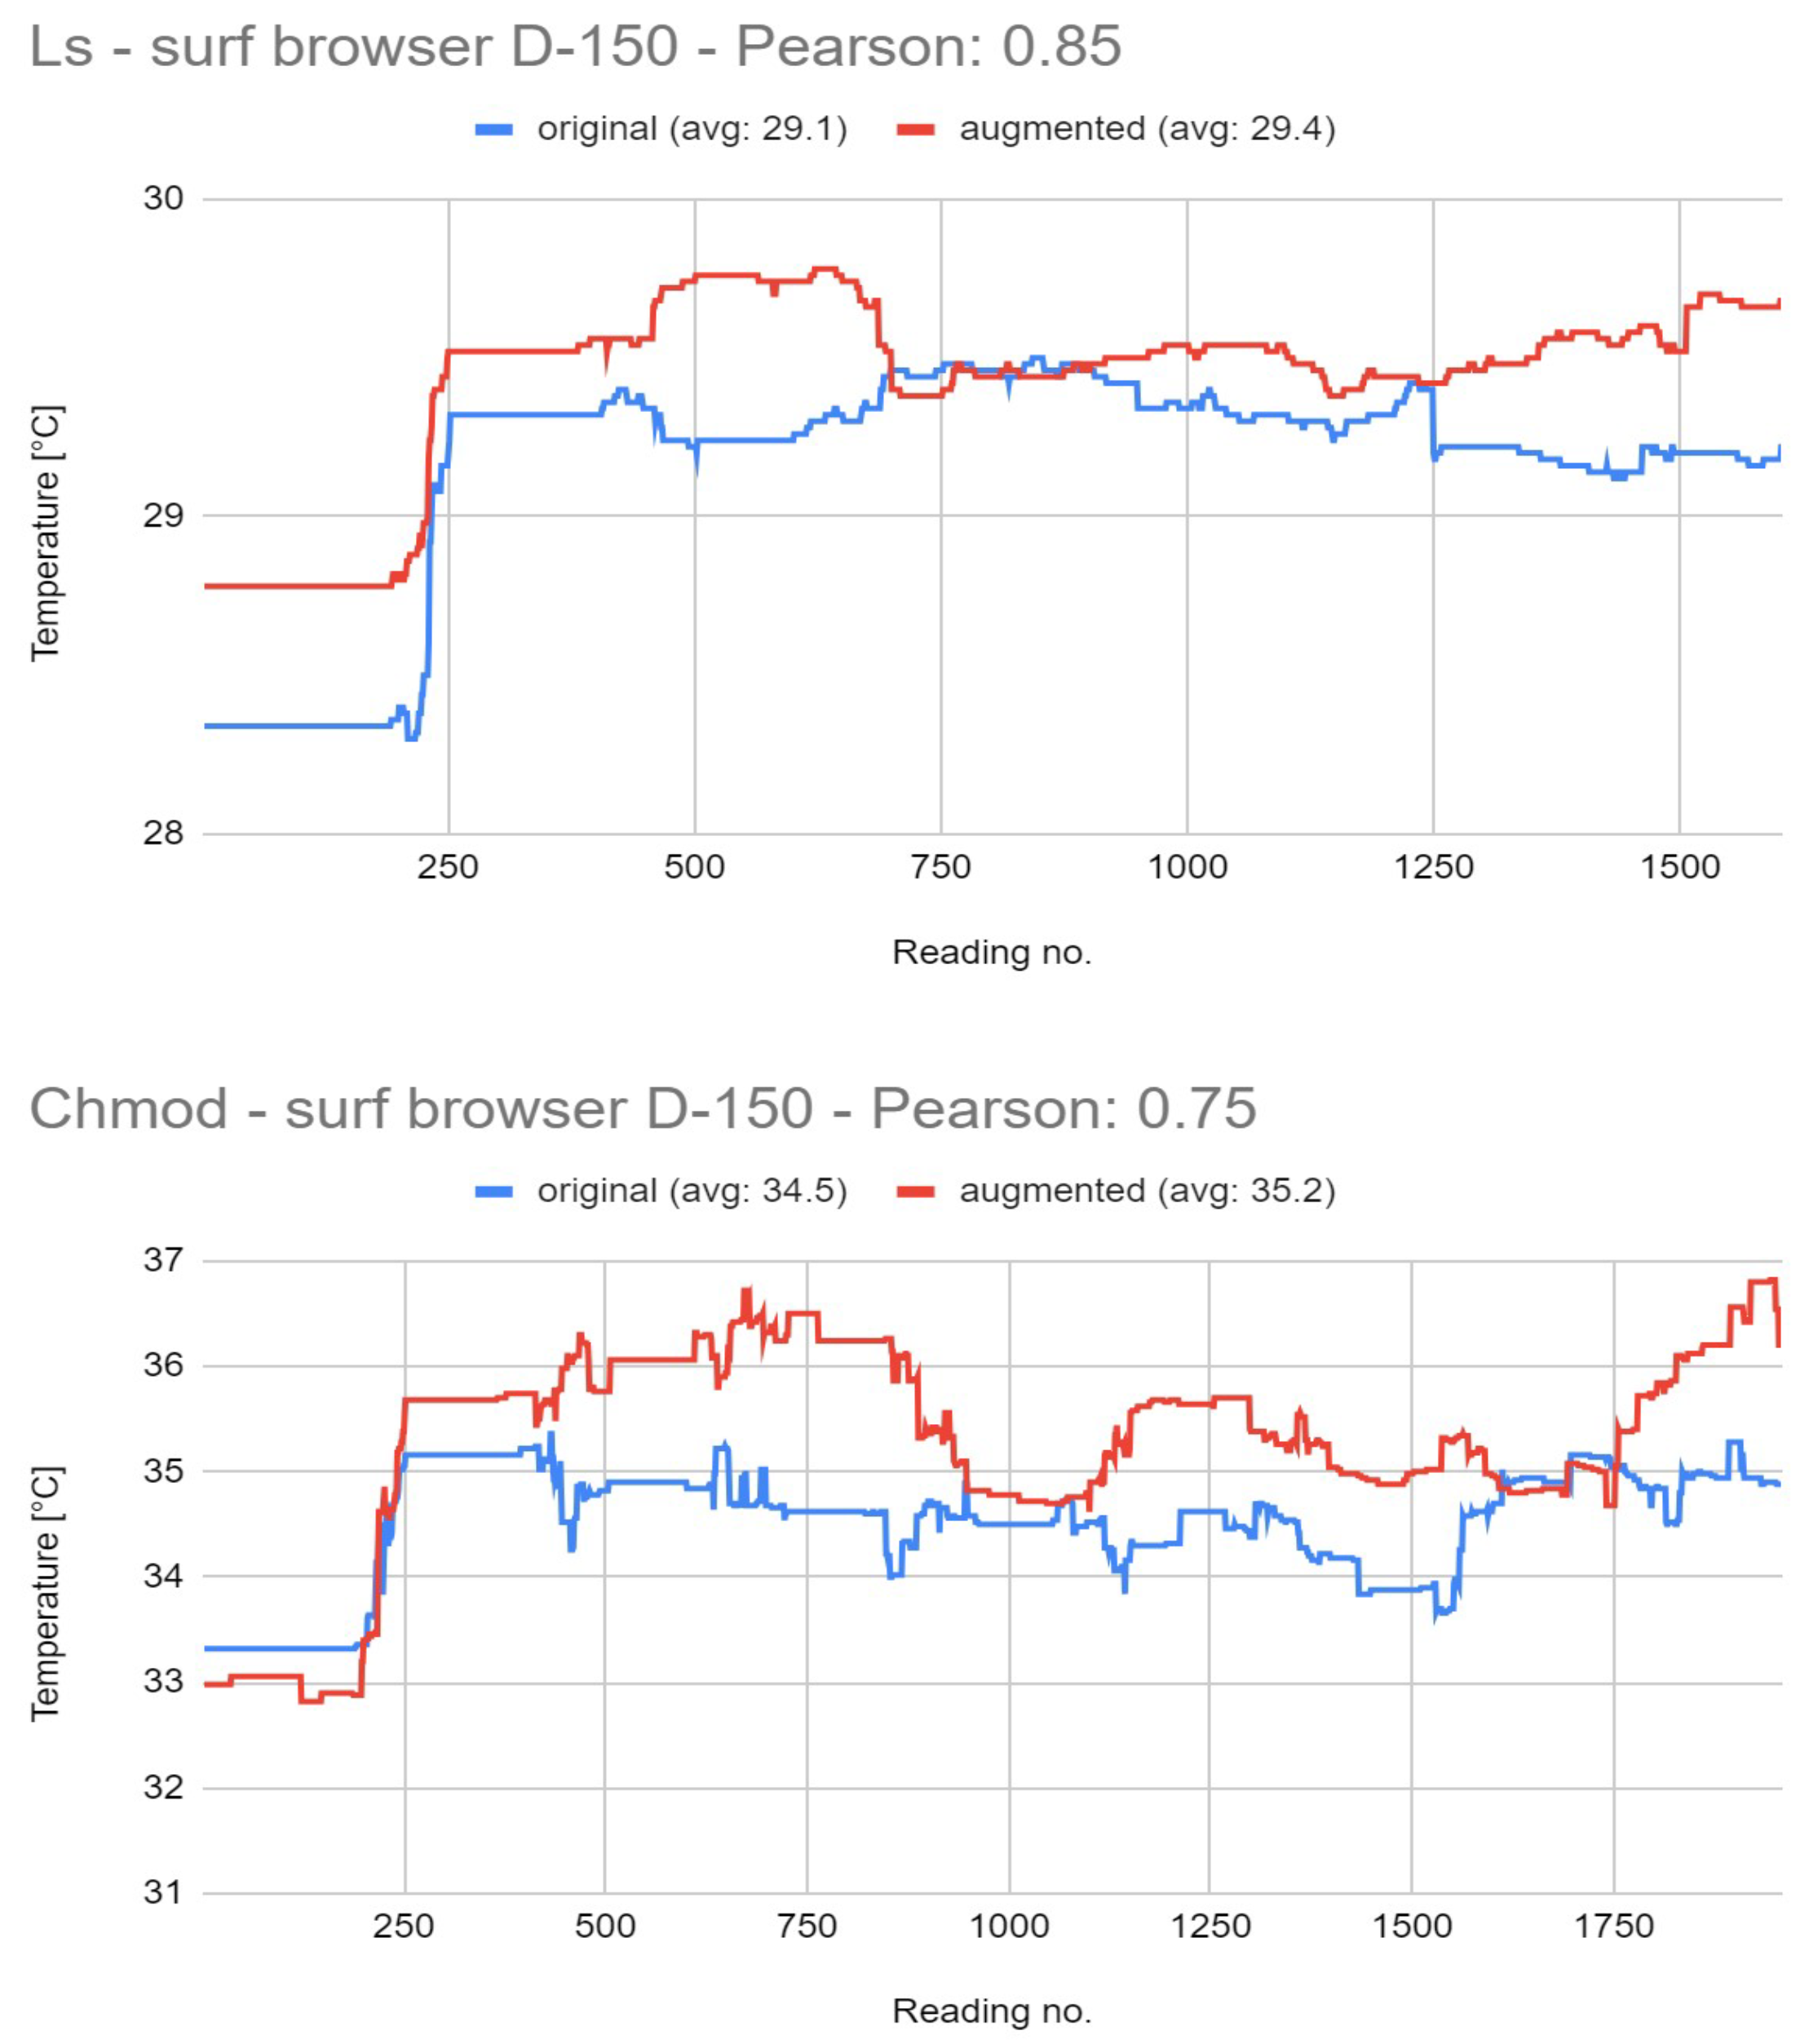
In the browser surfing script, we repeatedly open different sites as Google, Google Maps, StackOverflow, Ubuntu, Geeks for Geeks, Wikipedia, or IEEE, using Firefox browser. The results can be seen in
Figure 11, where there is a high correlation of 0.85 for the
ls command and a good one of 0.75 for the
chmod command. For both commands, the average temperature for the augmented command is higher with 0.3 °C. Thereby, taking into account the high correlation of both patterns and the difference in temperature for the augmented commands, it can be concluded that an anomaly is taking place.
3.2.4. Noise: Keystrokes
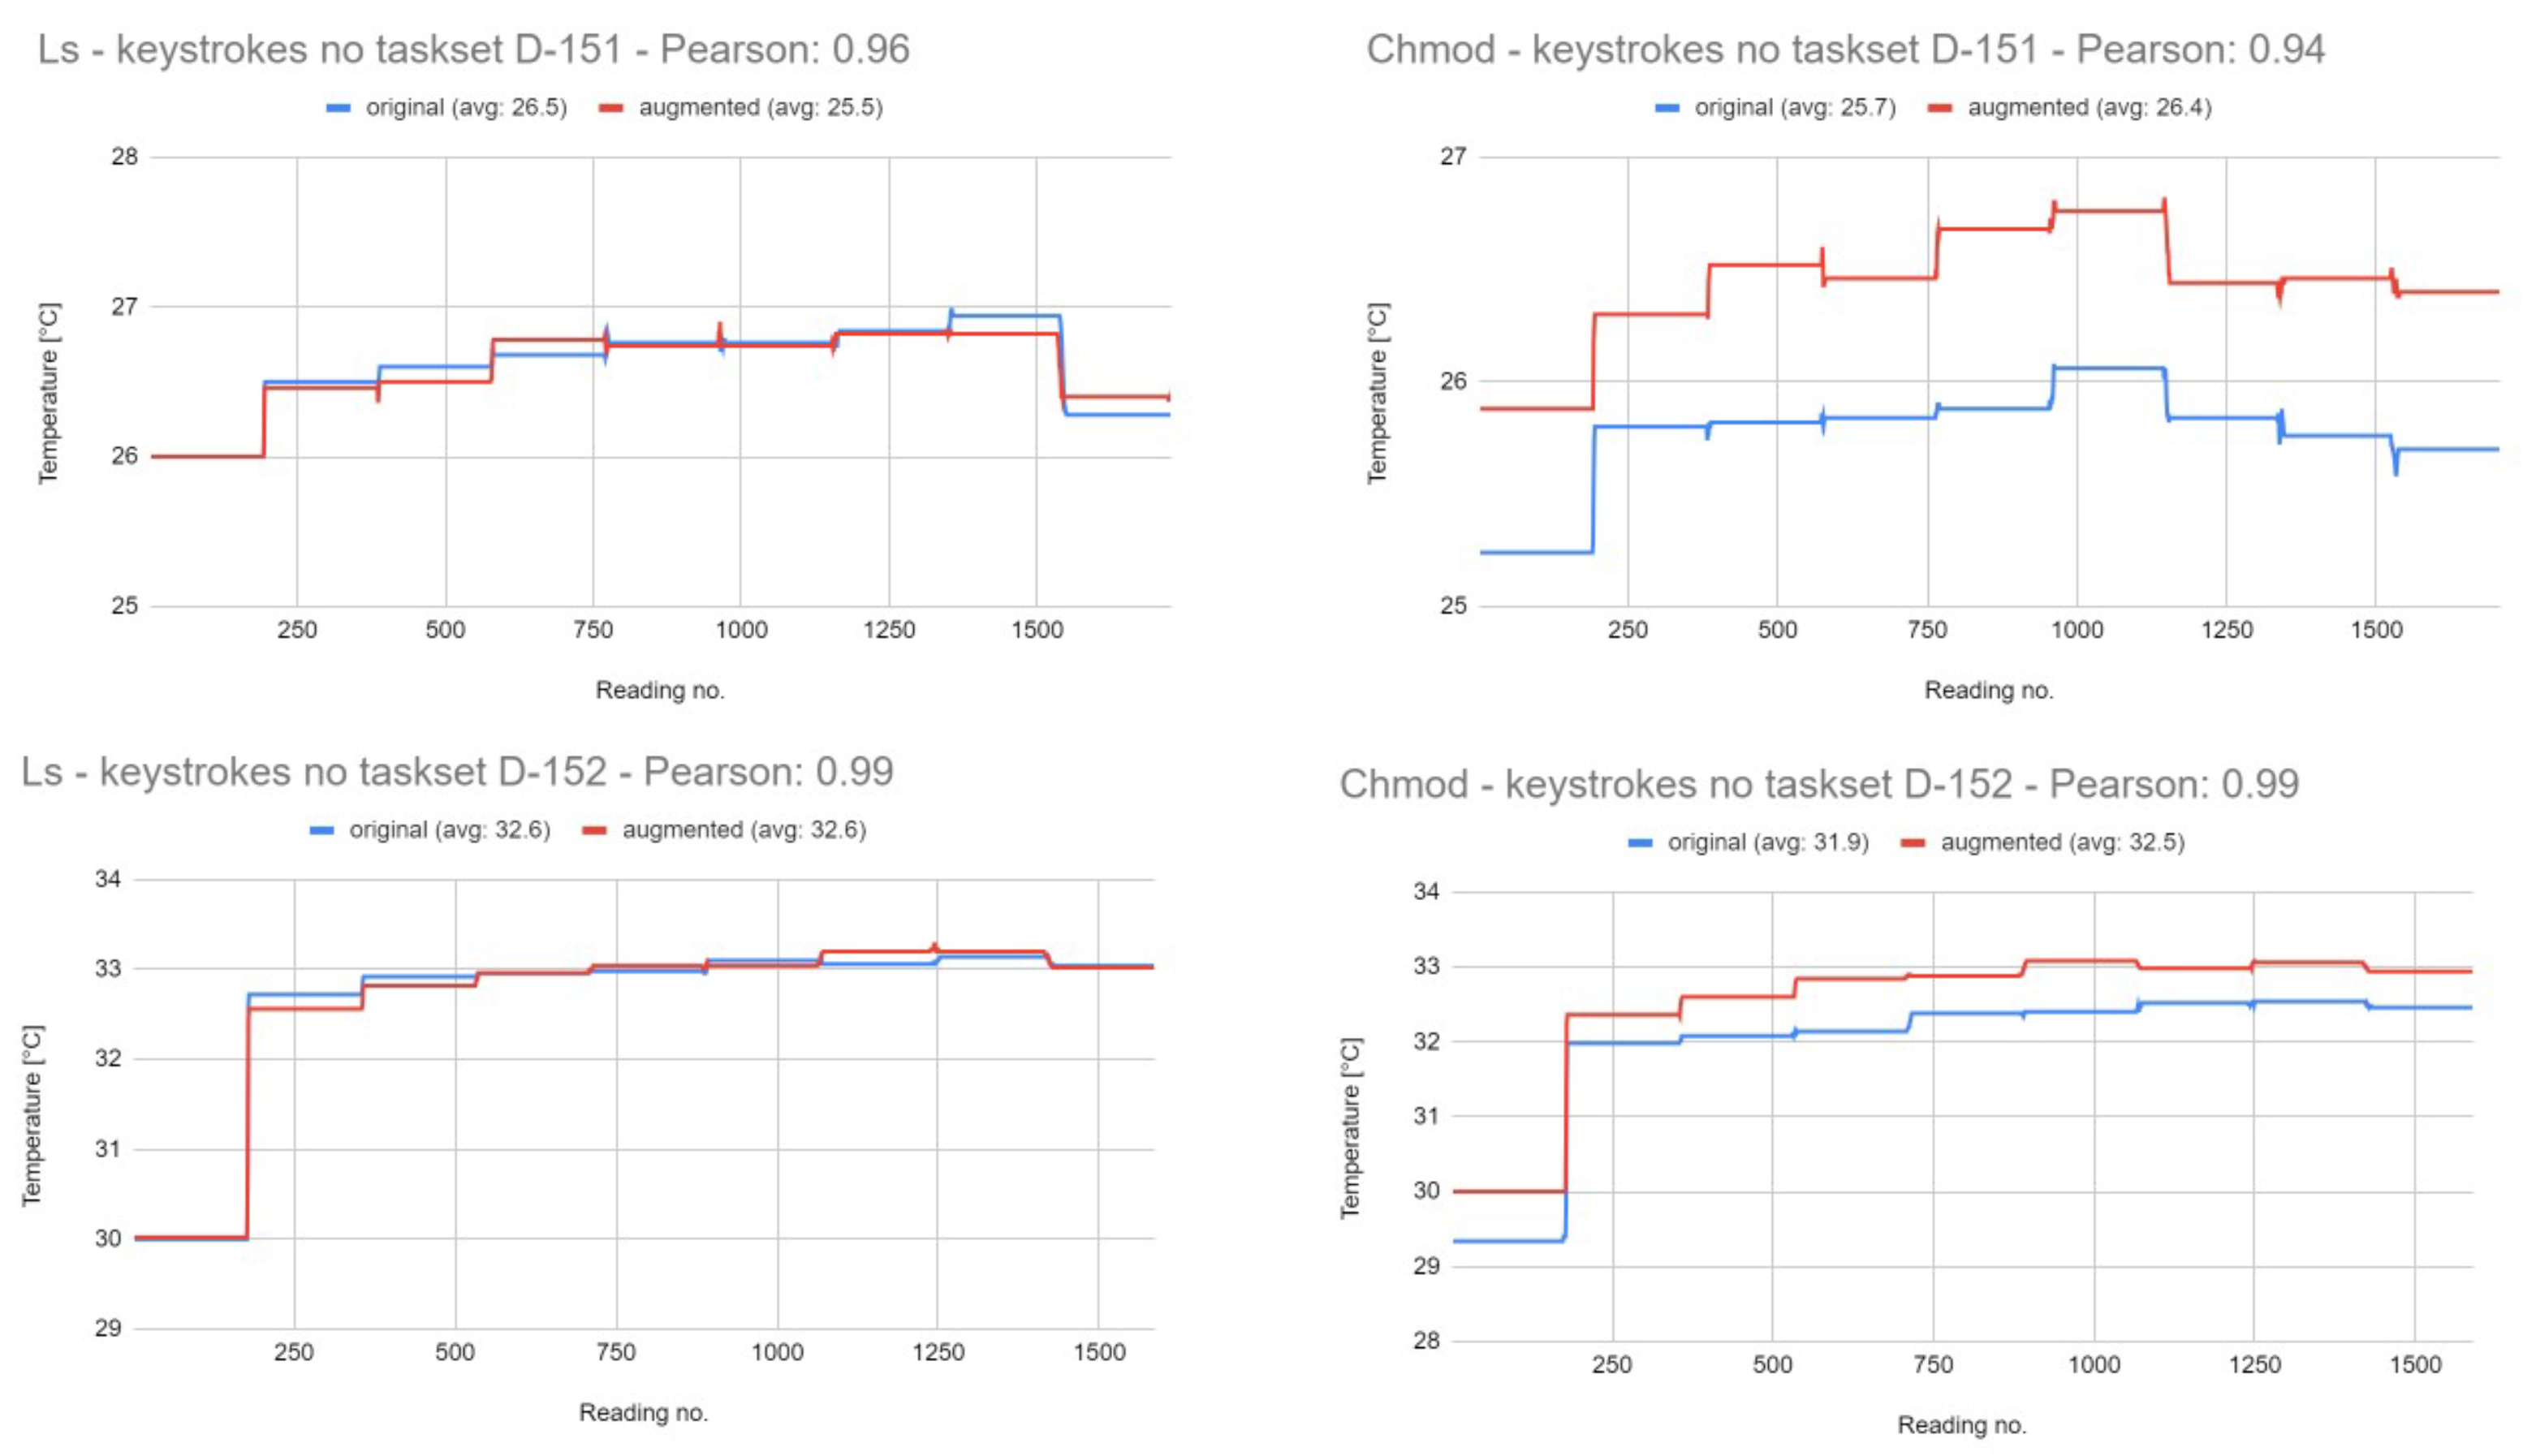
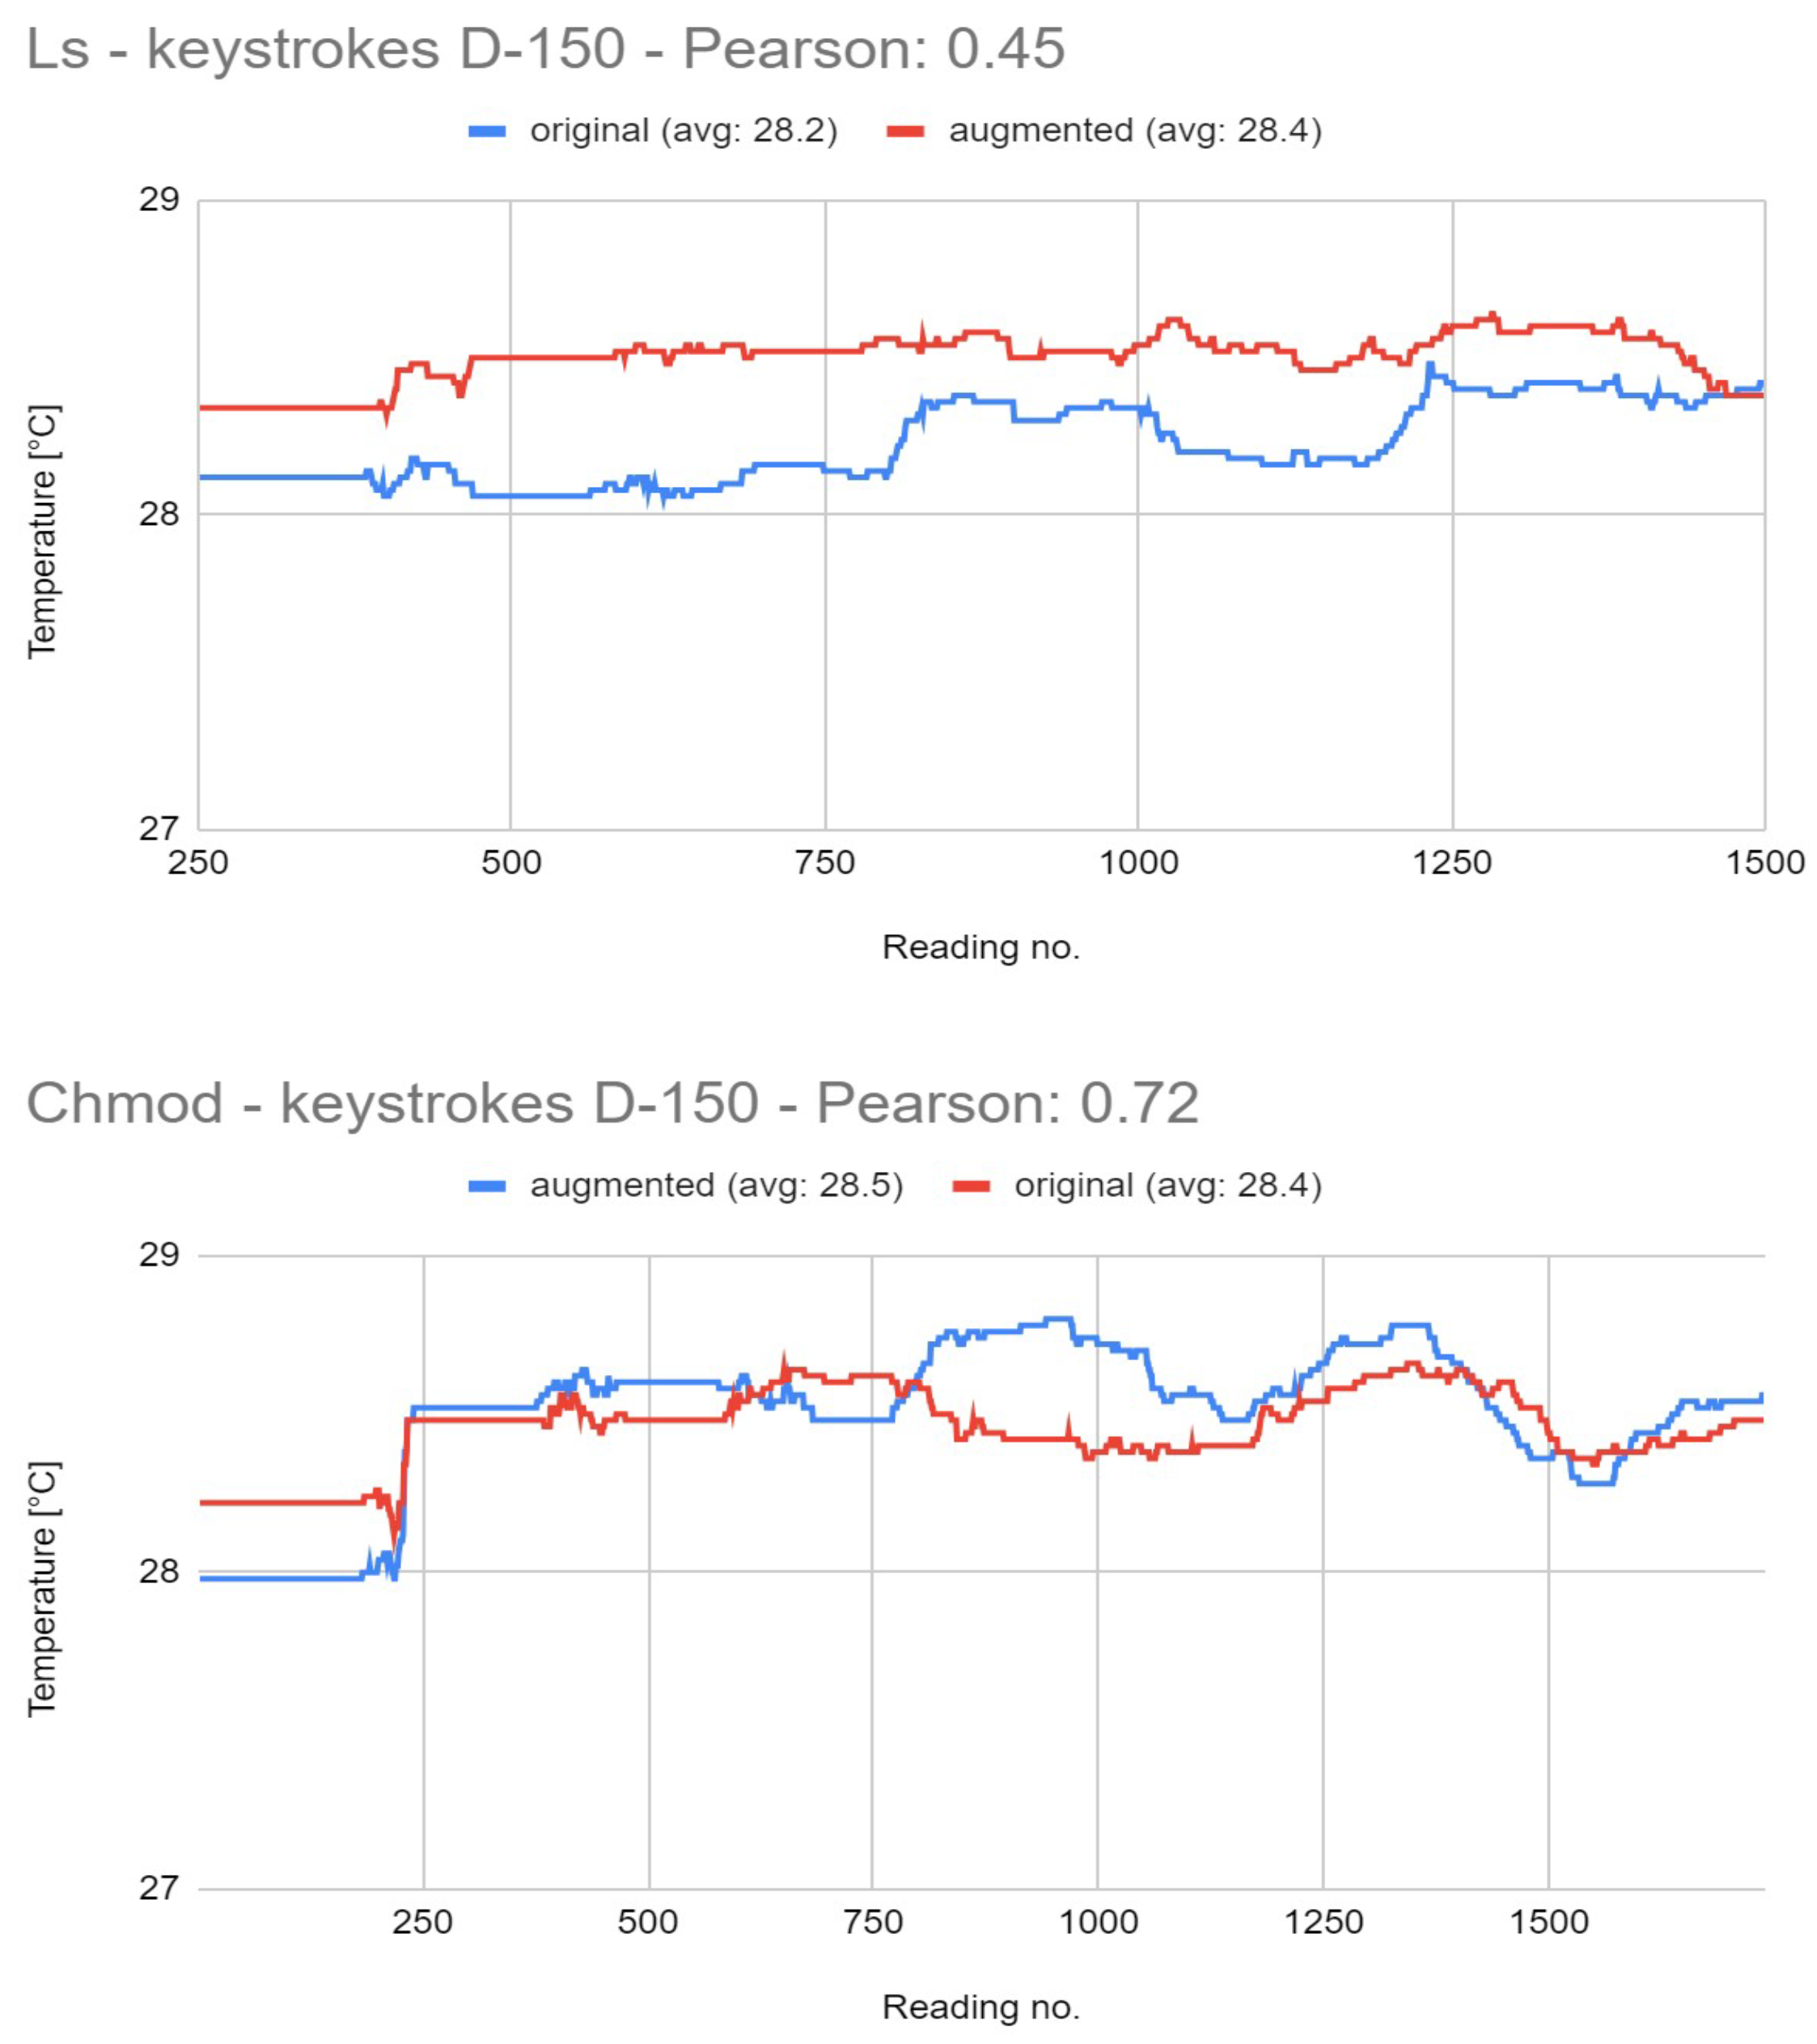
The simulation of keystrokes was performed using a text of 123 words. The correlation is between 0.45 and 0.72 for the
ls and
chmod command, respectively, as seen in
Figure 12. Moreover, the average temperature between the authentic and augmented command is 0.2 °C for the first one and −0.1 °C for the second one. These results lead to the conclusion that, for the
ls command, the anomaly can be detected; however, for the
chmod command, it can not.
3.2.5. Noise: Mathematical Computations
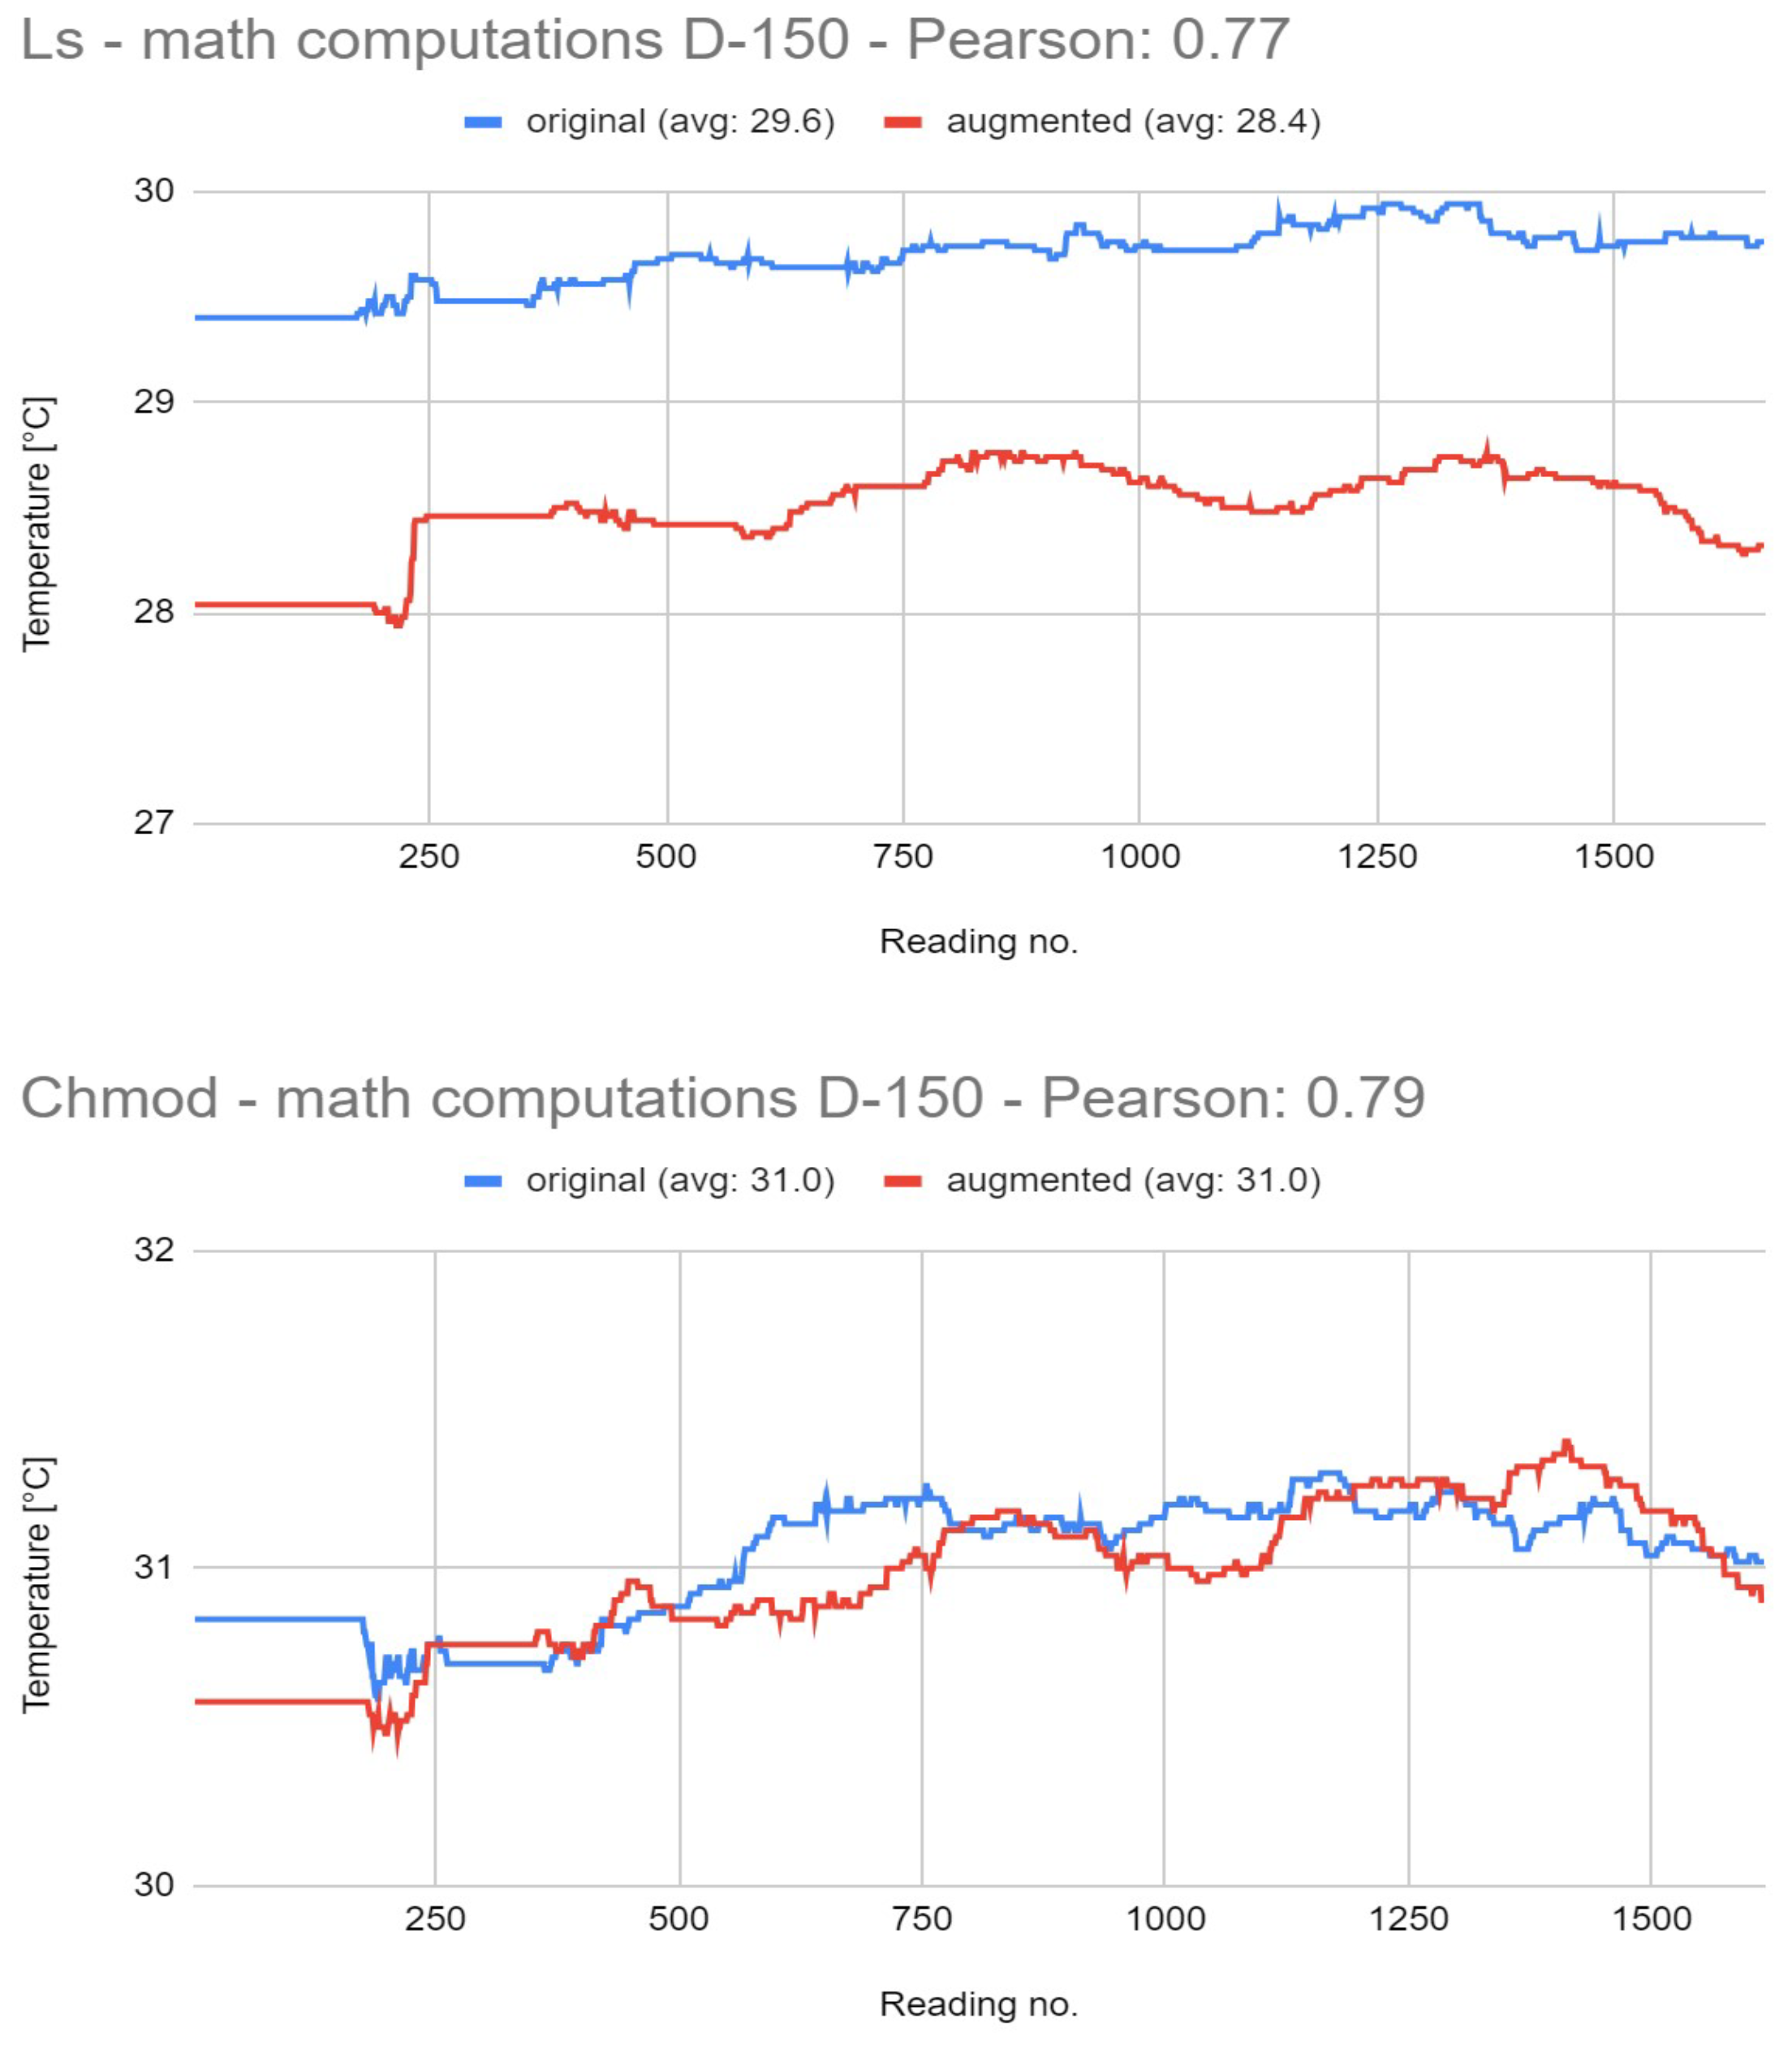
Similar results to that in the keystroke experiment are seen in the mathematical computations in
Figure 13. Since the mathematical computations as well as the keystrokes were performed in a repeated way, it is possible that the optimization mechanisms, as caching, were applied. Still, the Pearson correlation is a quite high one between 0.77 and 0.79, which leads to the conclusion that the pattern of the command remain very similar in different scenarios, even though the average temperature is higher for the original command. Going forwards, similarly as in keystrokes, these results will not lead to an anomaly detection.
3.3. Results without Using CPU Affinity
In this subsection, we will present the results while not selecting CPU affinity for the noise, instead letting the OS decide where to run.
3.3.1. Noise: Playing Song
For the experiments where the noise consists of playing the song while the CPU affinity was not set, it can be seen in
Figure 14 that the temperature for the augmented command is lower than the original one, and results were reproduced on almost all the experiments where we did not select a specific core for the noise. This happens most probably because the OS used one of the optimization methods. Still, the Pearson correlation index has good values, 0.7 and 0.8, respectively, with an average difference between temperatures of 0.3 °C.
3.3.2. Noise: Moving Files
In the experiments where the noise was moving a file, without selecting the affinity of the CPU, we used the small-sized file. In terms of correlation, we have a high correlation of 0.88 and 0.93, respectively, which shows a high similarity in the pattern of execution, which can also be visually observed in
Figure 15. Again, the difference in temperature is 0.2 °C for both experiments, where the original command has a higher temperature.
3.3.3. Noise: Browser Surfing
In the experiments where we used surfing the browser as a noise (see
Figure 16), we again saw that most of experiments have the original command with a higher temperature than the augmented one. However, the Pearson correlation indexes have good values up to 0.77.
3.3.4. Noise: Keystrokes
While using the keystrokes as a noise, we saw better results for the
chmod command (see
Figure 17), with a correlation index of 0.82 and a difference of 1 °C between the original and augmented commands average temperature, something that cannot be seen in case of the
ls command, where the correlation is 0.58 and the average temperature is the same. In conclusion, the results for the
chmod command can be used for an anomaly detection.
3.3.5. Noise: Mathematical Computations
In the case of noise made up of mathematical computations, just like in the case of keystrokes, better results can be seen for the
chmod command in
Figure 18. For
chmod, the correlation index shows a value of 0.68, while the difference between average temperature is half a degree Celsius. Even though the correlation for the
ls command is a high one of almost 0.80, the temperature of the original command is visibly higher.
4. Discussion
4.1. Anomaly Detection
In this paper, we propose BeatTheHeat, a technique that performs anomaly detection through the thermal sensors of the CPU, aiming to distinguish between an authentic Linux command and an augmented one, while a lot of noise appears on the CPU.
In comparison with the initial study, we can see a similar difference in the average temperature of the commands, between 0.5 and 1 degrees Celsius. However, the correlation between the patterns of the original and augmented command is higher in this study. In the case of
ls command, in this paper, we have a higher correlation of 0.85, instead of 0.73 as in the Hot-n-Cold paper [
2], while for the
chmod command, the correlation was 0.96 instead of 0.83. These results are better due to the increased number of traces for the thermal analysis used in this paper. Hence, a good correlation (above 0.80) leads to the conclusion that the commands are very similar in their pattern, in both their forms (i.e., original and augmented), which makes it possible to detect an attack taking in consideration their temperature values. An abnormal (i.e., higher) temperature for a specific command leads to the conclusion that it has additional code inserted.
As we already stated in the results section, more accurate results were achieved using the D-150 system. We attribute these results to the year of manufacture of the processor and the larger number of cores. Furthermore, we can see a difference between D-151 and D-152, with better results for the first one, the year of production being again a reason for better results, in our opinion.
This technique is directed towards any system that uses an Intel CPU; however, it can also be extended to any other device, including IoT devices that have and use thermal sensors, from which the temperature can be retrieved.
4.2. Anomaly Detection Using Machine Learning
To increase the effectiveness of our technique, we further implement a Machine Learning (ML) algorithm to help us decide whether we encounter an anomaly or not. The chosen algorithm is K-Nearest Neighbors (KNN), which helps us to classify whether a thermal trace comes from an authentic command or an augmented one. Therefore, the two classes used in the algorithm are called original and augmented, and both contain, as features, the vectors of temperatures collected in the above experiments.
We used the algorithm with two sets of data. The first one contains the ls temperature vectors, and the other one contains the same data for the chmod command, both having 70 thermal traces for the training part and 24 and 25 traces for the testing part. The datasets are composed of the traces of both commands with a moving file as a noise, created by concatenating the traces for the original and modified commands. The set for testing was made by repeatedly counting the fourth trace in the original dataset and extracting it for a test, the other traces remaining for the training part.
For both experiments, we used the number of nearest neighbors, with k having a value of 15, together with the Euclidean distance.
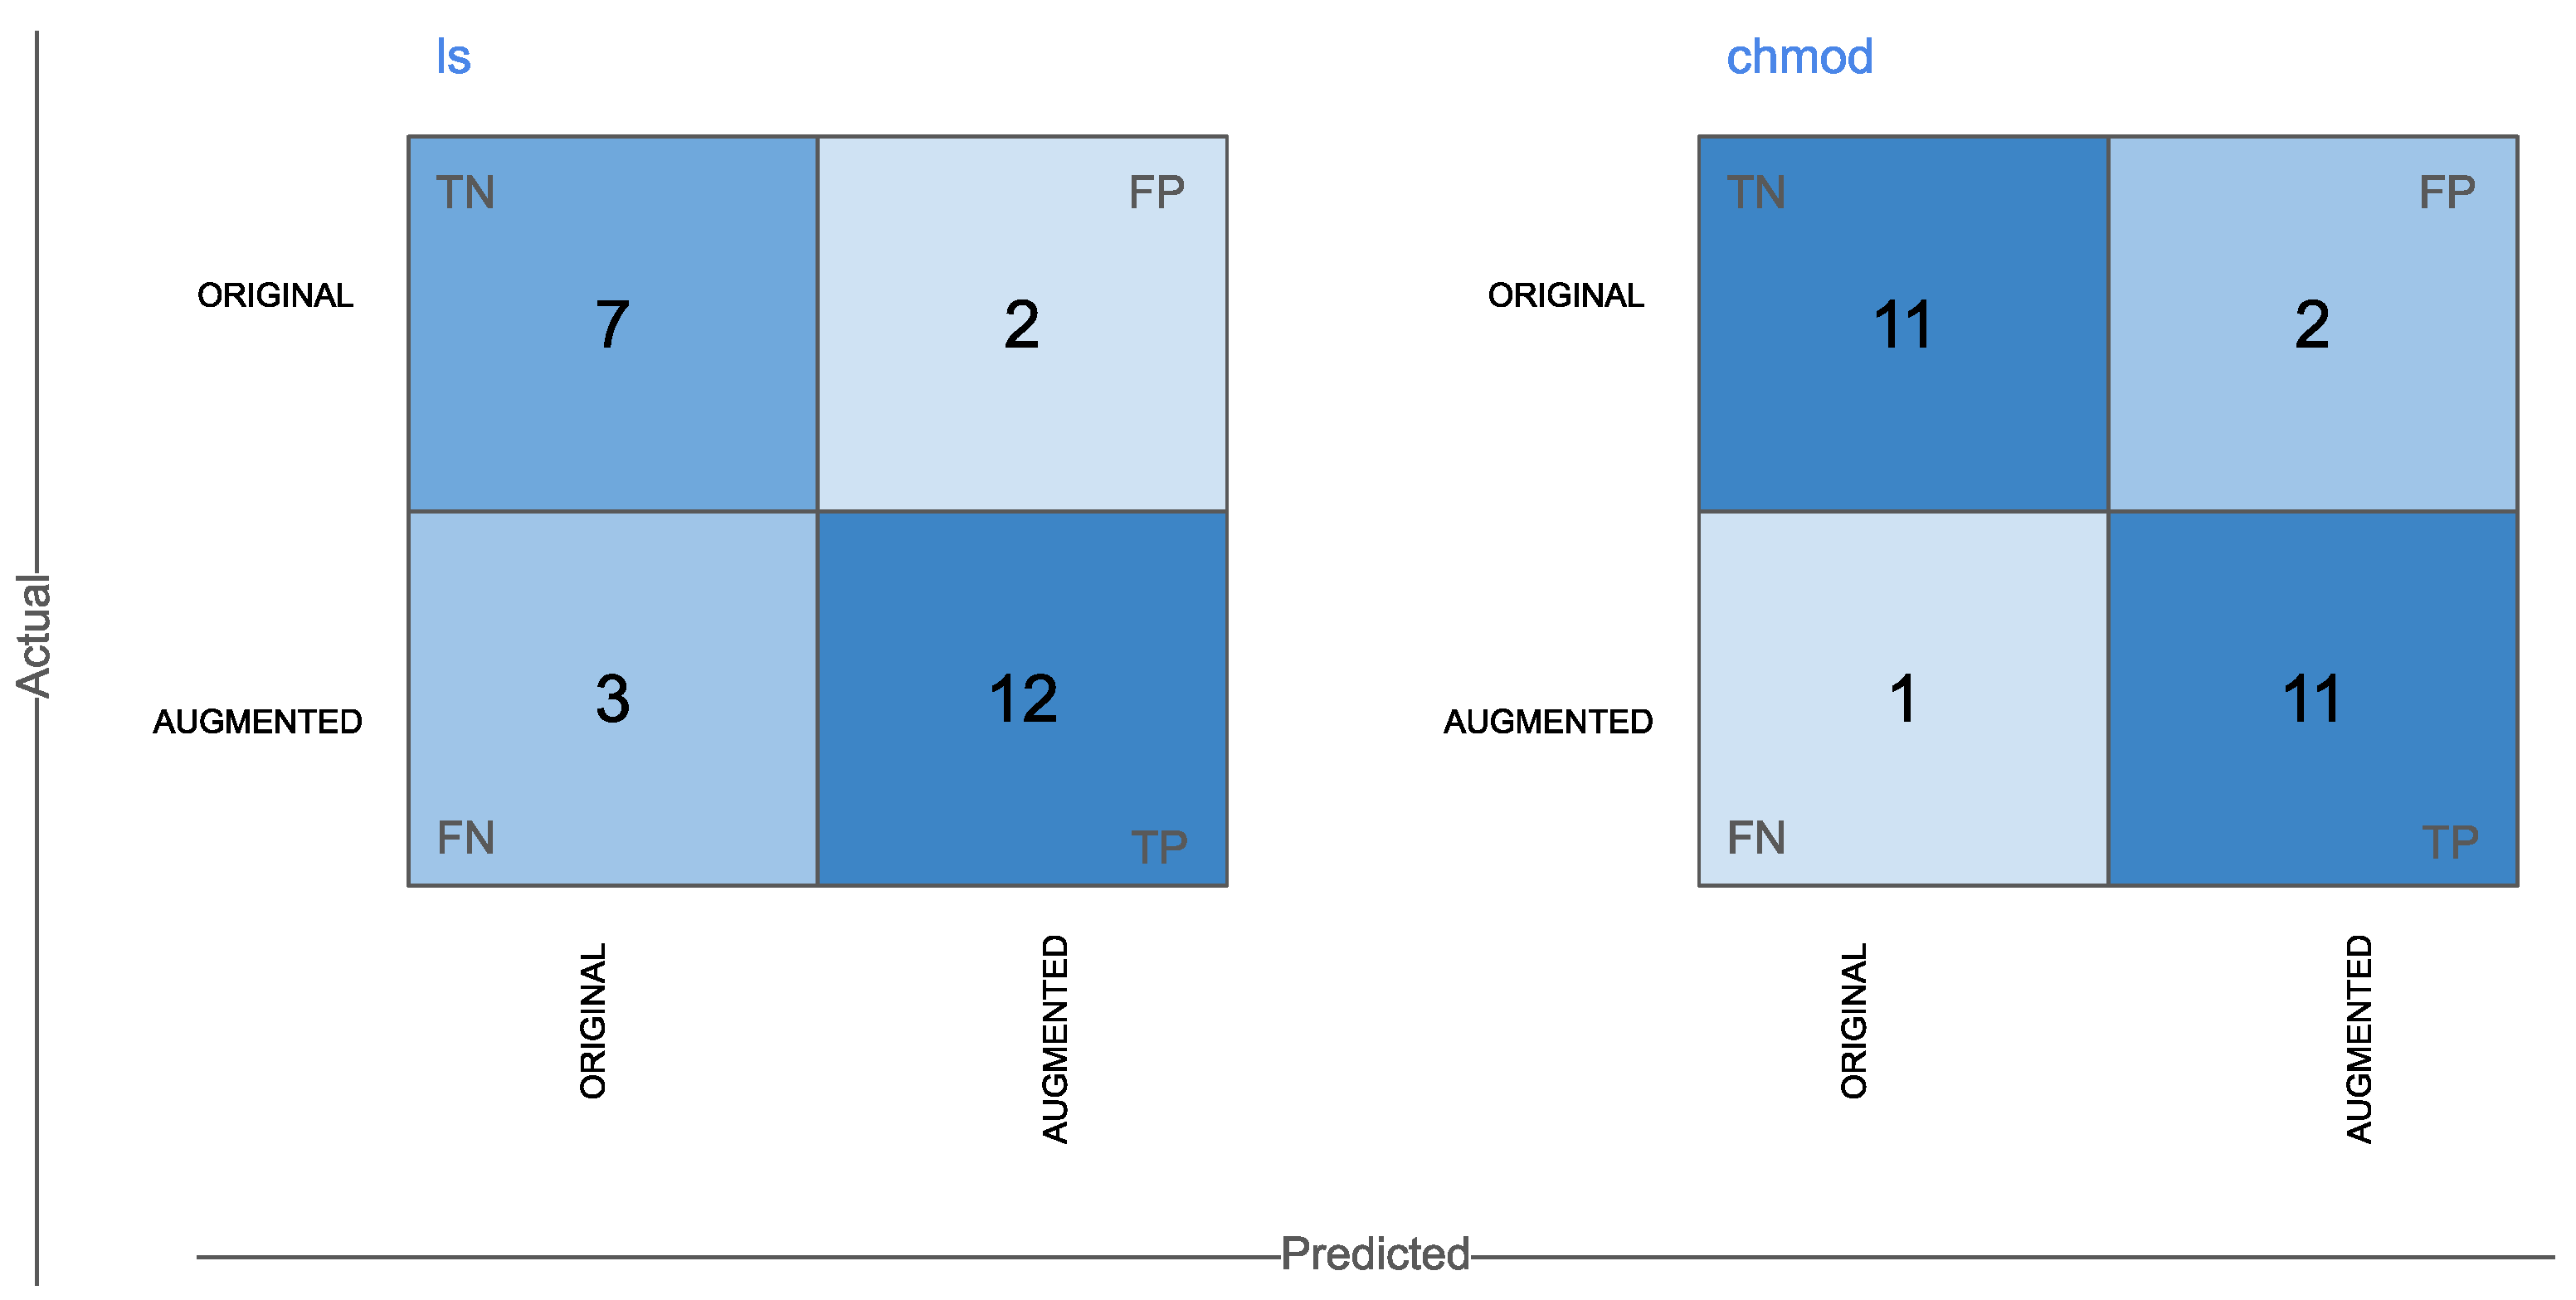
In
Figure 19, there are the confusion matrices for
ls (left) and
chmod (right) commands. Based on these matrices, we calculated some metrics, as can be seen in
Table 1.
The ML algorithm has improved our experimental research by increasing the efficiency and accuracy of the technique. Moreover, it classifies the traces in an automated way and it helps validate our hypothesis.
The ML algorithm, together with the correlation thermal analysis, helps us to detect an anomaly more effectively.
4.3. Limitations
The nature of the CPU sensors used in this study leads to some limitations in terms of the methodology and the approach. The low resolution of the sensors, of 1 °C, is insufficient for distinguishing the temperatures of individual syscalls, as we originally intended to use in our experiments. Thus, taking in consideration the time required for a syscall to execute (i.e., nanoseconds) and a command to execute (i.e., chmod requires 1 ms to execute and ls requires 2.1 ms), we selected the commands to continue our experiments with. However, arrays of commands needed to be used, due to their extended execution times.
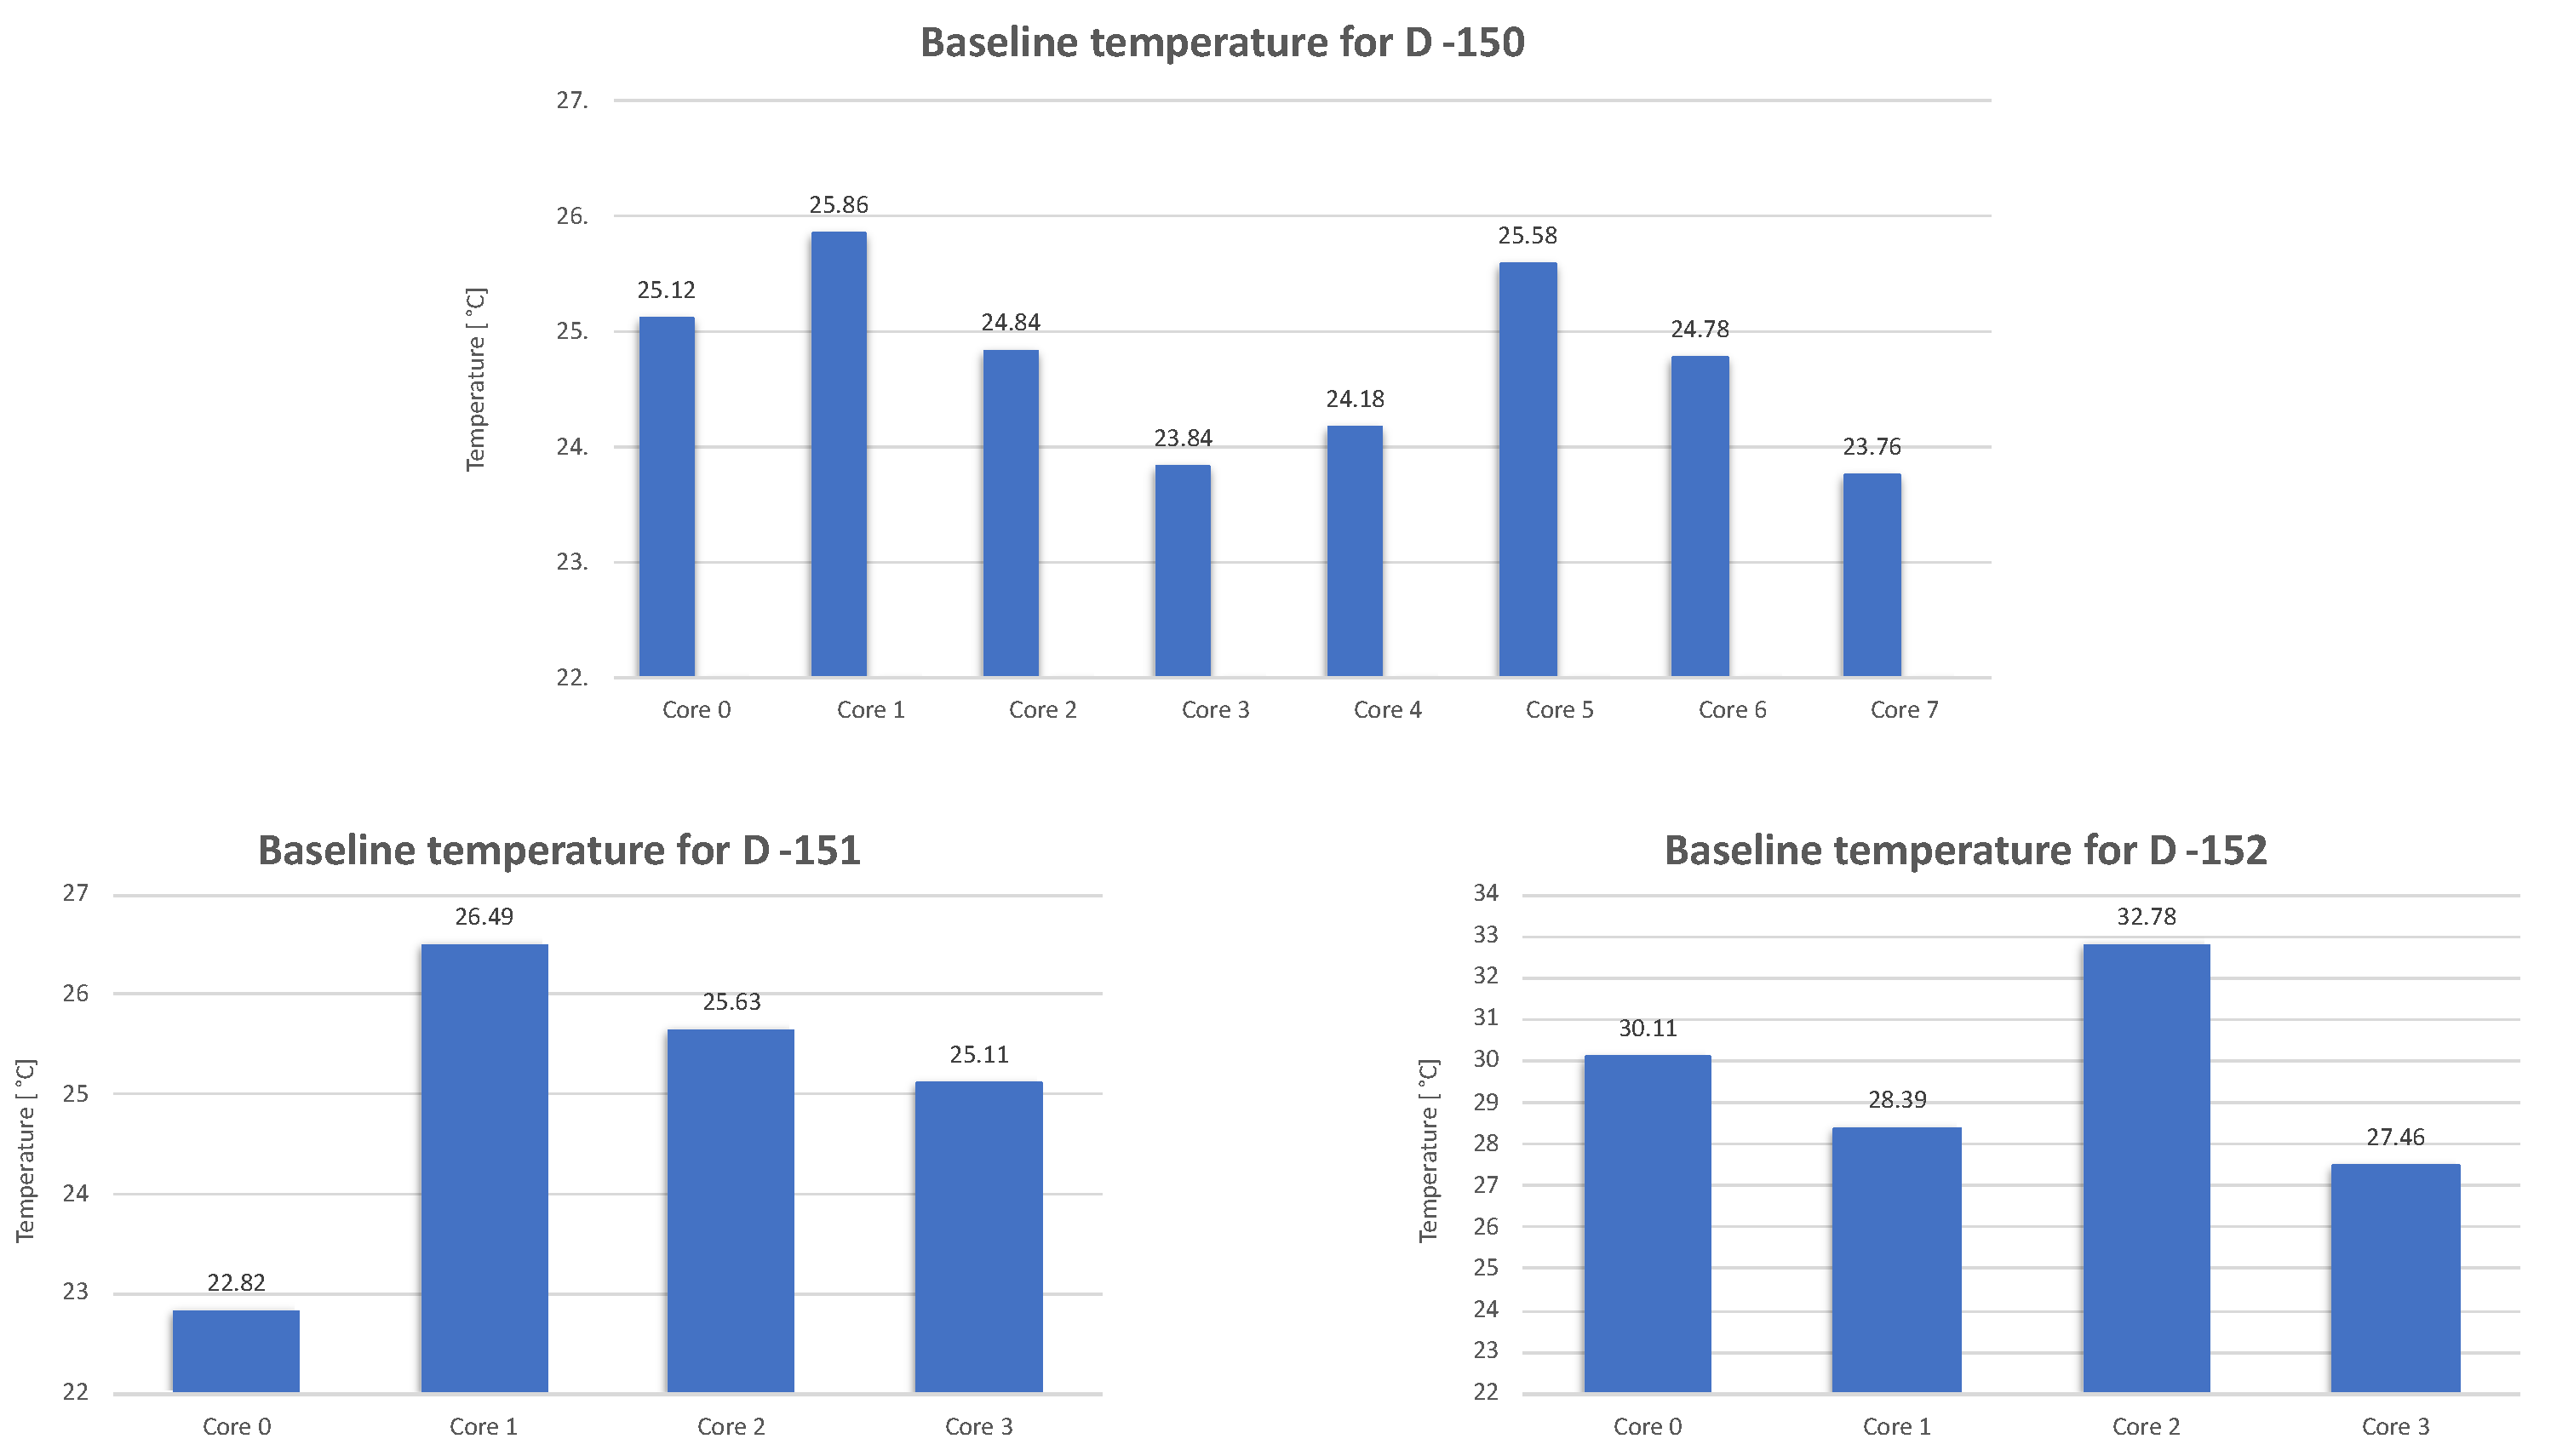
Another type of limitation is the heat propagation through nearby cores. To avoid heat propagation, we selected the two farthest away cores for each of the two scripts that were run. Consequently, the script for reading the temperature runs on Core 3 and the script for calling commands runs on Core 7, which we chosen based on their low temperature (see
Figure 3) and physical distance on the die.
4.4. On Which Core the OS Runs
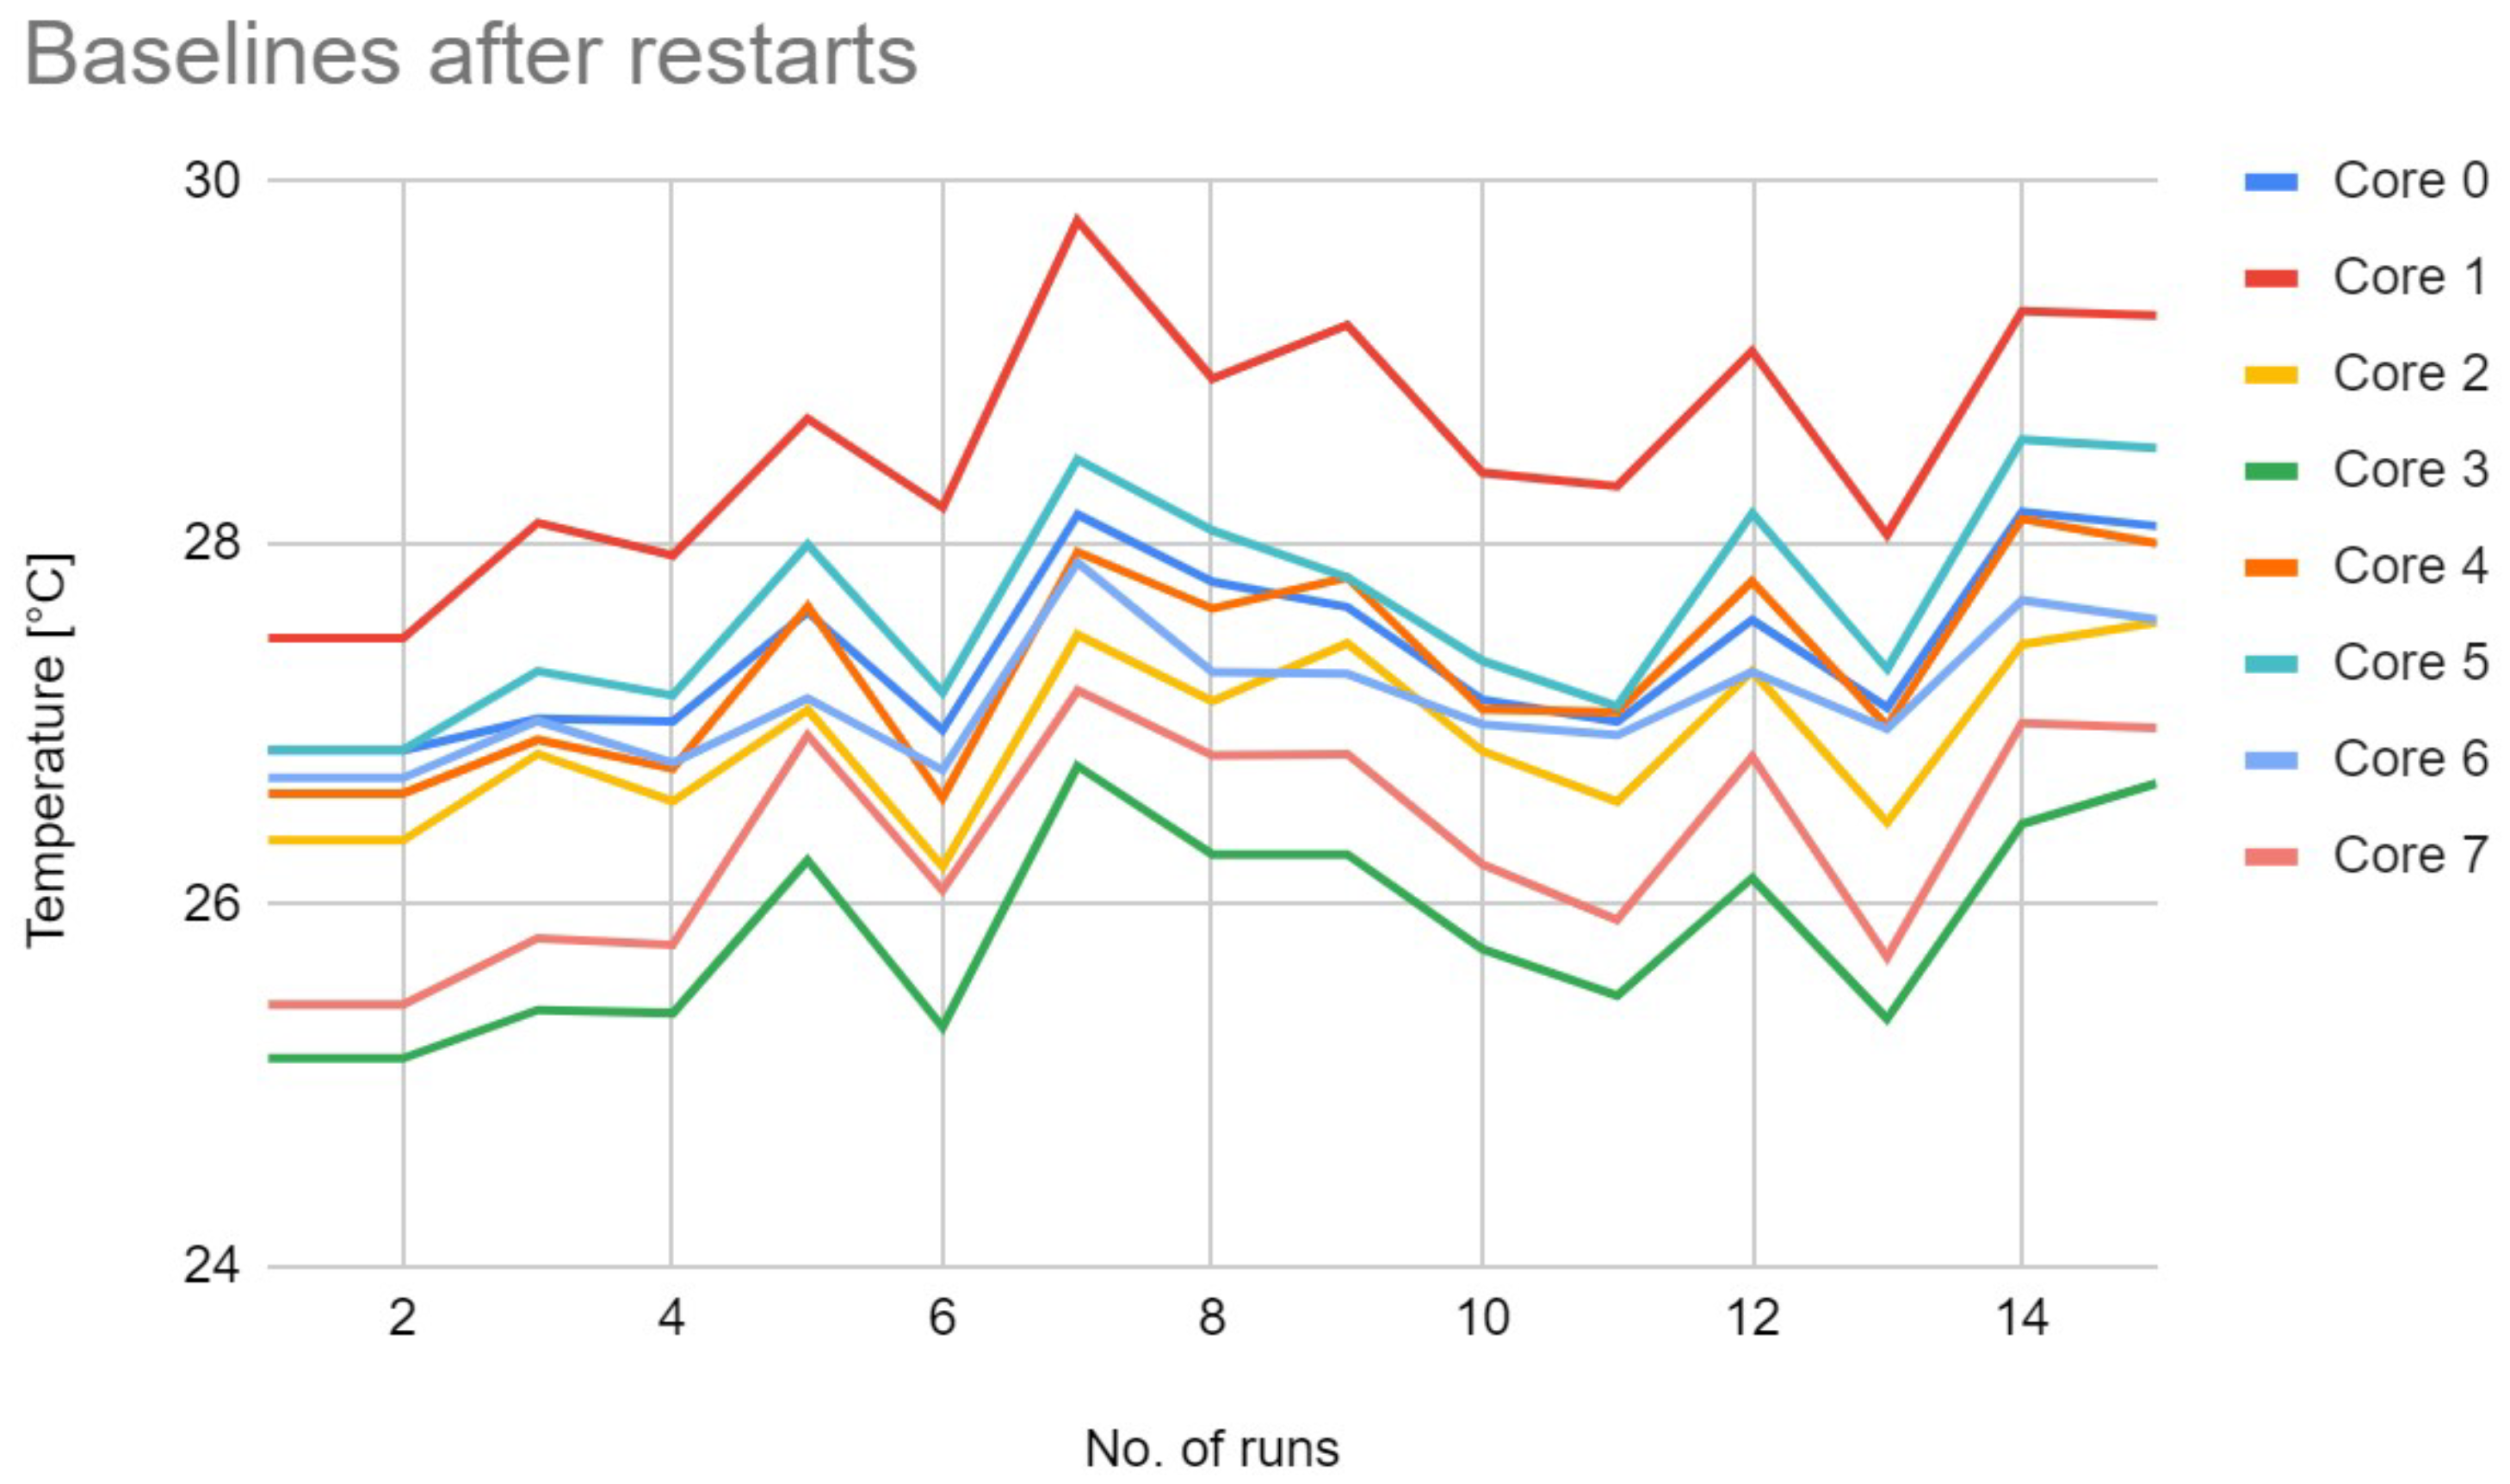
Furthermore, we wanted to know on which core the operation system runs. However, we did not find any information in the literature; thus, we created an experiment made of repetitions of restarts and checking the temperature of the idle system to see whether there are any differences in the temperature, leading to a conclusion for the question above. We restarted the system for 15 times, and we created the baseline temperature of the cores after each restart. After the analysis of the temperatures, the results can be seen in
Figure 20, and we can conclude that Cores 1 and 5 always have the highest temperature, whilst Cores 0, 2, 4, and 6 have medium temperatures, and Cores 3 and 7 always have the lowest temperatures. Consequently, we can conclude that the OS will start every time on the same cores.
4.5. Rising and Dropping Temperature
To further test the capabilities of the CPU sensors, we conducted a small experiment regarding the rising and dropping temperatures of a core on the
D-150 system. More specifically, we used a CPU stressing program, Stress-ng [
38], which increases the CPU temperature to a high one due to the CPU load of 70%. The temperature was read every 500 ms to see how fast it rises and drops after the program is finished. In
Figure 21, on the horizontal axes, the readings of the temperature are represented, which means that between three numbers is one second. Thus, we start at a temperature of 24 °C and in half a second the temperature rise to 34 °C, which means 10 degrees Celsius in 500 ms. Furthermore, in 1.5 s (between reading numbers 60 and 63), the temperature increases by a total of 18 °C. In the case of cooling down, we start at a temperature of 40 °C, and in 1 s, the temperature drops with only 2 °C. However, after another second (between readings 100 and 102), the temperature drops with 11 °C, which leads to the conclusion that the cooling down is slower than the heating up.
4.6. Heat Propagation
Taking into consideration the heat propagation and the cores on which the scripts are running, these two together can affect the performance of the anomaly detection. Thereby, we conducted an experiment to further see how the heat propagates through cores and analyze the physical locations of the cores. We used the stressing CPU program
Stress-ng [
38] on Core 7 of the
D-150 system to increase the CPU load to 70%. The temperature was read with a script running on Core 0, placing the two scripts as physical far as possible in the CPU. In
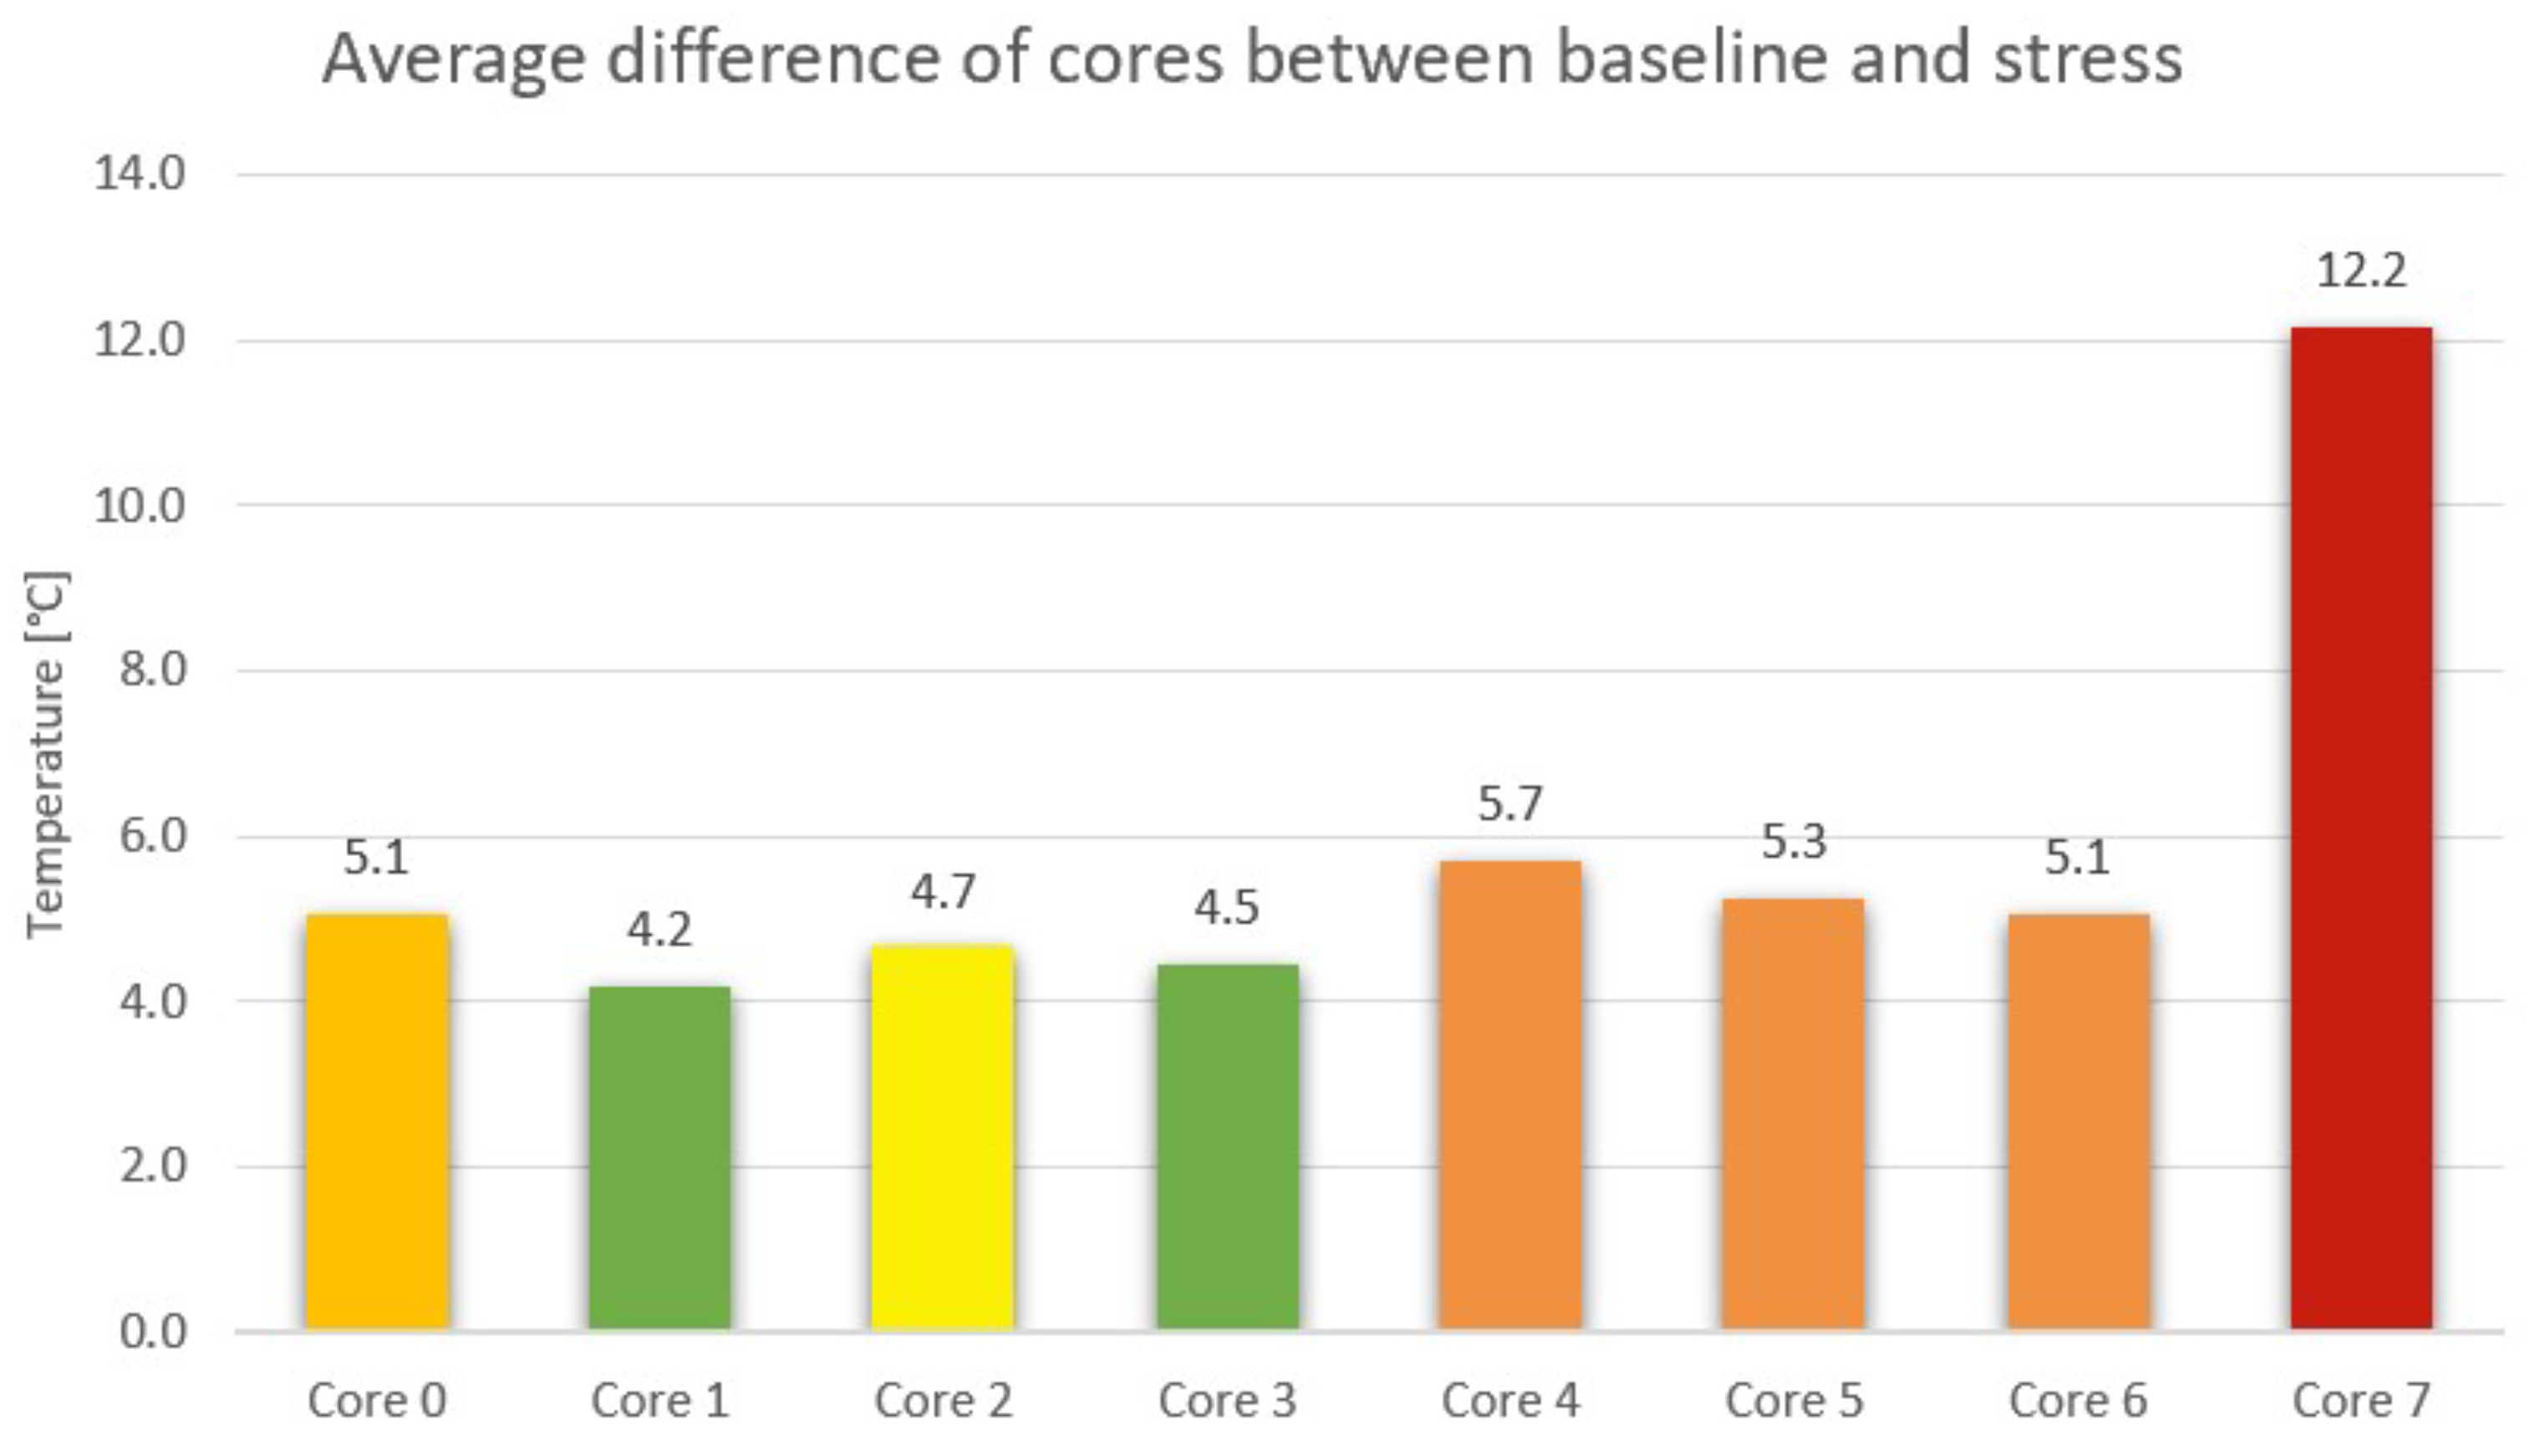
Figure 22, it can be seen, for each core, the difference between the baseline temperature of the respective core and the temperature measured, while on Core 7, the stress program is running. Therefore, it can be observed that all cores are affected by the high heat (of approximately 50 °C on the peak) of Core 7.
To dig further into the heat propagation topic, we will analyze further. On Core 7, the temperature increases with approximately 12 °C, and the next temperature range is between 5.1 and 5.7 °C and includes Cores 0, 4, 5, and 6, and the last one is between 4.2 and 4.7 °C, which includes Cores 1, 2, and 3. Thereby, the most affected cores are Cores 0, 4, 5, 6, from which we will exclude Core 0, because the script for collecting the temperature is raising its temperature for sure. Thus, we remain with Cores 4, 5, and 6 as the most affected cores by the stress program running on Core 7.
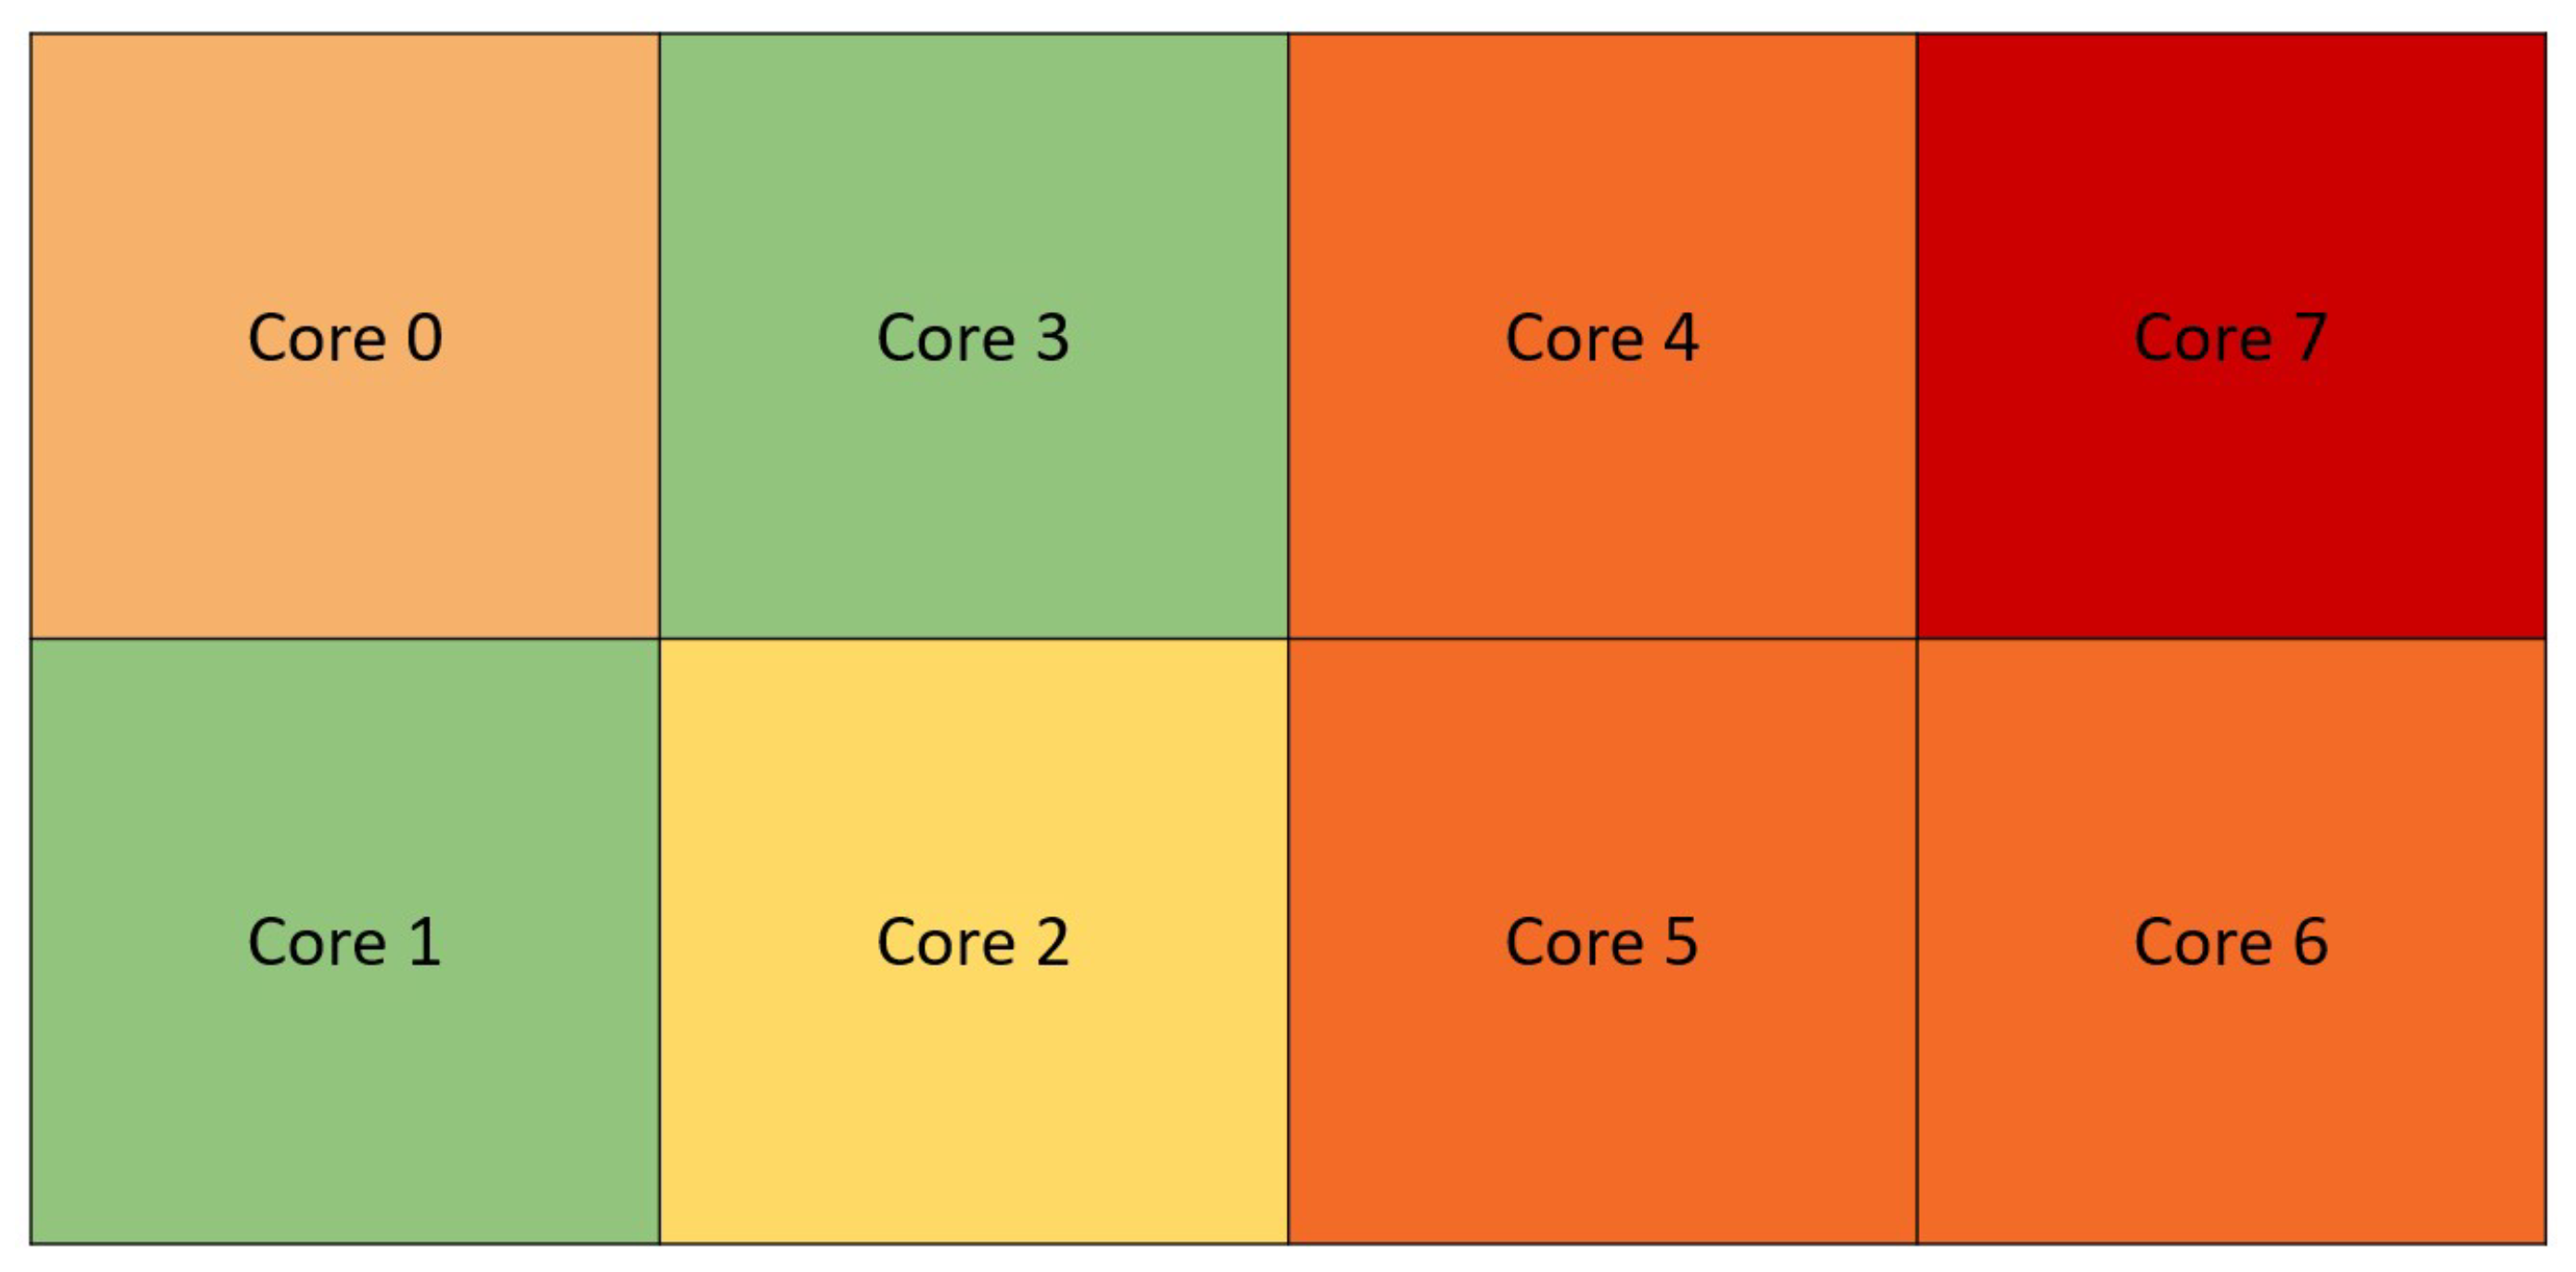
Taking into consideration what we have stated above, we can assume that the layout of the cores on the CPU die is as seen in
Figure 23, where Cores 4, 5, and 6 are the hottest because these are physically placed near Core 7.
4.7. Covert Channel Attack
To further expand the research in the direction of heat propagation, we created a small Covert Channel Attack. The idea of a covert channel attack is based on bypassing the current security measures in order to transmit sensitive data without breaking them. In more details, a person (called A) has access to secret data in the interior of an entity; however, due to the security measures, it cannot transmit the data in the exterior to another person (called B). To avoid the security measures, A can use a covert channel to transmit the data to the exterior, which will look like a normal operation from inside, and B will listen from the exterior and will try to extract the secret values. Furthermore, we decided that our secret data are the text “
hello world” which will be transmitted by A from Core 7 (the interior) to B (the exterior) which has access to a nearby core, but not to Core 7. The transmission is performed by sequences of executing the (value of 1) and sleep (value of 0) on Core 7. We transformed the secret text in binary values so that it can be sent using the rule presented above, when the core executes (increasing the CPU load to 90%) for 10 s, it sends a value of 1, and when it is idle for 10 s, it sends a 0. The listening part will be performed by B, who is monitoring the temperature of the nearby core, reading the temperature of its core every second. As can be seen in
Figure 24, the heat is propagated to the nearby core. We presented both cores in this figure so that the propagation can be seen better. However, B only has access to the data in blue, which represent the propagated data. A further thermal analysis must be applied to these data to extract the secret text. A technique called
binarization is applied, using a filter which will divide data into values of 0 and 1. After this, we have the binary values, and we will extract the final values by searching for patterns that will help us distinguish the time for transmitting one bit. The results of this experiment are that we were able to reconstruct 71 of 88 bits of the secret text, which means 80.6% of the original text sent from A to B was recovered.
4.8. Future Work
In this technique, we did not manage to detect between commands or syscalls with this small amount of traces. Thus, our future work will include increasing the number of traces together with the number of commands used. Moreover, we will study diverse patterns of system calls that can appear through the execution of a specific command, to get closer to our initial goal. Furthermore, increasing the automation of this technique and integrating the Machine Learning algorithm together with the thermal correlation analysis can in a way make it applicable for the continuous execution and detection of anomalies based on temperature and other factors, which constitutes an important future work.
5. Conclusions
In this work, we have introduced the BeatTheHeat anomaly detection technique, applying it in circumstances much closer to the real-world computational environments. We have demonstrated that it detects irregularities in the Linux command behavior through CPU temperature monitoring, even when noise is in place. Moreover, we have introduced a machine learning algorithm with an accuracy of up to 88% which, in combination with the thermal correlation analysis, helps us to detect the anomaly in a more efficient and accurate way.
The experiments were performed on three types of CPUs which show high correlations, approaching 0.96, between the authentic command and an augmented one. This research demonstrates the high potential of detecting attacks through thermal sensors even in a real-world scenario. Nevertheless, the technique can be extended to check for anomalies in the CPU temperature during normal operations.
