

Elastic Stack and GRAPHYP Knowledge Graph of Web Usage: A Win–Win Workflow for Semantic Interoperability in Decision Making


Abstract
1. Introduction
- RQ1: Is ELK a suitable solution for decision makers when analyzing and visualizing data?
- RQ2: Does GR bring data analytics that could benefit from ELK and optimize services for strategic decision making?
- RQ3: How could future benefits of a merger of ELK and GR be presented?
2. Research Methodology and Approach
3. Materials
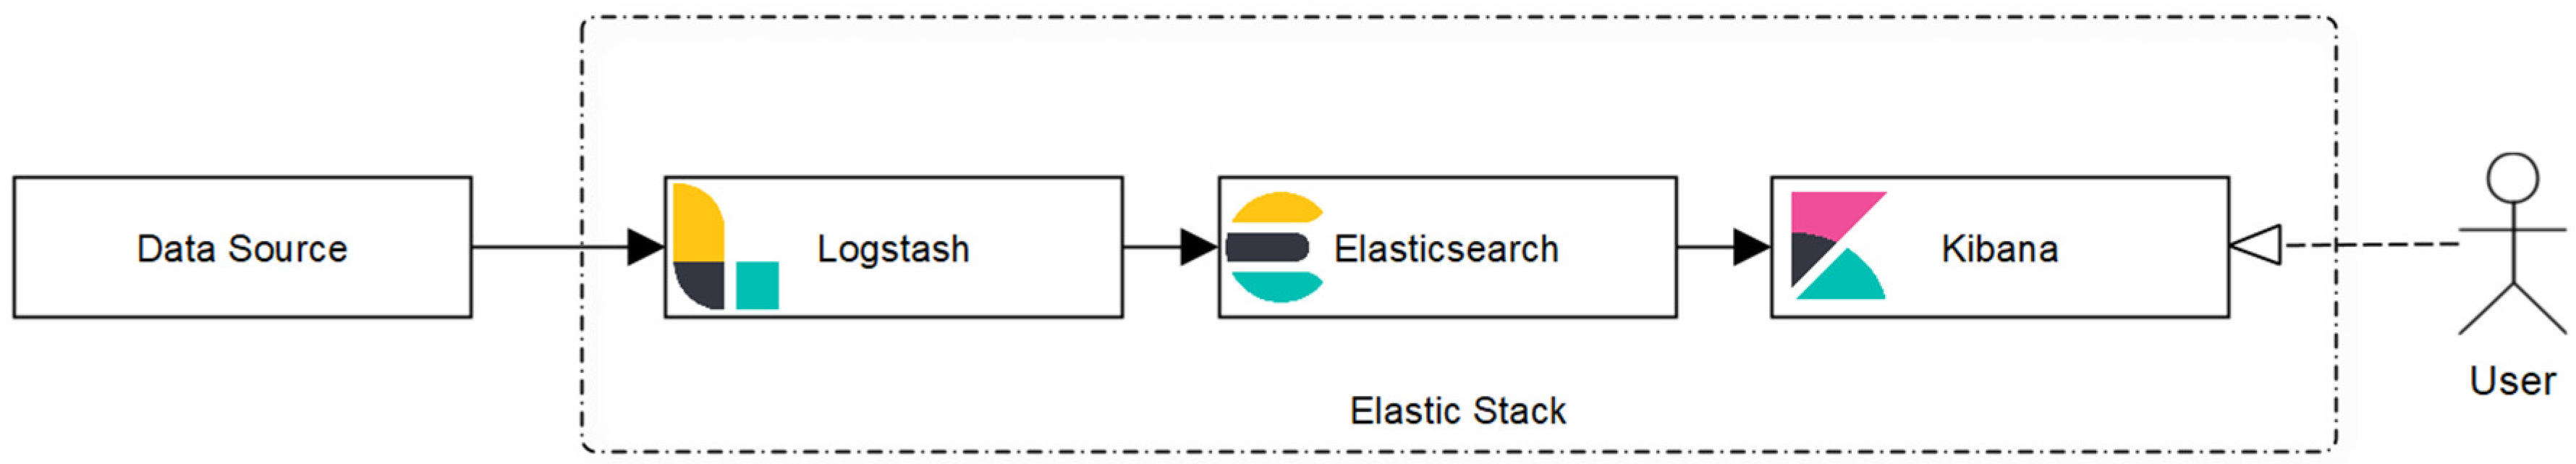
3.1. Elastic Stack (ELK) Concept
- (i)
- Logstash
| Listing 1. Structure of a Logstash configuration file. |
| Input { |
| [...] |
| } |
| #Filters_are_optional |
| Filter { |
| [...] |
| } |
| Output { |
| [...] |
| } |
- (ii)
- Elasticsearch
- (iii)
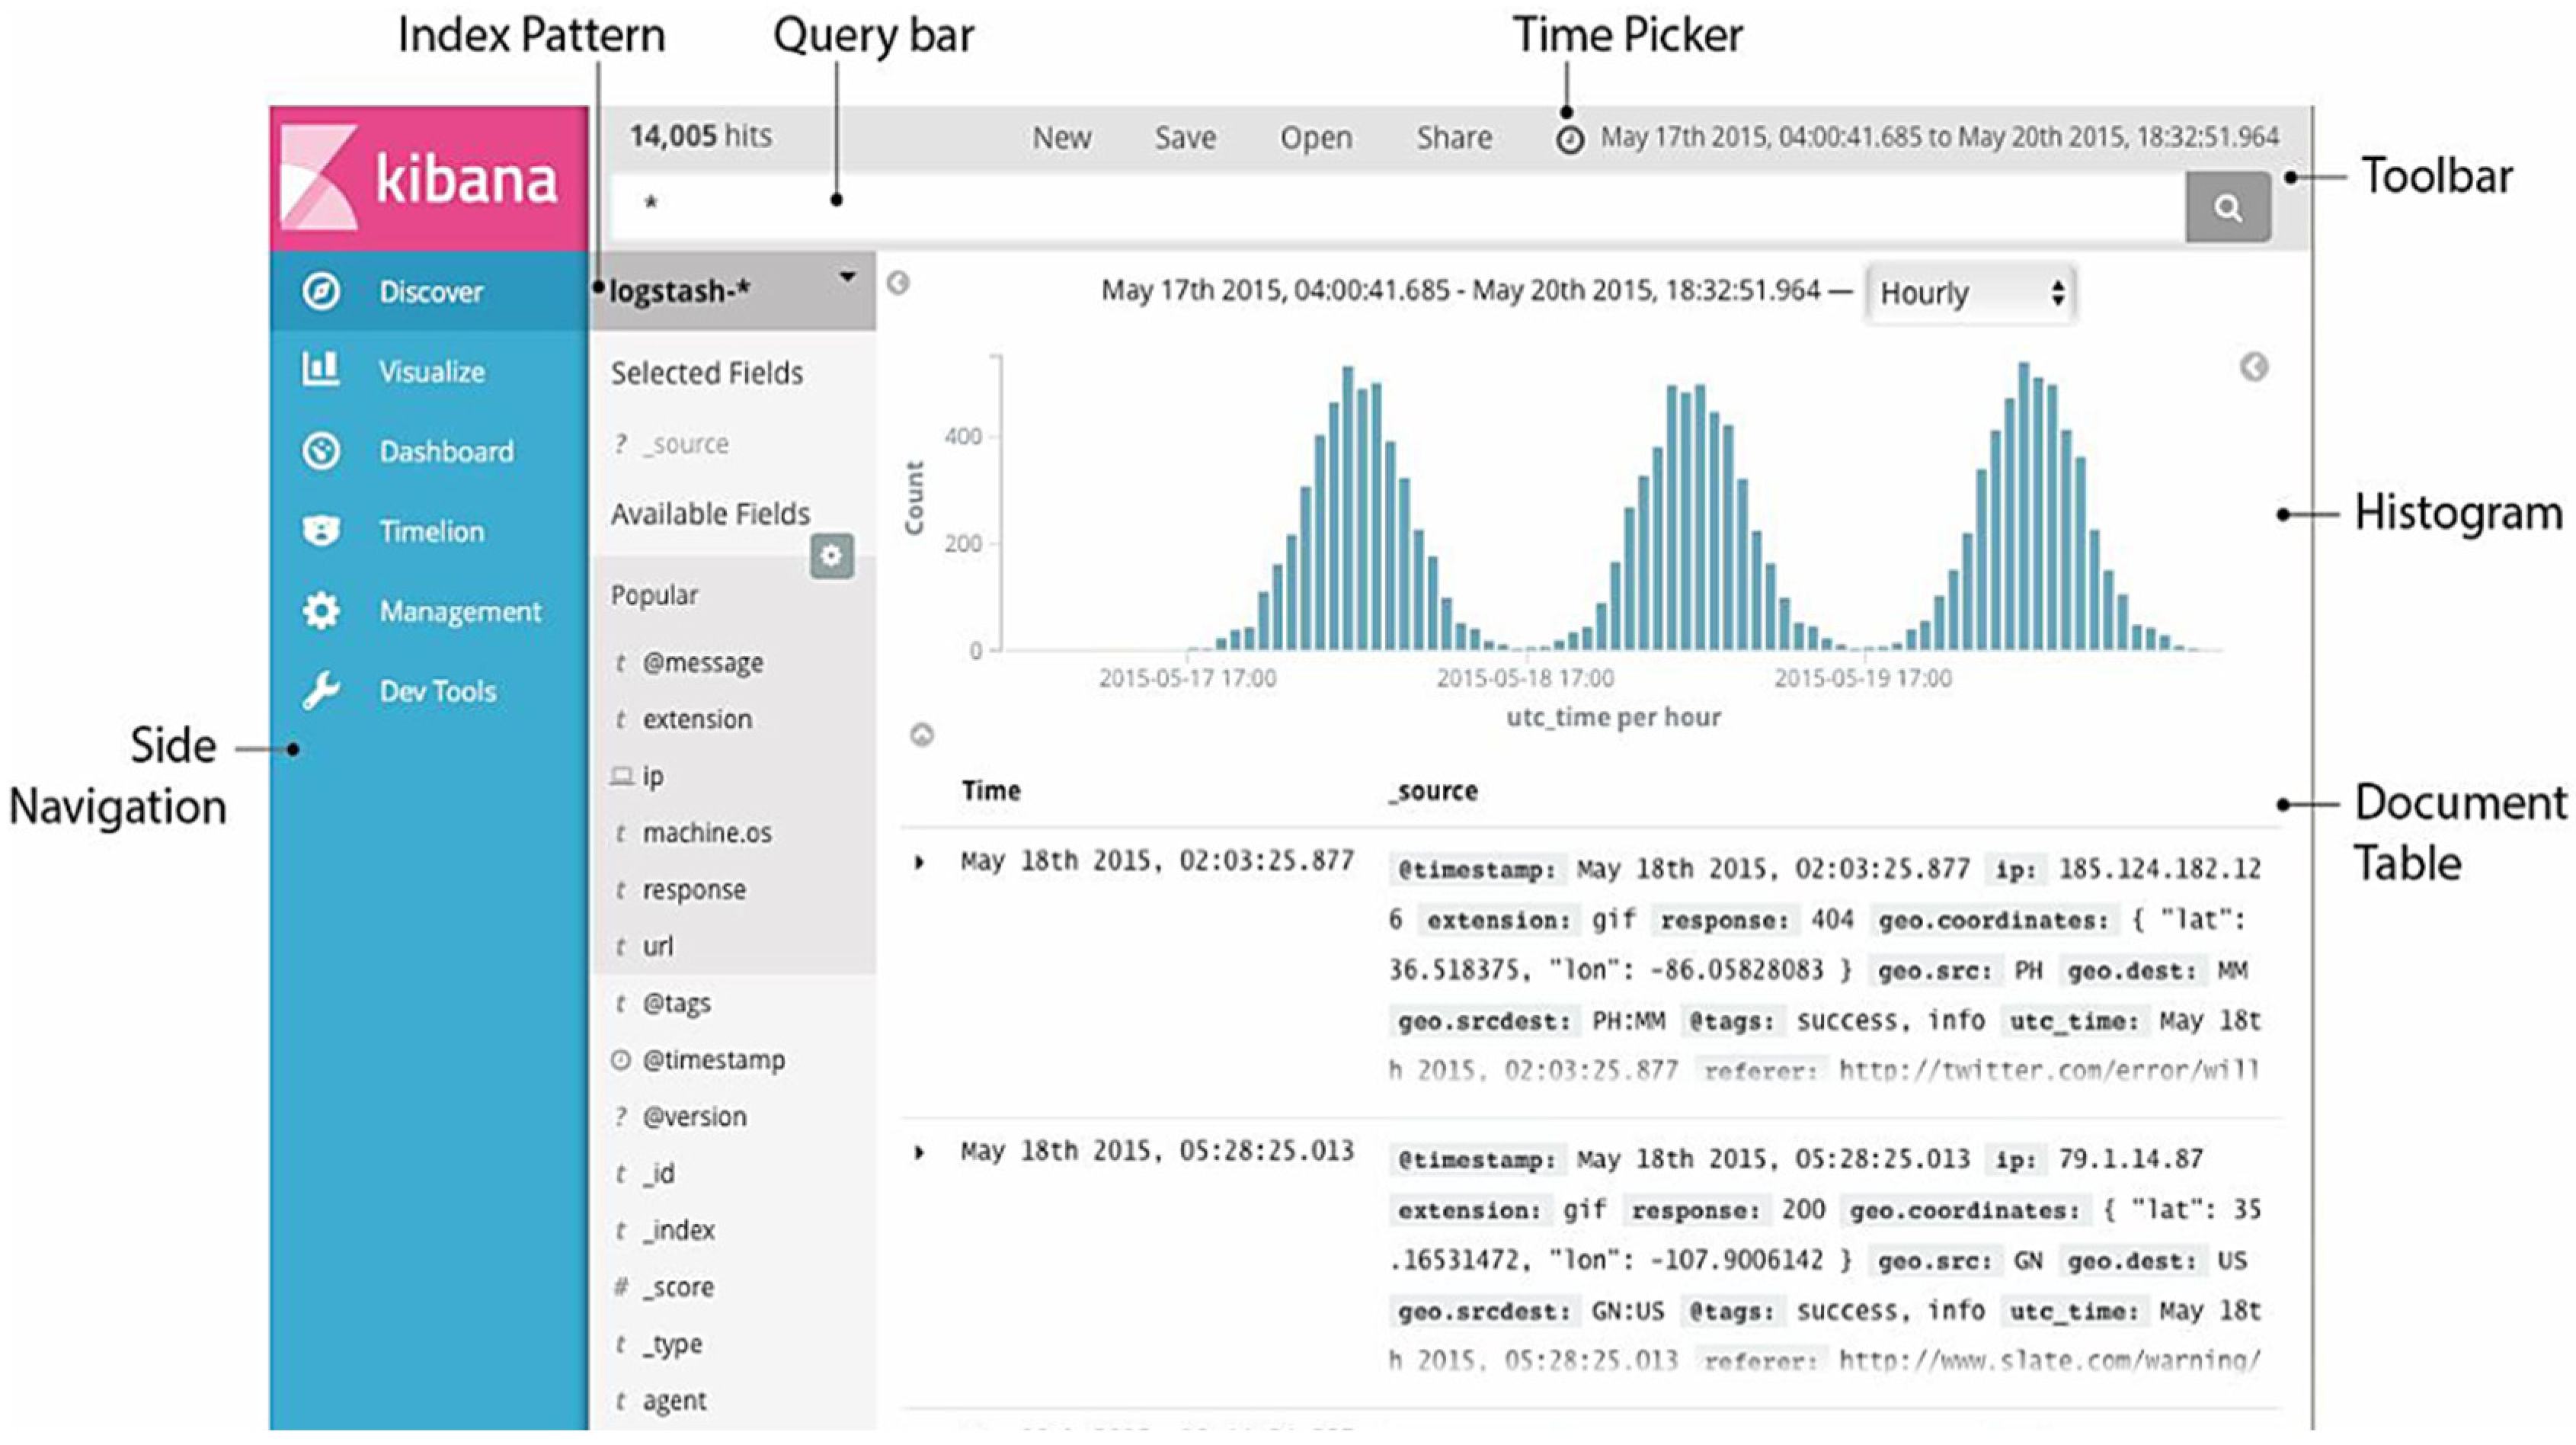
- Kibana
3.2. ELK Implementation Requirements
- (i)
- Functional requirements (FR)
- FR 1: The retrieved data should be filtered and structured if necessary.
- FR 2: Any missing information should be added.
- FR 3: The data should be assigned to an index that contains, for example, the time of indexing.
- FR 4: The data should be forwarded to an Elasticsearch system.
- FR 5: Elasticsearch shall store the data received from Logstash.
- FR 6: Elasticsearch should recognize and delete duplicates.
- FR 7: Search or aggregation requests made by Kibana should be processed by Elasticsearch.
- FR 8: Indexes stored in Elasticsearch should be searchable and retrievable in Kibana.
- FR 9: Visualization and statistical values should be able to be created from these indices.
- FR 10: Visualizations and statistical values should be accessible in an individually adaptable dashboard.
- FR 11: The dashboard should be able to be updated automatically if data have been changed or added.
- FR 12: It should be possible to organize and display data by time in order to analyze changes in the data over time.
- (ii)
- Non-functional requirements (NFR)
- NFR 1: ELK should be able to scale vertically and horizontally.
- NFR 2: It should be possible to compensate for the failure of one or more computers in the system.
- NFR 3: Actions such as searches or aggregations should deliver their results after a maximum of 2 s.
- NFR 4: The dashboard should be accessible under the specific port.
- Logstash
- ○
- How can the desired data be retrieved and what intervals make sense for this?
- ○
- What information do the retrieved data contain?
- ○
- What is the structure of the data?
- ○
- Which index should the data be assigned to?
- Elasticsearch
- ○
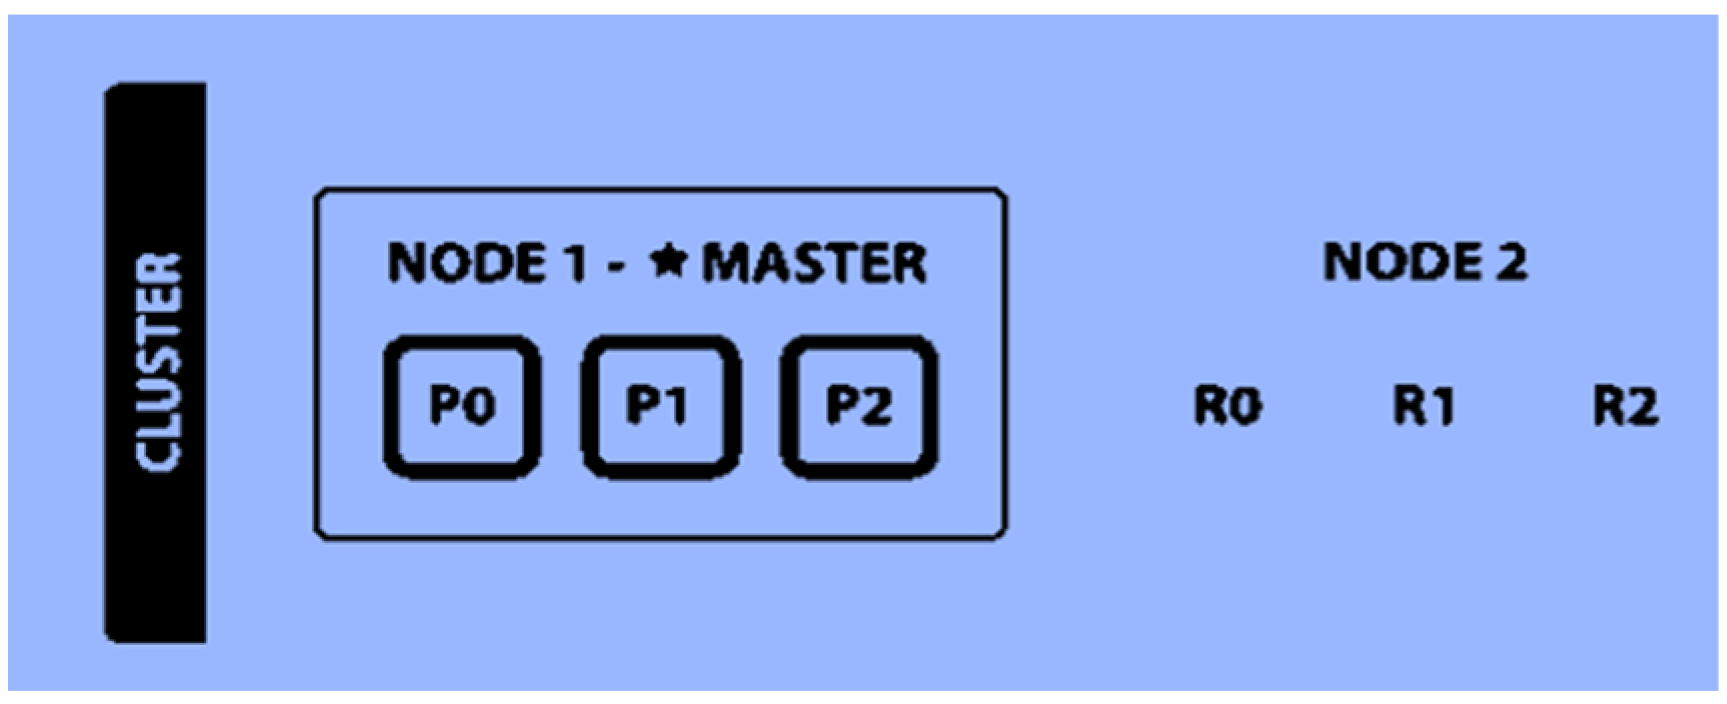
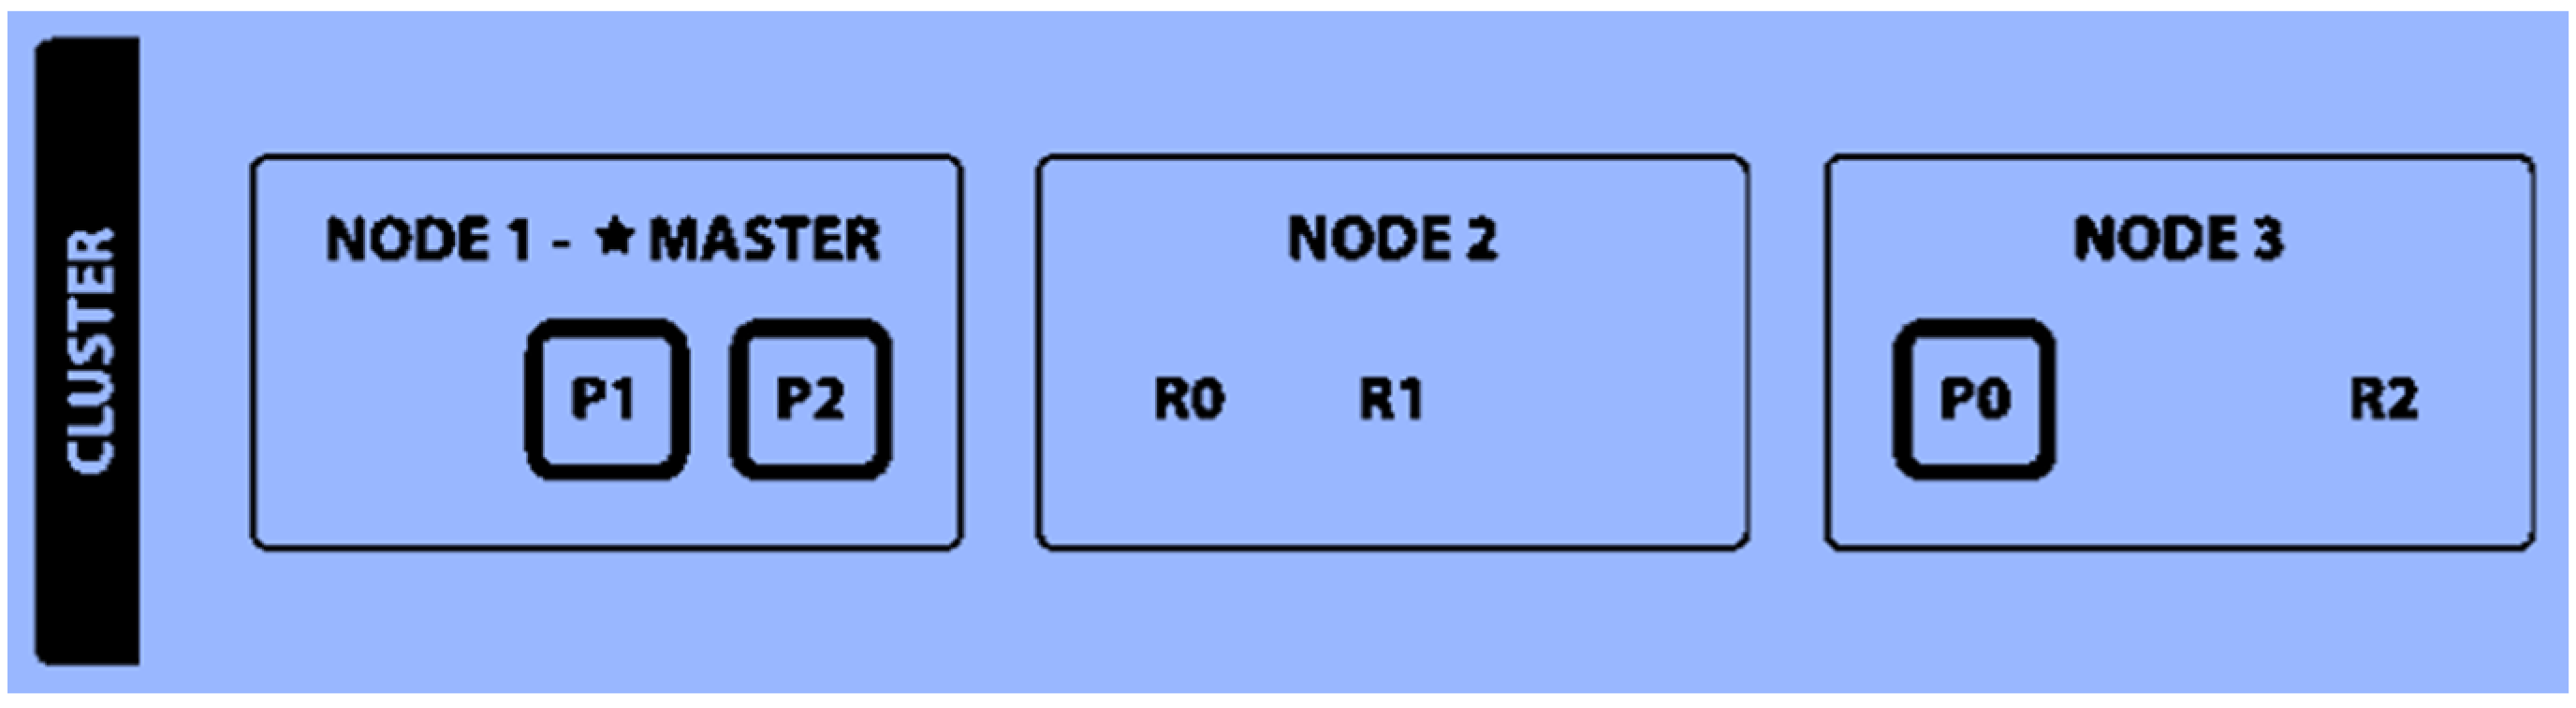
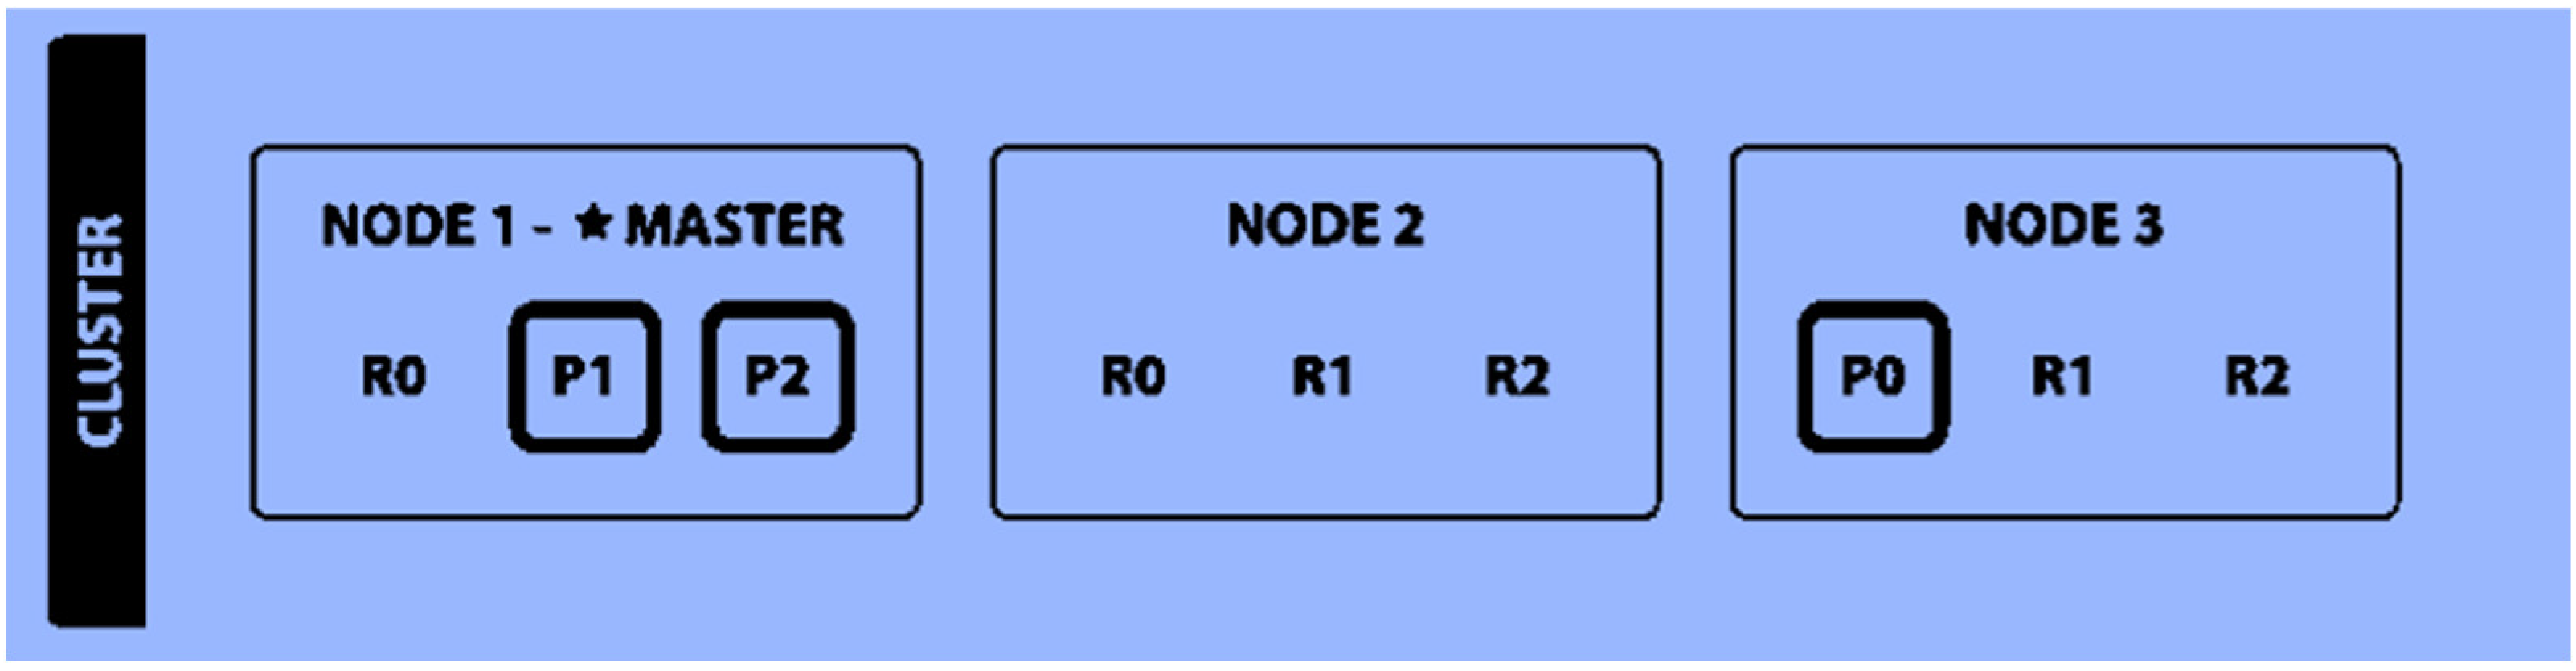
- How many computers are available?
- ○
- How many primary and replica shards per index make sense?
- Kibana
- ○
- How can the data be visualized well?
- ○
- How can conclusions be drawn from the data? How can the dashboard be designed clearly?
4. Results
ELK and GRAPHYP: A Win–Win Fit in Innovative Strategic Assessment
- (1)
- A case for win–win strategic assessment: Why GRAPHYP?
- (2)
- A case for win–win strategic assessment between ELK and GR: How?
- (3)
- A common Challenge for ELK and GR future interactions
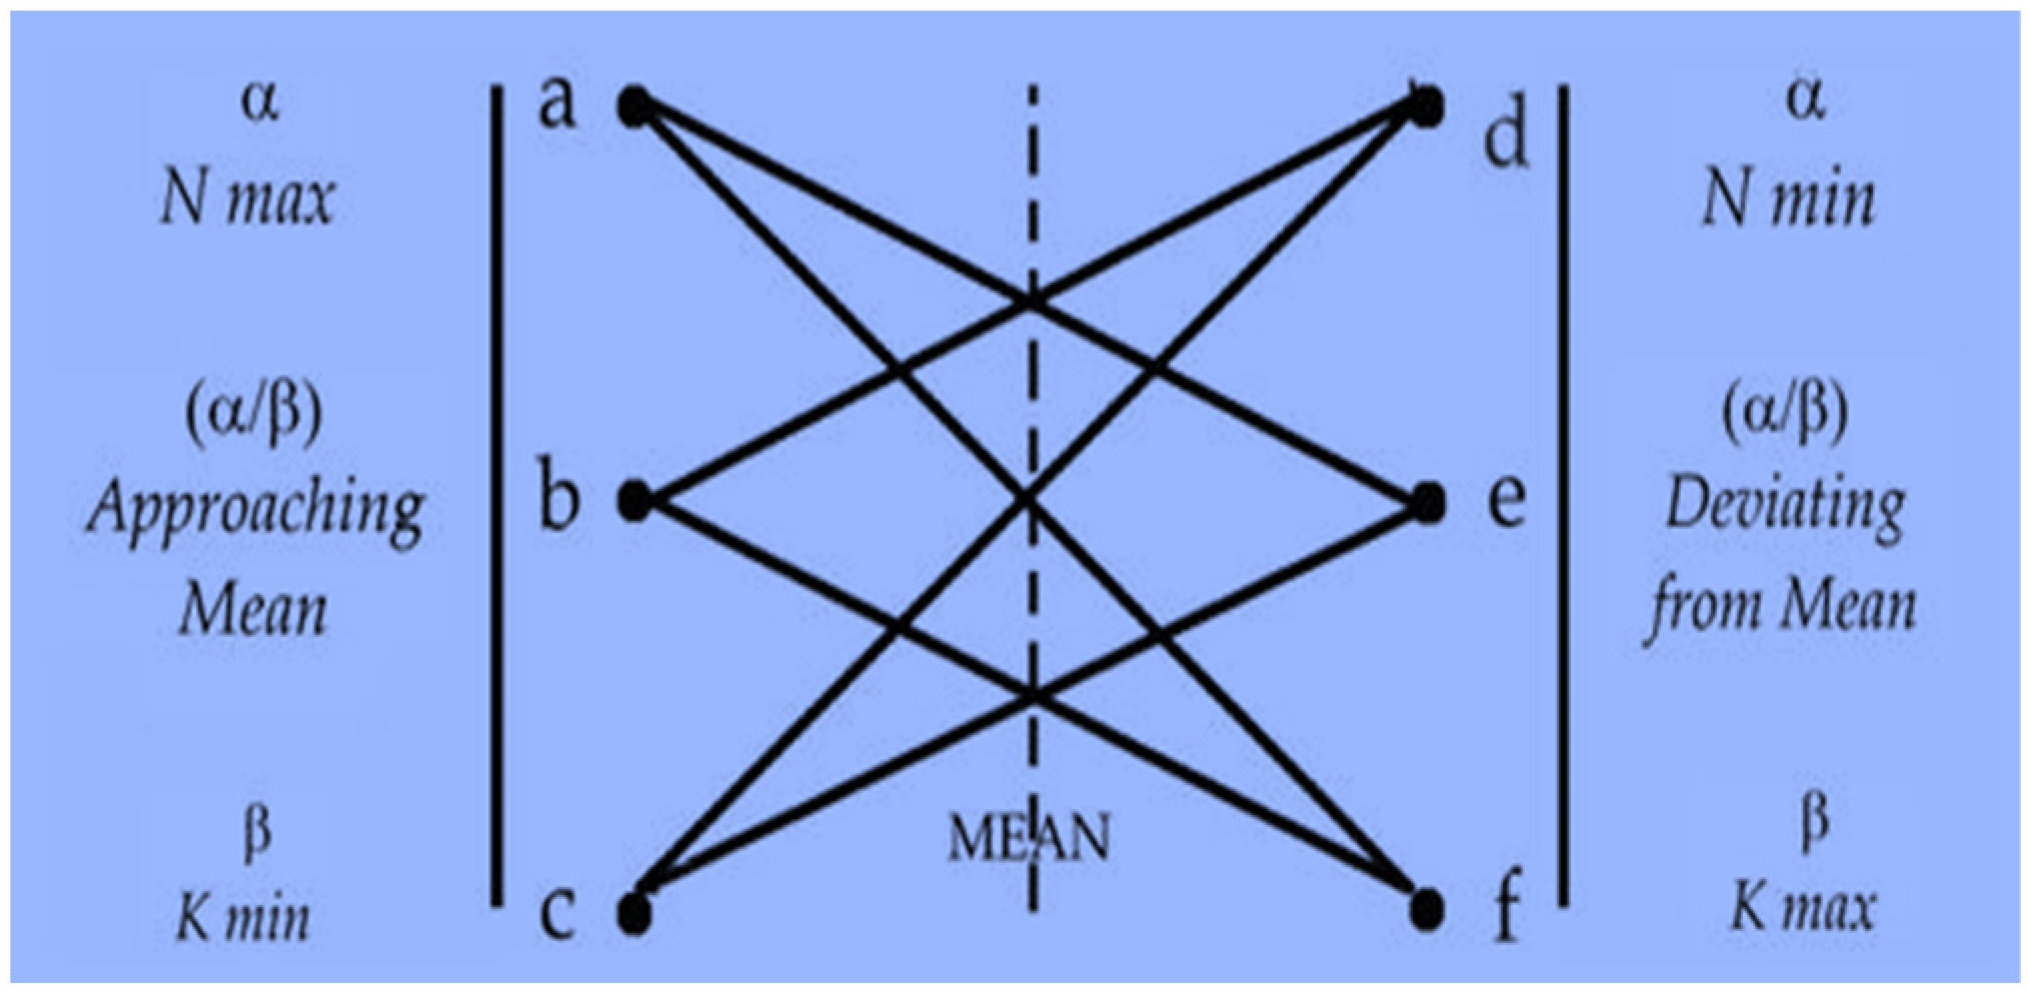
- Architecture: A searchable space with “possible” choices
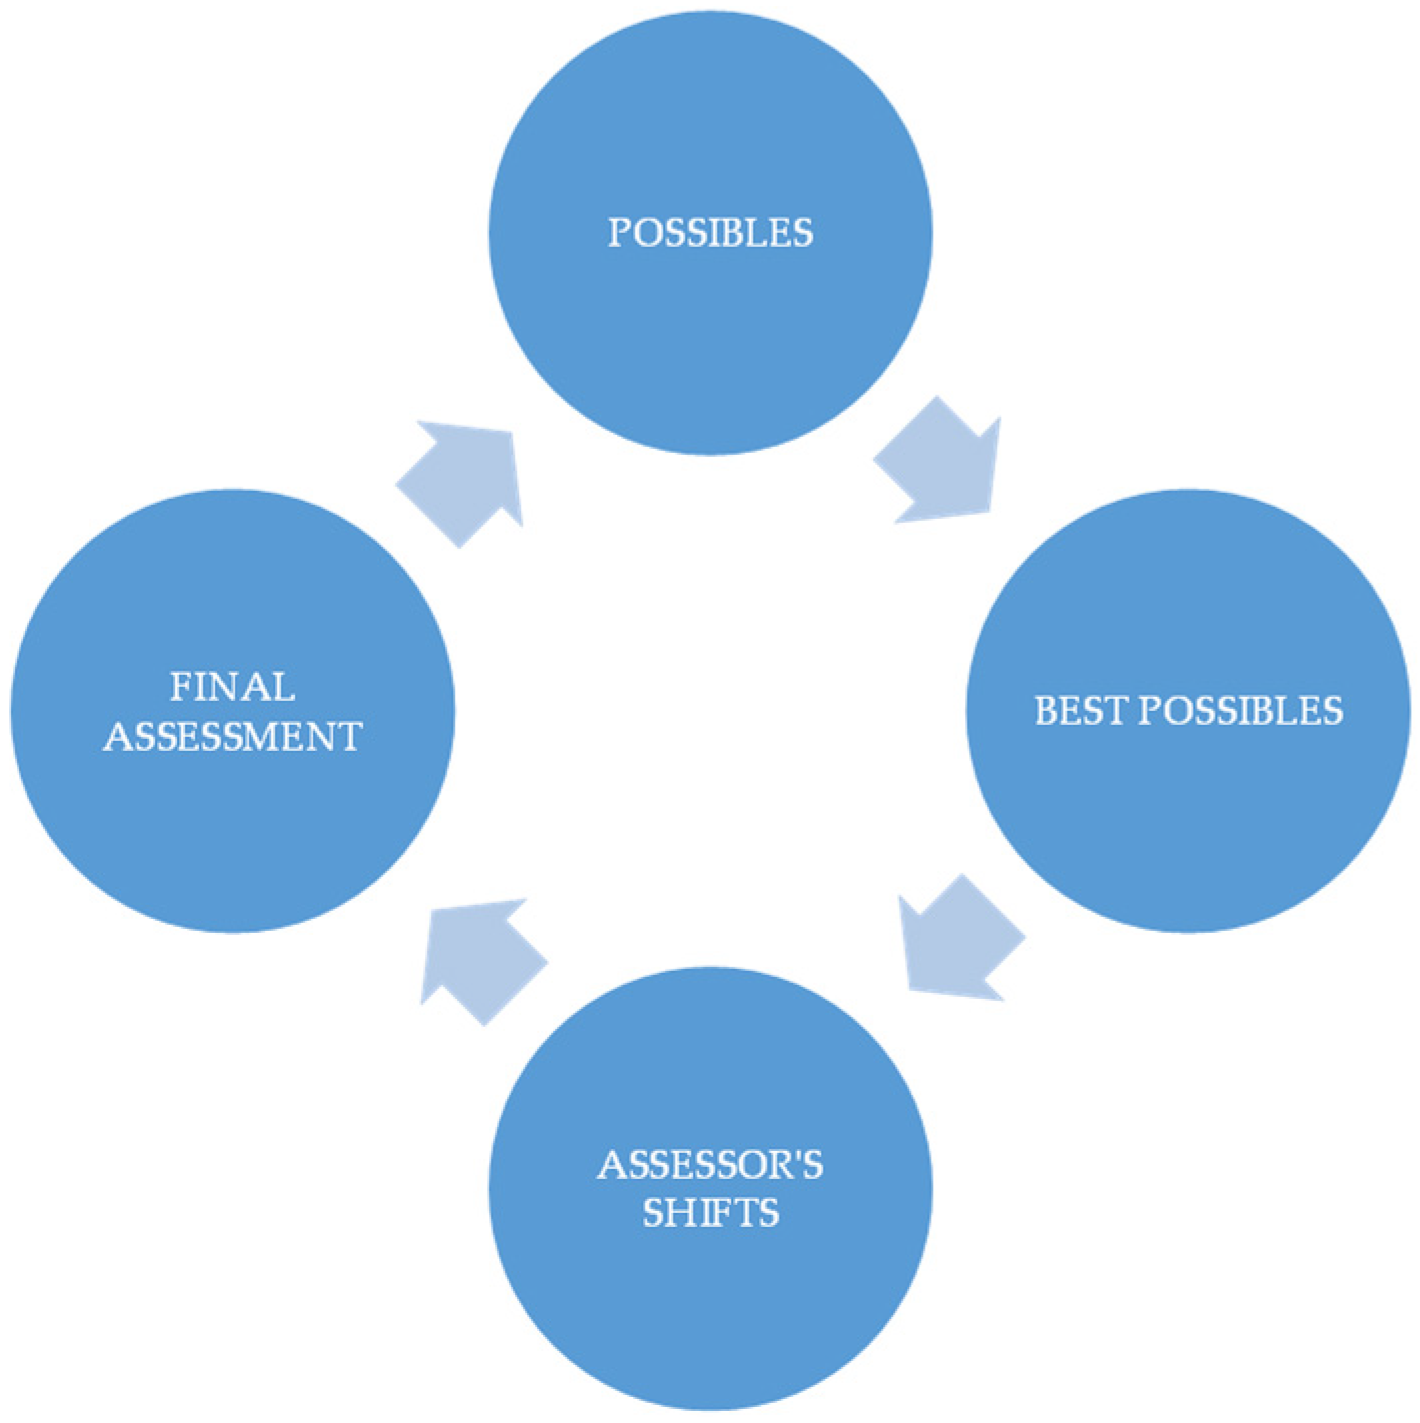
- Reasoning with GRAPHYP: Pathways to the “best possible” option
- (i)
- GRAPHYP fits with ELK
- (ii)
- Cooperation: Mutual benefits
- (iii)
- COUNTER: A potential testing case of Elastic Stack and GRAPHYP interactions in strategic management
- (iv)
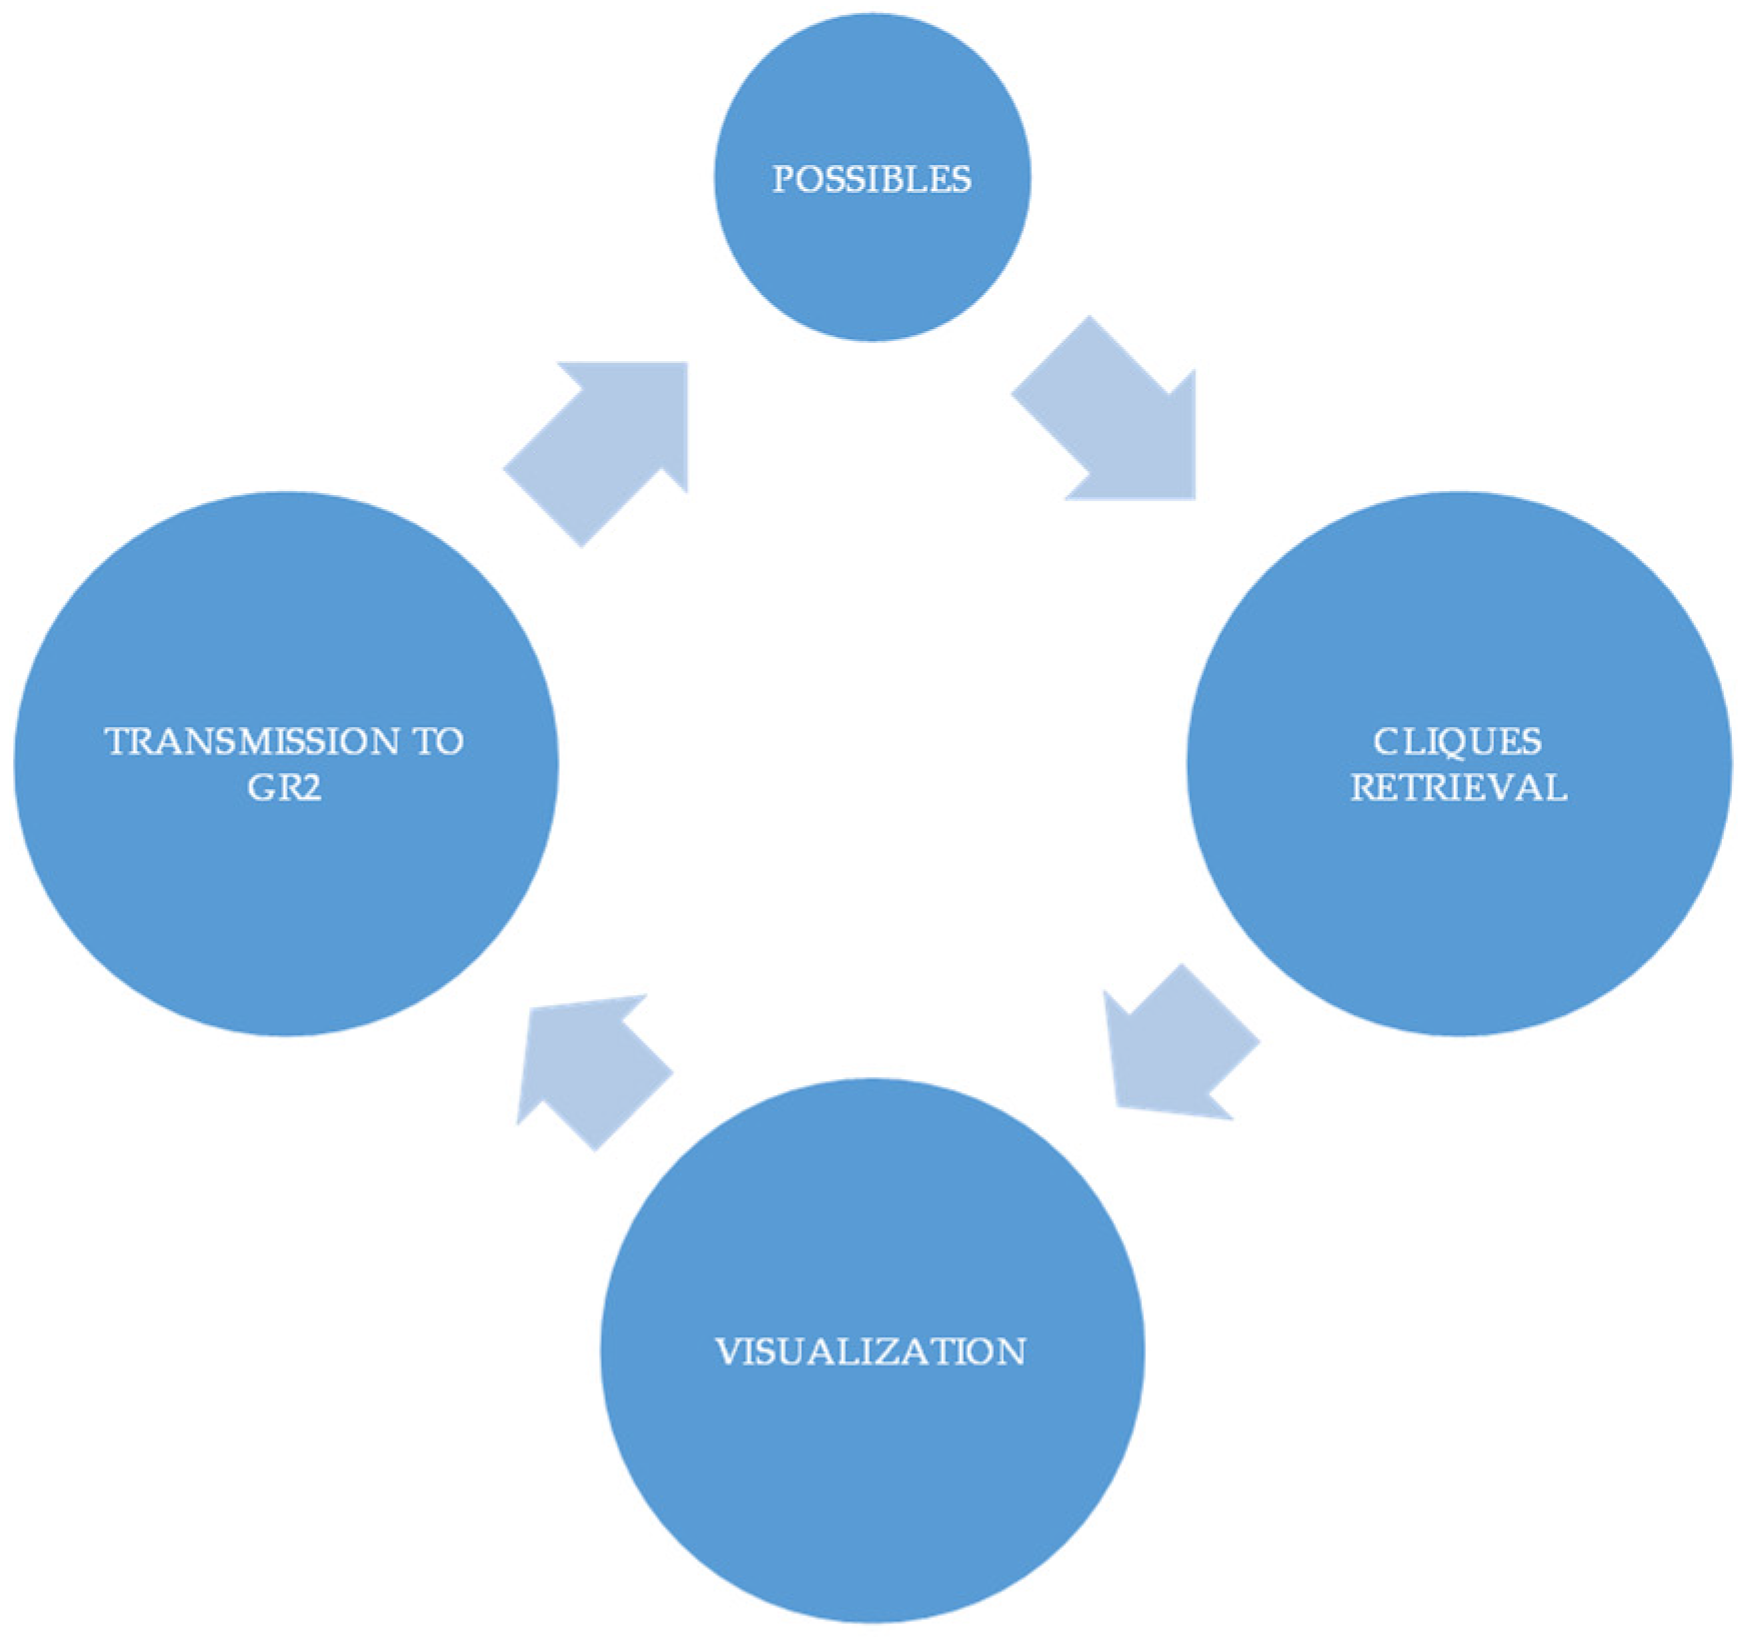
- A general workflow of cooperation between ELK and GR
- Typologies of visualized downloads according to GR1 possible choices as compared to a user’s search experiences (see above GR1 requirements in GRAPHYP);
- Representation of an assessor’s shifts with GR2 methodology in an additional service of assistance to visualize the comparative search experience of the users;
- Assistance in the management of research at various scales with the visualization of documentary strategies that could compare the results of search experiences, as represented in GR1 and GR2, with scenarios of evolutions of documentation according to funding or research priorities.
5. Discussion
6. Conclusions
Author Contributions
Funding
Data Availability Statement
Conflicts of Interest
References
- Kalajdjieski, J.; Raikwar, M.; Arsov, N.; Velinov, G.; Gligoroski, D. Databases fit for blockchain technology: A complete overview. Blockchain Res. Appl. 2022, 4, 100116. [Google Scholar] [CrossRef]
- Liu, R.; Fu, R.; Xu, K.; Shi, X.; Ren, X. A Review of Knowledge Graph-Based Reasoning Technology in the Operation of Power Systems. Appl. Sci. 2023, 13, 4357. [Google Scholar] [CrossRef]
- Tian, L.; Zhou, X.; Wu, Y.-P.; Zhou, W.-T.; Zhang, J.-H.; Zhang, T.-S. Knowledge graph and knowledge reasoning: A systematic review. J. Electron. Sci. Technol. 2022, 20, 100159. [Google Scholar] [CrossRef]
- Fabre, R.; Azeroual, O.; Schöpfel, J.; Bellot, P.; Egret, D. A Multiverse Graph to Help Scientific Reasoning from Web Usage: Interpretable Patterns of Assessor Shifts in GRAPHYP. Future Internet 2023, 15, 147. [Google Scholar] [CrossRef]
- Rejeb, A.; Keogh, J.G.; Martindale, W.; Dooley, D.; Smart, E.; Simske, S.; Wamba, S.F.; Breslin, J.G.; Bandara, K.Y.; Thakur, S.; et al. Charting Past, Present, and Future Research in the Semantic Web and Interoperability. Future Internet 2022, 14, 161. [Google Scholar] [CrossRef]
- Jaradeh, M.Y.; Oelen, A.; Farfar, K.E.; Prinz, M.; D’Souza, J.; Kismihók, G.; Stocker, M.; Auer, S. Open Research Knowledge Graph: Next Generation Infrastructure for Semantic Scholarly Knowledge. In Proceedings of the 10th International Conference on Knowledge Capture (K-CAP‘19), Marina Del Rey, CA, USA, 19–21 November 2019; Association for Computing Machinery: New York, NY, USA, 2019; pp. 243–246. [Google Scholar] [CrossRef]
- Zeb, S.; Mahmood, A.; Hassan, S.A.; Piran, J.; Gidlund, M.; Guizani, M. Industrial digital twins at the nexus of NextG wireless networks and computational intelligence: A survey. J. Netw. Comput. Appl. 2022, 200, 103309. [Google Scholar] [CrossRef]
- Azeroual, O.; Fabre, R. Processing Big Data with Apache Hadoop in the Current Challenging Era of COVID-19. Big Data Cogn. Comput. 2021, 5, 12. [Google Scholar] [CrossRef]
- Sharma, I.; Tiwari, R.; Anand, A. Open Source Big Data Analytics Technique. In Proceedings of the International Conference on Data Engineering and Communication Technology, Pune, India, 15–16 December 2017; Satapathy, S., Bhateja, V., Joshi, A., Eds.; Advances in Intelligent Systems and Computing. Springer: Singapore, 2017; Volume 468. [Google Scholar] [CrossRef]
- Thijs, B. Science Mapping and the Identification of Topics: Theoretical and Methodological Considerations. In Springer Handbook of Science and Technology Indicators; Glänzel, W., Moed, H.F., Schmoch, U., Thelwall, M., Eds.; Springer Handbooks; Springer: Cham, Switzerland, 2019. [Google Scholar] [CrossRef]
- Ghosh, S.; Rath, M.; Shah, C. Searching as Learning: Exploring Search Behavior and Learning Outcomes in Learning-related Tasks. In Proceedings of the 2018 Conference on Human Information Interaction & Retrieval (CHIIR ‘18), New Brunswick, NJ, USA, 11–15 March 2018; Association for Computing Machinery: New York, NY, USA, 2018; pp. 22–31. [Google Scholar] [CrossRef]
- Sharifpour, R.; Wu, M.; Zhang, X. Large-scale analysis of query logs to profile users for dataset search. J. Doc. 2022, 79, 66–85. [Google Scholar] [CrossRef]
- Sanderson, M.; Scholer, F.; Turpin, A. Relatively relevant: Assessor shift in document judgements. In Proceedings of the Australasian Document Computing Symposium, Parramatta, Australia, 8–9 December 2010; RMIT Press: Melbourne, Australia, 2010; pp. 60–67. [Google Scholar]
- Eke, C.I.; Norman, A.A.; Shuib, L.; Nweke, H.F. A Survey of User Profiling: State-of-the-Art, Challenges, and Solutions. IEEE Access 2019, 7, 144907–144924. [Google Scholar] [CrossRef]
- Özsahin, T. Evaluation of the Visualization Grammar Vega as a Base for Visualizing and Managing Logstash Pipelines Based on the ELK-Stack. Ph.D. Thesis, Technische Hochschule Ingolstadt, Ingolstadt, Germany, 2020. [Google Scholar]
- Turnbull, J. The Logstash Book; Turnbull Press: Brooklyn, NY, USA, 2013. [Google Scholar]
- Durumeric, Z.; Adrian, D.; Mirian, A.; Bailey, M.; Halderman, J.A. A Search Engine Backed by Internet-Wide Scanning. In Proceedings of the 22nd ACM SIGSAC Conference on Computer and Communications Security (CCS ‘15), Denver, CO, USA, 12–16 October 2015; Association for Computing Machinery: New York, NY, USA, 2015; pp. 542–553. [Google Scholar] [CrossRef]
- Liu, Z.H.; Hammerschmidt, B.; McMahon, D.; Chang, H.; Lu, Y.; Spiegel, J.; Sosa, A.C.; Suresh, S.; Arora, G.; Arora, V.; et al. Native JSON datatype support. Proc. VLDB Endow. 2020, 13, 3059–3071. [Google Scholar] [CrossRef]
- Dhulavvagol, P.M.; Bhajantri, V.H.; Totad, S.G. Performance Analysis of Distributed Processing System using Shard Selection Techniques on Elasticsearch. Procedia Comput. Sci. 2020, 167, 1626–1635. [Google Scholar] [CrossRef]
- Hirai, J.; Raghavan, S.; Garcia-Molina, H.; Paepcke, A. WebBase: A repository of Web pages. Comput. Netw. 2000, 33, 277–293. [Google Scholar] [CrossRef]
- Kim, Y.; Callan, J.; Culpepper, J.S.; Moffat, A. Efficient distributed selective search. Inf. Retr. J. 2016, 20, 221–252. [Google Scholar] [CrossRef]
- Gormley, C.; Tong, Z. Elasticsearch: The Definitive Guide: A Distributed Real-Time Search and Analytics Engine; O’Reilly Media, Inc.: Sebastopol, CA, USA, 2015. [Google Scholar]
- Butakov, N.; Petrov, M.; Mukhina, K.; Nasonov, D.; Kovalchuk, S. Unified domain-specific language for collecting and processing data of social media. J. Intell. Inf. Syst. 2018, 51, 389–414. [Google Scholar] [CrossRef]
- Kononenko, O.; Baysal, O.; Holmes, R.; Godfrey, M.W. Mining modern repositories with elasticsearch. In Proceedings of the 11th Working Conference on Mining Software Repositories, Hyderabad, India, 31 May–1 June 2014; pp. 328–331. [Google Scholar] [CrossRef]
- Andhavarapu, A. Learning Elasticsearch; Packt Publishing Ltd.: Birmingham, UK, 2017. [Google Scholar]
- Chhajed, S. Learning ELK Stack; Packt Publishing Ltd.: Birmingham, UK, 2015. [Google Scholar]
- Zamfir, V.A.; Carabas, M.; Carabas, C.; Tapus, N. Systems monitoring and big data analysis using the elasticsearch system. In Proceedings of the 2019 22nd International Conference on Control Systems and Computer Science (CSCS), Bucharest, Romania, 28–30 May 2019; pp. 188–193. [Google Scholar] [CrossRef]
- Bajer, M. Building an IoT data hub with elasticsearch, Logstash and Kibana. In Proceedings of the 2017 5th International Conference on Future Internet of Things and Cloud Workshops (FiCloudW), Prague, Czech Republic, 21–23 August 2017; pp. 63–68. [Google Scholar] [CrossRef]
- Atz, K.; Grisoni, F.; Schneider, G. Geometric deep learning on molecular representations. Nat. Mach. Intell. 2021, 3, 1023–1032. [Google Scholar] [CrossRef]
- Bronstein, M.M.; Bruna, J.; Cohen, T.; Veličković, P. Geometric deep learning: Grids, groups, graphs, geodesics, and gauges. arXiv 2021, arXiv:2104.13478. [Google Scholar]
- Santoro, A.; Raposo, D.; Barrett, D.G.; Malinowski, M.; Pascanu, R.; Battaglia, P.; Lillicrap, T. A simple neural network module for relational reasoning. In Proceedings of the 31st International Conference on Neural Information Processing Systems (NIPS’17), Long Beach, CA, USA, 4–9 December 2017; Curran Associates Inc.: Red Hook, NY, USA; pp. 4974–4983. [Google Scholar]
- Satorras, V.G.; Hoogeboom, E.; Welling, M. E (n) equivariant graph neural networks. In Proceedings of the International Conference on Machine Learning, Virtual, 18–24 July 2021; PMLR: Cambridge, MA, USA, 2021; pp. 9323–9332. [Google Scholar]
- Linardatos, P.; Papastefanopoulos, V.; Kotsiantis, S. Explainable AI: A Review of Machine Learning Interpretability Methods. Entropy 2021, 23, 18. [Google Scholar] [CrossRef]
- Auer, S.; Oelen, A.; Haris, M.; Stocker, M.; D’souza, J.; Farfar, K.E.; Vogt, L.; Prinz, M.; Wiens, V.; Jaradeh, M.Y. Improving Access to Scientific Literature with Knowledge Graphs. Bibl. Forsch. Prax. 2020, 44, 516–529. [Google Scholar] [CrossRef]
- Fabre, R.; Azeroual, O.; Bellot, P.; Schöpfel, J.; Egret, D. Retrieving Adversarial Cliques in Cognitive Communities: A New Conceptual Framework for Scientific Knowledge Graphs. Future Internet 2022, 14, 262. [Google Scholar] [CrossRef]
- Latta, R. A Critical Exposition of the Philosophy of Leibniz, with an Appendix of Leading Passages; Oxford University Press: Oxford, UK, 1901; Available online: https://archive.org/details/cu31924052172271 (accessed on 6 April 2023).
- Liu, Y.; Kale, A.; Althoff, T.; Heer, J. Boba: Authoring and visualizing multiverse analyses. IEEE Trans. Vis. Comput. Graph. 2020, 27, 1753–1763. [Google Scholar] [CrossRef]
- Bell, S.J.; Kampman, O.P.; Dodge, J.; Lawrence, N.D. Modeling the Machine Learning Multiverse. arXiv 2022, arXiv:2206.05985. [Google Scholar] [CrossRef]
- Minango, N.R.; Maffei, A. Beyond assembly features: Systematic review of the core concepts and perspectives towards a unified approach to assembly information representation. Res. Eng. Des. 2022, 34, 3–38. [Google Scholar] [CrossRef]
- Schüssler, J.; Karbstein, D.; Klein, D.; Zimmermann, A. Visualizing information for enterprise architecture design decisions using elastic stack. In Proceedings of the BIR-WS 2018: BIR Short Papers, Workshops and Doctoral Consortium Joint Proceedings, Co-Located with 17th International Conference Perspectives in Business Informatics Research (BIR 2018), Stockholm, Sweden, 24–26 September 2018; Volume 2218, pp. 1–10. [Google Scholar]
- Rico, M.; Taverna, M.L.; Galli, M.R.; Caliusco, M.L. Context-aware representation of digital twins’ data: The ontology network role. Comput. Ind. 2023, 146, 103856. [Google Scholar] [CrossRef]
- Fabre, R.; Schöpfel, J. L’hypertexte et les sciences (1991–2021): Des voies navigables pour les routes de connaissances. Histoire de la recherche contemporaine. La Revue Comité pour L’histoire CNRS 2021, 10. [Google Scholar] [CrossRef]
- Veličković, P. Message passing all the way up. arXiv 2022, arXiv:2202.11097. [Google Scholar] [CrossRef]
- Martinez-Gil, J. An overview of textual semantic similarity measures based on web intelligence. Artif. Intell. Rev. 2012, 42, 935–943. [Google Scholar] [CrossRef]
- Yu, C.; Wang, F.; Liu, Y.-H.; An, L. Research on knowledge graph alignment model based on deep learning. Expert Syst. Appl. 2021, 186, 115768. [Google Scholar] [CrossRef]
- Papadimitriou, G.; Wang, C.; Vahi, K.; da Silva, R.F.; Mandal, A.; Liu, Z.; Mayani, R.; Rynge, M.; Kiran, M.; Lynch, V.E.; et al. End-to-end online performance data capture and analysis for scientific workflows. Future Gener. Comput. Syst. 2020, 117, 387–400. [Google Scholar] [CrossRef]
- Ren, H.; Galkin, M.; Cochez, M.; Zhu, Z.; Leskovec, J. Neural Graph Reasoning: Complex Logical Query Answering Meets Graph Databases. arXiv 2023, arXiv:2303.14617. [Google Scholar]
- Gao, C.; Wang, Y.; Zhou, J.; Ding, W.; Shen, L.; Lai, Z. Possibilistic Neighborhood Graph: A New Concept of Similarity Graph Learning. In IEEE Transactions on Emerging Topics in Computational Intelligence; IEEE: Piscataway, NJ, USA, 2022. [Google Scholar] [CrossRef]


Disclaimer/Publisher’s Note: The statements, opinions and data contained in all publications are solely those of the individual author(s) and contributor(s) and not of MDPI and/or the editor(s). MDPI and/or the editor(s) disclaim responsibility for any injury to people or property resulting from any ideas, methods, instructions or products referred to in the content. |
© 2023 by the authors. Licensee MDPI, Basel, Switzerland. This article is an open access article distributed under the terms and conditions of the Creative Commons Attribution (CC BY) license (https://creativecommons.org/licenses/by/4.0/).
Share and Cite
Azeroual, O.; Fabre, R.; Störl, U.; Qi, R. Elastic Stack and GRAPHYP Knowledge Graph of Web Usage: A Win–Win Workflow for Semantic Interoperability in Decision Making. Future Internet 2023, 15, 190. https://doi.org/10.3390/fi15060190
Azeroual O, Fabre R, Störl U, Qi R. Elastic Stack and GRAPHYP Knowledge Graph of Web Usage: A Win–Win Workflow for Semantic Interoperability in Decision Making. Future Internet. 2023; 15(6):190. https://doi.org/10.3390/fi15060190
Chicago/Turabian StyleAzeroual, Otmane, Renaud Fabre, Uta Störl, and Ruidong Qi. 2023. "Elastic Stack and GRAPHYP Knowledge Graph of Web Usage: A Win–Win Workflow for Semantic Interoperability in Decision Making" Future Internet 15, no. 6: 190. https://doi.org/10.3390/fi15060190
APA StyleAzeroual, O., Fabre, R., Störl, U., & Qi, R. (2023). Elastic Stack and GRAPHYP Knowledge Graph of Web Usage: A Win–Win Workflow for Semantic Interoperability in Decision Making. Future Internet, 15(6), 190. https://doi.org/10.3390/fi15060190