1. Introduction
Social networks have changed the form of information dissemination about public emergencies from “limited reporting” to “nationwide communication”. User-generated content (UGC) has emerged in large numbers, making every citizen both the receiver and disseminator of information. In 2020, the outbreak of COVID-19 triggered the biggest public panic in human history. As the first platform to form and disseminate information related to emergencies, social networks have become the incubator and catalyst for mass panic, which has played a driving role in promoting information dissemination. However, this pattern makes a lot of information interweave, which leads to the problem of information overload. As human attention to information is limited, attention becomes a scarce resource [
1]. In the process of information transmission, the distribution of popularity is uneven; most of the information has low popularity, and only a small portion of the information can maintain high popularity. In this case, what information will attract people’s attention and how it changes over time become the focus of research [
2]. To solve this problem, it is necessary to make full use of network text data and construct a scientific and effective prediction model to analyze the potential evolution of popular topics.
While most previous studies only focused on information in a single network, social networks are interconnected, and the same event spread in different social networks has relevance and transitivity. For example, when an emergency breaks out on Weibo, it will drive the clicks of its related content on video websites, so cross-domain information association is needed. Based on this, this paper has two research questions:
- (1)
How can one measure the text information similarity of different social network platforms for knowledge transfer learning?
- (2)
From the perspective of text information, how can one detect potential popular topics on social networks and predict popular topics?
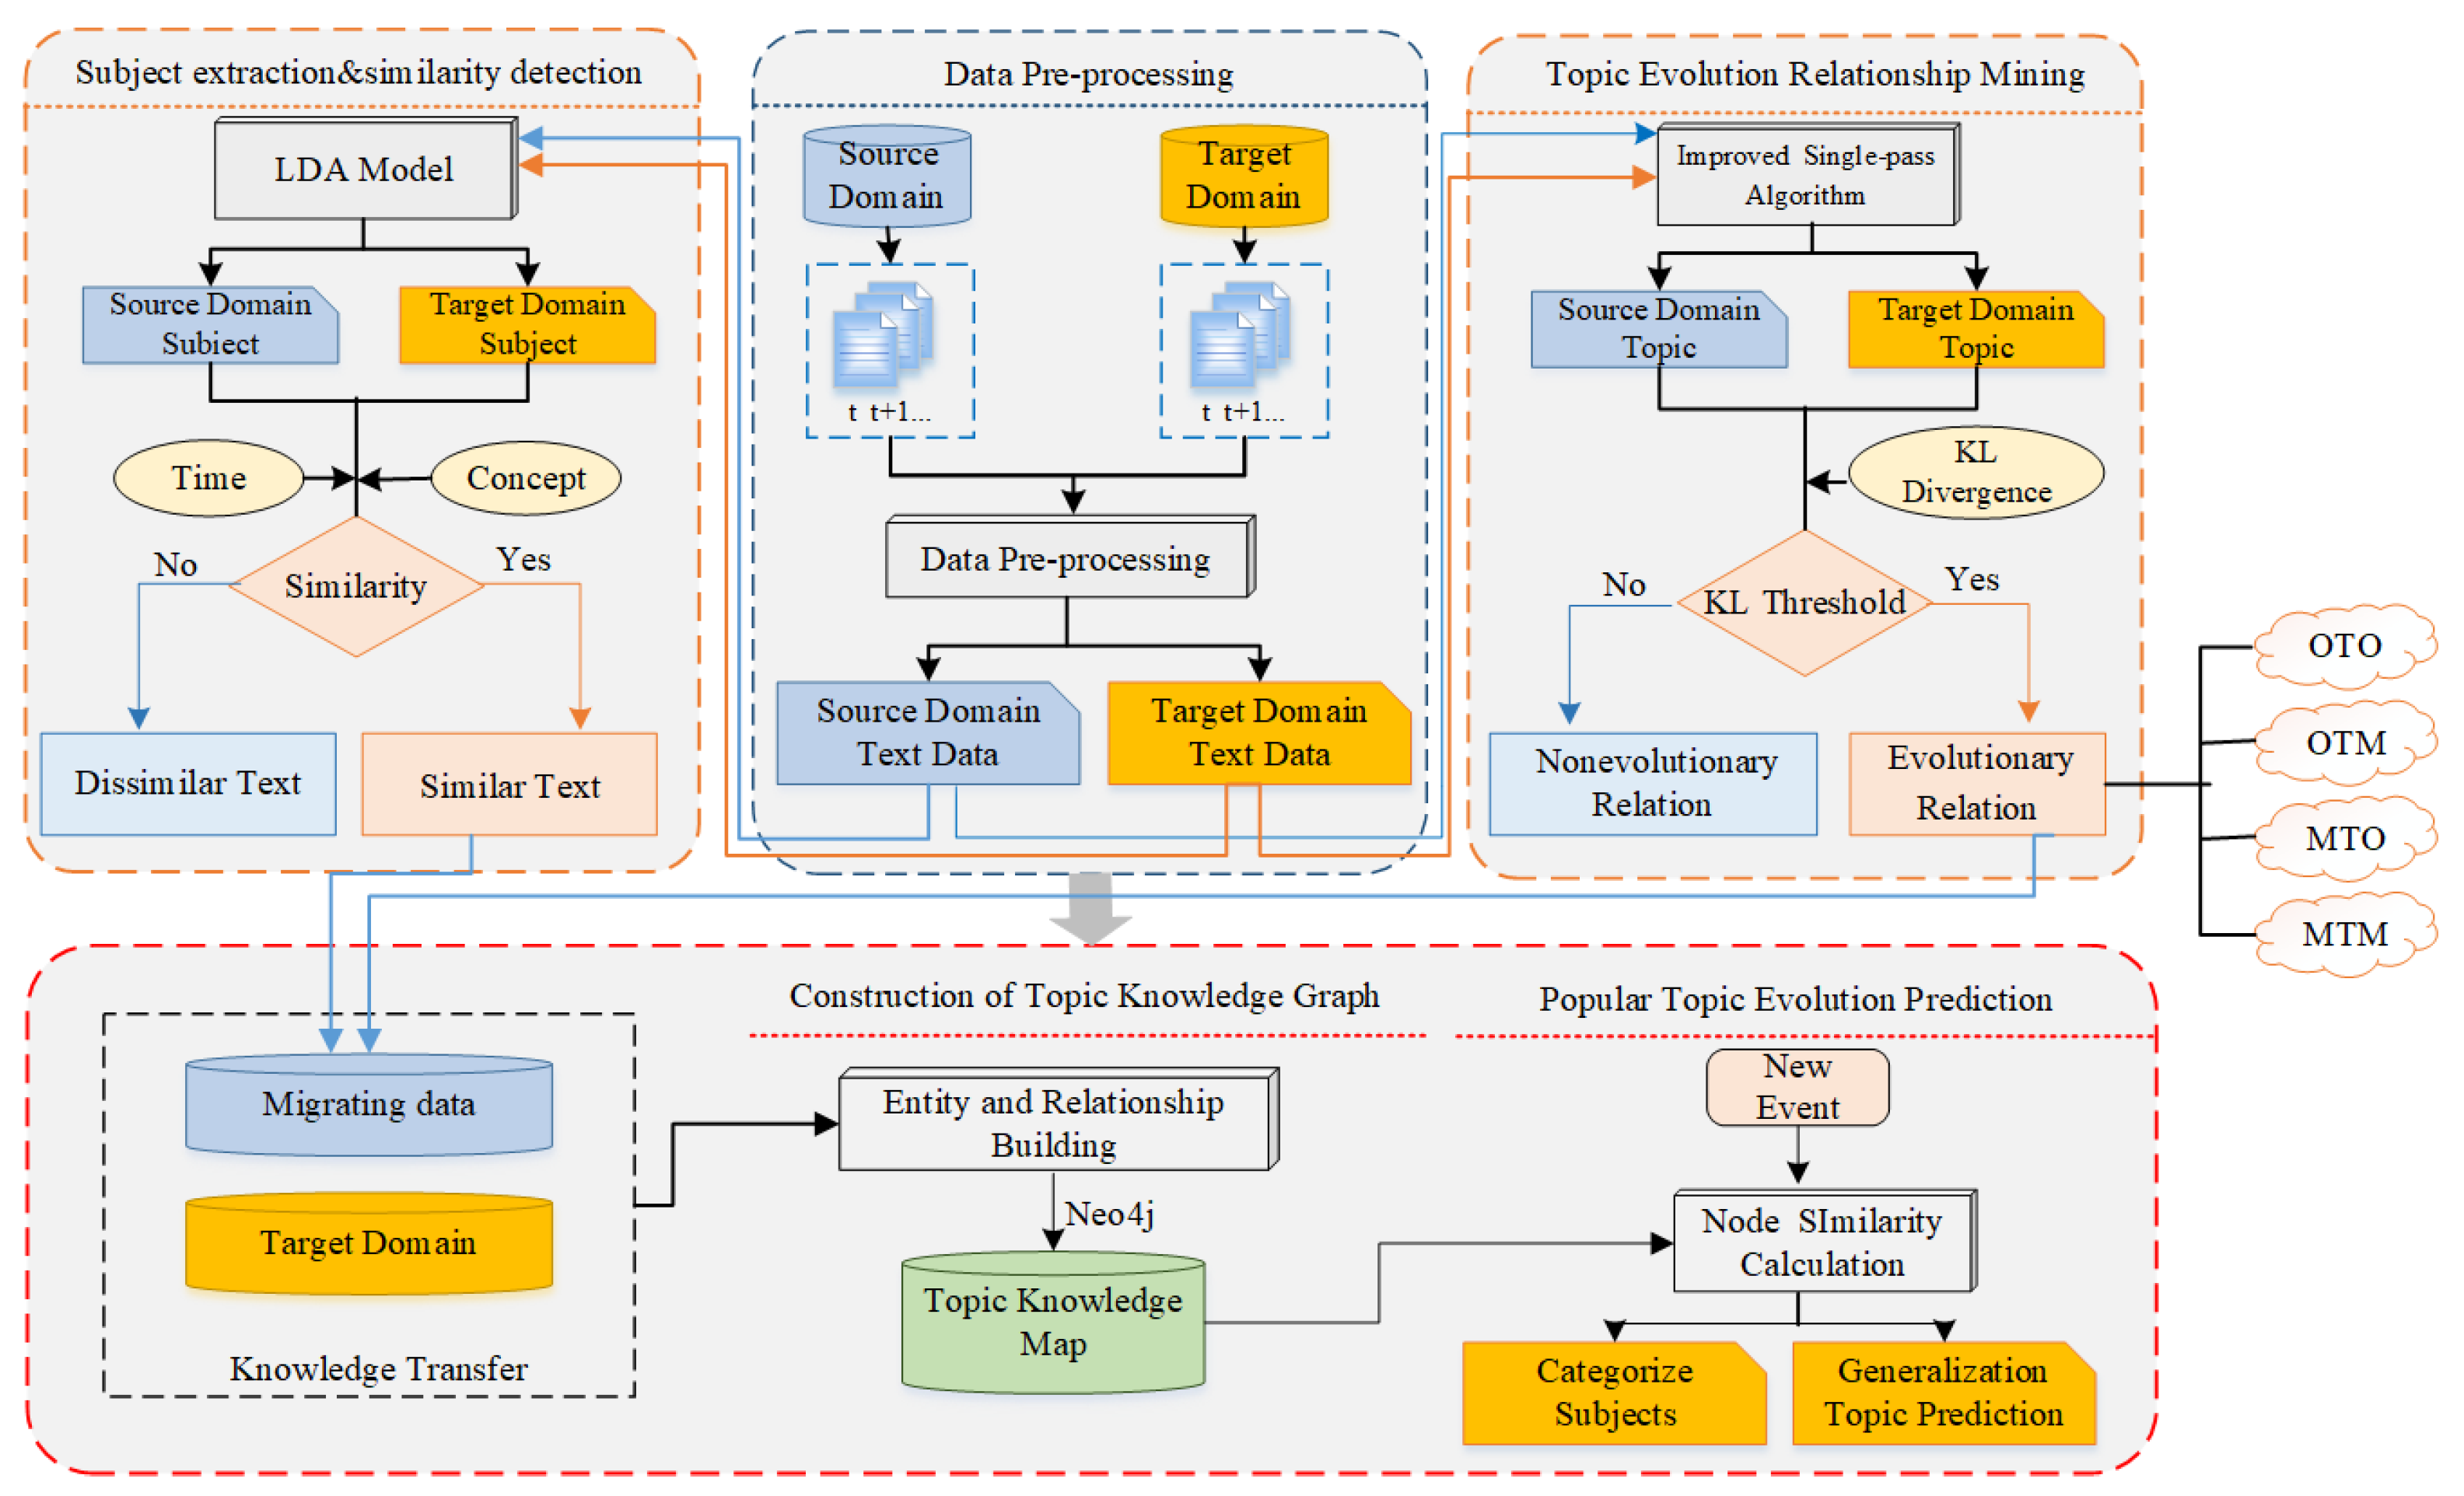
This paper adopts the transfer learning algorithm to predict the popular topics of emergencies in combination with information from other social network platforms to improve the accuracy of prediction. Based on the transfer learning results, this paper combines the knowledge graph with the emergency data to construct the public opinion topic graph, which will present the network structure of social network topics with semantic characteristics and then reach the goal of tracking the evolution of popular topics. The basic research framework of this paper is shown in
Figure 1. The research results help government departments to guide practice, grasp the public opinion trends of emergencies, and realize monitoring analysis and early warning of public opinion so as to take scientific and effective measures to guide and control public opinion.
2. Related Work
At present, for research on topic detection, scholars mostly work on methods such as topic modeling, multidimensional attribute extraction and algorithm-based improvement perspectives to identify the Internet users’ topics [
3,
4,
5]. The majority of them adopt multiple perspectives and techniques to detect topics in online public opinion events, but little work on the field of public opinion has been done with the help of knowledge graph methods [
6,
7,
8,
9]. The topic graph constructed by combining knowledge graph with data of online public opinion emergencies will present a complete network structure reflecting comment forwarding relationships and with semantic characteristics. Through the extraction of multi-dimensional feature attributes in the graph, the objective of tracking the evolution of topics in a comprehensive and systematic manner is achieved. We discuss related work in the fields of transfer learning, popular topic detection, and knowledge graphs.
Transfer learning. This concept first originated in psychology, arguing that people can use previously learned knowledge and skills to guide the learning of new knowledge [
10]. Common machine learning techniques traditionally address isolated tasks. In contrast, transfer learning aims to transfer knowledge learned in one source domain and use it to improve learning in a related target domain [
11]. Transfer learning has been previously used in various cases including classification, image clustering, collaborative filtering, and sensor-based location prediction [
12,
13,
14]. The feature learning problem of little or no sample data in the target domain can be solved by transferring the source domain data [
15].
Popular Topic Detection. Researchers have investigated a wide variety of methods and resources to detect popular topics of online information [
16], e.g., the LDA model replaces the traditional VSM model to extract hidden topic information [
17], a method of clustering words based on the similarity of related time series [
18], overview-based topic models and real-time detection techniques [
19], incremental clustering to detect new topics and use content and temporal features to discover popular topics in time [
20], and layered topic detection methods [
21].
Knowledge Graph. The essence of a knowledge graph is a semantic network graph that reveals entity knowledge [
22]. Scholars use the vocabulary provided by the semantic network to achieve short text understanding, word segmentation, type annotation, and concept labeling [
3]. Knowledge graph technology has made remarkable achievements in medicine, film and television, transportation, and other fields, but there is still a lot of work to be done in the field of social networking [
23,
24].
3. Data Pre-Processing
This paper takes the novel coronavirus pneumonia in 2020 as its research scenario. We collected datasets from the Harvard Dataverse platform [
25]. The two main social network platforms of Weibo and TikTok were taken as the research object. Based on transfer learning, the cross-domain prediction problem of the prevalence of new text messages on the social network platform was studied.
Weibo COVID dataset. Weibo, commonly referred to as “Chinese Twitter”, is a micro-blogging site. The data was crawled on the Weibo platform from 7 December 2019 to 4 April 2020. The data was crawled in two phases covering a total of 4,047,389 Weibo posts. The first crawler ran on 26 February 2020 and collected 3.3 million Weibo posts from 18 January 2020 to 26 February 2020. The second crawler ran on 4 April crawling from 7 December 2020 to 4 April 2020 to complement the original dataset.
TikTok COVID dataset. We mainly used the GooSeeker big data crawler software to crawl the data of the TikTok website. Data were collected from 25 December 2019 to 30 May 2020, crawling a total of 15,756 pieces of data from 2685 government media users. Since the short videos were released by government media accounts, they have high authority, a wide spread, and great influence.
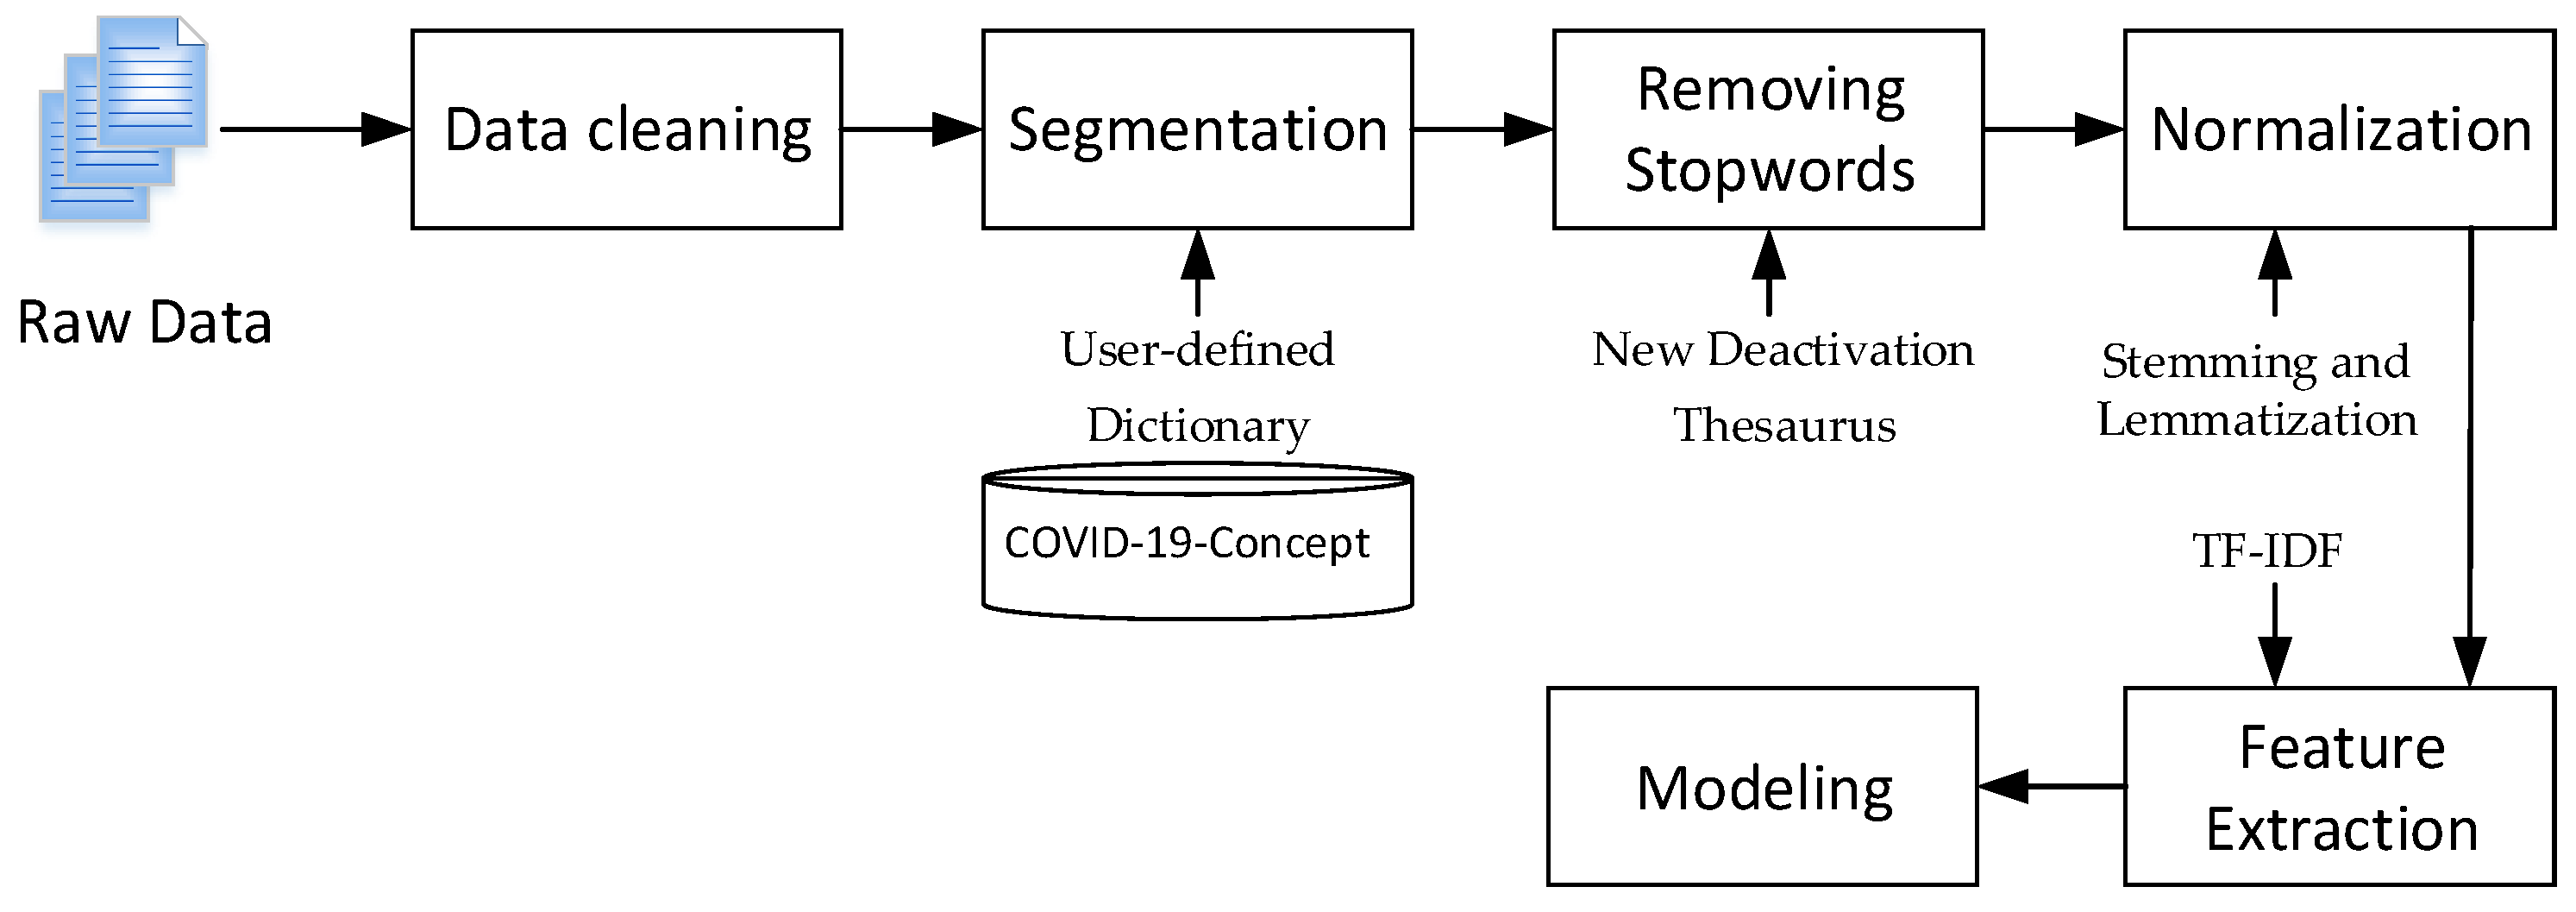
We adopted Chinese word segmentation (jieba) to segment Chinese text, and added a user-defined dictionary (dict. Txt) based on the new crown open concept knowledge graph publicly released on the OpenKG platform (COVID-19-Concept) to optimize the word segmentation results. Additionally, this study makes comprehensive use of the advantages of “Baidu deactivation Thesaurus”, “Harbin Institute of technology deactivation Thesaurus” and “Sichuan University Machine Intelligence Laboratory deactivation Thesaurus” to filter stop words [
26,
27]. We combined the contents of the three deactivation thesauruses to build a new deactivation thesaurus and deleted meaningless information so as to reduce the interference to the word segmentation results.
After the above processing, the Chinese text data was still in text format and could not be directly recognized and calculated by the computer. Therefore, text representation processing is required. This paper represents text based on the vector space model (VSM). Then characteristic words with strong discrimination and representativeness were extracted from the text so as to reduce the dimension of vector space, simplify the calculation process, and improve the efficiency of text processing without damaging the core information. At the same time, the word frequency was normalized to avoid the interference of the length of the text. In this paper, term frequency inverse document frequency (TF-IDF) was used to extract text features. If a word had a higher word frequency in one document and a lower word frequency in other documents, it was considered that the word could distinguish documents well and it was given a greater weight; On the contrary, if the word appears in multiple documents, it indicates that its distinguishing ability is not strong, and the value of IDF is small. The whole process of data preprocessing is shown in
Figure 2. Finally, we used the obtained data for model construction and analysis.
4. Transfer Learning Model
In this paper, we adopted the transfer learning model which was established based on the DSN Network [
28]. This method considers that the source domain
and the target domain
are composed of two parts: the public part and the private part. The former can learn the public features and the latter is used to keep the independent characteristics of each domain. Traditional machine learning algorithms require the training and testing sample data to have the same distribution. However, the transfer learning algorithm broke the limitations, as long as there is a correlation between the
and
domains, knowledge can be obtained from the
domain which can be applied to the different but similar
domain to solve the problem of insufficient
training samples. Therefore, this paper establishes a transfer learning model based on the DSN network method.
According to the principle of similarity matching, instance data with high similarity between the source domain
dataset (Weibo platform) and the target domain
dataset (TikTok platform) were transferred to the target domain to help with target domain model learning. In the transfer learning model, the source domain was set as
and the learning task in the source domain was denoted as
and the target domain was set as
and the learning task in the target domain was denoted as
. The data distribution of these two domains is
and
, and
≠
. In order to improve the performance of transfer learning, the
domain data was divided into training sample set
and test sample set
, (i.e.,
), where
u and
v represent the time sequence length, respectively. Then,
and
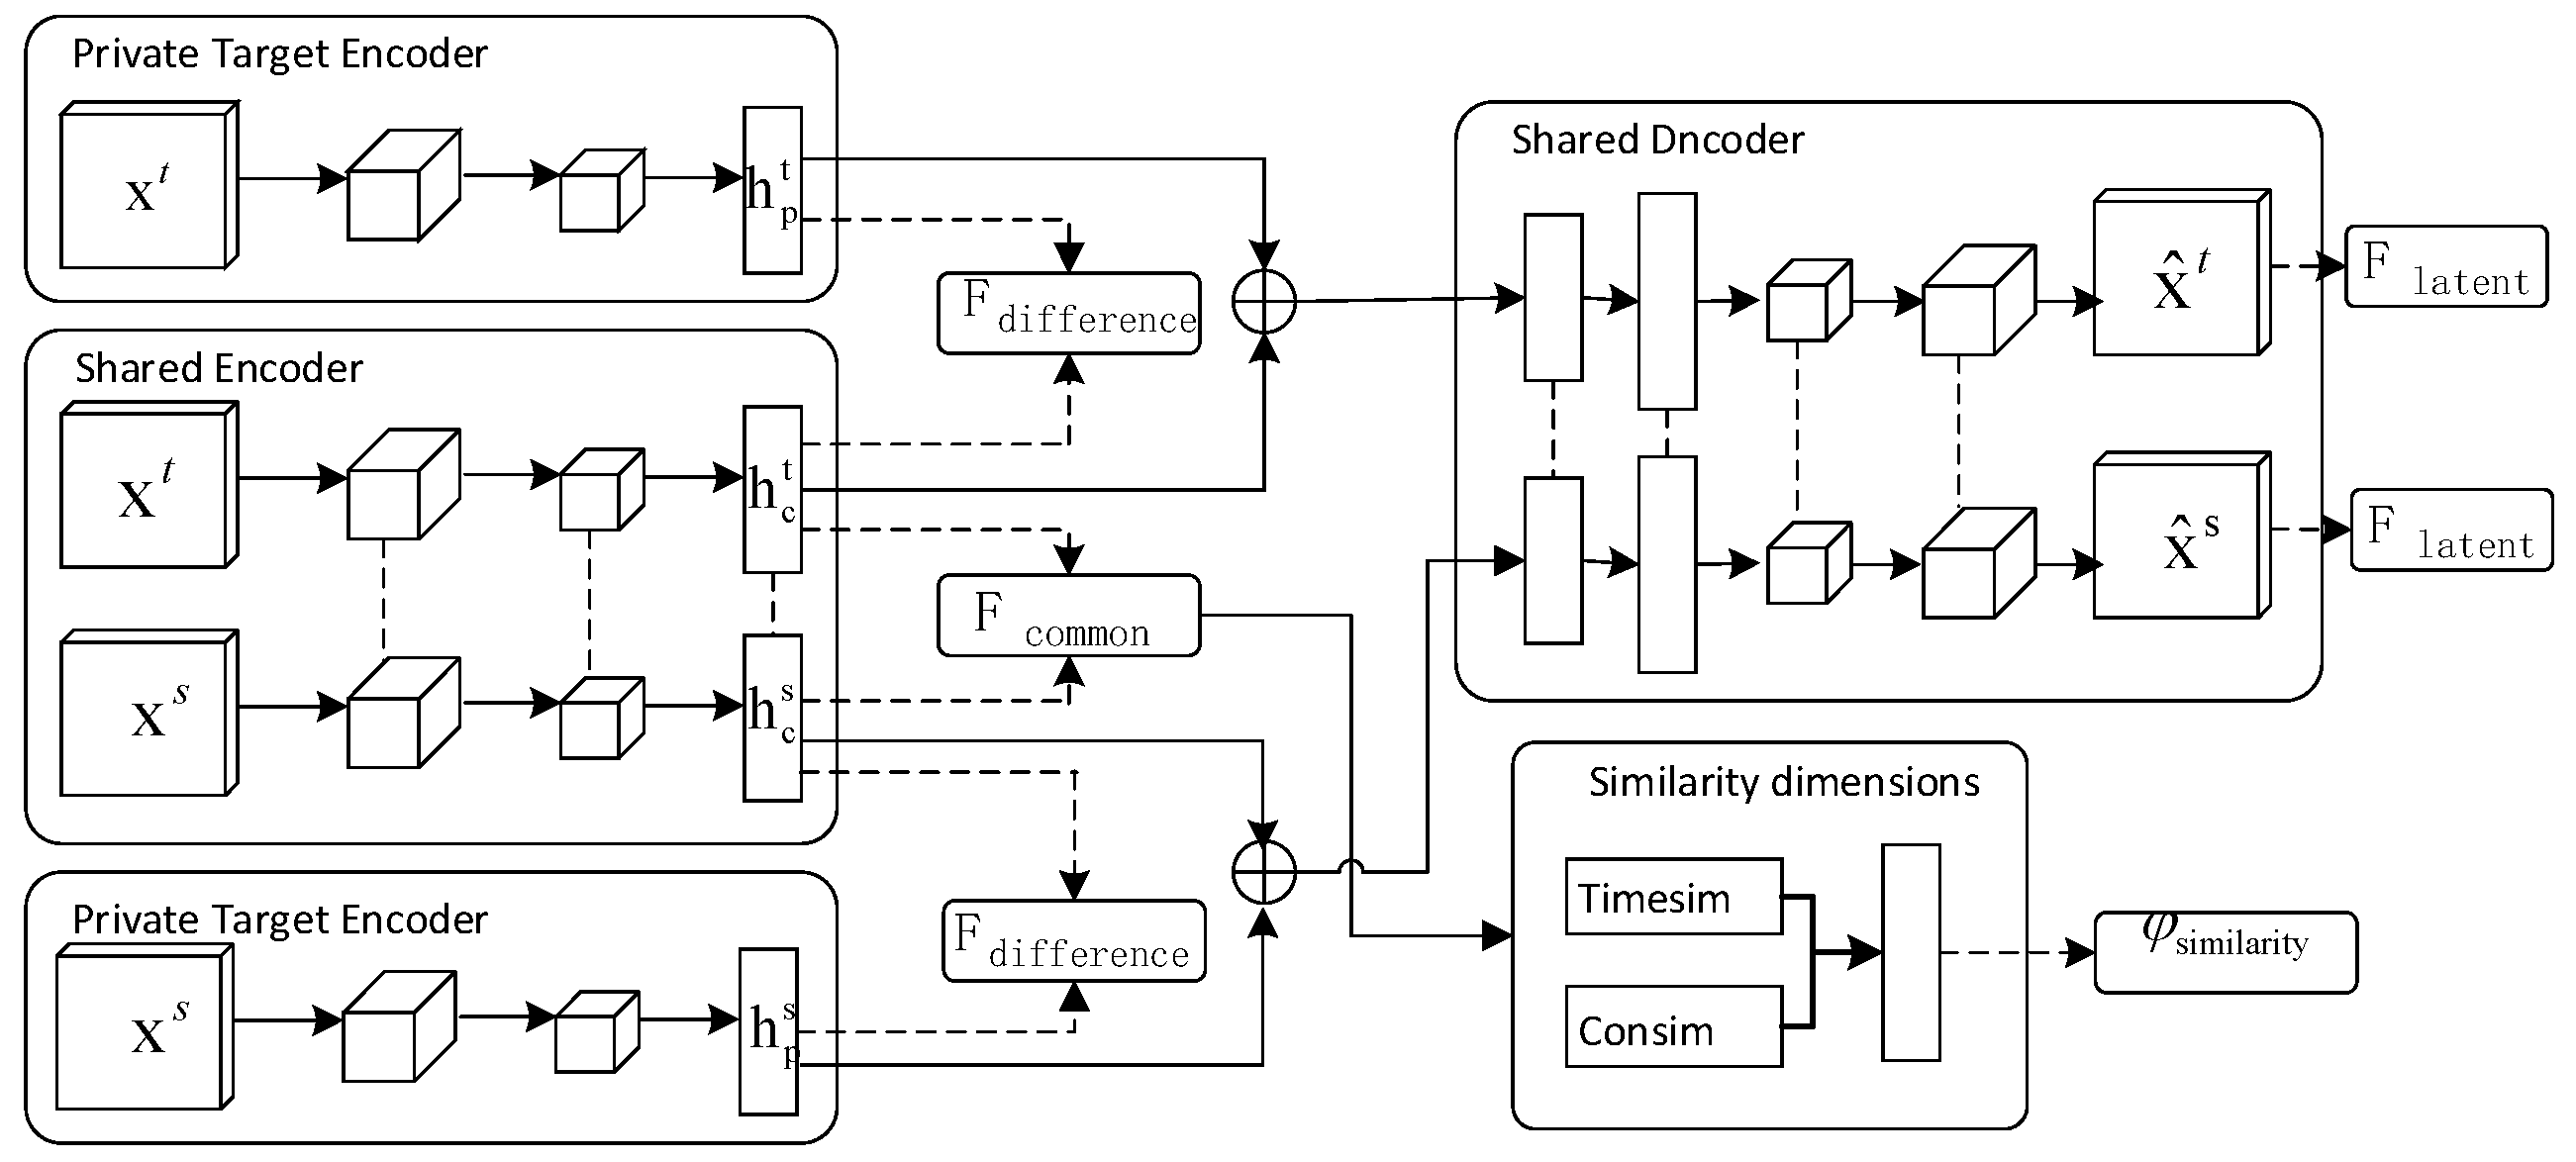
were combined into the training set. The structure of the DSN network transfer learning algorithm is shown in
Figure 3.
In the
Figure 3,
and
are the hidden vectors of common features extracted from the
and
domain.
and
are the hidden vectors of private features extracted from the
and
domain.
is the similar feature extracted from the
and
domain by calculating the similarity between
and
, and
is the dissimilar feature extracted from
and
domain, which ensures that the private part still plays a role in learning task
and
.
is the latent feature which is further mined based on dissimilar features.
is an indicator to measure the similarity between platforms, which is calculated by two dimensions: temporal similarity and conceptual similarity. Based on the
value, the paper transfers the source domain samples to the target domain for training research.
4.1. The Improved TC-LDA Model
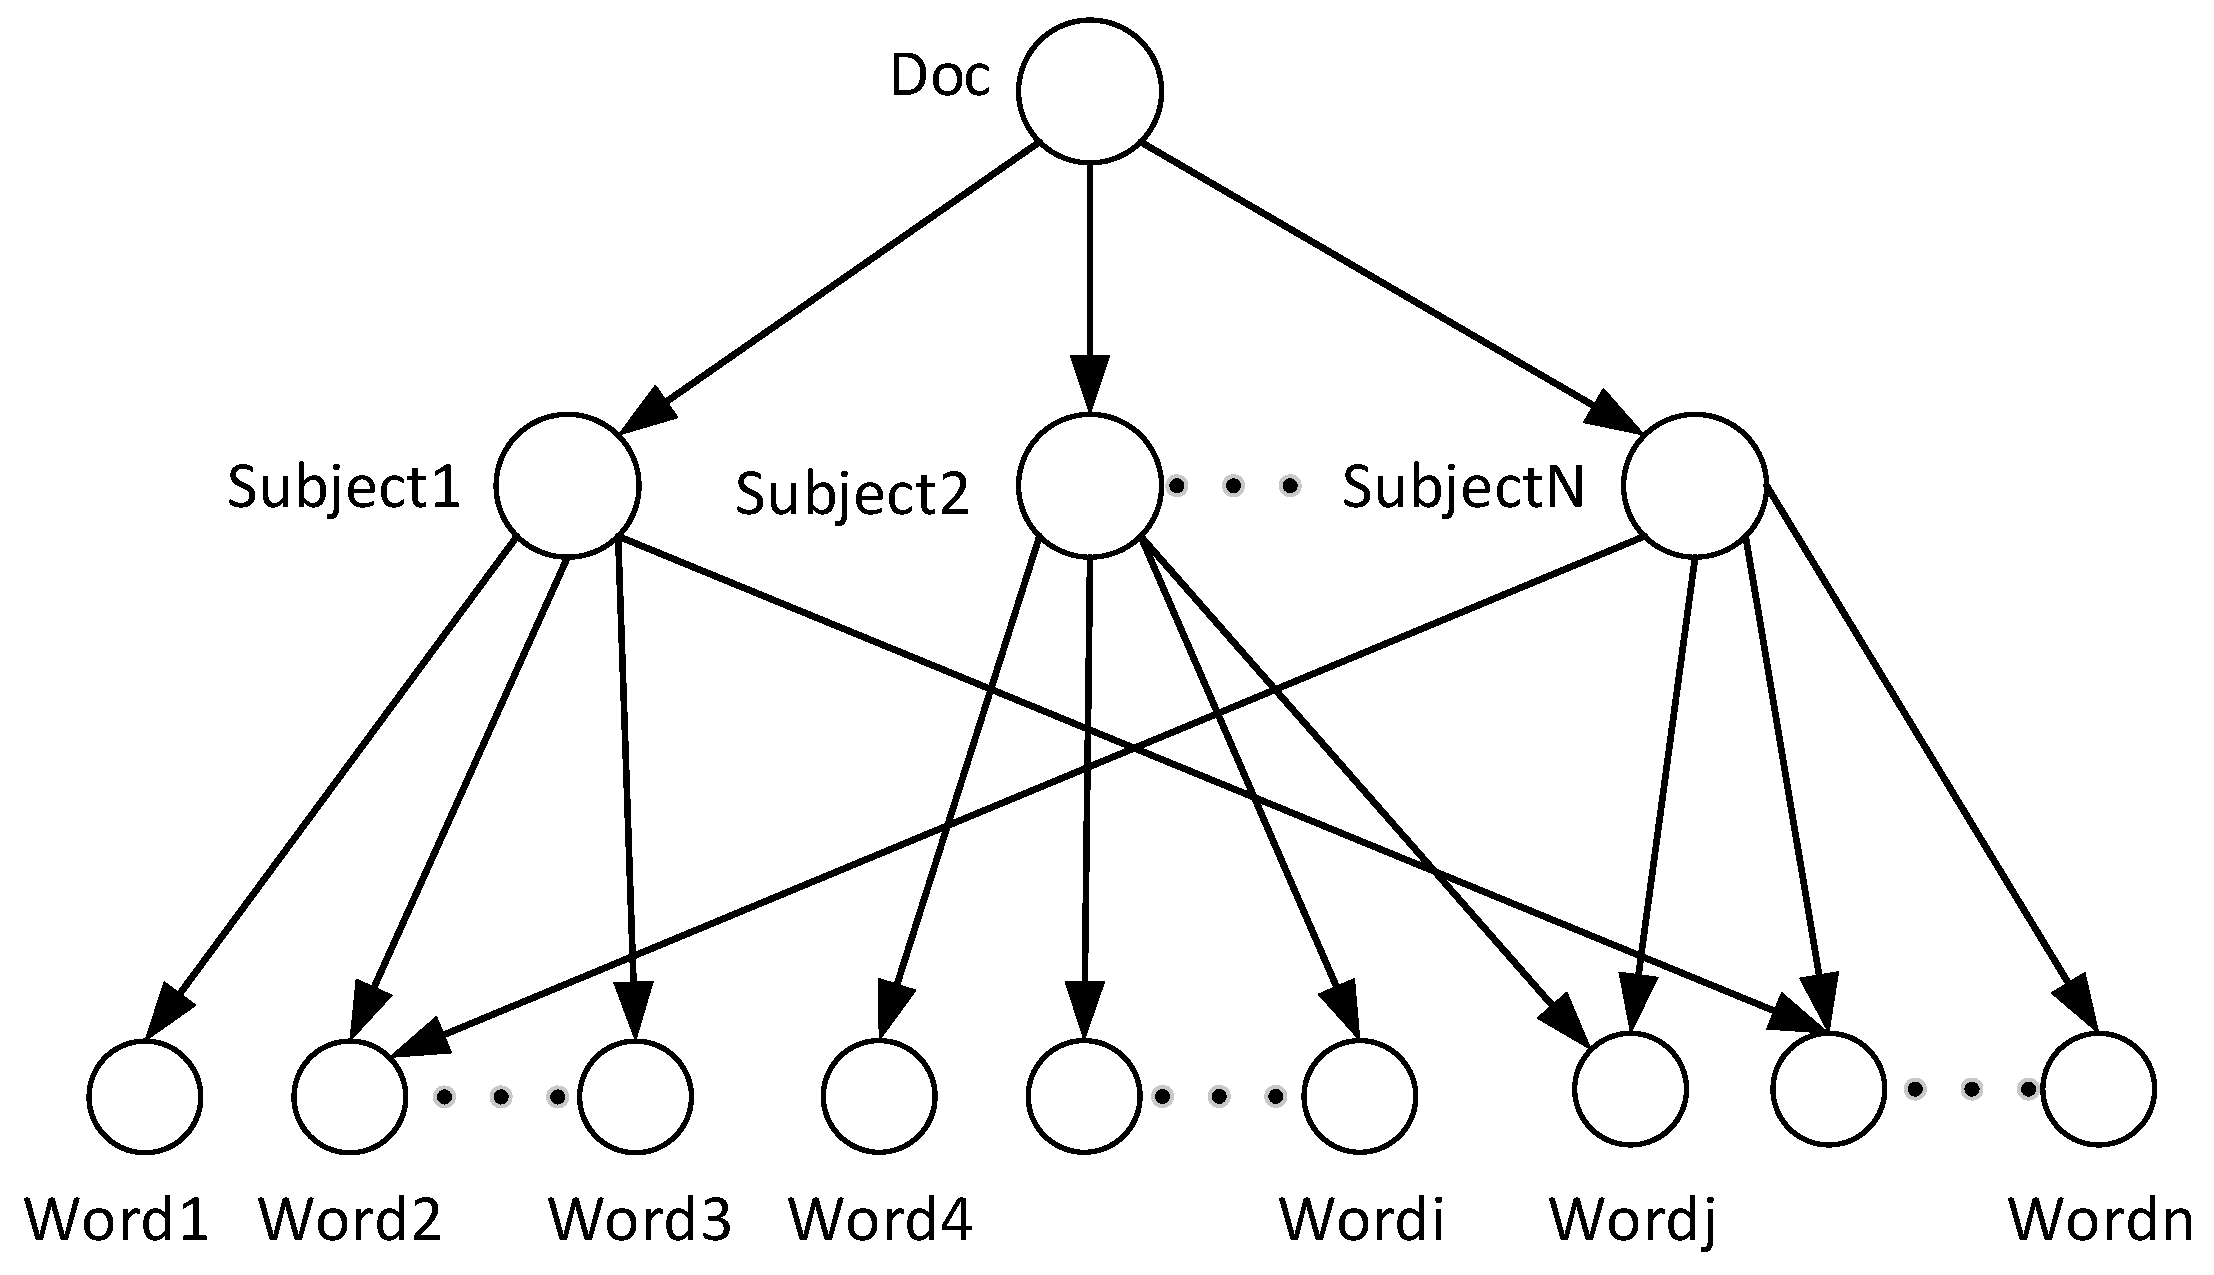
The LDA (Latent Dirichlet Allocation) model is a classic subject model. This paper uses the distribution of words in the text to find the potential subject by clustering words with similar distribution (
Figure 4). After LDA model subject extraction, the text set of the source domain is represented as
, which is composed of feature word
and subject word
. Similarly, the text set extracted from the training set of the target domain is represented as
, consisting of feature word
and subject word
.
As the source domain and target domain of this study are both social network media, the text content belongs to the short text type, which has the characteristics of time dynamic and feature sparsity of short text. In view of the characteristics of short texts, this paper improves the LDA model to calculate text similarity and proposes TC-LDA similarity model. First, considering the influence of the time factor, time feature similarity is introduced. Since this paper studies hot topics on social media, the popularity will drop significantly after 3 days. Therefore, the time interval is set as 3 days (72 h) in this paper. The longer the time interval, the lower the similarity value of the time feature between texts with more than 3 days. We take text
in the source domain and text
in the target domain for example. For texts with the same time, a greater weight is assigned, and the calculation is shown in Formula (1):
Second, for the feature sparsity of short texts, concept similarity is introduced to expand the feature space of short texts.
The calculation formula of the number of concept words shared by two texts
is as follows:
The formula for calculating the total number of concept words contained in the two texts
is as follows:
The calculation formula of concept similarity is:
The definition of the similarity calculation formula in this paper is given. For text
in the source domain and text
in the target domain, under the condition that they are divided into the same subject class through the analysis of LDA subject model, through the feature weight coefficient
, combined with the two factors of time feature similarity
and concept similarity
,
and
are the subject weights of text division obtained by LDA model. After testing, the similarity threshold of 0.3 is found to be the most appropriate. The calculation of determining the similarity between
and
is shown in Formula (5):
4.2. Experiment
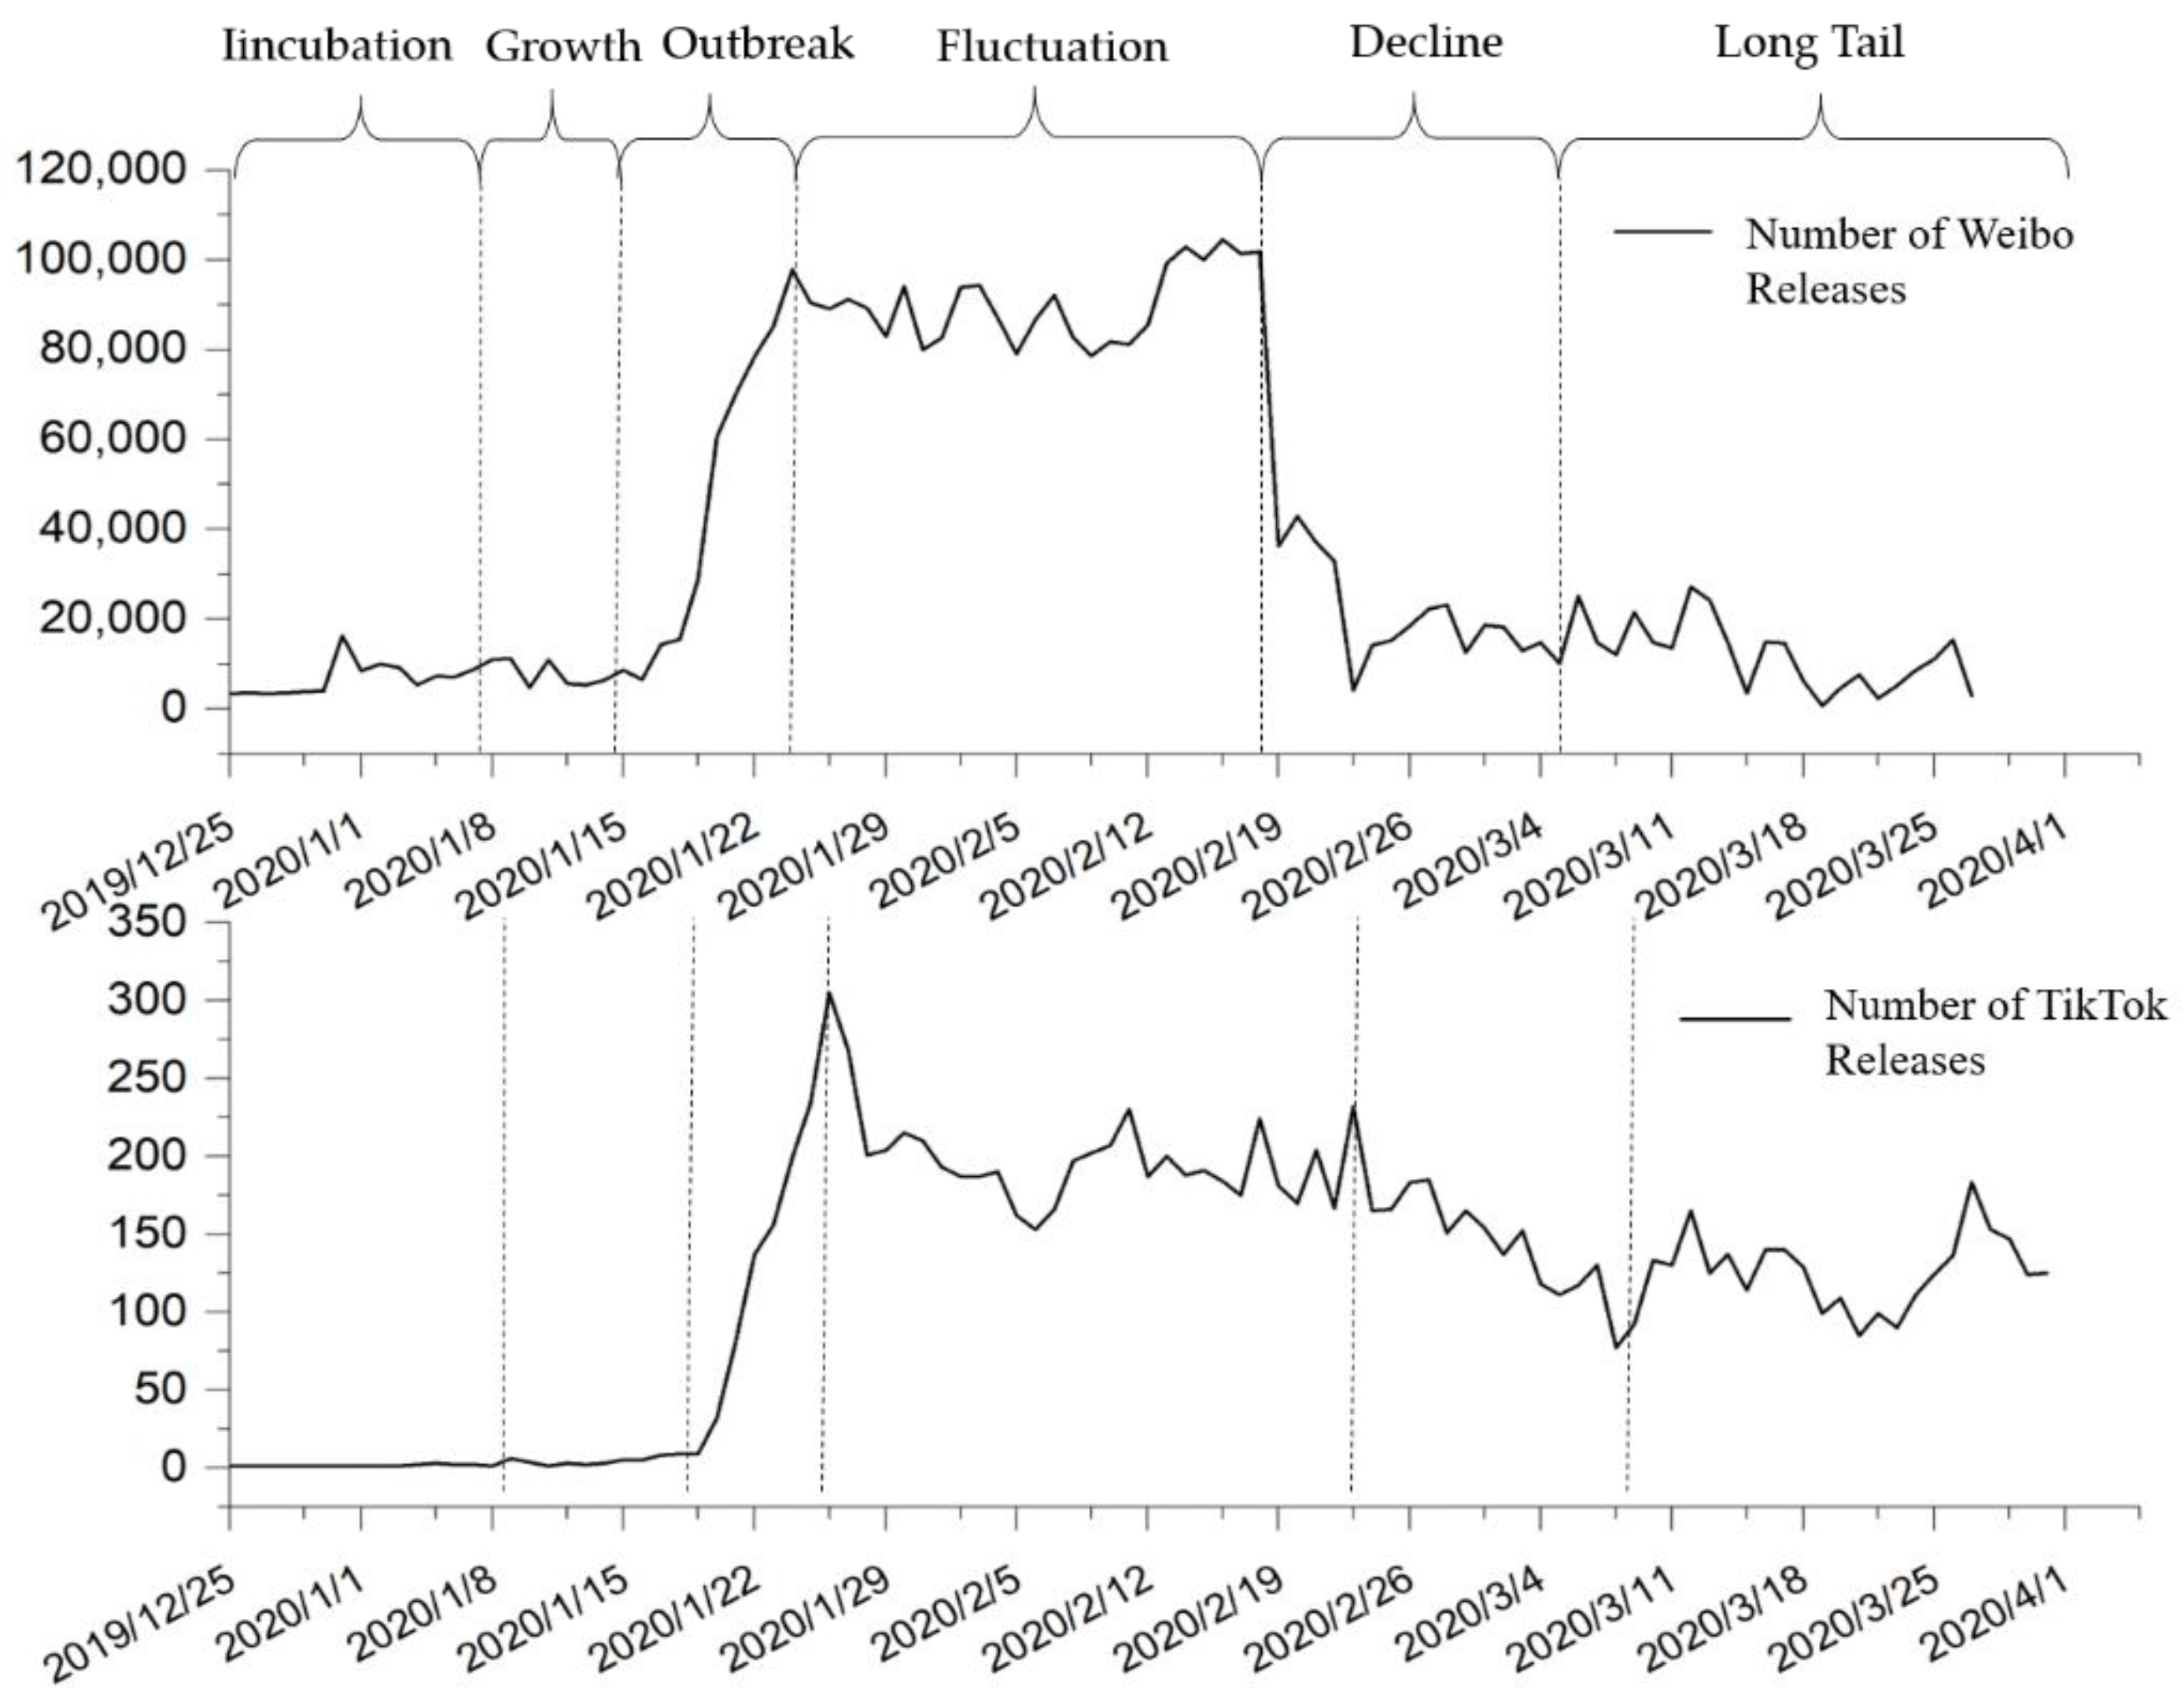
Based on previous research results and combined with the characteristics of COVID-19 emergencies [
29], this paper divides the development of epidemic public opinion into six stages: incubation period, growth period, outbreak period, fluctuation period, decline period, and long tail period, as is depicted in
Figure 5. Additionally, in order to more accurately reflect the topic content in each period, according to the statistical analysis results of the life cycle stages, this paper divided data into time slices in the granularity of one week (7 days). The first 70% of the data in the two domains was selected as the training set, including 14 time slices (T0, T1, …, T14) from 25 December 2019 to 7 April 2020). The last 30% of the data was selected as the testing set, including 7 time slices (T15, T16, …, T21) from 8 April 2020 to 31 May 2020. The data were then allocated to the corresponding time slice, and the text in each time slice was processed in turn and the subject extracted.
The data used in this experiment are the data from the Weibo and TikTok platforms after data pretreatment. This paper takes the LDA model processing of source domain and target domain data on T1 time slice as an example to illustrate. Data on other time slices were processed according to the similar LDA model mentioned above.
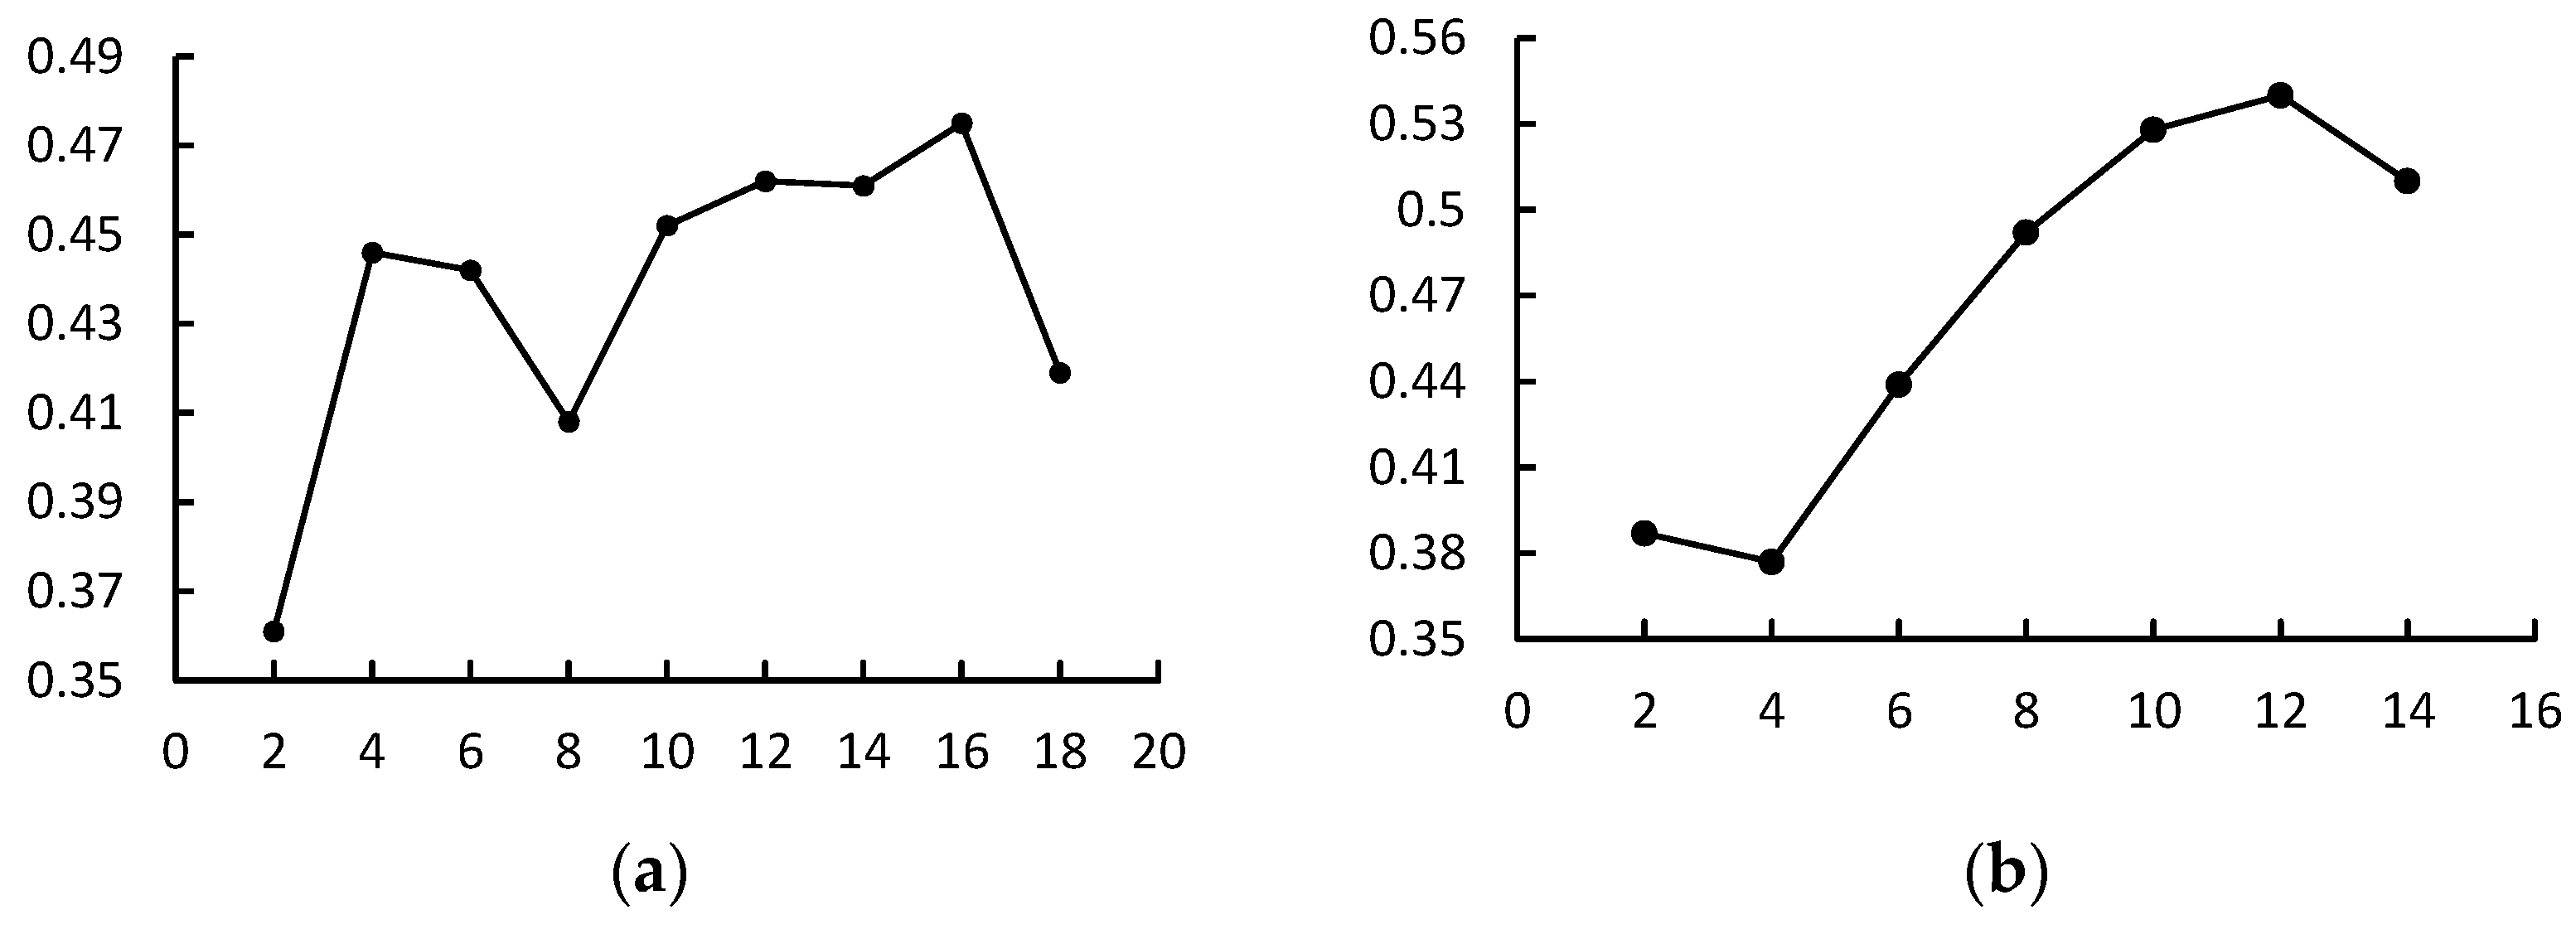
Through Gensim’s LDA Model method, the subject number range was set as [
2,
20], and the subject consistency scores of LDA models in the source domain and target domain under different subject numbers were obtained, as shown in
Figure 6. The best number of subjects for the source domain T1 time slice data was obtained as 16, and the model’s perplexity is −6.9. For subjects in the target domain, the optimal number was 12, with the model’s perplexity equal to −5.27.
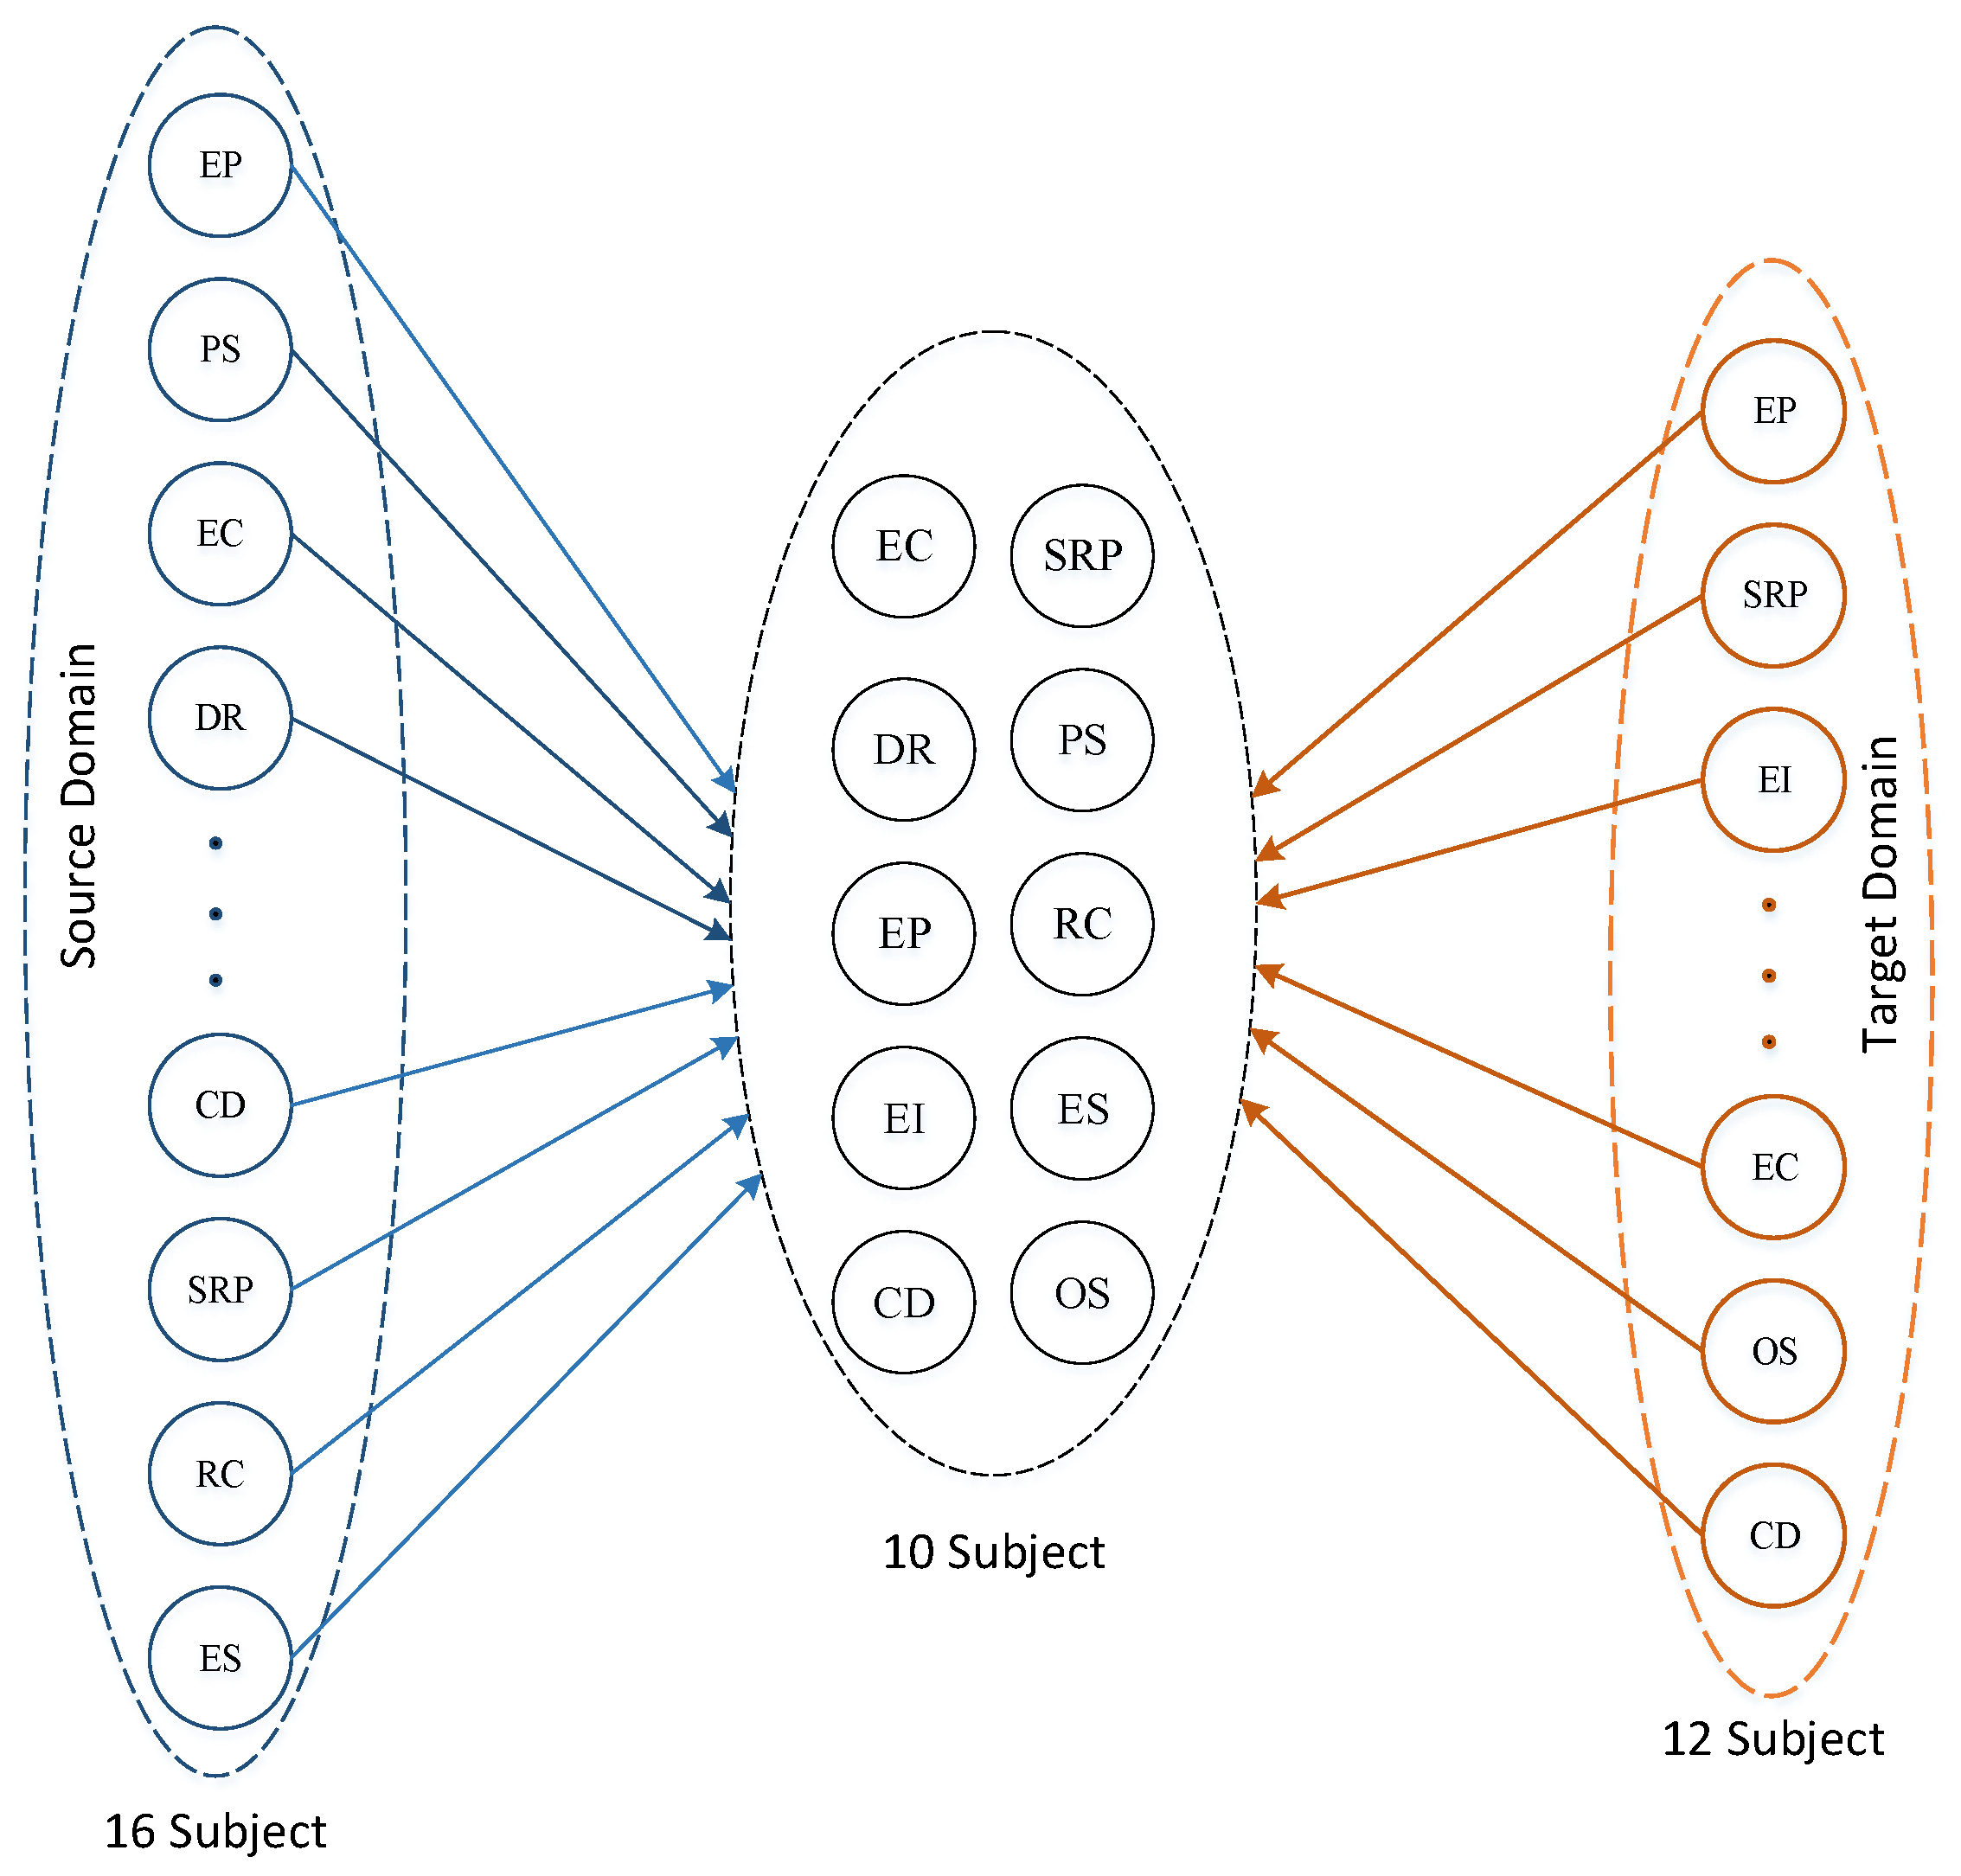
Then we set the number of subjects in the source domain to 16, the number of subjects in the target domain to 12, and reserved 10 keywords for each subject. Check the subject results extracted from the source domain and target domain in
Figure 7.
Each subject is composed of multiple words, and the same word may be contained in multiple subjects. For example, the 10 key words of the EP subject include “prevention and control, COVID-19, epidemic, combat, Novel Coronavirus, pneumonia, gather, disinfection, and Wuhan” (note: original data keywords are Chinese; this is translated data). Based on the above analysis, this paper is mainly divided into 10 subjects: epidemic condition (EC), data reporting (DR), epidemic prevention (EP), epidemic impact (EI), charity donations (CD), scientific research and popularization (SRP), people’s stories (PS), rumor clarification (RC), emotional subjects (ES), and other subjects (OS).
4.3. Results
According to the results of subject extraction from LDA models of the source domain and target domain, we proposed an improved TC-LDA model to calculate the similarity of texts with the same subject. Some text data are extracted for explanation, as shown in
Table 1.
According to Formula (1) given by TC-LDA, the temporal similarity results of the above three groups of text examples are calculated (see
Table 2). For conceptual similarity, we used the open API interface of the CN-Probase concept knowledge graph platform to query the concept words of related entity words in the text. This approach can expand feature words and reduce feature sparsity in short texts. Then, we used Formula (4) to calculate the conceptual similarity of text feature words, and the results are shown in
Table 3. Finally, the similarity between the two text message fields was obtained according to Formula (5). For information with high similarity, instance transfer is performed, and information with low similarity is retained to keep the private features of source and target domains.
In order to measure the effect of text similarity calculation, we adopted
and
values to measure the effect of text similarity. Parameters related to
and
are shown in
Table 4.
refers to the ratio of correctly classified text data to all texts, which is used to evaluate the performance of correct migration of similar texts in source domain and target domain.
is used to evaluate the overall performance of similar text transferring in the source domain and target domain. It is calculated by
and
. The formula is defined as follows:
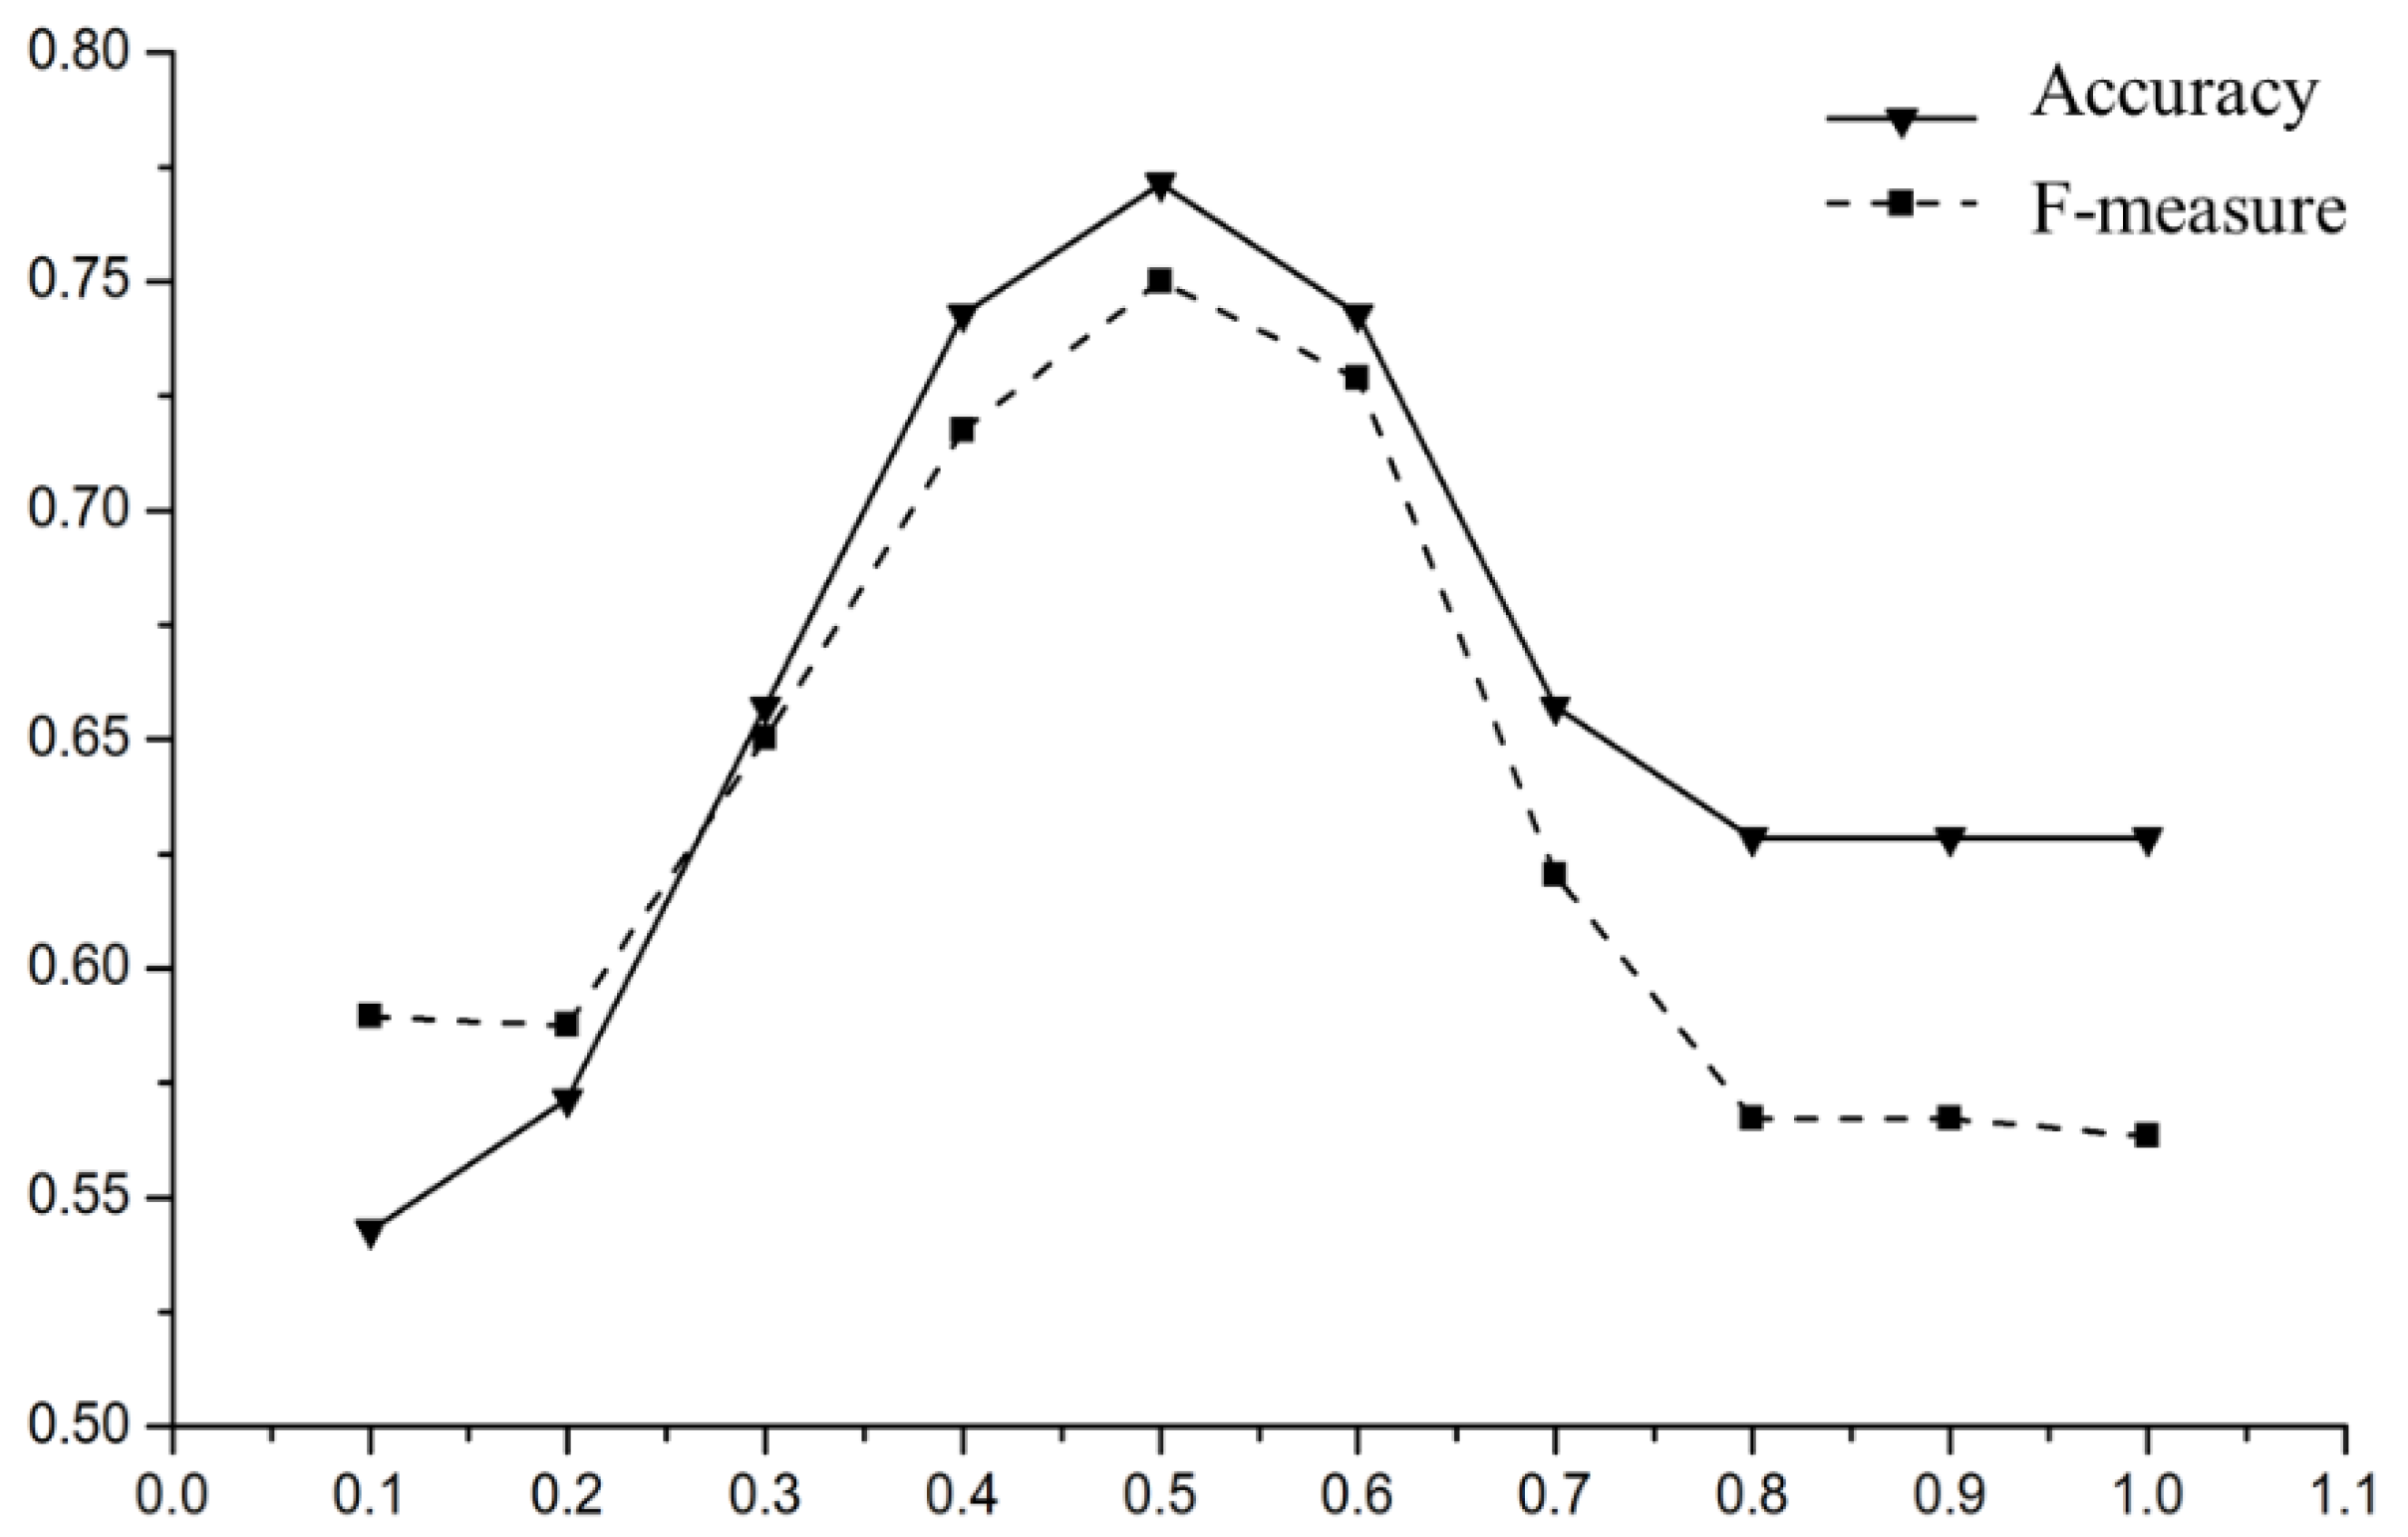
In order to obtain better experimental results, this paper sets the characteristic weight coefficient to change from 0.1 to 1 and carries out experiments according to the value of different parameters. According to the principle of TC-LDA model in
Section 4.1, if the similarity threshold is set to 0.3, that is, for texts with a
0.3, it is considered that the texts of the source domain and the target domain are similar, and transfer learning can be carried out. Otherwise, the texts are considered to be dissimilar samples, and the results are shown in
Figure 8. When the feature weight coefficient λ = 0.5, the
and
value of TC-LDA model are the highest, so we set λ = 0.5 in this study.
In order to measure the performance of the improved TC-LDA model, this paper compares the LDA model with the TC-LDA model through four evaluation criteria, and the results are shown in
Table 5. We can see that the TC-LDA model proposed in this study has significant advantages over the LDA model in similar text detection. The new model improves the
,
,
and
value, which contributes to the subsequent transfer learning and data mining.
5. Prediction of Popular Topics Based on Knowledge Graph
According to the results of transfer learning in
Section 4, for text data with low similarity in time slices, transfer learning cannot compensate for training samples in the target domain. Therefore, the source domain and target domain retain their private features respectively, but text topics in different time slices may also have an evolutionary relationship with relevance. Therefore, the potential topic information can be extracted from the source domain which can be transferred to the target domain in the adjacent time slice for the prediction of potential popular topics in the target domain.
5.1. Topic Discovery and Filtering
Subject extraction of text data of each time slice belongs to subject discovery of static text information. However, social network texts are particularly affected by time, so this study adopts single-pass algorithm to find topics [
30]. Due to the large amount of data, this study takes the data of the T2 time slice in the source domain and the T3 time slice in the target domain as an example to illustrate the topic discovery process of single-pass algorithm. The calculation steps for data in the other time slices are the same.
Aiming at the shortcomings of the single-pass algorithm [
31], we made the following improvements to this algorithm: On the one hand, we sorted text data according to the release time before input, which was suitable for the evolution of the topic. In this way, we reduced the influence of different input sequences on clustering results. On the other hand, we use the way of the inverted index to accelerate the clustering and improve the search efficiency when the data volume is large.
After several experiments, it was found that it is appropriate to define the threshold as 0.2 and realize the model through Python software to obtain the respective topic categories of the source domain and target domain. As machine learning cannot fully understand human natural language text, limitations exist in the topic filtering. Therefore, we manually set “problem-answer” to train the binary classifier, which is used to filter topics after training to some texts. If relevant, they will be left, while irrelevant topics will be deleted. In this way, we filter out the topics unrelated to COVID-19 events. The final number of topic categories is shown in
Table 6.
In this section, there were a total of nine subjects involved in the source domain and target domain data, which are encoded by letters [a–i], respectively. As for the extraction results, the topics were manually labeled according to topic category keywords and topic sentences and were encoded by 1 to 10, respectively. The specific results are shown in
Table 7.
5.2. Topic Evolution Relationship Mining
After the topic is discovered, this paper mines the evolutionary relationship between topics. KL divergence refers to the information gained or relative entropy used to quantify the asymmetric difference between two probability distributions, P and Q, which can be used to measure the evolution of topic content [
32]. As the evolutionary relationship is asymmetric, KL divergence is adopted in this paper to measure the evolutionary relationship. The calculation of KL divergence is shown in Formula (10).
where,
represents the distribution of feature words of topic
,
represents the distribution of feature words of topic
,
represents the probability of feature words
in
, and
represents the loss of information to approximate with
and
. The smaller the value, the closer
is to
, the more likely
is to evolve from
, and vice versa. At the same time, considering that some of the directly extracted keywords have the same conceptual semantics, but the words are different and therefore cannot be recognized, this study extends the conceptual semantics of the topic feature words based on the CN-Probase conceptual knowledge atlas platform.
The evolution of topics in the source domain and target domain can be divided into four types: one-to-one relationship (OTO), one-to-many relationship (OTM), many-to-one relationship (MTO), and many-to-many relationship (MTM). This paper set the calculation results of KL divergence as the basis to determine whether the evolution between topics takes place. After many tests, we set different KL divergence thresholds to observe the results of the experiment. When KL = 0.25, the classification accuracy of topics with evolutionary relationships was the highest. Therefore, the threshold value of KL divergence is set to 0.25. If the threshold value is lower than 0.25, it indicates that there may be an evolutionary relationship between topics. Taking the scientific research and popularization (SRP) subject as an example, the results of the evolutionary relationship between topics are shown in
Table 8.
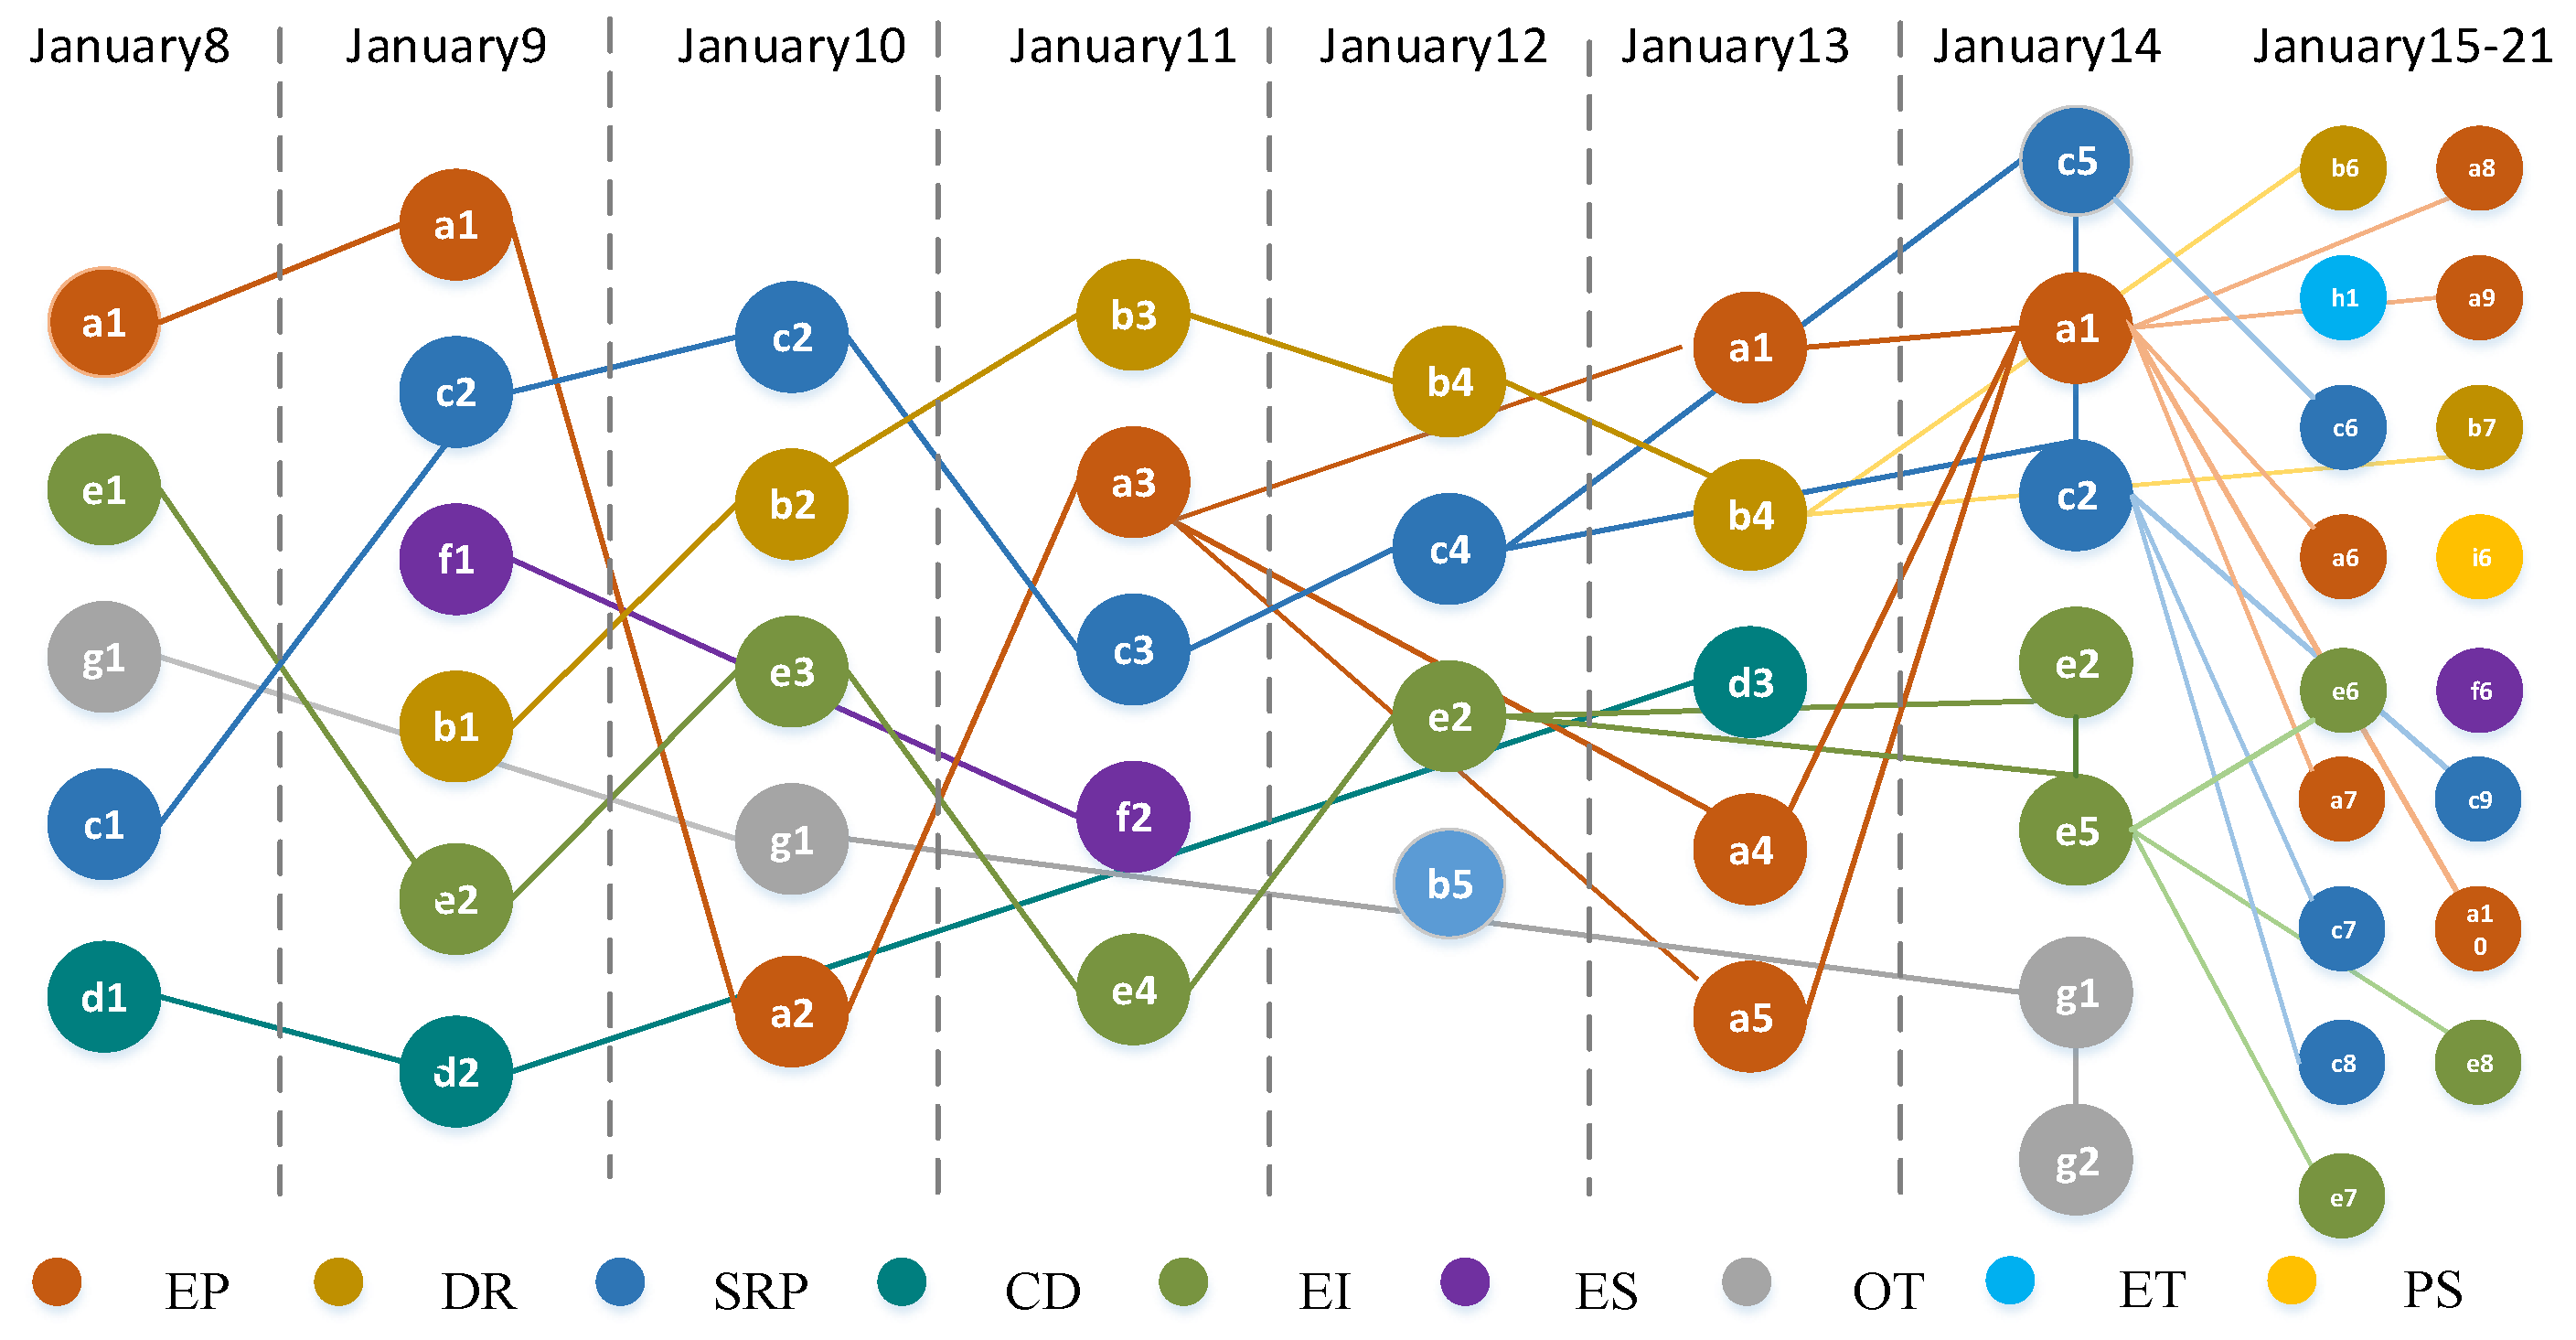
In order to facilitate the construction of the topic knowledge graph, this paper defines four categories of topics, including starting topic, ending topic, single topic, and hot topic. The above method is used to mine the evolutionary relationship of T2 time slice in the source domain and T3 time slice in the target domain, and the evolutionary results are shown in
Figure 9.
5.3. Topic Evolution Prediction Based on Knowledge Graph
A knowledge graph is a network with a semantic nature, and its basic constituent unit is the triple of “entity, relation, entity”, through which knowledge is expressed in a graph structure [
33,
34]. Entities are essentially the semantic objects in the real world. Network public opinion entities can be individuals or organizations for opinions through social networks such as media, government, Internet users, social institutions, etc., or incidents causing wide public concern. The entity of this article is extracted from the social network dataset and contains four entity classes: Subject, topic, event, person. Through the research on the defined entities, four relations of <subject, include, topic>, <event, belong to, topic>, <people, belong to, topic> and <people, involve, event> are obtained, as shown in
Figure 10, where the ellipse represents the entity category, and the line represents the relation.
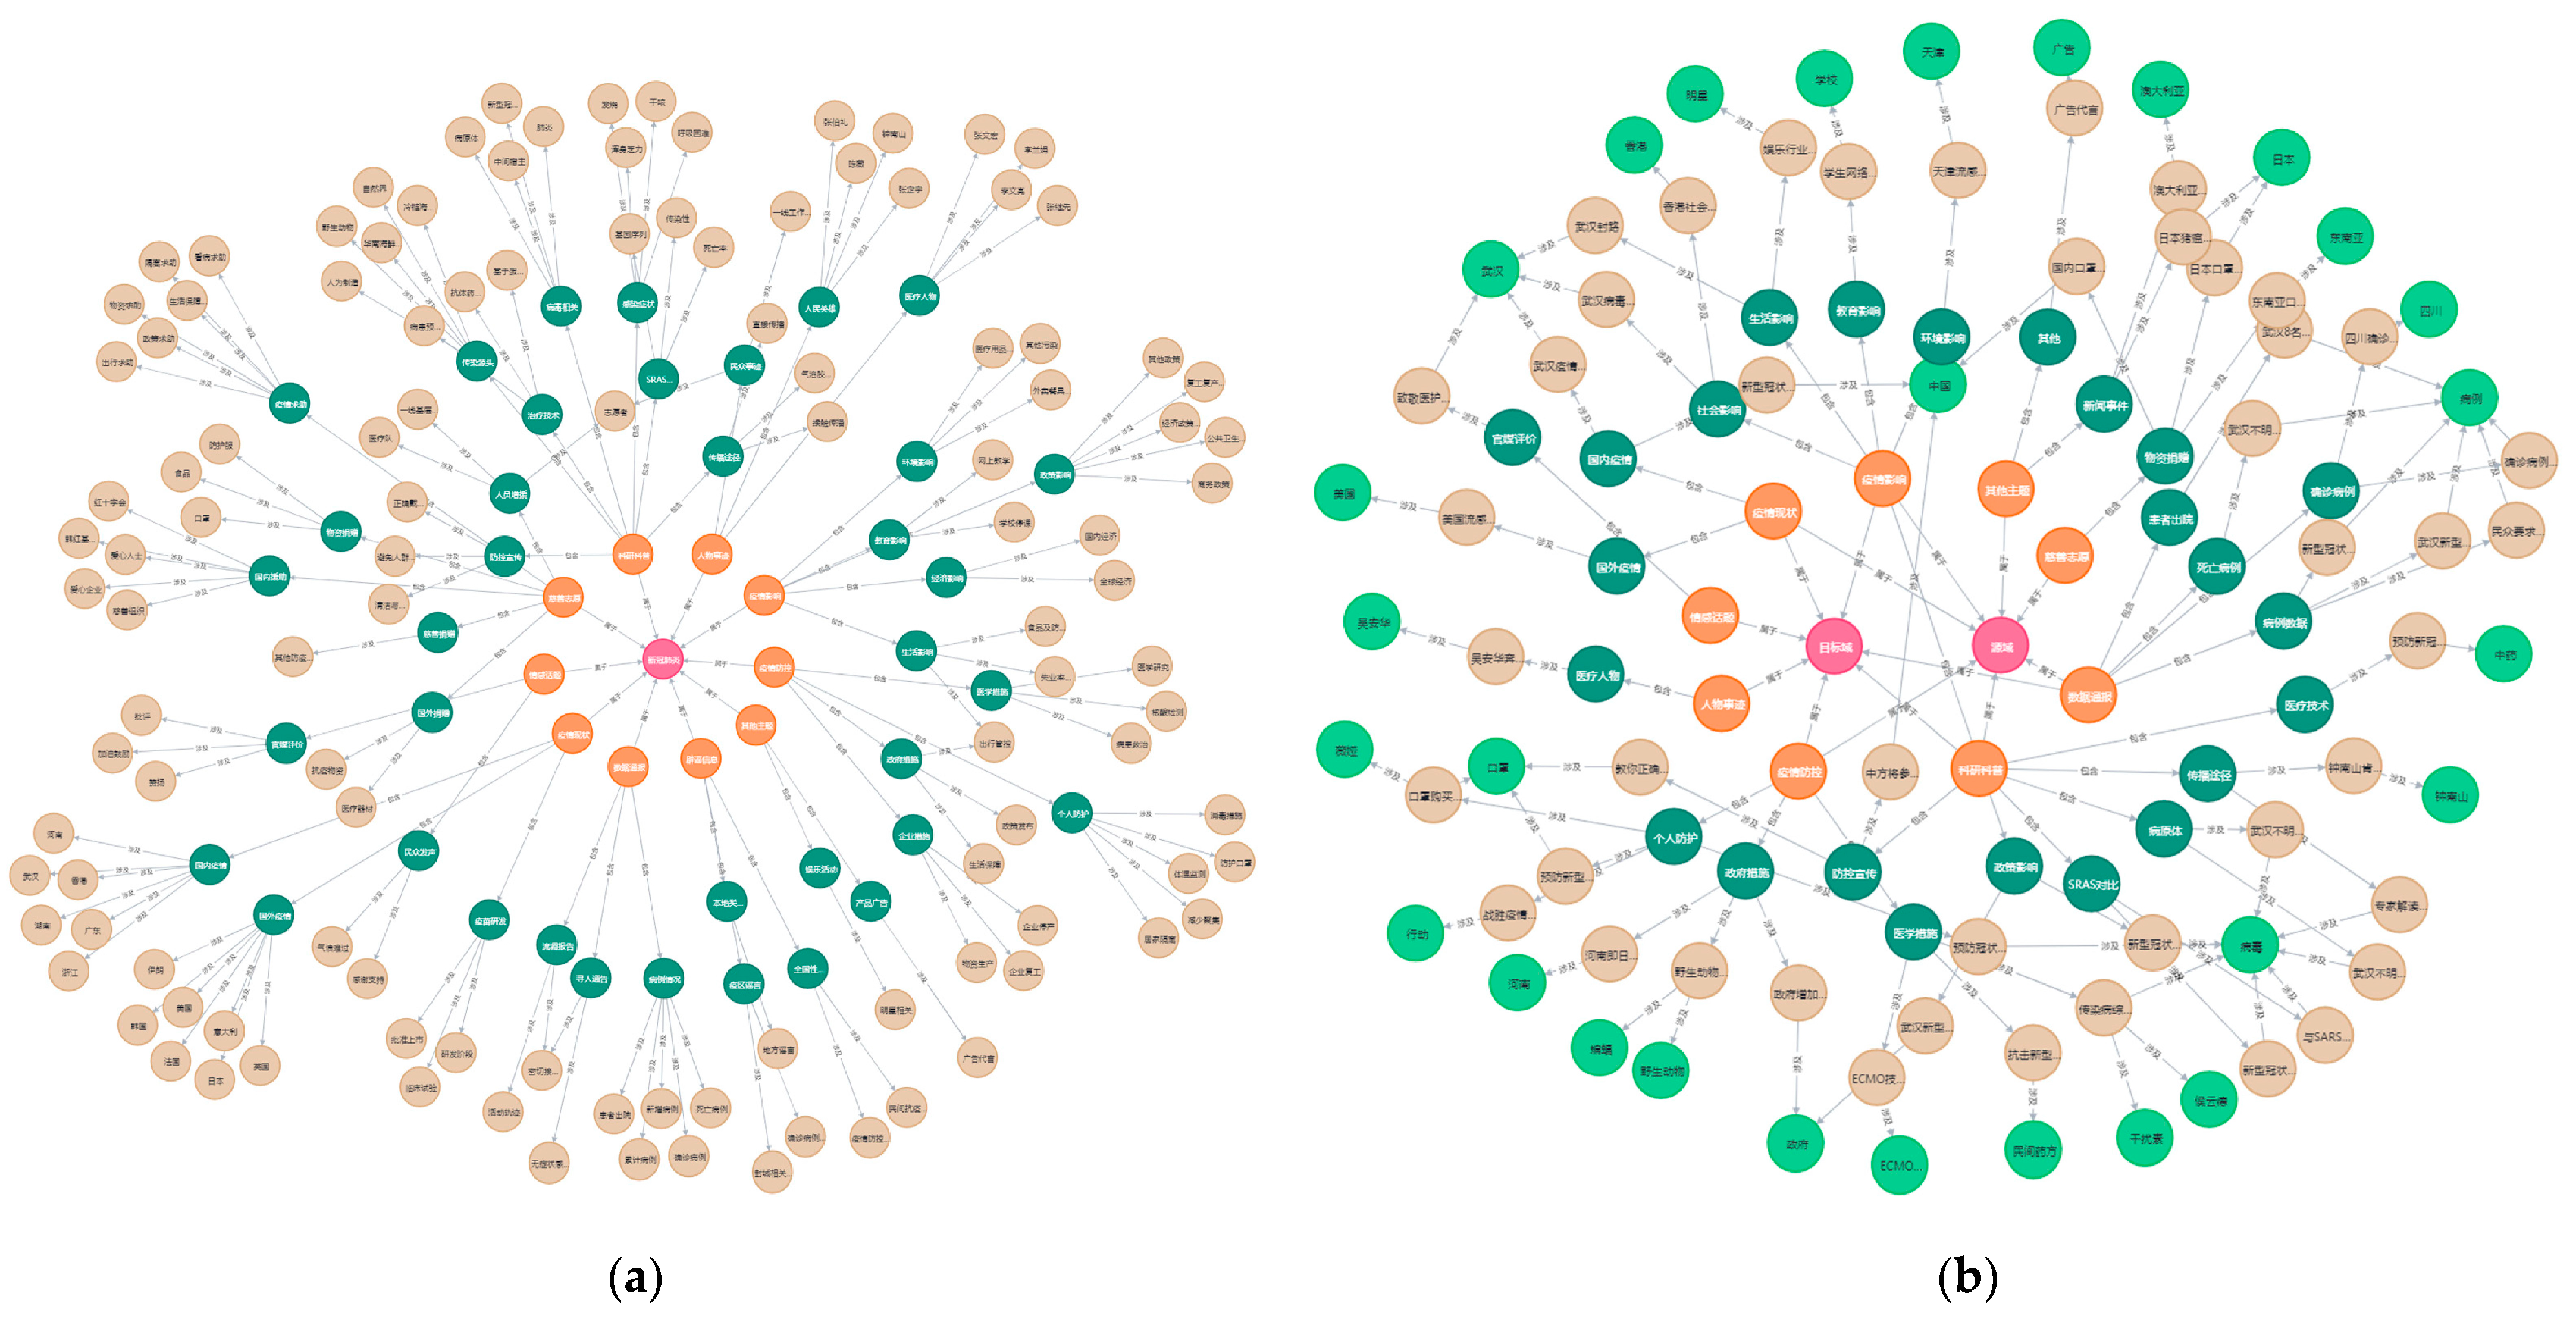
The topic knowledge graph was constructed from text data of source and target domains from 25 December 2019 to 7 April 2020, including subjects extracted by LDA model and topics, events, and people extracted by single-pass model. Considering the display effect of the graph, the knowledge graph ignoring the human entities as shown in
Figure 11a,b intercepted part of the public opinion topic subgraph with the source domain T2 time slice and the target domain T3 time slice data as the core data, with the human entity added.
This paper takes the topic knowledge graph established by the source domain T2 time slice and the target domain T3 time slice as the research samples and selects five representative online public opinion events in the source domain on 22 January 2020 as test samples. They are, respectively, “Henan has banned the sale of live poultry in the market” (N1), “The Ministry of Transportation launched the level II emergency response” (N2), “Wuhan set up the epidemic prevention and control headquarters” (N3), “CDC will announce the first novel Coronavirus case in the US” (N4), and “Strict prevention of Novel Coronavirus in Spring Festival Transportation” (N5).
By traversing the nodes in the topic knowledge graph, cosine similarity was used to calculate the similarity between the key words of test events N1–N5 and the key words of nodes in the knowledge graph, and the node with the highest similarity was found. However, the accuracy of node prediction results in the knowledge graph of the target domain is low, so nodes with an evolutionary relationship between the source domain and the target domain are transferred to improve the accuracy of topic prediction in the target domain so as to realize topic prediction in the target domain.
According to the similarity calculation of topic nodes in knowledge graph, we get the source domain N1–N5 test events subject prediction results, as shown in
Table 9. At the same time, we traverse the nodes to find the target domain generalization topics, as shown in
Table 10. This paper extracts the weight of the biggest prediction of top 10 subjects and topics, and the accuracy of the prediction results was judged manually. The correct prediction was recorded as Y, and the wrong prediction was recorded as N.
Additionally, this paper adopts the MRR (Mean Reciprocal Rank) indicator to measure the topic prediction effect. The prediction accuracy of N1–N5 test events calculated by MRR method is shown in
Table 11, and the mean value is taken as the final result, according to which the subject prediction accuracy is 82.6% and the topic prediction accuracy is 70.46%, indicating that the model has good prediction effect and strong applicability.
6. Conclusions and Future Work
We implemented cross-domain transfer learning between two social network platforms and propose an improved TC-LDA model to measure the similarity between the two domains. Compared with the LDA model, the TC-LDA model has improved , , and values. Based on the results of transfer learning, we built a topic knowledge graph by using the Neo4j graphics database and conducted experiments to predict the evolution of popular topics in new emergencies. Experimental results show that knowledge graph technology is effective in popular topic prediction.
In this paper, entities, relationships, and attributes were extracted from COVID-19 emergency information to construct knowledge maps and predict topics. On the one hand, the effect of online public opinion analysis could be improved, so that government departments could make predictions in advance and take corresponding guidance measures in a timely manner to prevent public opinion from blindly expanding. On the other hand, the construction of the topic knowledge map based on the characteristics of the COVID-19 event also expands the application of the knowledge map in the field of public opinion analysis of emergencies on social networks, which can provide theoretical reference for studies in similar fields.
In future research, the graph convolutional network will be considered to model richer sentence semantics. In future research, multiple source domain data will be considered to be used for transfer learning to improve the prediction accuracy of information popular topics.


