Abstract
The tourism industry has been rapidly growing over the last years and IT technologies have had a great affect on tourists as well. Tourist behaviour analysis has been the subject of different research studies in recent years. This paper presents the digital pattern of life concept which simplifies the tourist behaviour models’ construction and usage. The digital pattern of life defines the general concepts of tourist behaviour, connects the tourist and the digital world and allows us to track behaviour changes over time. A literature review of the current state of the research in selected fields is performed for identifying the existing problems. The case studies of behaviour analysis based on classification, clustering and time series events behaviour models are shown. An ontological approach and artificial neural networks are used during behaviour model construction, training and evaluation. The gathered results can be used by smart tourism service developers and business stakeholders.
1. Introduction
The tourist industry has been rapidly growing over the last years and is intensely integrated with modern information and communication technologies. According to the UNWTO (United Nations World Tourism Organization) (https://www.e-unwto.org/doi/pdf/10.18111/9789284421152) around 1.5 billion international tourist arrivals were recorded in 2019 worldwide. The number of international travels is expected to increase by 3.3% per year between 2010 and 2030. The IT industry has begun to interact with all areas of the economy including tourism over time. The fusion of information technologies and tourism has created the phenomenon of smart tourism [1]. It is typical for smart tourism to collect and analyze data extracted from different sources in combination with the use of advanced information technologies to transform travel experiences [2] to make it more enriched, efficient and sustainable [3]. The different smart tourism services (any service that can be used by the tourist to automate tourism-based tasks based on artificial intelligence technologies), such as recommendation services, attraction itinerary construction services, improve the travel experience [4].
Tourist behaviour analysis is a popular direction of scientific research. According to Reference [5] the three large groups of people can benefit from the results of analysis: tourists themselves, public sector managers and businessmen. Tourists can use behaviour analysis for personal satisfaction and growth indirectly by using enhanced tourism services. Public sector managers can manage impacts and generate community benefits and businessmen can improve marketing, sales and management by using tourist behaviour analysis.
More and more travelers use smartphones on their trips and that has a huge impact on the way tourists construct their attraction visiting plans [6]. The amount of user generated content (digital content which produced and shared by tourists in the online world) is increasing from year to year. Scientists use Big Data methods and techniques [7] to handle a large amount of open information [8,9,10]. Different sources, such as user generated content (photo/videos/attractions reviews), social networks and different sensors from smart gadgets, can be used as the basis for tourist behaviour prediction models. These models can be used for improving smart tourism services.
This paper presents a tourist behaviour analysis system, which defines the whole process of tourist behaviour analysis: data sources and tourist behaviour component identification; a way of storing and presenting heterogeneous data and behaviour analysis instruments. Within the system, the tourist T can be described as a person who visits a certain set of POIs (point of interest—, where represents a POI) in the region. Tourist behaviour can be described by the following parameters:
where —POI visiting plan; —POI preferences; —tourist route characteristics; tracked by sensors , where —tourist device sensor; —tourist generated content. The authors propose the digital pattern of life concept which represents the connection between tourist and different aspects of the tourist in smart services. The usage of the digital pattern of life simplifies the tourist behaviour model construction by providing a unified interface for data retrieval. As an example, the authors describe the three case studies of behaviour analysis based on the data taken from the digital pattern of life. Artificial neural networks [11] (ANN) were used for model construction. The ANNs can be described as self-adaptive data-driven methods which can learn from examples and capture unknown or hard described functional relationships [12]. The ANN has been actively used in the Big Data analytical process in recent years [13]. Based on these facts, the use of artificial neural networks as the basis of behaviour analysis models is satisfied.
The authors have developed a tourist support system [14], which can generate a tourist attraction itinerary based on the tourist preferences and context. One of the issues with the developed system is the inability to take into the account the previous states of the region and tourists; only current data is used to build a tourist attraction route. The usage of the proposed behaviour analysis system is one of the possible solutions for the mentioned issue, because the constructed models can utilize the previous states of the tourist system and improve the quality of the tourism services, which can be useful for the smart tourism services developers.
The developed tourist behaviour analysis system simplifies the process of defining and constructing the behaviour models. The digital pattern of life provides a snapshot of the tourist states at a certain point in time with detailing at the level of the presented concepts. Each state contains up-to-date information about the tourist, his plans and routes, situations in the region and attractions. The snapshot stores the contextual information of the tourist and region, which makes it possible for researchers to extract additional hidden dependencies in tourist behavior.
The rest of the paper is structured as follows: the authors in Section 2 describe the current state of the research field and show similarities and issues of the proposed tourist analysis systems and approaches; Section 3 presents the concept of a developed tourist behaviour analysis system with the digital pattern of life usage; Section 4 presents information about tourist behaviour analysis case studies such as classification, clustering and time series prediction with artificial neural networks usage; Section 5 discusses the obtained results and in Section 6, the work is concluded and future work is explained.
2. Related Work
An exploration of the tourist behaviour analysis systems was made in 19 articles over the past 5 years. Most attention was paid to articles that described (1) the existing tourist behaviour analysis frameworks and systems; (2) methods of analysis and approaches that can be used in the system of tourists’ behaviour.
The authors of Reference [15] propose a Big Data analytic method for destination management organization’s decision support. The method analyses unstructured social data for supporting strategic decision-making in tourism. The method includes the following techniques: text processing, geographical data clustering, visual content processing and time series modelling. The P-DBSCAN algorithm was used for clustering purposes. The time series decomposition technique was used for seasonal patterns retrieving.
In Reference [16], the authors show a framework of forecasting tourist arrivals to a destination. Google Trends is used as the main source for a multivariate time series data analysis. The selected data were filtrated by using an information processing approach and the theory of planned behaviour. The ARIMAX, VAR and ADRL models are used to evaluate potential tourist behaviour and predict their arrival patterns in the end.
The authors of Reference [17] use the neural network autoregressive algorithm for the monthly tourism demand forecasting of ten European countries. The denoising algorithms are used for prediction accuracy improvement. The proposed algorithm is compared with autoregressive integrated moving average and exponential smoothing models and results show that the proposed algorithm is more accurate.
Reference [18] presents a tourist travel analysing framework based on the location-based data from social media. Data from 67,000 Twitter users in Florida was gathered. The authors have used the following clustering methods: K-Means, DBSCAN and Mean-Shift and several classification approaches for the data analysing.
In Reference [19] the authors describe the process of tourist behaviour mining by using visual content analysis. Around 35,000 tourists’ photos from Flickr in Beijing were identified into 103 scenes by computer deep learning technology. The ResNet-101 Deep learning model was used for the photo analysis. Tourists’ cognitive maps with different perceptual themes were visualized according to the geographical information from photos.
The authors of Reference [20] use travel diaries as a source of popular tourist route extraction. The Foursquare venue check-in data and Twitter data were used for travel diary formation. The high-utility pattern mining technique was applied for the effective discovery of highly valuable travel patterns.
In Reference [21], the authors analysed a sequential pattern in tourist behaviour by using combination of Convolutional Neural Network (CNN) and Long Short-Term Memory (LSTM) neural networks. The proposed artificial neural network (ANN) predicts the possible location visiting. The tourist opinion and reviews were used as main source of data.
The the authors of Reference [22] present a method for tourist arrival and tourist demand forecasting. The method includes a novel paired neural network model. The tourist arrival data are decomposed by two low-pass filters into a long-term trend and short-term seasonal components. Two separated three-layer autoregressive neural networks were then estimated by the trend and seasonal component data respectively: paired Neural Network with HP filter, paired Neural network with Wavelet Transformation, and Neural network with Moving Average.
The authors of Reference [23] work with self-organizing maps (SOM) for clustering the popular POI visitors profiles and 2500 tourist interviews were used as the main data source and four main tourist profiles types were identified.
In Reference [24], the authors describe a framework that capitalizes on the large-scale opportunistic mobile sensing approach for tourist behaviour analysis. The tourist smartphones’ GPS data, number of trips and transport type tracking are treated as the basis for the behaviour construction. The DBSCAN method is used for tourist stops clustering and random forest classification is used for determining tourist stop type.
The authors of Reference [25] use the SOM approach to clustering in the recommendation systems. The users’ ratings clustering is achieved by using this model. The SOM model is trained on TripAdvisor datasets.
The authors of Reference [26] describe tourist destinations and web-queries relations. The auto-regression vector model was used to determine weather, temperatures, weekends and public holidays impact on the tourist behaviour.
In Reference [27], the authors analyse sentiment from tourist POI reviews. The analysis is based on a bidirectional recurrent neural network model. The model consists of a topic model (lda2vec) and an attention mechanism. The lda2vec is used for discovering the main topics of the review for the word vector. The attention mechanism is supposed to determine different weights of the words in the text.
The authors of Reference [28] describe the convolutional neural network (CNN) model, which labels a food by photo for tourists. CNN was chosen for its reliable and fast process of classification of complex and detailed objects. Indonesian food photos were used as the main source of the data.
In Reference [29], the authors use an LSTM neural model to predict tourism flow. They stated that LSTM-based models describe the stochastic and non-linear nature of tourism flow more accurately than the Auto Regressive Integrated Moving Average models.
The authors of Reference [30] present the monthly tourist arrival forecasting framework. The authors introduce the deep network architecture with historical time-series tourism demand data. The attention mechanism support was added to the LSTM model. The attention mechanism makes the presented model more interpretive.
In Reference [31] the authors describe a neural network’s composition for time series forecasting. Back-propagation neural network, dynamic architecture for artificial neural network, Elman artificial neural network and echo state network are selected as component forecasting models by the authors. An input-hidden selection heuristic is designed to determine the input-hidden neuron combination for each component neural network. An in-sample training–validation pair-based neural network weighting mechanism is studied to generate the associated combination weights.
The authors of Reference [32] aim to integrate multiple data sources to analyze tourists’ spatial-temporal behaviour patterns on micro scale distances. Information about tourists’ temporal-spatial behaviour was gathered using handheld GPS tracking devices, and questionnaires were distributed to assess tourists’ socio-psychological characteristics. Three spatial-temporal behaviour clusters were identified via density center clustering, consisting of four factors: path length, tour time, coverage area, and oval circumference.
The authors of Reference [33] use the LSTM networks that can incorporate multivariate time series data including historical tourism volume data, search engine data and weather data. The model is proposed for forecasting the daily tourism volume of tourist attractions. The research notes that search engine data and weather data have a huge influence on tourism volume forecasting.
The following common requirements and similarities were identified after the analysing the related work:
- Collecting a large amount of information about a tourist is typical for Big Data [15,16]. Tourist behaviour analysis systems collect data about certain visits to attractions, and ratings and reviews from social networks. It is recommended to use heterogeneous information from various sources to ensure an accurate representation of the tourist. A large amount of different information will improve the predictive ability of models based on neural networks, which require a large amount of input data for effective training.
- Open data usage as a source of tourist information. References [18,19,20,21] use social networks such as Twitter, Foursquare, Facebook, and so forth. The authors of References [15,24,25] analyze data from open sources, provided by the governments of various countries. The usage of various open sources makes it possible to more accurately construct models of tourist behaviour, which improves the predictive ability of the system for analyzing tourist behaviour as a whole.
- Heterogeneous tourist information usage to build behaviour analysis models. Researchers use text data [15,23,26,27] (user reviews, attractions ratings, attraction requests and keywords in search engines); tourist photographs [19,28] for the analysis of meta-information and the image itself; data on movements and attraction visiting [17,18,21,22,24,29,30,31]. Using heterogeneous information will allow the extraction of different behavioural components, which contributes to an increase in the number of possible behavioural patterns.
- Using behaviour analysis methods such as classification, clustering and prediction of temporal events. The authors of References [15,18,19,27,28] use the classification, References [18,23,24,25,32] work with clustering and the authors of References [16,17,21,26,29] use the prediction of temporal events to predict the behaviour tourists.
- Neural networks usage to analyze and predict the behaviour of tourists. The authors of References [19,28] use convolutional neural networks for image analysis, References [22,29,30,31,33] work with LSTM networks that allow memorizing previous states, Reference [27] describes recurrent networks for analyzing tourist descriptions of attractions, self-organizing maps [23,25] provide information clustering, the authors of References [16,21,30,31] use combinations of neural networks to improve prediction results. Neural networks, as a rule, work more accurately than similar models, but they require a large amount of data for correct training and revealing hidden dependencies in the provided data, and for each task the volume depends on the type of the task itself (prediction of time events requires more data than classification ) and the number of certain input parameters (the more parameters, the more data is needed to identify dependencies between them).
Among the considered solutions, the following main problems were identified that should be taken into the account when developing a reference model of a tourist behaviour analysis system:
- Narrow specialization of the presented systems for analyzing the behaviour of tourists. The reviewed articles describe the solution of one problem using one data source that leads to the fact that it is impossible to adapt or extend the proposed systems. The considered systems do not consider the issues of storing the received data, do not categorize data and data analysis tools.
- Insufficient use of various device sensors used by tourists when traveling. The extracted data will help to more accurately track visits to attractions, modes of travel, intersections with other tourists, etc. Some of the reviewed articles work with GPS devices, but did not consider in their work the values of the sensors throughout the entire route—only visiting certain attractions. It is recommended to store data in anonymous form to comply with the legislation of various countries.
- Insufficient use of contextual information of both the tourist and the surrounding region in the analysis of tourist behaviour. Due to the narrow specialization of the considered systems, the considered systems use context parameters in a limited way. A wide variety of contextual parameters will allow you to add additional dependencies between the data and reveal hidden dependencies, which can improve the overall prediction of tourist behaviour.
3. Tourist Behaviour Analysis System, Based on Digital Pattern of Life Concept
The developed reference model of the tourist behaviour analysis system is presented on the Figure 1. All tourist data from sensors, social networks, smart city [34] services and polls are supposed to be stored in a data lake storage. This approach allows to store a large amount of the information without changing the internal data structure. A large amount of data sources increases chances to find internal dependencies in the behaviour of tourists. Storing data without changing the internal structure is well suited for machine learning tools, because researchers need to select and format data separately for each task. If the data is stored in a predetermined structure (as recommended when using the data warehouse approach), then the retrieved data will need to be changed again, which can potentially slow down the analysis of tourist behavior.
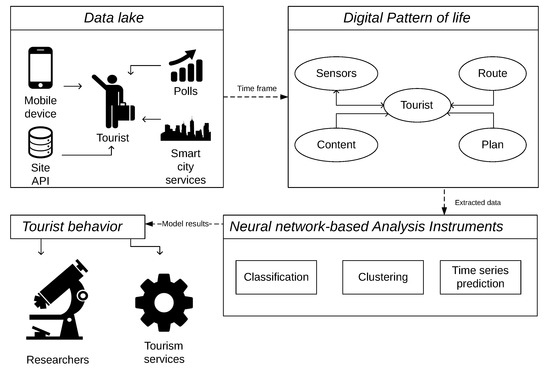
Figure 1.
Tourist behaviour analysis reference model.
The extracted information based on the tourist digital pattern of life can be processed for analyzing tourist behaviour. Travel data and activities can be classified, grouped and predicted by machine learning models. The results obtained can be used to improve the work of existing tourist support services (recommendation systems, services for building a tourist route, etc.). For behaviour analysis three main instruments for analyzing tourist behaviour were chosen: classification, clustering and time series prediction. The presented instruments are most often used in the research of tourist behaviour based on the analysis of scientific works. For this system, the neural network based approach is well suited due to capability of storing the big amount of data from different resources.
The enhanced digital pattern of life ontological model from [35] is shown in the Figure 2. Circles represent ontology classes, rectangles represent data properties, and arrows with labels between classes show relationships between classes as predicates. The main class of the proposed ontology is Tourist, which represents a traveling person. The tourist is characterized by his behaviour—behaviour. Tourist behaviour can be analyzed using Analysis Instruments. These tools use information from Route, Sensors, attraction visiting plan (Plan) and Tourist Context (Context) and can be divided into three methods: Classification, Clustering and Prediction. Travel Preferences affect travel planning and travel itinerary style.
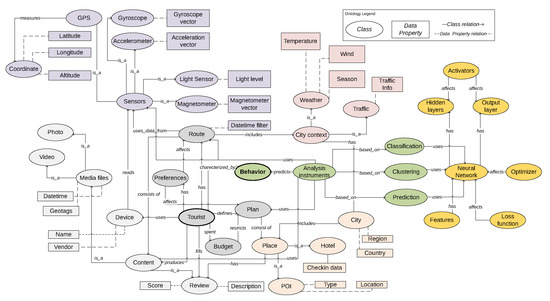
Figure 2.
Enhanced digital pattern of life ontological representation with neural networks usage.
During the trip a tourist uses a mobile device with different characteristics that is designated in the ontology as Device. The device can contain sensors (Sensors class) that can track changes in a person’s characteristics over time. The tourist can be identified by the spatial coordinates from the GPS navigator (class GPS and child class Coordinate); using a gyroscope (Gyroscope) allows you to track the turns of people; accelerometer (Accelerometer sensor) can determine the speed and acceleration of a person and predict the type of travel (on foot or using any type of transport); Light sensor can indirectly determine whether the tourist is on the street or indoors; magnetometer (Magnetometer) allows you to determine the direction of sight of the tourist.
During the trip the tourist moves along a specific route (Route), which can be built on the basis of sensor data. The route includes information about the tourist sequential movement between places, tourist stops and other characteristics. The route passes in a specific city (City) that has contextual information (City context). The context is divided into information about the weather (Weather—data about the current temperature, season and wind) and traffic situation (Traffic). Each tourist route contains information about the context of the city and provides some information about the tourist context at a given time.
The tourist sets a travel plan (Plan), which includes a set of places (Place) to visit. Places located in the city can be divided into two groups: POI—a popular tourist destination such as museums, theaters, historical sites, and so forth, and hotels (Hotels) where a tourist can rest after visiting attractions. During the trip the tourist spends money from his monetary budget (Budget) and it is also reflected in the trip plan. While traveling a tourist can create media files, for example, a photo (Photo) or video (Video), with meta tags. In addition, the tourist can review points of interest or hotels with ratings and text descriptions. All of these trip artifacts can be described as Content and can be analyzed and used to construct behaviour models.
Tourist behaviour analysis methods [36,37,38,39] use models based on the work of neural networks (Neural Network class). The neural network topology is defined by three classes: the input layer (Features), a set of hidden layers (Hidden layers) and the resulting layer (Output layer). Each model uses a specific set of cs the first layer of neurons. Ontology-defined tourist-related class instances can be used as input parameters of a neural network. Each layer is influenced by the activation functions that determine the output value of the neuron depending on the result of the weighted sum of the inputs and the threshold value. The neural model is also defined by the Optimizer and Loss functions, which are characteristics of the neural network.
The presented reference model of the tourist behaviour analysis system and the digital pattern of life ontological model describe the heterogeneous data sources storage and formalization, as well as possible tools for the analysis of behaviour. The use of the ontological approach allows the use of contextual information about both the tourist and the surrounding region. Using a tourist digital pattern of life allows storing information about a tourist from a variety of sources with tracking of temporary changes, which allows use of the proposed concept in tools for analyzing tourist behaviour.
4. Tourist Behaviour Analysis Case Studies
The developed models for the analysis of tourist behaviour are based on the neural networks which are able to search for unknown patterns in the presented data, which increases the level of analysis of tourist behaviour in general. To achieve more accurate results, it is necessary to form training samples consisting of a large amount of data. This condition is achieved through the use of the information from the data lake and its transformation based on the digital pattern of life. Another advantage of using neural networks is the speed of the trained model, which allows them to be used in conjunction with existing travel services, such as recommendation services or services for building a tourist route.
A tourist car-based trip dataset (collection of tourist movements and activities during car trips) was extracted based on the data from the data lake [40]. The dataset includes information on 4000 tourist road trips, collected from 2016 to 2019, in the city of Saint Petersburg, Russia. Each dataset entry represents a car-based tourist trip with the developed tourist-assist smartphone application. The application shows information about POI and send smartphone sensor data each 500 milliseconds of trip into the data lake. In the end of the trip, the tourist-assist application saves the tourist satisfaction rating.
The example of collected data from dataset is presented in the Table 1. First column describes the possible feature, which were collected from the tourist route, columns 2–4 represent tourist routes. The POI geo-data and experts ratings were gathered from the OpenStreetMap and Google Knowledge Graph. Weather information was taken from OpenWeatherMap service. Information about tourist POI preferences, budget spending was gathered by using the tourist-assist application.

Table 1.
Dataset route example.
In the following subsections the authors will present models for three different case studies commonly encountered in the tourist behaviour analysis: classification, clustering, and time series prediction. The Tensorflow and Keras frameworks were used during the ANN-based models construction.
4.1. Classification
This case study describes a model that is able to classify road trips made in a selected region based on traveler ratings. In this case study tourists evaluate their trips on a five-point scale, where 0—they did not like the trip at all, 5—they liked the trip completely. The result of the model can be used to improve the performance of recommendation services or travel itinerary services.
To train the classifying model a sample of tourist trips were prepared with the selection of input parameters (Table 2), which take into account the data of the route itself, information about the tourist, as well as contextual information about the tourist region.
Table 2.
List of the classification neural network input layer features.
The input parameters presented in Table 2 were broken down into several categories: route characteristics, driving style characteristics, contextual parameters and parameters related to critical events and tourist attractions preferences:
- The characteristics of the route are described by parameters 1, 2, 3 and 4 and contain basic information about the tourist route—distance, duration, total number of visited attractions and their overall rating;
- The driving style of the car is determined by parameters 5–8 and reflects the behaviour of the car when driving along the route;
- Contextual parameters describe the situation in the tourist region and are determined by 9–10 features. Traffic is estimated in the range , where score 0 represents situation when o traffic jams were occurred during the route and score 10 describes complete route obstruction. The weather situation is described from a categorized bucket with the following entries: “sunny”, “cloudy”, “windy”, “rainy”, “snowy”. The selected contextual parameters can directly affect the perception of a tourist trip, for example, in rainy weather, visiting open spaces will be difficult; in traffic jams, it can be difficult to visit the planned attraction on time, etc;
- The section of critical events () describes the number of dangerous events that happened to the driver during a tourist trip that can negatively affect the tourist. During the trip, the following situations are monitored: distraction (the driver does not look at the road), drowsiness event (the driver falls asleep), eating event (the driver eats while driving), mobile phone usage (the driver uses the phone while driving) and smoking (the driver smokes while driving);
- The tourist POI preferences are represented using parameters and show which types of attractions are more attractive to a particular tourist. When analyzing the data, the following types of attractions were taken into account: “theater”, “ship”, “arch”, “monument”, “place_of_worship”, “museum”, “memorial”, “park”, “ruins”, “castle”, “tomb”, “palace”, “bridge”, “attraction” (POI which are not included in a certain category).
The neural network consists of one input layer that accepts input parameters, a data normalization layer [41], three hidden layers with 128 neurons on each of the layers, and an output layer with 5 output neurons, which store the result of the classification problem (each neurons is responsible for the final tourist score). The inner hidden layers use the ReLU activation function and the output layer uses the softmax function [42]. The neural network was trained on 500 epochs, with a training sample dimension of 1159 instances, internal model validation was performed on 290 examples, and tested on 363 instances of the dataset. The test sample stored information about automobile routes with a rating in the range , assigned by the tourists themselves. The result of training the model is shown in Figure 3. The experiments showed that the model learned to classify trips at 150 epochs. As a result, the forecast accuracy for the final sample is about 79.7%, which is an acceptable result for the classification problem.
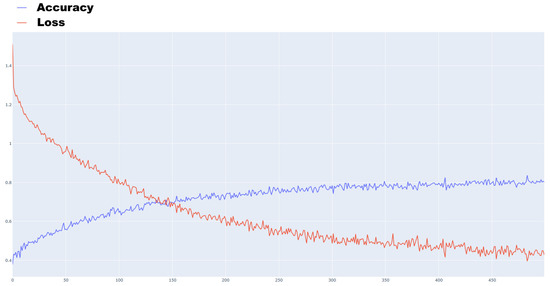
Figure 3.
Classification neural network training results.
4.2. Clustering
The case study presents the tourist categorization based on their trips. The chosen model uses a neural network based on the concept of self-organizing maps [43], which is capable of clustering tourists without using a teacher during training. The neural network transforms an array of input parameters into a simplified two-dimensional map. The closer the sets are to each other on the map, the more “similar” they are to each other. Self-organizing maps preserve the relationship and structure of the input dataset and can reveal correlations within the data that are difficult to identify with manual data analysis. During the training of models, the process of back propagation of errors doesn’t occur, as well as the activation functions are not used due to a different internal structure of the neural network than in the solutions of deep neural networks.
The input parameters for the clustering neural network are presented in the Table 3. Parameters 1–4 describe the general characteristics of the routes that a tourist usually follows in their trips. Parameters 5–6 describe the contextual parameters of routes that were calculated indirectly. Parameters 7–9 refer to the description of the tourist, parameters 10–25 describe the tourist’s preferences for certain attractions.
Table 3.
List of the clustering neural network input layer features.
Each tourist is characterized on the basis of preferred attractions, travel spending, characteristics of the routes themselves, ratings and reviews of attractions. The obtained clustering results can be used to improve the performance of recommendation services, as an additional criterion for evaluating users. In addition, it is possible to provide recommendations for not yet visited attractions within the formed groups of tourists based on the clustering results. The use of contextual parameters of routes allows to improve the accuracy of clustering tourists.
Around 100 people were selected based on the data set of automobile tourist trips and the input parameters for neural network training were calculated, according to the Table 3. After the data analysing, it was decided to divide the tourists into the 5 cluster groups. The spread of the function that estimates the “neighborhood” of neurons is set to 0.5, the learning rate is also set to 0.5, the Gaussian function was used as the method for determining the neighborhood, and the Euclidean distance measuring function was taken for the distance calculation. The model was trained over 500 epochs. The results of clustering tourists are presented in Figure 4—the dots represents the tourists, the colors show the clusters calculated on the basis of the data presented, the black rhombuses represent the centroids of the clusters. For tourists in the same cluster, it is possible to recommend attractions that have not yet been visited, which are typical for tourists visiting this cluster.
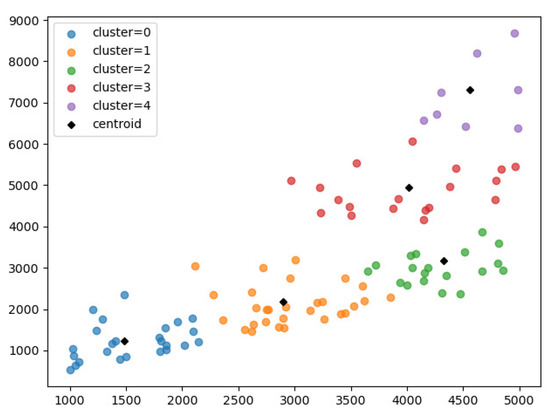
Figure 4.
Tourist clustering results.
4.3. Time Series Prediction
This case study describes a model that predicts events that occur at a specific time interval. One possible example in which this model can be used to predict regional budget replenishment based on the tourist spending, which can be extracted using the digital pattern of life. Another possible example is predicting the seasonal visit of a particular attraction.
As a solution, it was decided to use a bidirectional long short term memory network [44,45]. Long short-term memory neural networks are a sub type of recurrent neural networks that can predict the next values in sequences. However, recurrent neural networks may have a problem in the form of the impossibility of deep learning with large volumes of the initial sequence—the neural network “forgets” the previous states. Neural networks with long short-term memory are capable of learning long-term addictions due to a different arrangement of internal cells for storing data. A LSTM cell includes 4 layers—a forgetting filter (determines what information can not be considered in future layers), an input filter layer (decides what information will be remembered in the cell state), a state cell layer (stores calculated data) and an output layer (layer that passes the converted computed data to the next cell). Conventional LSTM networks work only with the previous internal state, bidirectional neural networks take into account both previous and future states in their work, thereby improving the overall predictive ability.
The architecture of the model predicting temporal events consists of the following sequential layers: a bidirectional layer consisting of 256 LSTM cells; dropout layer that excludes 20% of random neurons at different learning epochs (necessary to prevent overfitting on the training sample) and the final output layer, consisting of one neuron, which will store the prediction result. The function of the root mean square error is used as a loss function, and the adaptive moment estimation method is used as an optimization function. To train the model data on site visits from 2016 to 2020 was extracted, broken down by day. In total 1703 values were selected, of which the test sample was 1313 values, the validation was carried out on 170 examples, the final testing included 220 values. Before training the model, the value of the number of visits was normalized. The training was carried out for 200 eras. The result of model validation is shown in Figure 5. Blue color shows real values, red—model prediction. From this result it can be concluded that the model follows trends in changes in data, often following the data spikes.
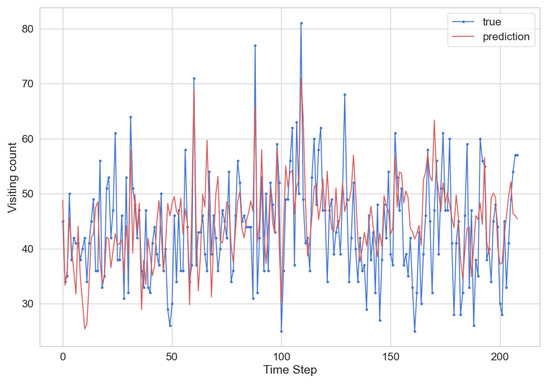
Figure 5.
Attraction visiting prediction results.
5. Discussion
During the design and implementation of ANN-based tourist behaviour analysis models a few issues have been found. First issue is related to the feature input list for the classification and clustering mode. Some features have ordinal and nominal measuring scale values and can decrease the model accuracy. The TensorFlow and Keras frameworks can work the ordinal and nominal values by using one-hot encoding technique, but it will be better to modify such values into strong scale. The another issue is that the time series prediction model can use additional contextual data series values for the improvement overall accuracy of the model.
The proposed tourist behaviour analysis system has the the following advantages in comparison with the reviewed systems and frameworks:
- The developed digital pattern of life concept contains all necessary for behaviour analysis concepts: tourist, region, POI, route with sensor data and behaviour analysis tools, etc. The proposed system can be used without reference to a specific geographic region. The ontological representation of the digital pattern of life contains all necessary for behaviour and tourist representation concepts.
- The proposed system can be used as a general solution for the tourist behaviour analysis. The presented ontology can be treated as upper-level ontology, which allows to add additional concepts to modify the approach to reflect the necessary changes in the subject area of the proposed approach if it needed. As example, the researcher can add the class ‘Gastronomy’ as subclass to ‘Place’ and defines the additional data properties, which represent additional tourist behaviour components.
- A large amount of different data-source can provide crucial for behaviour analysing data. The data lake allows to store data "as-is", which can simplify the the behaviour analysing system due to the fact that researchers can change the extracted data in a convenient form. The heterogeneous information (sensors data, textual data from POI reviews, photo/video, etc.) can be used in different behaviour analysis models.
- The digital pattern of life concept involves the accumulation of tourist data over time and provides a snapshot of the tourist states at a certain point in time with detailing at the level of the presented concepts on the ontological level. This approach allows researches to find behaviour pattern, which can be tracked on the specific time ranges.
- The ontological approach is suitable for describing contextual information of tourist and region. Researches can improve ANN behaviour analysis models accuracy by extracting contextual information from the data lake. Additional contextual information with conjunction with sensor-based data makes possible for researchers to extract additional hidden dependencies in the tourist behavior.
During the process of the tourist behaviour system based on the digital pattern of life concept design the following limitations can be addressed. First limitation refers toe the situation that in the real world there is a possibility that the data source cannot provide all described in the digital pattern of life information. Some smartphones don’t have some required sensors, which can be used for the tourist route reconstruction. Some tourists will not want to fill out surveys directly or will not want to participate in surveys indirectly through tourist support applications. The second limitation is related to the cold start problem [46]. On the initial steps of system functioning there is a chance that behaviour analysis can be incomplete, because the data lake don’t contain the required amount of information for correct analysis. The third limitation comes to the difficulties in the tourist behaviour analyzing in real time. The design of the system does not prohibit this kind of analysis, however, not all tourists will constantly use specialized travel applications that will provide sensors data.
6. Conclusions
This paper presents the related work analysis in scope of tourist behaviour analysis, presents the tourist behaviour analysis system based on the usage of the digital pattern on life concept and shows the three case studies of system usage based on ANN models. The analysis of related work shows, that reviewed systems have narrow specialization of the presented systems, often work with one data sources and have insufficient usage of device sensors data and contextual information about tourist and region. The proposed tourist behaviour system can work with the different heterogeneous data sources by storing all information in the data lake storage. This approach simplifies the process of behaviour data extraction and analyse. The digital pattern of life concept provides a snapshot of the tourist states at a certain point in time with detailing at the level of the presented concepts on the ontological level. The developed system and behaviour models can be used as general solution for tourist behaviour analysing in any geographic region, however, due to usage of ontological approach, it is possible to extend the list of used concepts to reflect the specifics of a particular region. The developed ANN-based model can be used as pre-validation models for the tourist route construction services and recommendation services if they doesn’t support time-based state analysis. The gathered results can be interesting for the tourist behaviour researches, smart tourism services developers and tourism industry stakeholders. In the future the authors plan to introduce more tourist behaviour analysis case studies and add more concepts for the digital pattern of life.
Author Contributions
Formal analysis: A.K.; methodology: S.M. and A.K.; writing—original draft: S.M. All authors have read and agreed to the published version of the manuscript.
Funding
The presented results are part of the research carried out within the project funded by RFBR, project number 19-37-90091. Related work section has been partly supported by RFBR, project number 20-07-00560. Case Study has been supported by the Russian State Research #0073-2019-0005.
Conflicts of Interest
The authors declare no conflict of interest.
Abbreviations
The following abbreviations are used in this manuscript:
| POI | Point of interest |
| ANN | Artificial Neural Network |
| CNN | Convolutional Neural Network |
| LSTM | Long short-term memory neural networks |
| SOM | Self-organizing maps |
| UNWTO | United Nations World Tourism Organization |
References
- Kontogianni, A.; Alepis, E. Smart tourism: State of the art and literature review for the last six years. Array 2020, 6, 100020. [Google Scholar] [CrossRef]
- Wang, D.; Fesenmaier, D.R. Transforming the travel experience: The use of smartphones for travel. In Information and Communication Technologies in Tourism 2013; Springer: New York, NY, USA, 2013; pp. 58–69. [Google Scholar]
- Lee, P.; Hunter, W.; Chung, N. Smart Tourism City: Developments and Transformations. Sustainability 2020, 12, 3958. [Google Scholar] [CrossRef]
- Li, Y.; Hu, C.; Huang, C.; Duan, L. The concept of smart tourism in the context of tourism information services. Tour. Manag. 2017, 58, 293–300. [Google Scholar] [CrossRef]
- Pearce, P.L. Tourist behaviour: Themes and Conceptual Schemes; Channel View Publications: Bristol, UK, 2005. [Google Scholar]
- Jamal, S.; Habib, M.A. Smartphone and daily travel: How the use of smartphone applications affect travel decisions. Sustain. Cities Soc. 2020, 53, 101939. [Google Scholar] [CrossRef]
- De Mauro, A.; Greco, M.; Grimaldi, M. What is Big Data? A Consensual Definition and a Review of Key Research Topics. In Proceedings of the 4th International Conference on Integrated Information, Madrid, Spain, 5–8 September 2014. [Google Scholar] [CrossRef]
- Li, J.; Xu, L.; Tang, L.; Wang, S.; Li, L. Big data in tourism research: A literature review. Tour. Manag. 2018, 68, 301–323. [Google Scholar] [CrossRef]
- Li, X.; Law, R. Network analysis of big data research in tourism. Tour. Manag. Perspect. 2020, 33, 100608. [Google Scholar] [CrossRef]
- Vecchio, P.D.; Mele, G.; Ndou, V.; Secundo, G. Creating value from Social Big Data: Implications for Smart Tourism Destinations. Inf. Process. Manag. 2018, 54, 847–860. [Google Scholar] [CrossRef]
- Basheer, I.; Hajmeer, M. Artificial Neural Networks: Fundamentals, Computing, Design, and Application. J. Microbiol. Methods 2001, 43, 3–31. [Google Scholar] [CrossRef]
- Zhang, G.; Patuwo, B.E.; Hu, M.Y. Forecasting with artificial neural networks:: The state of the art. Int. J. Forecast. 1998, 14, 35–62. [Google Scholar] [CrossRef]
- Najafabadi, M.M.; Villanustre, F.; Khoshgoftaar, T.M.; Seliya, N.; Wald, R.; Muharemagic, E. Deep learning applications and challenges in big data analytics. J. Big Data 2015, 2, 1. [Google Scholar] [CrossRef]
- Kashevnik, A.; Mikhailov, S.; Papadakis, H.; Fragopoulou, P. Context-Driven Tour Planning Service: An Approach Based on Synthetic Coordinates Recommendation. In Proceedings of the 2019 24th Conference of Open Innovations Association (FRUCT), Moscow, Russia, 8–12 April 2019; pp. 140–147. [Google Scholar]
- Miah, S.J.; Vu, H.Q.; Gammack, J.; McGrath, M. A Big Data Analytics Method for Tourist Behaviour Analysis. Inf. Manag. 2017, 54, 771–785. [Google Scholar] [CrossRef]
- Padhi, S.S.; Pati, R.K. Quantifying potential tourist behavior in choice of destination using Google Trends. Tour. Manag. Perspect. 2017, 24, 34–47. [Google Scholar] [CrossRef]
- Silva, E.S.; Hassani, H.; Heravi, S.; Huang, X. Forecasting tourism demand with denoised neural networks. Ann. Tour. Res. 2019, 74, 134–154. [Google Scholar] [CrossRef]
- Hasnat, M.M.; Hasan, S. Identifying tourists and analyzing spatial patterns of their destinations from location-based social media data. Transp. Res. Part C Emerg. Technol. 2018, 96, 38–54. [Google Scholar] [CrossRef]
- Zhang, K.; Chen, Y.; Li, C. Discovering the tourists’ behaviors and perceptions in a tourism destination by analyzing photos’ visual content with a computer deep learning model: The case of Beijing. Tour. Manag. 2019, 75, 595–608. [Google Scholar] [CrossRef]
- Vu, H.Q.; Li, G.; Law, R. Discovering highly profitable travel patterns by high-utility pattern mining. Tour. Manag. 2020, 77, 104008. [Google Scholar] [CrossRef]
- Kanjanasupawan, J.; Chen, Y.; Thaipisutikul, T.; Shih, T.K.; Srivihok, A. Prediction of Tourist Behaviour: Tourist Visiting Places by Adapting Convolutional Long Short-Term Deep Learning. In Proceedings of the 2019 International Conference on System Science and Engineering (ICSSE), Dong Hoi, Vietnam, 20–21 July 2019; pp. 12–17. [Google Scholar]
- Yao, Y.; Cao, Y.; Ding, X.; Zhai, J.; Liu, J.; Luo, Y.; Ma, S.; Zou, K. A paired neural network model for tourist arrival forecasting. Expert Syst. Appl. 2018, 114, 588–614. [Google Scholar] [CrossRef]
- Taczanowska, K.; González, L.; García-Massó, X.; Zięba, A.; Brandenburg, C.; Muhar, A.; Pellicer Chenoll, M.; Toca-Herrera, J.L. Nature-based Tourism or Mass Tourism in Nature? Segmentation of Mountain Protected Area Visitors Using Self-Organizing Maps (SOM). Sustainability 2019, 11, 1314. [Google Scholar] [CrossRef]
- Phithakkitnukoon, S.; Horanont, T.; Witayangkurn, A.; Siri, R.; Sekimoto, Y.; Shibasaki, R. Understanding tourist behavior using large-scale mobile sensing approach: A case study of mobile phone users in Japan. Pervasive Mob. Comput. 2015, 18, 18–39. [Google Scholar] [CrossRef]
- Nilashi, M.; Bagherifard, K.; Rahmani, M.; Rafe, V. A recommender system for tourism industry using cluster ensemble and prediction machine learning techniques. Comput. Ind. Eng. 2017, 109, 357–368. [Google Scholar] [CrossRef]
- Liu, Y.Y.; Tseng, F.M.; Tseng, Y.H. Big Data analytics for forecasting tourism destination arrivals with the applied Vector Autoregression model. Technol. Forecast. Soc. Chang. 2018, 130, 123–134. [Google Scholar] [CrossRef]
- Li, Q.; Li, S.; Hu, J.; Zhang, S.; Hu, J. Tourism Review Sentiment Classification Using a Bidirectional Recurrent Neural Network with an Attention Mechanism and Topic-Enriched Word Vectors. Sustainability 2018, 10, 3313. [Google Scholar] [CrossRef]
- Prasetya, R.P.; Bachtiar, F.A. Indonesian food items labeling for tourism information using Convolution Neural Network. In Proceedings of the 2017 International Conference on Sustainable Information Engineering and Technology (SIET), Malang, Indonesia, 24–25 November 2017; pp. 327–331. [Google Scholar]
- Li, Y.; Cao, H. Prediction for Tourism Flow based on LSTM Neural Network. Procedia Comput. Sci. 2018, 129, 277–283. [Google Scholar] [CrossRef]
- Law, R.; Li, G.; Fong, D.K.C.; Han, X. Tourism demand forecasting: A deep learning approach. Ann. Tour. Res. 2019, 75, 410–423. [Google Scholar] [CrossRef]
- Wang, L.; Wang, Z.; Qu, H.; Liu, S. Optimal Forecast Combination Based on Neural Networks for Time Series Forecasting. Appl. Soft Comput. 2018, 66, 1–17. [Google Scholar] [CrossRef]
- Huang, X.; Li, M.; Zhang, J.; Zhang, L.; Zhang, H.; Yan, S. Tourists’ spatial-temporal behavior patterns in theme parks: A case study of Ocean Park Hong Kong. J. Destin. Mark. Manag. 2020, 15, 100411. [Google Scholar] [CrossRef]
- Bi, J.W.; Liu, Y.; Li, H. Daily tourism volume forecasting for tourist attractions. Ann. Tour. Res. 2020, 83, 102923. [Google Scholar] [CrossRef]
- Eremia, M.; Toma, L.; Sanduleac, M. The Smart City Concept in the 21st Century. Procedia Eng. 2017, 181, 12–19. [Google Scholar] [CrossRef]
- Mikhailov, S.; Kashevnik, A.; Smirnov, A. Tourist Behaviour Analysis Based on Digital Pattern of Life. In Proceedings of the 2020 7th International Conference on Control, Decision and Information Technologies (CoDIT), Parague, Czech Republic, 29 June–2 July 2020. In Press. [Google Scholar]
- Duda, R.O.; Hart, P.E.; Stork, D.G. Pattern Classification; John Wiley & Sons: Hoboken, NJ, USA, 2012. [Google Scholar]
- Jain, A.K.; Murty, M.N.; Flynn, P.J. Data clustering: A review. ACM Comput. Surv. (CSUR) 1999, 31, 264–323. [Google Scholar] [CrossRef]
- Connor, J.T.; Martin, R.D.; Atlas, L.E. Recurrent neural networks and robust time series prediction. IEEE Trans. Neural Netw. 1994, 5, 240–254. [Google Scholar] [CrossRef]
- Draper, N.R.; Smith, H. Applied Regression Analysis; John Wiley & Sons: Hoboken, NJ, USA, 1998; Volume 326. [Google Scholar]
- Kashevnik, A.; Lashkov, I.; Ponomarev, A.; Teslya, N.; Gurtov, A. Cloud-Based Driver Monitoring System Using a Smartphone. IEEE Sens. J. 2020, 20, 6701–6715. [Google Scholar] [CrossRef]
- Sola, J.; Sevilla, J. Importance of input data normalization for the application of neural networks to complex industrial problems. IEEE Trans. Nucl. Sci. 1997, 44, 1464–1468. [Google Scholar] [CrossRef]
- Ramachandran, P.; Zoph, B.; Le, Q.V. Searching for activation functions. arXiv preprint 2017, arXiv:1710.05941. [Google Scholar]
- Kohonen, T. The self-organizing map. Proc. IEEE 1990, 78, 1464–1480. [Google Scholar] [CrossRef]
- Hochreiter, S.; Schmidhuber, J. Long short-term memory. Neural Comput. 1997, 9, 1735–1780. [Google Scholar] [CrossRef]
- Zhang, S.; Zheng, D.; Hu, X.; Yang, M. Bidirectional long short-term memory networks for relation classification. In Proceedings of the 29th Pacific Asia Conference on Language, Information and Computation, Shanghai, China, 30 October–1 November 2015; pp. 73–78. [Google Scholar]
- Lika, B.; Kolomvatsos, K.; Hadjiefthymiades, S. Facing the cold start problem in recommender systems. Expert Syst. Appl. 2014, 41, 2065–2073. [Google Scholar] [CrossRef]
© 2020 by the authors. Licensee MDPI, Basel, Switzerland. This article is an open access article distributed under the terms and conditions of the Creative Commons Attribution (CC BY) license (http://creativecommons.org/licenses/by/4.0/).