Abstract
Background/Objectives: This study reports the synthesis of TiO2 nanoparticles, their functionalization with folic acid (FA), and the subsequent loading with zinc phthalocyanine (ZnPc) to develop photosensitizers for photodynamic therapy (PDT) targeting glioma cells. Methods: TiO2, TiO2-FA, and TiO2-FA-ZnPc nanoparticles were synthesized via a sol–gel process involving the hydrolysis and condensation of titanium (IV) isopropoxide. FA and ZnPc were incorporated in vitro during the synthesis. The resulting materials were characterized by transmission and scanning electron microscopy (TEM and SEM), X-ray diffraction (XRD), Raman and UV–Vis spectroscopy, thermogravimetric analysis (TGA), and nitrogen adsorption–desorption measurements. Reactive oxygen species (ROS) generation was evaluated in vitro using the 1,3-diphenylisobenzofuran (DPBF) probe. A 40 ppm solution of each TiO2 system was irradiated with UV light, and the degradation of DPBF was monitored. Biological assays were conducted to assess the viability of human glioblastoma cells (LN18 and U251) incubated with the TiO2-based materials, with and without UV exposure. Human fibroblast cells (BJ) were used to evaluate biocompatibility. Results: All TiO2-based materials retained key characteristics, including high surface area (~600–700 m2/g), mesoporous structure (pore diameter ~4–5 nm), mixed anatase–amorphous morphology, and a bandgap of approximately 3.46 eV. The UV–Vis spectrum of TiO2-FA-ZnPc displayed additional absorption bands in the visible region (600–700 nm), consistent with ZnPc incorporation. Upon UV irradiation, the DPBF absorbance at 410 nm decreased over time, indicating ROS generation and resulting in complete degradation within 10 min (TiO2), 12 min (TiO2-FA), and 14 min (TiO2-FA-ZnPc). BJ cells exhibited good biocompatibility at all concentrations. LN18 and U251 cells showed no cytotoxicity below 100 μg/mL unless exposed to UV light. Conclusions: The synthesized TiO2-based systems demonstrate good biocompatibility and significant phototoxicity under UV irradiation, highlighting their strong potential for application in photodynamic therapy.
1. Introduction
Titanium dioxide (TiO2), commonly known as titania, is a metal oxide widely used in photo-based applications due to its semiconducting properties. TiO2 naturally exists in three crystalline phases—anatase, rutile, and brookite—each exhibiting distinct physicochemical characteristics, structures, and morphologies [1]. Beyond its established use as a photocatalyst for organic pollutant degradation in wastewater, TiO2 is employed in hydrogen production via water splitting and in redox reactions to synthesize high-value products [2,3,4].
As a semiconductor, TiO2 becomes photoexcited upon UV or sunlight exposure. It absorbs photons with sufficient energy (≤390 nm), promoting electrons from the valence band to the conduction band, creating holes (h+) and electrons (e−). These charges can initiate photocatalytic oxidation-reduction reactions involving adsorbed molecules on the TiO2 surface [5]. In these reactions, water and molecular oxygen can interact with the surface charges to produce reactive oxygen species (ROS) such as hydroxyl radicals (•OH), superoxide anions (O2−), and hydrogen peroxide (H2O2). These ROS can degrade pollutants like dyes, pharmaceuticals, and pesticides, ultimately converting them into harmless byproducts like carbon dioxide and water [6,7,8]. This mechanism underpins the widespread use of TiO2 in environmental remediation technologies [9].
TiO2 also offers a large surface area, mesoporous structure, high stability, low toxicity, and good biocompatibility, making it attractive for biomedical applications [10,11,12]. It has been explored as a biomaterial in implants, biosensors, drug delivery systems, antimicrobial agents, and tissue engineering. Notably, TiO2’s ROS-generating capability under light irradiation has led to its investigation as a therapeutic agent in photodynamic therapy (PDT) for cancer treatment [13,14,15]. Upon activation by UV light, TiO2 can induce damage to cellular components such as DNA, membranes, and lipids, ultimately triggering cell death through apoptosis, necrosis, or autophagy. PDT applications of TiO2 have been reported effective against a variety of cancer cell lines, including breast (4T1), epithelial (KB), glioblastoma, non-small cell lung (A549), cervical (HeLa), and breast epithelial cells (MCF7, MDA-MB-231, NSCLC) [16,17,18,19,20]. Compared to traditional treatments, PDT is less invasive, with reduced toxicity and shorter treatment times, and is clinically approved. PDT may also complement surgery, chemotherapy, or radiotherapy.
PDT relies on three key components: a light source (UV and/or visible), a photosensitizer (PS) that absorbs at the corresponding wavelengths, and sufficient molecular oxygen [21,22]. In practice, the PS is administered (orally, subcutaneously, or intravenously) and accumulates in the tumor. Once localized, it is irradiated to induce excitation from the ground state to higher energy states [21,22]. According to the literature, several processes can occur during excitation (see Scheme 1) [23]: (1) the PS transitions from its ground state to an excited singlet state (PSES); (2) this state may relax back to the ground state via fluorescence or non-radiative decay; or (3) it may convert to a longer-lived triplet state (PSET). The PSET species can then generate reactive oxygen species (ROS) via two pathways (Scheme 1): in a type I reaction, electron or proton transfer produces radicals that react with oxygen to form peroxides, hydroxyl radicals, or superoxide ions. In a type II reaction, energy is directly transferred to molecular oxygen, generating singlet oxygen. These ROS are cytotoxic and can induce apoptosis or necrosis in targeted cells [24].
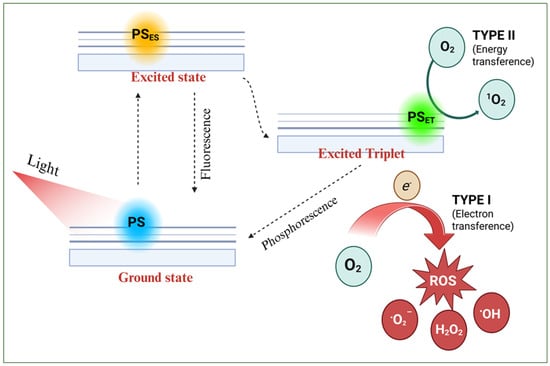
Scheme 1.
Schematic photodynamic reaction mechanisms (type I and II) upon light irradiation on a photosensitizer.
Currently, a wide range of compounds are used as photosensitizers (PSs), including dyes, drugs, synthetic chemicals, and natural products. These are typically classified into first-, second-, and third-generation categories [25,26]. Early PDT applications used hematoporphyrin (HpD), a first-generation PS, which showed limitations such as short half-life and poor penetration into deep tissues [21]. This led to the development of second-generation PSs with improved properties and reduced toxicity. Most are heterocyclic porphyrins, including bacteriochlorins, chlorins, protoporphyrins, phthalocyanines, and their derivatives [21]. Non-porphyrin PSs include 5-aminolevulinic acid (ALA), curcumin, quinone, phenothiazine, and psoralen. Despite reduced toxicity, many second-generation PSs suffer from poor water solubility and low tumor selectivity. Third-generation PSs address these issues by modifying second-generation structures with bio-specific molecules or carriers to enhance selectivity and biocompatibility [27].
To date, only a few PSs have been approved for clinical use, most of which are based on the tetrapyrrole structure. Commercial examples include Photofrin, Levulan, Metvix, Cysview, Temoporfin, Verteporfin, Talaporfin, Photochlor, and Photosens, each with specific applications and limitations [28,29]. Photofrin, used clinically for over two decades, is approved for treating lung, gastric, bladder, cervical, and esophageal cancers. However, it has complex components, poor absorption in the therapeutic window, and a long clearance time. ALA (Levulan) is applied in cancer diagnosis and brain cancer research. Its low molecular weight and strong polarity make it suitable for topical use in dermatological conditions such as basal cell carcinoma, actinic keratosis, and Bowen’s disease. Metvix (MAL) and Cysview (HAL), esters of ALA, offer faster tissue penetration. Temoporfin is used against head and neck squamous cell carcinoma and shows improved light absorption and photodynamic effects but still requires 4–6 weeks of light avoidance post-treatment. Verteporfin, approved for age-related macular degeneration (AMD), marked a shift in PDT from oncology to ophthalmology. Talaporfin is primarily used in early-stage lung cancer and offers faster tumor accumulation and clearance than Photofrin. Photochlor has higher tumor uptake than Photofrin or Temoporfin due to its lipophilicity and better pharmacokinetics, with only mild, short-lived photosensitivity. Photosens, an aluminum phthalocyanine mixture, is approved in Russia for skin, stomach, and breast cancers and AMD. Hemoporfin is the first PS approved for port-wine stain (PWS) treatment, a congenital vascular malformation.
Nanomaterials as PS carriers—or as PSs themselves—present a promising strategy due to their generally low toxicity and high biocompatibility [30,31]. Their large surface area enables high PS loading and controlled release, enhances solubility, reduces aggregation, and improves ROS generation and light absorption for deeper tissue penetration. Surface functionalization with targeting ligands enables selective delivery to tumor cells, sparing healthy tissues [31,32]. Many cancer cells overexpress specific surface receptors, which can be targeted using ligands such as folate, CD44, monoclonal antibodies, and transferrin [33]. Nanomaterials for PDT are classified into two types: organic (e.g., liposomes, dendrimers, polymeric nanoparticles) and inorganic (e.g., silica, magnetic materials, quantum dots, metal oxides, and metals) [32].
According to the World Health Organization (WHO), glioblastoma is classified as a grade IV tumor, the most malignant form of brain cancer [34]. Although rare, it has a median survival of only 15 months, attributed to its high histological heterogeneity, invasiveness, rapid proliferation, and angiogenesis. Current standard treatment consists of maximal surgical resection followed by temozolomide (TMZ) chemotherapy and radiotherapy [35]. Despite these interventions, glioma patients face poor prognoses and limited survival, primarily due to the blood–brain barrier (BBB), which restricts the delivery of most chemotherapeutic agents. Consequently, there is a critical need to develop new or improved therapeutic strategies.
Phthalocyanines (Pcs), second-generation PSs, are aromatic heterocycles comprising four isoindole rings connected by nitrogen atoms. Their photophysical properties can be improved by introducing ring substituents or incorporating a silicon atom or metals such as zinc or aluminum [36]. Zinc phthalocyanine (ZnPc), which contains a zinc ion at its core, exhibits desirable characteristics including high 1O2 generation, strong therapeutic efficacy, low skin photosensitivity, and efficient ROS production. However, ZnPc has not yet been clinically approved due to its poor water solubility and aggregation tendency in solutions.
In this work, TiO2 semiconductor nanoparticles functionalized with folate groups and loaded with ZnPc were obtained, characterized, and applied as selective photosensitizers for glioma cells. The aim was to stabilize ZnPc on a functionalized TiO2-FA support that enables ROS generation and targeted delivery. The composite produced combines the beneficial properties of both TiO2 and ZnPc. Samples were synthesized using the sol–gel method, allowing in vitro incorporation of folic acid and ZnPc. Singlet oxygen generation was evaluated using the 1,3-diphenylisobenzofuran (DPBF) test, showing a decrease in the 410 nm band with increased UV irradiation and exposure to different TiO2 systems. LN18 and U251 cells showed no damage at low concentrations of these materials, compared to cells irradiated with UV light alone.
2. Materials and Methods
2.1. Sample Preparation
Chemical substances: tert-butyl alcohol [Sigma-Aldrich, St. Louis, MO, USA, ≥99%], titanium (IV) isopropoxide [Sigma-Aldrich, St. Louis, MO, USA, 97%], folic acid (FA) [Sigma-Aldrich, St. Louis, MO, USA, ≥97%], zinc phthalocyanine (ZnPc) [Aldrich, St. Louis, MO, USA, 97%], deionized water [Meyer, México City, México], and 1,3-diphenylisobenzofuran (DPBF) [Aldrich, St. Louis, MO, USA, 97%] were used as reagents.
Three samples were synthesized via the sol–gel method: pure TiO2, TiO2 functionalized with folic acid (TiO2-FA), and TiO2-FA loaded with zinc phthalocyanine (TiO2-FA-ZnPc). The molar ratios were alkoxide:water (1:16) and alkoxide:alcohol (1:8). A total of 0.5 g of FA and ZnPc was added. The synthesis procedure is illustrated in Scheme 2.
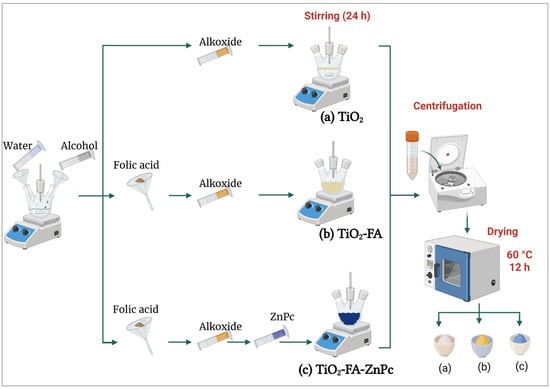
Scheme 2.
Graphical representation of the synthesis procedure of the different TiO2 powder samples: (a) TiO2, a white powder; (b) TiO2-FA, a yellow powder; and (c) TiO2-FA-ZnPc, a blue powder. These samples were prepared using the sol–gel method.
2.1.1. TiO2
A solution of 185 mL tert-butyl alcohol and 72 mL deionized water was stirred for 30 min. Then, 78 mL of titanium (IV) isopropoxide was added dropwise over 4 h. After complete addition, the mixture was stirred for 24 h. Excess water and alcohol were removed by centrifugation, and the resulting solid was dried at 60 °C for 12 h.
2.1.2. TiO2-FA
Folic acid (0.5 g) was dissolved in 185 mL tert-butyl alcohol and 72 mL water. Then, 78 mL of titanium (IV) isopropoxide was added dropwise. The mixture was stirred for 24 h, centrifuged to remove solvents, and dried at 60 °C for 12 h.
2.1.3. TiO2-AF-ZnPc
Folic acid (0.5 g) was dissolved in 92.6 mL tert-butyl alcohol and 36 mL water and stirred for 30 min. Then, 78 mL of titanium (IV) isopropoxide was added dropwise and the mixture stirred for 5 h. A solution containing 0.5 g zinc phthalocyanine in 92.6 mL tert-butyl alcohol and 36 mL water was then added. The mixture was stirred for 24 h and dried at 60 °C for 12 h.
2.2. Samples Characterization
Scanning electron microscopy (SEM) was conducted using a Schottky JSM-7800F field-emission microscope (Tokyo, Japan) to observe morphology and surface texture. Images were acquired with a secondary electron detector at 2.0 kV under ultra-high vacuum. Particle dimensions were measured using ImageJ software (https://share.google/M9IyYsVqNLaGpH9Xa, accessed on 9 and 26 September 2024). High-resolution transmission electron microscopy (HR-TEM) was carried out on a JEM-2100 microscope (Tokyo, Japan) (LaB6 filament, 80–200 kV). Samples were dispersed in isopropanol by sonication and deposited onto copper grids for analysis. X-ray diffraction (XRD) patterns were obtained using a Bruker D2 Phaser diffractometer (Karlsruhe, Germany,) with Cu Kα radiation (λ = 1.5405 nm). Scans were conducted from 7° to 80° (2θ) at a rate of 0.0405°/s. Samples were pressed into the holder to ensure a flat, uniform surface. Raman spectra were recorded at room temperature using a Jobin Yvon HR800 micro-Raman spectrometer (Palaiseau, France) with a 532 nm excitation laser and D3 filter. Spectra were collected in the range of 0–3500 cm−1 with a 2 s exposure time. Powdered samples were placed in clean glass holders. Diffuse reflectance UV–Vis spectra were recorded using a Varian Cary 100 Scan spectrophotometer (Palo Alto, CA, USA) equipped with a calcium sulfate integrating sphere, covering the 190–800 nm range. Thermogravimetric analysis (TGA) was performed using an SAT-i 1000 instrument (Twin Lakes, WI, USA). Samples were heated from room temperature to 800 °C at a rate of 10 °C/min under nitrogen to assess thermal stability and weight loss. Nitrogen adsorption–desorption isotherms were measured using a Belsorp-mini II system (Osaka, Japan). Samples were degassed at 60 °C under vacuum for 12 h. Surface area, pore volume, and pore size were calculated from the resulting isotherms.
2.3. In Vitro ROS Determination
1,3-Diphenylisobenzofuran (DPBF) was used as a fluorescent probe to evaluate singlet oxygen formation. Briefly, 200 mL of a 40 ppm DPBF solution was placed in a custom-made photoreactor equipped with water recirculation and air flow. The solution was bubbled with air for 20 min. Subsequently, 200 mg of the TiO2 system was added and allowed to interact with the solution for 5 min. The mixture was then irradiated with a UV lamp at 254 nm (2.2 mW, UVP company, Upland, CA, USA). Aliquots were collected every 2 min for analysis by UV–Vis spectroscopy using a Cary100SCAN UV–Vis spectrophotometer (Palo Alto, CA, USA).
2.4. Biological Assays
Cell culture substances: Tetrazolium bromide (MTT) (Sigma-Aldrich, ≥97%), fetal bovine serum (FBS) (Biowest, Nuaillé, France), Dulbecco’s Modified Eagle Medium (DMEM) (Gibco, Waltham, MA, USA), trypsin-EDTA (Gibco), and antibiotic-antimycotic (Corning, Somerville, MA, USA).
Cell line: LN18 and U251 (human glioblastoma) and BJ (human fibroblasts) obtained from ATCC.
2.4.1. Cytotoxic Evaluation
To assess the cytotoxicity of the developed TiO2 systems, cell viability was measured using the MTT (3-(4,5-dimethylthiazol-2-yl)-2,5-diphenyltetrazolium bromide) assay on human fibroblast BJ cells and glioblastoma cell lines LN18 and U251.
Cells were seeded at a density of 1 × 10⁵ cells/well in 96-well plates and incubated overnight at 37 °C in a humidified 5% CO2 atmosphere. The following day, cells were treated with increasing concentrations (0, 10, 25, 50, 100, and 500 μg/mL) of TiO2, TiO2-FA, and TiO2-FA-ZnPc in DMEM supplemented with 5% FBS. Both treated and untreated cells were incubated for 24 h. MTT reagent was added and incubated for 2 h to allow formazan crystal formation in metabolically active cells. Subsequently, 100 μL of acidified isopropanol (0.04 M HCl) was added to dissolve the crystals. Absorbance was measured at 570 and 630 nm using a microplate reader.
Cell viability was calculated using the following formula:
where
CV% = (S(A570 − A630))/(C(A570 − A630)) × 100%
CV is the cell viability, S is the sample, C represents the control cells, and A is the absorbance.
Experiments were performed in triplicate, and controls consisted of untreated cells. Results are expressed as percentages relative to the control group. Statistical analysis was conducted using two-way ANOVA with Dunnett’s post hoc test (GraphPad Prism, version 9.4.1).
2.4.2. Determination of the Phototoxicity Effect
To assess phototoxicity and distinguish treatment toxicity from light-induced cytotoxicity, LN18 and U251 glioma cells were seeded at a density of 1 × 10⁵ cells/well in 96-well plates and incubated overnight at 37 °C in a humidified atmosphere with 5% CO2 to allow cell adhesion. The following day, cells were treated with increasing concentrations (0, 10, 25, 50, 100, 250, and 500 μg/mL) of each nanoparticle formulation and dissolved in DMEM supplemented with FBS. After 10 min of incubation, cells were irradiated with 385 nm LED light for either 1 or 10 min at distances of 1 and 10 cm. Irradiation was performed inside a laminar flow hood to prevent contamination and ensure consistent exposure conditions.
Following irradiation, cells were incubated for 24 h at 37 °C with 5% CO2. Cell viability was determined using the MTT colorimetric assay. MTT was added to each well and incubated for 2 h to allow formazan crystal formation. Crystals were then solubilized with acidified isopropanol (0.04 M HCl), and absorbance was measured at 570 and 630 nm using a microplate reader. All treatments were conducted in triplicate. Results were expressed as percentage viability relative to untreated controls. Statistical analysis was performed using two-way ANOVA with Dunnett’s post hoc test and paired Student’s t-test for specific comparisons (GraphPad Prism, version 9.4.1).
3. Results
3.1. Characterization Results
SEM images of the various TiO2 samples at different magnifications are shown in Figure 1. The TiO2 sample displays a morphology composed of agglomerates of small particles ranging from approximately 10 to 100 nm (Figure 1a,b), forming a porous TiO2 network. Similarly, the TiO2-FA sample exhibits a morphology of aggregated particles (Figure 1c,d), and the TiO2-FA-ZnPc sample shows the same structural characteristics (Figure 1e,f). In all cases, the nanoparticle aggregates result in a porous morphology, typical of TiO2 materials synthesized by the sol–gel method.
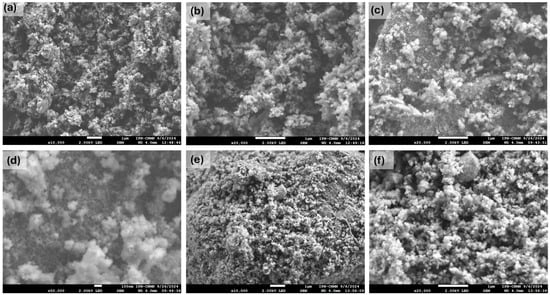
Figure 1.
SEM images at different magnifications of the different prepared TiO2 materials: (a) TiO2 (×10,000), (b) TiO2 (×20,000), (c) TiO2-FA (×20,000), (d) TiO2-FA (×50,000), (e) TiO2-FA-ZnPc (×10,000), and (f) TiO2-FA-ZnPc (×20,000). The scale bar in the (d) sample corresponds to 100 nm; the rest correspond to 1 µm.
Figure 2 presents the energy-dispersive X-ray spectroscopy (EDS) spectra of the TiO2, TiO2-FA, and TiO2-FA-ZnPc samples. The EDS spectrum of the TiO2 sample indicates titanium as the primary element, along with smaller signals for oxygen and carbon. Titanium and oxygen are part of the TiO2 network, while the carbon likely originates from the alkoxide precursor used in the synthesis (Figure 2a). The TiO2-FA spectrum is similar, showing Ti, O, and a stronger C signal, the latter attributed both to the alkoxide precursor and to folic acid (Figure 2b). The TiO2-FA-ZnPc spectrum displays peaks for carbon, oxygen, and titanium, along with a small zinc signal (Figure 2c), indicating the presence of Zn from the ZnPc component. However, Ti, O, and C remain the dominant elements in all samples.
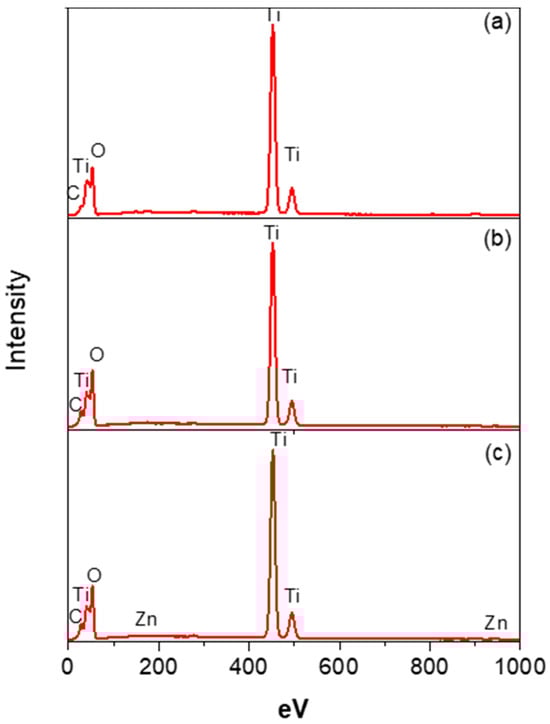
Figure 2.
EDS spectra of the different TiO2-based samples, identifying the main Ti, O, C, and Zn elements present in (a) TiO2, (b) TiO2-FA, and (c) TiO2-ZnPc samples.
Figure 3 shows high-resolution transmission electron microscopy (HR-TEM) images of the different TiO2-based materials prepared as photosensitizers. The TiO2 sample exhibits a combination of amorphous and crystalline regions (Figure 3a,b), with the crystalline areas likely corresponding to the anatase phase. In the TiO2 sample functionalized with folic acid (TiO2-FA), an increased degree of crystallinity is observed, suggesting that folic acid promotes anatase phase formation (Figure 3b,c). Upon the addition of ZnPc, well-defined crystalline domains appear, although amorphous regions remain visible across all samples. The HR-TEM images were also used to measure the interplanar spacing of the TiO2-FA and TiO2-FA-ZnPc samples. For TiO2-FA, an interplanar spacing of approximately 0.35 nm was calculated, corresponding to the (101) plane of anatase (Figure 3c). In the TiO2-FA-ZnPc sample (Figure 3e), a distinct crystalline region displays a lattice spacing of 0.47 nm, which matches the (202) plane of ZnPc and is consistent with reported values [37].
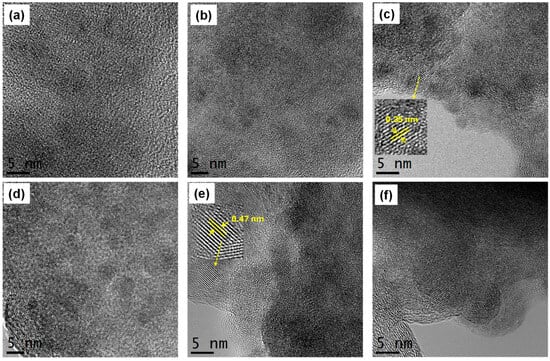
Figure 3.
HR-TEM images of (a,b) TiO2, (c,d) TiO2-FA, and (e,f) TiO2-ZnPc. Zoomed regions show the interplanar spacing of (c) anatase phase and (e) ZnPc, respectively.
Figure 4 presents the X-ray diffraction (XRD) patterns of the studied materials. The TiO2 pattern reveals a combination of amorphous and anatase phases, evidenced by the peak at 25.2°, corresponding to the (101) plane of anatase. The ZnPc pattern displays sharp peaks indicative of a crystalline structure. The most intense peak appears at 2θ = 9.34°, accompanied by medium-intensity peaks at 2θ = 7.08° and 11.28°, and several minor peaks at 2θ = 12.66°, 18.28°, 18.78°, 20.26°, 20.91°, 23.74°, and 26.29°, which correspond to various ZnPc diffraction planes [37,38]. In the TiO2-FA-ZnPc diffractogram, the features of TiO2 predominate, but the peak at 2θ = 9.34°, associated with ZnPc, remains visible, indicating the successful incorporation of ZnPc into the TiO2 network. The TiO2-FA pattern closely resembles that of TiO2, suggesting that folic acid is well distributed within the porous titania matrix.
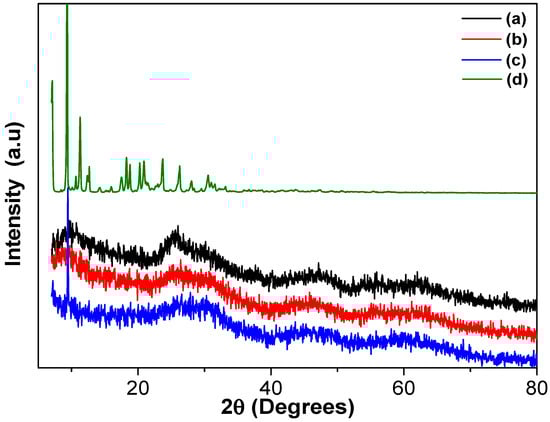
Figure 4.
XRD patterns of the different TiO2 materials: (a) TiO2, (b) TiO2-FA, (c) TiO2-FA-ZnPc, and (d) ZnPc.
Figure 5 shows the Raman spectra of the TiO2, TiO2-FA, and TiO2-FA-ZnPc samples over the 0–3500 cm−1 range. In Figure 5a, the TiO2 sample displays a strong, well-defined peak at 150 cm−1, attributed to the Eg(2) mode of the anatase crystalline phase. The band at 623 cm−1 corresponds to another Eg mode, and the peak at 404 cm−1 is assigned to the B1g mode of anatase [39]. The Raman spectrum of TiO2-FA is very similar to that of TiO2, with a slight shift of the band at 637 cm−1 due to the presence of folic acid (Figure 5b), indicating its good dispersion within the TiO2 network. In the spectrum of TiO2-FA-ZnPc (Figure 5c), additional distinct peaks appear alongside the TiO2-related bands. According to the literature, the peak at 588 cm−1 arises from benzene ring deformation, the 675 cm−1 peak is attributed to the macrocycle, and the bands at 1344 cm−1 and 1513 cm−1 are associated with the Zn metal ion coordinated to the phthalocyanine structure [40,41]. In the 2000–3800 cm−1 region, carbon-related vibrational modes from ZnPc are also evident.
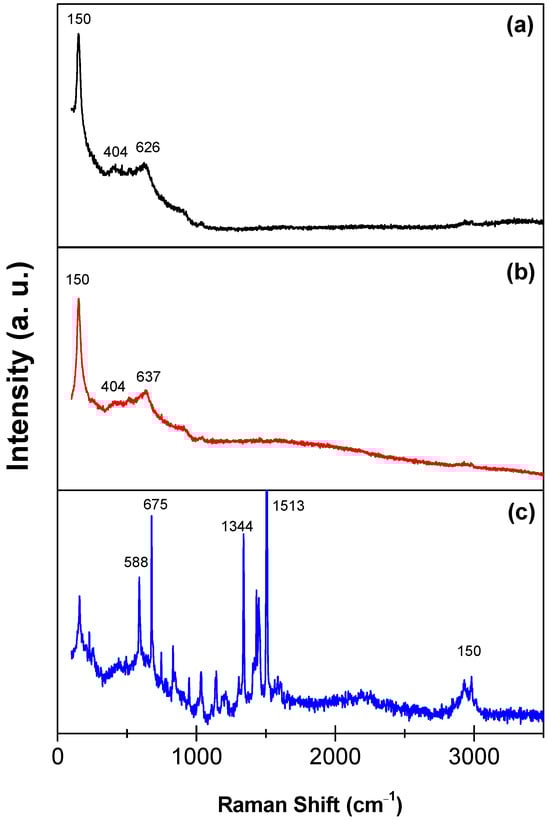
Figure 5.
Raman spectra of the (a) TiO2, (b) TiO2-FA, and (c) TiO2-FA-ZnPc materials.
Figure 6 shows the UV–Vis diffuse reflectance spectra in the solid state for TiO2, TiO2-FA, and TiO2-FA-ZnPc materials. The TiO2 spectrum exhibits a strong absorption band at 380 nm (Figure 6A), corresponding to an electron transition from the Ti 3d orbital to the O 2p orbitals in the TiO2 lattice [42]. The spectrum of TiO2-FA closely resembles that of TiO2; however, the main absorption peak is red-shifted from 380 nm to 520 nm, likely due to interactions between folic acid and the TiO2 surface. The ZnPc spectrum displays multiple absorption bands throughout the UV–Vis range, which are categorized into the visible and ultraviolet regions. In the visible range, signals between 450–750 nm correspond to the Q-band (λ = 660 nm), while the ultraviolet range features the B-band (λ = 327 nm) [43]. The Q-band is attributed to p-p* transitions from the highest occupied molecular orbital (HOMO) to the lowest unoccupied molecular orbital (LUMO) in ZnPc. The B-band arises from transitions from deeper p orbitals to the LUMO [44]. In the TiO2-FA-ZnPc spectrum, the Q-band is visible in the magnified region of Figure 5b. The B-band is not discernible, possibly due to overlap with TiO2 absorption. The experimental bandgap energy (Eg) for TiO2 was calculated as 3.46 eV, whereas the Eg for both TiO2-FA and TiO2-FA-ZnPc was 2.38 eV. Notably, absorption in the visible region is evident in the TiO2-FA-ZnPc spectrum.
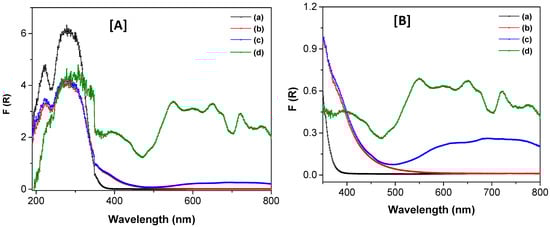
Figure 6.
UV–Vis spectra of the different TiO2-based materials in their solid state (A) in the 200–800 range and (B) in the 350–800 range, respectively. (a) TiO2, (b), TiO2-FA, (c) TiO2-FA-ZnPc, and (d) ZnPc.
Figure 7 presents the nitrogen adsorption–desorption isotherms for the synthesized TiO2 materials. Based on IUPAC classification, all curves correspond to Type IV isotherms, characteristic of mesoporous materials. A hysteresis loop of type H1, also defined by IUPAC, confirms the presence of mesoporosity. At low relative pressure (P/P0), the adsorbed volume between 0.01–0.2 nm indicates the presence of micropores, which are further supported by the pore size distribution shown in the inset of Figure 7. Additional uptake at high P/P0 values (0.95–1.0) suggests the presence of macropores, albeit in smaller amounts compared to micro- and mesopores. Overall, mesopores dominate the porosity profile of the materials.
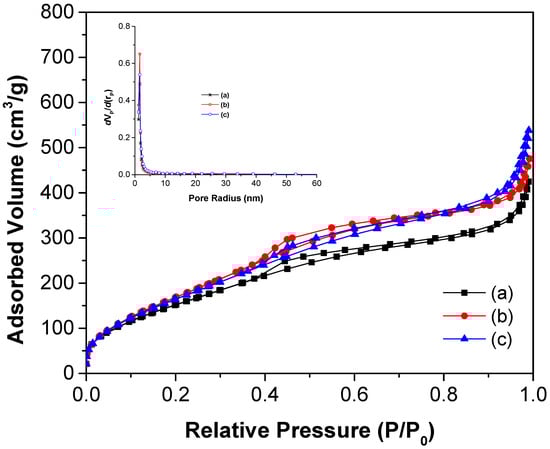
Figure 7.
N2 adsorption–desorption isotherms of (a) TiO2, (b) TiO2-FA, and (c) TiO2-FA-ZnPc materials. The insert shows the pore size distribution of the materials.
Textural properties such as surface area, average pore diameter, and pore volume were derived from nitrogen adsorption–desorption isotherms and are summarized in Table 1. The surface area for TiO2 was 602 nm, while those for TiO2-FA and TiO2-FA-ZnPc were 706 and 675 nm, respectively. All values are relatively high. Notably, the surface area increased upon the addition of folic acid. However, when ZnPc was incorporated, the surface area decreased by 4.31% compared to the TiO2-FA sample. This reduction may be due to ZnPc molecules occupying part of the pores and surface, as they were added after the TiO2-FA network had formed. The average pore diameter decreased from 5.35 nm in TiO2 to 4.07 nm in TiO2-FA, likely due to folic acid molecules occupying the pore spaces. The pore volume followed the trend TiO2-FA-ZnPc > TiO2-FA > TiO2, with all materials exhibiting relatively high pore volumes.

Table 1.
Textural and bandgap values of the different TiO2, TiO2-AF, and TiO2-AF-ZnPc materials. SBET is the surface area, PD is the pore diameter, and PV is the pore volume.
The weight loss profiles as a function of treatment temperature for the TiO2, TiO2-FA, and TiO2-FA-ZnPc samples are shown in Figure 8, with the corresponding percentage weight loss values for each temperature range summarized in Table 2. The thermogram of TiO2 exhibits two major weight loss events. The first, occurring between room temperature and 150 °C, is attributed to the evaporation of volatile compounds such as water and alcohol used during synthesis, resulting in a 14% weight loss (Table 2). The second event, between 150–300 °C, likely corresponds to the decomposition of residual precursor materials such as alkoxides, accounting for an additional 8% loss. Beyond this temperature range, the thermogram becomes linear, indicating no further significant weight loss.
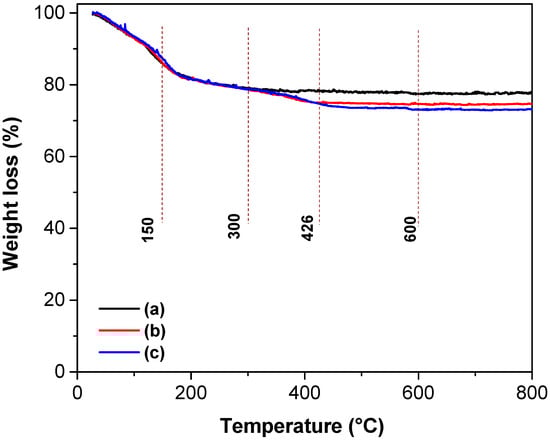
Figure 8.
TGA curves of the different TiO2-based materials: (a) TiO2, (b) TiO2-FA, and (c) TiO2-FA-ZnPc.
Table 2.
Weight loss % at different temperature intervals of the TiO2, TiO2-FA, and TiO2-FA-ZnPc samples.
The thermogram of TiO2-FA reveals three distinct stages of weight loss. The first stage, from room temperature to 150 °C, corresponds to the evaporation of water and alcohol, also resulting in a 14% weight loss. The second stage, from 150–300 °C, involves an 8% loss attributed to the removal of organic precursors. The third stage, from 300–426 °C, accounts for a 3% weight loss due to the complete degradation of folic acid. Following this, the thermogram becomes stable and linear, indicating no additional mass loss. In total, 20 g of TiO2 were synthesized, and 0.5 g of folic acid was added, representing 2.5% of the TiO2 mass. The 3% weight loss attributed to folic acid (Table 2) closely matches the theoretical value, confirming the sample’s composition by TGA analysis.
The thermogram of the TiO2-FA-ZnPc sample displays four main stages of weight loss. As in the previous sample, the first three stages correspond to (1) the evaporation of water and alcohol and (2–3) the elimination of folic acid, showing weight loss percentages similar to those of TiO2-FA (Table 2). The fourth stage, occurring between 426–600 °C, corresponds to the degradation of ZnPc and results in a 2% weight loss. This value is consistent with the 2.5% ZnPc added during synthesis, further validating the composition of the sample.
3.2. In Vitro ROS Production
The generation of singlet oxygen was confirmed using 1,3-diphenylisobenzofuran (DPBF) as a probe. Figure 9 shows the UV–Vis absorption spectra of DPBF in the presence of TiO2, TiO2-FA, and TiO2-FA-ZnPc after UV light irradiation for up to 16 min. The absorption intensity of DPBF gradually decreased over time, accompanied by a visible color change from green to colorless. Complete degradation of DPBF was observed after 10 min of irradiation with TiO2, 12 min with TiO2-FA, and 14 min with TiO2-FA-ZnPc.
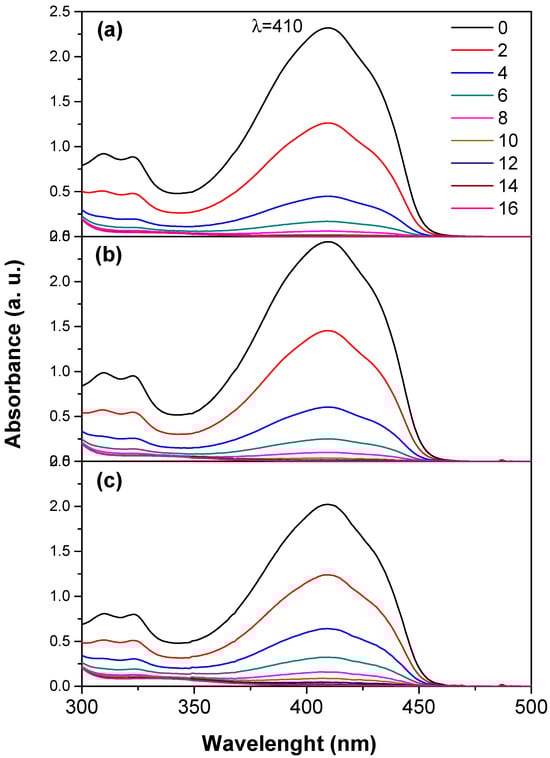
Figure 9.
UV–Vis spectra of the 1,3-diphenylisobenzofuran (DPBF) in the presence of the TiO2 samples after irradiation with UV light for different times (0–16 min). (a) TiO2, (b) TiO2-FA, (c) TiO2-FA-ZnPc.
3.3. Biological Results
The viability of LN18 and U251 cells was evaluated using the MTT assay after 24 h of exposure to TiO2, TiO2-FA, and TiO2-FA-ZnPc materials (Figure 10), as well as in BJ fibroblasts (Figure 11). This assay quantifies cell metabolic activity and serves as an indicator of cytotoxicity. The results show that the average viability of LN18 cells exposed to varying concentrations of the TiO2-based materials (5–100 µg/mL) decreased with increasing TiO2 concentration, following a dose-dependent trend over time. After 24 h, cell viability remained high at low and moderate concentrations (≤100 µg/mL) for all three materials, indicating good initial biocompatibility (Figure 10A,B). However, at concentrations of 250 µg/mL and above, significant cytotoxic effects were observed.
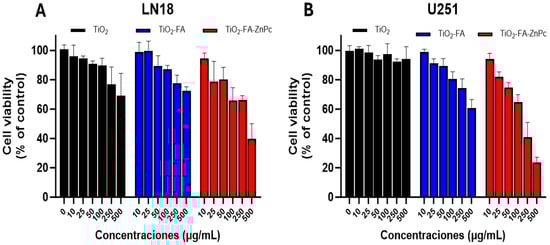
Figure 10.
Viability of (A) LN18 and (B) U251 cells after treatment with different concentrations of TiO2 (black), TiO2-FA (blue), and TiO2-FA-ZnPc (red) nanoparticles (24 h). The standard deviations are indicated with the error bars.
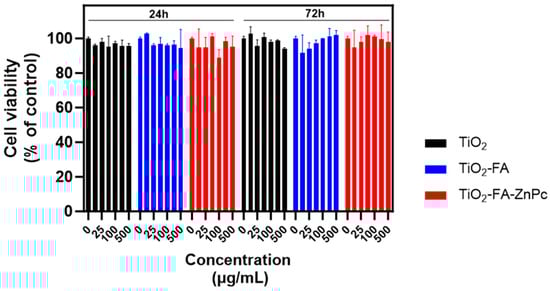
Figure 11.
Viability of BJ cells after treatment with different concentrations of TiO2, TiO2-FA, and TiO2-FA-ZnPc nanoparticles (24 h and 72 h). The standard deviations are indicated with the error bars.
At the lowest concentrations tested (10–100 µg/mL), cell viability remained relatively high, showing no significant differences from the control group. In contrast, at concentrations between 250 and 500 µg/mL, a statistically significant reduction in cell viability was detected, particularly in the TiO2-FA-ZnPc group. Notable differences began to emerge at 250 µg/mL (p < 0.05) according to Dunnett’s analysis.
Figure 11 shows the cell viability of BJ fibroblasts (used as normal cells) treated with increasing concentrations of the different TiO2 samples for 24 and 72 h. As observed in each group, viability remained comparable to the control (cells without treatment) across all tested concentrations and exposure times. These results confirm that the synthesized materials are biocompatible.
As shown in Figure 12 and Figure 13, TiO2-ZnPc nanoparticles combined with UV irradiation enhanced cell death from 100 µg/mL under all conditions, although LN18 cells showed greater resistance compared to U251 cells. The U251 cells exhibited a dose- and light-dependent differential response at 10 cm and with increased irradiation time.
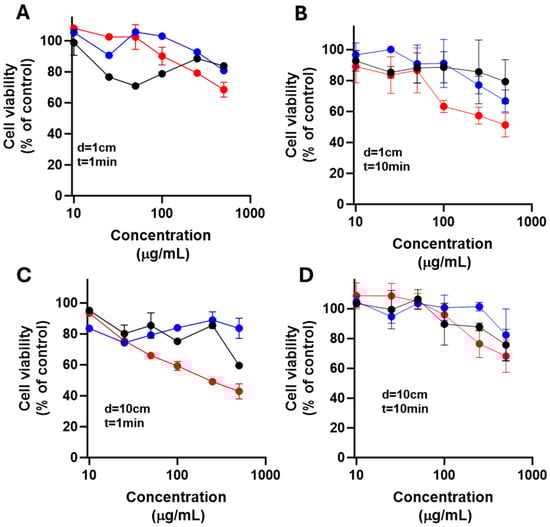
Figure 12.
Effect of nanoparticles over cell viability after irradiation on LN18 cells. The cells were exposed to LED light at 385 nm for 1 min (A,C) or 10 min (B,D) with 1 cm (A,B) and 10 cm (C,D) from irradiation source after placing TiO2 (black), TiO2-FA (blue), and TiO2-FA-ZnPc (red) nanoparticles in cells; followed; after 24 h, cell viability was determined. Results are expressed as means ± SEM.
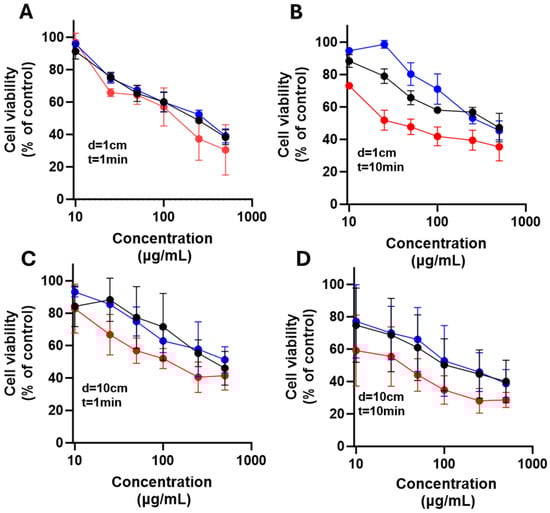
Figure 13.
Effect of nanoparticles over cell viability after irradiation on U251 cells. The cells were exposed to LED light at 385 nm for 1 min (A,C) or 10 min (B,D) with 1 cm (A,B) and 10 cm (C,D) from the irradiation source after placing TiO2 (black), TiO2-FA (blue), and TiO2-FA-ZnPc (red) nanoparticles in cells; followed; after 24 h, cell viability was determined. Results are expressed as means ± SEM.
Cells were exposed to LED light at 385 nm for 1 min (A and C) or 10 min (B and D), using distances of 1 cm (A and B) and 10 cm (C and D) from the irradiation source. After 24 h, cell viability was determined. Results are expressed as means ± SEM.
4. Discussion
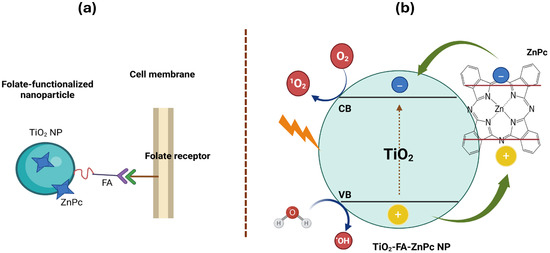
Folic acid, also known as vitamin B9, is a water-soluble vitamin essential for the synthesis of nitrogenous bases during nucleotide formation [45]. Cancer cells require increased amounts of folate for proliferation and survival, often overexpressing folate receptors to enhance uptake. Therefore, folic acid is commonly used to functionalize nanomaterial surfaces for selective cancer cell targeting [46]. Folate-functionalized nanomaterials enter cancer cells via folate receptor-mediated endocytosis (Scheme 3a). This approach is feasible because most healthy tissues exhibit low folate receptor expression, allowing discrimination between cancerous and normal cells. Accordingly, the TiO2-FA system was designed to enable selective interaction with glioma cells through folate receptor binding.
Scheme 3.
(a) A schematic representation of the functionalization of a TiO2 nanoparticle with folic acid and loaded with ZnPc and its subsequent entry into a cell via folate receptors and (b) the ROS formation when TiO2-FA-ZnPc nanoparticle is irradiated with UV light.
Initially, TiO2 nanoparticles were synthesized, exhibiting desirable physicochemical properties including nanostructured morphology, high surface area (602 m2/g), mesoporous structure (average pore size 5.35 nm), a mixed anatase-amorphous phase, and a bandgap of 3.46 eV—typical for semiconductor TiO2. These properties facilitated the uniform incorporation and dispersion of folic acid throughout the TiO2 network, resulting in a composite with distinct features: a larger surface area of 706 m2/g, preserved mesoporosity (4.07 nm), and the same mixed-phase composition. This was achieved via the sol–gel method, widely used for homogeneous in situ incorporation of active species, eliminating post-synthesis modifications [47]. Thermogravimetric analysis confirmed that the incorporated amounts of folic acid and ZnPc closely matched their theoretical values (Table 2). A photosensitizing nanocomposite was subsequently obtained by loading ZnPc onto the TiO2-FA structure. ZnPc can remain both on the surface and/or embedded within the titania lattice. The final TiO2-FA-ZnPc composite retained its unique properties while enhancing the functionalities of both TiO2 and ZnPc. This material had a high surface area (675 m2/g) and strong absorption in both UV and visible regions, resulting in a reduced bandgap of 2.3 eV.
Titania is a well-known semiconductor that generates significant amounts of reactive oxygen species (ROS) under UV irradiation (Scheme 3). However, when TiO2 is combined with dye molecules, its bandgap changes substantially due to photosensitization [48]. This lowers the energy required to excite electrons, allowing light absorption at higher wavelengths. As a result, TiO2-FA-ZnPc can be activated not only by UV light but also by visible radiation. Therefore, sunlight and other visible light sources can photoexcite TiO2-FA-ZnPc materials. As illustrated in Scheme 3b, when the photosensitizer (TiO2-FA-ZnPc) is irradiated with UV or visible light, the dye attached to TiO2 is photoexcited, promoting electron transfer from its valence band to its conduction band. Electrons in the dye’s conduction band are injected into the conduction band of TiO2, while the oxidized dye is regenerated by oxidizing adsorbed molecules (water and/or O2) on the TiO2 surface, completing the electronic cycle.
An in situ study was performed using the DPBF probe to evaluate ROS generation by TiO2. DPBF (Scheme 4) is a widely used fluorescent probe for ROS detection, undergoing oxidative bleaching to form the colorless compound 1,2-dibenzoylbenzene (DBB) (Scheme 4) [49]. DPBF exhibits a characteristic absorption band near 415 nm, which disappears upon rapid reaction with singlet oxygen (1O2) (Figure 9). Results indicate that TiO2 degrades DPBF faster than TiO2-FA and TiO2-FA-ZnPc. However, folic acid functionalization is essential for achieving TiO2 materials that target specific cells. Meanwhile, ZnPc tends to aggregate in solution and requires stabilization by a high-surface-area support that can be functionalized to disperse ZnPc effectively and facilitate ROS production.
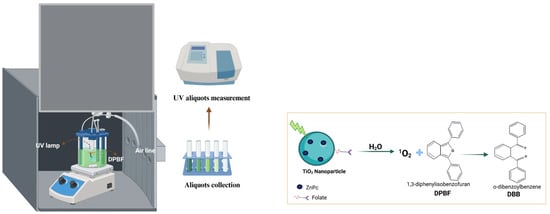
Scheme 4.
This is a schematic representation of the photocatalytic test using DPBF. This is the proposed reaction mechanism between the produced singlet oxygen and DPBF.
BJ cells, derived from neonatal male foreskin, are human fibroblasts commonly used in biomedical research on aging, cancer, and viral infections. In this study, BJ cells served as a control since they originate from healthy tissue and are free of disease-related alterations such as cancer. As shown in Figure 11, fibroblast viability was not affected after exposure to the various titania materials for up to 72 h.
LN18 and U251 human glioblastoma (GB) cells are widely used in neuro-oncology research. The LN18 cell line was isolated in 1976 from the right temporal lobe of a 65-year-old White male glioblastoma patient [50]. The U-251 MG cell line originated from a 75-year-old Caucasian male. These cell lines were used here to assess the cytotoxicity of the synthesized TiO2-based materials. MTT assay demonstrated that all materials exhibited acceptable biocompatibility in fibroblasts at all tested concentrations and in glioma cells at low to moderate concentrations. Specifically, cell viability remained above 80% during the first 24 h of exposure at concentrations up to 100 µg/mL, indicating good tolerance under physiological conditions without irradiation.
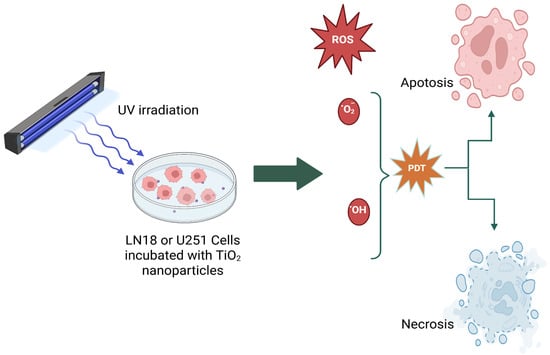
Scheme 5 schematically illustrates that when cancer cells are treated with different TiO2 nanoparticle systems and exposed to UV light, the resulting ROS induce cell death mainly via apoptosis, necrosis, and/or autophagy.
Scheme 5.
A schematic representation of photodynamic therapy, which is used to kill glioma cells (LN18 or U251 cells).
5. Conclusions
TiO2 nanoparticles were synthesized via the sol–gel method, exhibiting desirable physicochemical properties such as a large surface area, mesoporous structure, and a mixed amorphous–anatase phase. These nanoparticles showed a characteristic TiO2 bandgap energy of 3.46 eV, which was retained after functionalization with folic acid. Incorporation of ZnPc into the TiO2-FA matrix yielded a multifunctional nanocomposite combining the properties of folic acid and ZnPc.
These materials exhibited enhanced ROS generation, as demonstrated by the rapid degradation of DPBF to the non-colored compound DBB. The nanomaterials were shown to be non-toxic at all concentrations to fibroblast cells. However, they were non-toxic only at low concentrations when LN18 and U251 glioma cells were treated, while higher doses resulted in a reduction in cell viability. Photoactivity assays revealed that cell death depended on both nanomaterial concentration and duration of UV light exposure. Notably, exposure to the nanomaterials alone did not affect LN18 and U251 cells compared to cells exposed to UV light without nanoparticles.
Looking ahead, this experimental research focuses on the in vitro response of TiO2-FA-ZnPc under visible light irradiation. Planned biological assays will include both glioma and normal cell lines. In addition to DPBF, DCFH-DA will be used to detect singlet oxygen (1O2) generation in vitro. Finally, we aim to determine the type of cell death induced by treatments with or without light irradiation.
Author Contributions
Conceptualization, E.O.-I.; methodology, E.O.-I., S.R.-G., M.E.M.-R., A.M.O.-T., F.T.-M., and C.E.R.-P.; formal analysis, E.O.-I., S.R.-G., M.E.M.-R., A.M.O.-T., F.T.-M., and C.E.R.-P.; investigation, E.O.-I. resources, E.O.-I.; data curation, E.O.-I., M.E.M.-R., and C.E.R.-P.; writing—original draft preparation, E.O.-I.; writing—review and editing, E.O.-I.; supervision, E.O.-I., M.E.M.-R., F.T.-M., and C.E.R.-P.; project administration, E.O.-I.; funding acquisition, E.O.-I. All authors have read and agreed to the published version of the manuscript.
Funding
This research was funded by Secretaría de Ciencia, Humanidades, Tecnología e Innovación (SECIHTI), México, grant number CBF2023-2024-1982.
Institutional Review Board Statement
Not applicable.
Informed Consent Statement
Not applicable.
Data Availability Statement
The original contributions presented in this study are included in the article. Further inquiries can be directed to the corresponding author.
Acknowledgments
S.R.G. acknowledges the SECIHTI-Mexico Master Fellowship (1349443).
Conflicts of Interest
The authors declare no conflicts of interest.
Abbreviations
The following abbreviations are used in this manuscript:
| TiO2 | Titanium dioxide |
| ROS | Reactive oxygen species |
| PDT | Photodynamic therapy |
| DNA | Deoxyribonucleic acid |
| UV | Ultraviolet |
| PS | Photosensitizer |
| PSES | Photosensitizer excited state |
| PSET | Photosensitizer excited triplet |
| WHO | World Health Organization |
| TMZ | Temozolomide |
| BBB | Blood–brain barrier |
| ZnPc | Zinc Phthalocyanine |
| FA | Folic acid |
| DPBF | 1,3-Diphenylisobenzofuran |
| SEM | Scanning electron microscopy |
| HR-TEM | High-resolution transmission electron microscopy |
| XRD | X-ray diffraction |
| TGA | Thermogravimetric analysis |
| VIS | Visible |
| EDS | Energy-dispersive spectroscopy |
| MTT | Tetrazolium bromide |
| FBS | Fetal bovine serum |
| DMEM | Dulbecco’s Modified Eagle |
| HOMO | Highest occupied molecular orbital |
| LUMO | Less unoccupied molecular orbital |
| Eg | Bandgap energy |
| BET | Brunauer–Emmett–Teller method |
| BJH | Barrett–Joyner–Halenda method |
References
- Racovita, A.D. Titanium dioxide: Structure, impact, and toxicity. Int. J. Environ. Res. Public Health 2022, 19, 5681. [Google Scholar] [CrossRef]
- Lugo-Ruiz, A.A.; Paz-Ruiz, M.J.; Bailón-Ruiz, S.J. Photodegradation of organic dyes in single and multi-component in the presence of titanium dioxide nanoparticles. MRS Adv. 2022, 7, 255–259. [Google Scholar] [CrossRef]
- Park, Y.K.; Kim, B.J.; Jeong, S.; Jeon, K.J.; Chung, K.H.; Jung, S.C. Characteristics of hydrogen production by photocatalytic water splitting using liquid phase plasma over Ag-doped TiO2 photocatalysts. Environ. Res. 2020, 188, 109630. [Google Scholar] [CrossRef]
- Manríquez-Ramírez, M.E.; Reza San German, C.; Estrada Flores, M.; Trejo Valdez, M.; Ortiz-Islas, E. Styrene oxide hydrogenation reaction using Pt/TiO2-ZrO2 supported catalysts for 2-phenylethanol production. Mater. Res. Bull. 2020, 128, 110872. [Google Scholar] [CrossRef]
- Morgunov, V.; Lytovchenko, S.; Chyshkala, V.; Riabchykov, D.; Matviienko, D. Comparison of anatase and rutile for photocatalytic applications: The short review. East Eur. J. Phys. 2021, 4, 18–30. [Google Scholar] [CrossRef]
- Grinberg, V.A.; Emets, V.V.; Tsodikov, M.V.; Mayorova, N.A.; Maslov, D.A. Photoelectrocatalytic degradation of organic compounds on nanoscale semiconductor materials. Prot. Met. Phys. Chem. Surf. 2021, 57, 699–712. [Google Scholar] [CrossRef]
- Akhter, P.; Arshad, A.; Saleem, A.; Hussain, M. Recent development in non-metal-doped titanium dioxide photocatalysts for different dyes degradation and the study of their strategic factors: A review. Catalysts 2022, 12, 1331. [Google Scholar] [CrossRef]
- Tsoi, C.C.; Huang, X.W.; Leung, P.H.M.; Wang, N.; Yu, W.X.; Jia, Y.W.; Li, Z.H.; Zhang, X.M. Photocatalytic ozonation for sea water decontamination. J. Water Process Eng. 2020, 37, 101501. [Google Scholar] [CrossRef]
- Silva, M.R.F.; Lourenço, M.A.O.; Tobaldi, D.M.; da Silva, C.F.; Seabra, M.P.; Ferreira, P. Carbon-modified titanium oxide materials for photocatalytic water and air decontamination. Chem. Eng. J. 2020, 387, 124099. [Google Scholar] [CrossRef]
- Lingaraju, K.; Basavaraj, R.B.; Jayanna, K.; Bhavana, S.; Devaraja, S.; Kumar Swamy, H.M.; Nagaraju, G.; Nagabhushana, H.; Naika, H.R. Biocompatible fabrication of TiO2 nanoparticles: Antimicrobial, anticoagulant, antiplatelet, direct hemolytic and cytotoxicity properties. Inorg. Chem. Commun. 2021, 127, 108505. [Google Scholar] [CrossRef]
- Pawar, T.J.; Contreras López, D.; Olivares Romero, J.L.; Vallejo Montesinos, J. Surface modification of titanium dioxide. J. Mater. Sci. 2023, 58, 6887–6930. [Google Scholar] [CrossRef]
- Öztürk, U.Ş.; Çitak, A. Synthesis of titanium dioxide nanoparticles with renewable resources and their applications: Review. Turk. J. Chem. 2022, 46, 1345–1357. [Google Scholar] [CrossRef]
- Sargazi, S.; Simge, E.R.; Gelen, S.S.; Rahdar, A.; Bilal, M.; Arshad, R.; Ajalli, N.; Khan, M.F.A.; Pandey, S. Application of titanium dioxide nanoparticles in photothermal and photodynamic therapy of cancer: An update and comprehensive review. J. Drug Deliv. Sci. Technol. 2022, 75, 103605. [Google Scholar] [CrossRef]
- Ramachandran, P.; Khor, B.K.; Lee, C.Y.; Doong, R.A.; Oon, C.E.; Thanh, N.T.K.; Lee, H.L. N-doped graphene quantum dots/titanium dioxide nanocomposites: A study of ROS-forming mechanisms, cytotoxicity and photodynamic therapy. Biomedicines 2022, 10, 421. [Google Scholar] [CrossRef] [PubMed]
- Hou, Y.K.; Mushtaq, A.; Tang, Z.; Dempsey, E.; Wu, Y.L.; Lu, Y.G.; Tian, C.; Farheen, J.; Kong, X.D.; Iqbal, M.Z. ROS-responsive Ag-TiO2 hybrid nanorods for enhanced photodynamic therapy of breast cancer and antimicrobial applications. J. Sci. Adv. Mater. Devices 2022, 7, 100417. [Google Scholar] [CrossRef]
- Flak, D.; Coy, E.; Nowaczyk, G.; Yate, L.; Jurg, S. Tuning the photodynamic efficiency of TiO2 nanotubes against HeLa cancer cells by Fe-doping. RSC Adv. 2015, 5, 85139–85152. [Google Scholar] [CrossRef]
- Fakhar-e-Alam, M.; Aqrab-ul-Ahmad; Atif, M.; Alimgeer, K.S.; Rana, M.S.; Yaqub, N.; Farooq, W.A.; Ahmad, H. Synergetic effect of TEMPO-coated TiO2 nanorods for PDT applications in MCF-7 cell line model. Saudi J. Biol. Sci. 2020, 27, 3199–3207. [Google Scholar] [CrossRef] [PubMed]
- Lin, S.L.; Chen, H.C.; Chang, C.A. Enhancing Förster resonance energy transfer (FRET) efficiency of titania–lanthanide hybrid upconversion nanomaterials by shortening the donor–acceptor distance. Nanomaterials 2020, 10, 2035. [Google Scholar] [CrossRef]
- Ziental, D.; Czarczynska-Goslinska, B.; Mlynarczyk, D.T.; Glowacka-Sobotta, A.; Stanisz, B.; Goslinski, T.; Sobotta, L. Titanium dioxide nanoparticles: Prospects and applications in medicine. Nanomaterials 2020, 10, 387. [Google Scholar] [CrossRef]
- Youssef, Z.; Vanderesse, R.; Colombeau, L.; Baros, F.; Roques-Carmes, T.; Frochot, C.; Wahab, H.; Toufaily, J.; Hamieh, T.; Acherar, S.; et al. The application of titanium dioxide, zinc oxide, fullerene, and graphene nanoparticles in photodynamic therapy. Cancer Nano. 2017, 8, 6. [Google Scholar] [CrossRef]
- Aebisher, D.; Szpar, J.; Bartusik-Aebisher, D. Advances in medicine: Photodynamic therapy. Int. J. Mol. Sci. 2024, 25, 8258. [Google Scholar] [CrossRef]
- Aebisher, D.; Rogoz, K.; Mysliwiec, A.; Dynarowicz, K.; Wiench, R.; Cieslar, G.; Kawczyk-Krupka, A.; Bartusik-Aebisher, D. The use of photodynamic therapy in medical practice. Front. Oncol. 2024, 14, 1373263. [Google Scholar] [CrossRef]
- Dong, C.; Yi, Q.; Fang, W.; Zhang, J. A mini review of nanomaterials on photodynamic therapy. J. Photochem. Photobiol. C Photochem. Rev. 2023, 54, 100568. [Google Scholar] [CrossRef]
- Li, H.X.; Shen, J.J.; Zheng, C.F.; Zhu, P.; Yang, H.; Huang, Y.X.; Mao, X.R.; Yang, Z.L.; Hu, G.D.; Chen, Y.H. Cell death: The underlying mechanisms of photodynamic therapy for skin diseases. Interdiscip. Med. 2024, 3, e20240057. [Google Scholar] [CrossRef]
- Kwiatkowski, S.; Knap, B.; Przystupski, D.; Saczko, J.; Kędziersk, E.; Knap-Czop, K.; Kotlińsk, J.; Michel, O.; Kotowski, K.; Kulbacka, J. Photodynamic therapy–mechanisms, photosensitizers and combinations. Biomed. Pharmacother. 2018, 106, 1098–1107. [Google Scholar] [CrossRef]
- Allison, R.R.; Sibata, C.H. Oncologic photodynamic therapy photosensitizers: A clinical review. Photodiagnosis Photodyn. Ther. 2010, 7, 61–75. [Google Scholar] [CrossRef]
- Mfouo-Tynga, I.S.; Dias, L.D.; Inada, N.M.; Kurachi, C. Features of third generation photosensitizers used in anticancer photodynamic therapy: Review. Photodiagnosis Photodyn. Ther. 2021, 34, 102091. [Google Scholar] [CrossRef]
- Xiao, Q.; Wu, J.; Pang, X.; Jiang, Y.; Wang, P.; Leung, A.W.; Gao, L.; Jiang, S.; Xu, C. Discovery and development of natural products and their derivatives as photosensitizers for photodynamic therapy. Curr. Med. Chem. 2018, 25, 839–860. [Google Scholar] [CrossRef]
- Allamyradov, Y.; ben Yosef, J.; Annamuradov, B.; Ateyeh, M.; Street, C.; Whipple, H.; Er, A.O. Photodynamic therapy review: Past, present, future, opportunities and challenges. Photochem 2024, 4, 434–461. [Google Scholar] [CrossRef]
- Korupalli, C.; You, K.L.; Getachew, G.; Fahmi, M.Z.; Chang, J.Y. Engineering the surface of Ti3C2 MXene nanosheets for high stability and multimodal anticancer therapy. Pharmaceutics 2022, 14, 304. [Google Scholar] [CrossRef]
- Chen, J.M.; Fan, T.J.; Xie, Z.J.; Zeng, Q.Q.; Xue, P.; Zheng, T.T.; Chen, Y.; Luo, X.L.; Zhang, H. Advances in nanomaterials for photodynamic therapy applications: Status and challenges. Biomaterials 2020, 237, 119827. [Google Scholar] [CrossRef]
- Ma, S.H.; Jiang, L.X.; Yang, W.J.; Liu, F.; Wang, D.; Wang, F.; Huang, J. Advances of nanomaterials in cancer photocatalysis therapy. Mater. Today Sustain. 2025, 29, 101023. [Google Scholar] [CrossRef]
- Liu, L.; Yang, M.; Chen, Z. Surface functionalized nanomaterial systems for targeted therapy of endocrine related tumors: A review of recent advancements. Drug Deliv. 2024, 31, 2390022. [Google Scholar] [CrossRef]
- Persano, L.; Rampazzo, E.; Basso, G.; Viola, G. Glioblastoma cancer stem cells: Role of the microenvironment and therapeutic targeting. Biochem. Pharmacol. 2013, 85, 612–622. [Google Scholar] [CrossRef]
- Johnson, D.R.; O’Neill, B.P. Glioblastoma survival in the United States before and during the temozolomide era. J. Neurooncol. 2012, 107, 359–364. [Google Scholar] [CrossRef]
- Adnane, F.; El-Zayat, E.; Fahmy, H.M. The combinational application of photodynamic therapy and nanotechnology in skin cancer treatment: A review. Tissue Cell 2022, 77, 101856. [Google Scholar] [CrossRef]
- Yoon, Y.; Kim, S.; Choi, H.C. Selective growth of α-form zinc phthalocyanine nanowire crystals via the flow rate control of physical vapor transport. NPG Asia Mater. 2020, 12, 16. [Google Scholar] [CrossRef]
- Zhu, K.; Wang, C.; Liu, J.; Wang, W.; Lv, Y.; Wang, P.; Meng, A.; Li, Z. Facile fabrication of ZnPc sensitized g-C3N4 through ball milling method toward an enhanced photocatalytic property. J. Asian Ceram. Soc. 2020, 8, 939–947. [Google Scholar] [CrossRef]
- Savio, A.K.P.D.; Fletcher, J.; Smith, K.; Iyer, R.; Bao, J.M.; Robles Hernández, F.C. Environmentally effective photocatalyst CoO–TiO2 synthesized by thermal precipitation of Co in amorphous TiO2. Appl. Catal. B Environ. 2016, 182, 449–455. [Google Scholar] [CrossRef]
- Alvarez, L.; Almadori, Y.; Mariot, S.; Aznar, R.; Arenal, R.; Michel, T.; Le Parc, R.; Dieudonné, P.; Jousselme, B.; Campidelli, S.; et al. New insights on photo-active molecules within host carbon nanotubes. J. Nanoelectron. Optoelectron. 2013, 8, 28–35. [Google Scholar] [CrossRef]
- Das, N.M.; Singh, A.K.; Ghosh, D.; Bandyopadhyay, D. Graphene oxide nanohybrids for electron transfer mediated antimicrobial activity. Nanoscale Adv. 2019, 1, 3727–3740. [Google Scholar] [CrossRef]
- López, T.; Ortiz-Islas, E.; Guevara, P.; Rios, J.V. Preparation and characterization of copper compounds co-gelled with nanostructured TiO2 materials to be used in cancer treatment. Sci. Adv. Mater. 2012, 4, 579–583. [Google Scholar] [CrossRef]
- Demir, F.; Yenilmez, H.Y.; Koca, A.; Bayır, Z.A. Synthesis, electrochemistry, and electrocatalytic activity of thiazole substituted phthalocyanine complexes. J. Solid State Electrochem. 2022, 26, 761–772. [Google Scholar] [CrossRef]
- Acar, I.; Bıyıklıoglu, Z.; Durmus, M.; Kantekin, H. Synthesis, characterization and comparative studies on the photophysical and photochemical properties of peripherally and non-peripherally tetra-substituted zinc(II) phthalocyanines. J. Organomet. Chem. 2012, 708, 65–74. [Google Scholar] [CrossRef]
- Thabet, R.H.; Alessa, R.E.M.; Al-Smadi, Z.K.K.; Alshatnawi, B.S.G.; Amayreh, B.M.I.; Al-Dwaaghreh, R.B.A.; Salah, S.K.A. Folic acid: Friend or foe in cancer therapy. J. Int. Med. Res. 2024, 52, 03000605231223064. [Google Scholar] [CrossRef]
- Kumar, P.; Huo, P.; Liu, B. Formulation Strategies for Folate-Targeted Liposomes and Their Biomedical Applications. Parmaceutics 2019, 11, 381. [Google Scholar] [CrossRef]
- Barrino, F. Hybrid organic–inorganic materials prepared by sol-gel and sol-gel-coating method for biomedical use: Study and synthetic review of synthesis and properties. Coatings 2024, 14, 425. [Google Scholar] [CrossRef]
- Willkomm, J.; Orchard, K.L.; Reynal, A.; Pastor, E.; Durrant, J.R.; Reisner, E. Dye-sensitised semiconductors modified with molecular catalysts for light-driven H2 production. Chem. Soc. Rev. 2016, 45, 9–23. [Google Scholar] [CrossRef]
- Zamojc, K.; Zdrowowicz, M.; Rudnicki-Velasquez, P.B.; Krzyminski, K.; Zaborowski, B.; Niedziałkowski, P.; Jacewicz, D.; Chmurzynsk, L. The development of 1,3-diphenylisobenzofuran as a highly selective probe for the detection and quantitative determination of hydrogen peroxide. Free Radic. Res. 2017, 51, 38–46. [Google Scholar] [CrossRef]
- Diserens, A.C.; de Tribolet, N.; Martin-Achard, A.; Gaide, A.C.; Schnegg, J.F.; Carrel, S. Characterization of an Established Human Malignant Glioma Cell Line: LN-18. Acta Neuropathol. 1981, 53, 21–28. [Google Scholar] [CrossRef]
Disclaimer/Publisher’s Note: The statements, opinions and data contained in all publications are solely those of the individual author(s) and contributor(s) and not of MDPI and/or the editor(s). MDPI and/or the editor(s) disclaim responsibility for any injury to people or property resulting from any ideas, methods, instructions or products referred to in the content. |
© 2025 by the authors. Licensee MDPI, Basel, Switzerland. This article is an open access article distributed under the terms and conditions of the Creative Commons Attribution (CC BY) license (https://creativecommons.org/licenses/by/4.0/).