
The Beneficial Additive Effect of Silymarin in Metformin Therapy of Liver Steatosis in a Pre-Diabetic Model

 , , , , ,
Abstract
:1. Introduction
2. Materials and Methods
2.1. Animal Model, Diet and Drugs
2.2. Biochemical Analysis of Serum
2.3. Biochemical Analysis of Tissues
2.4. Fatty Acid Composition and Fatty Acid Desaturase Activity in the Liver
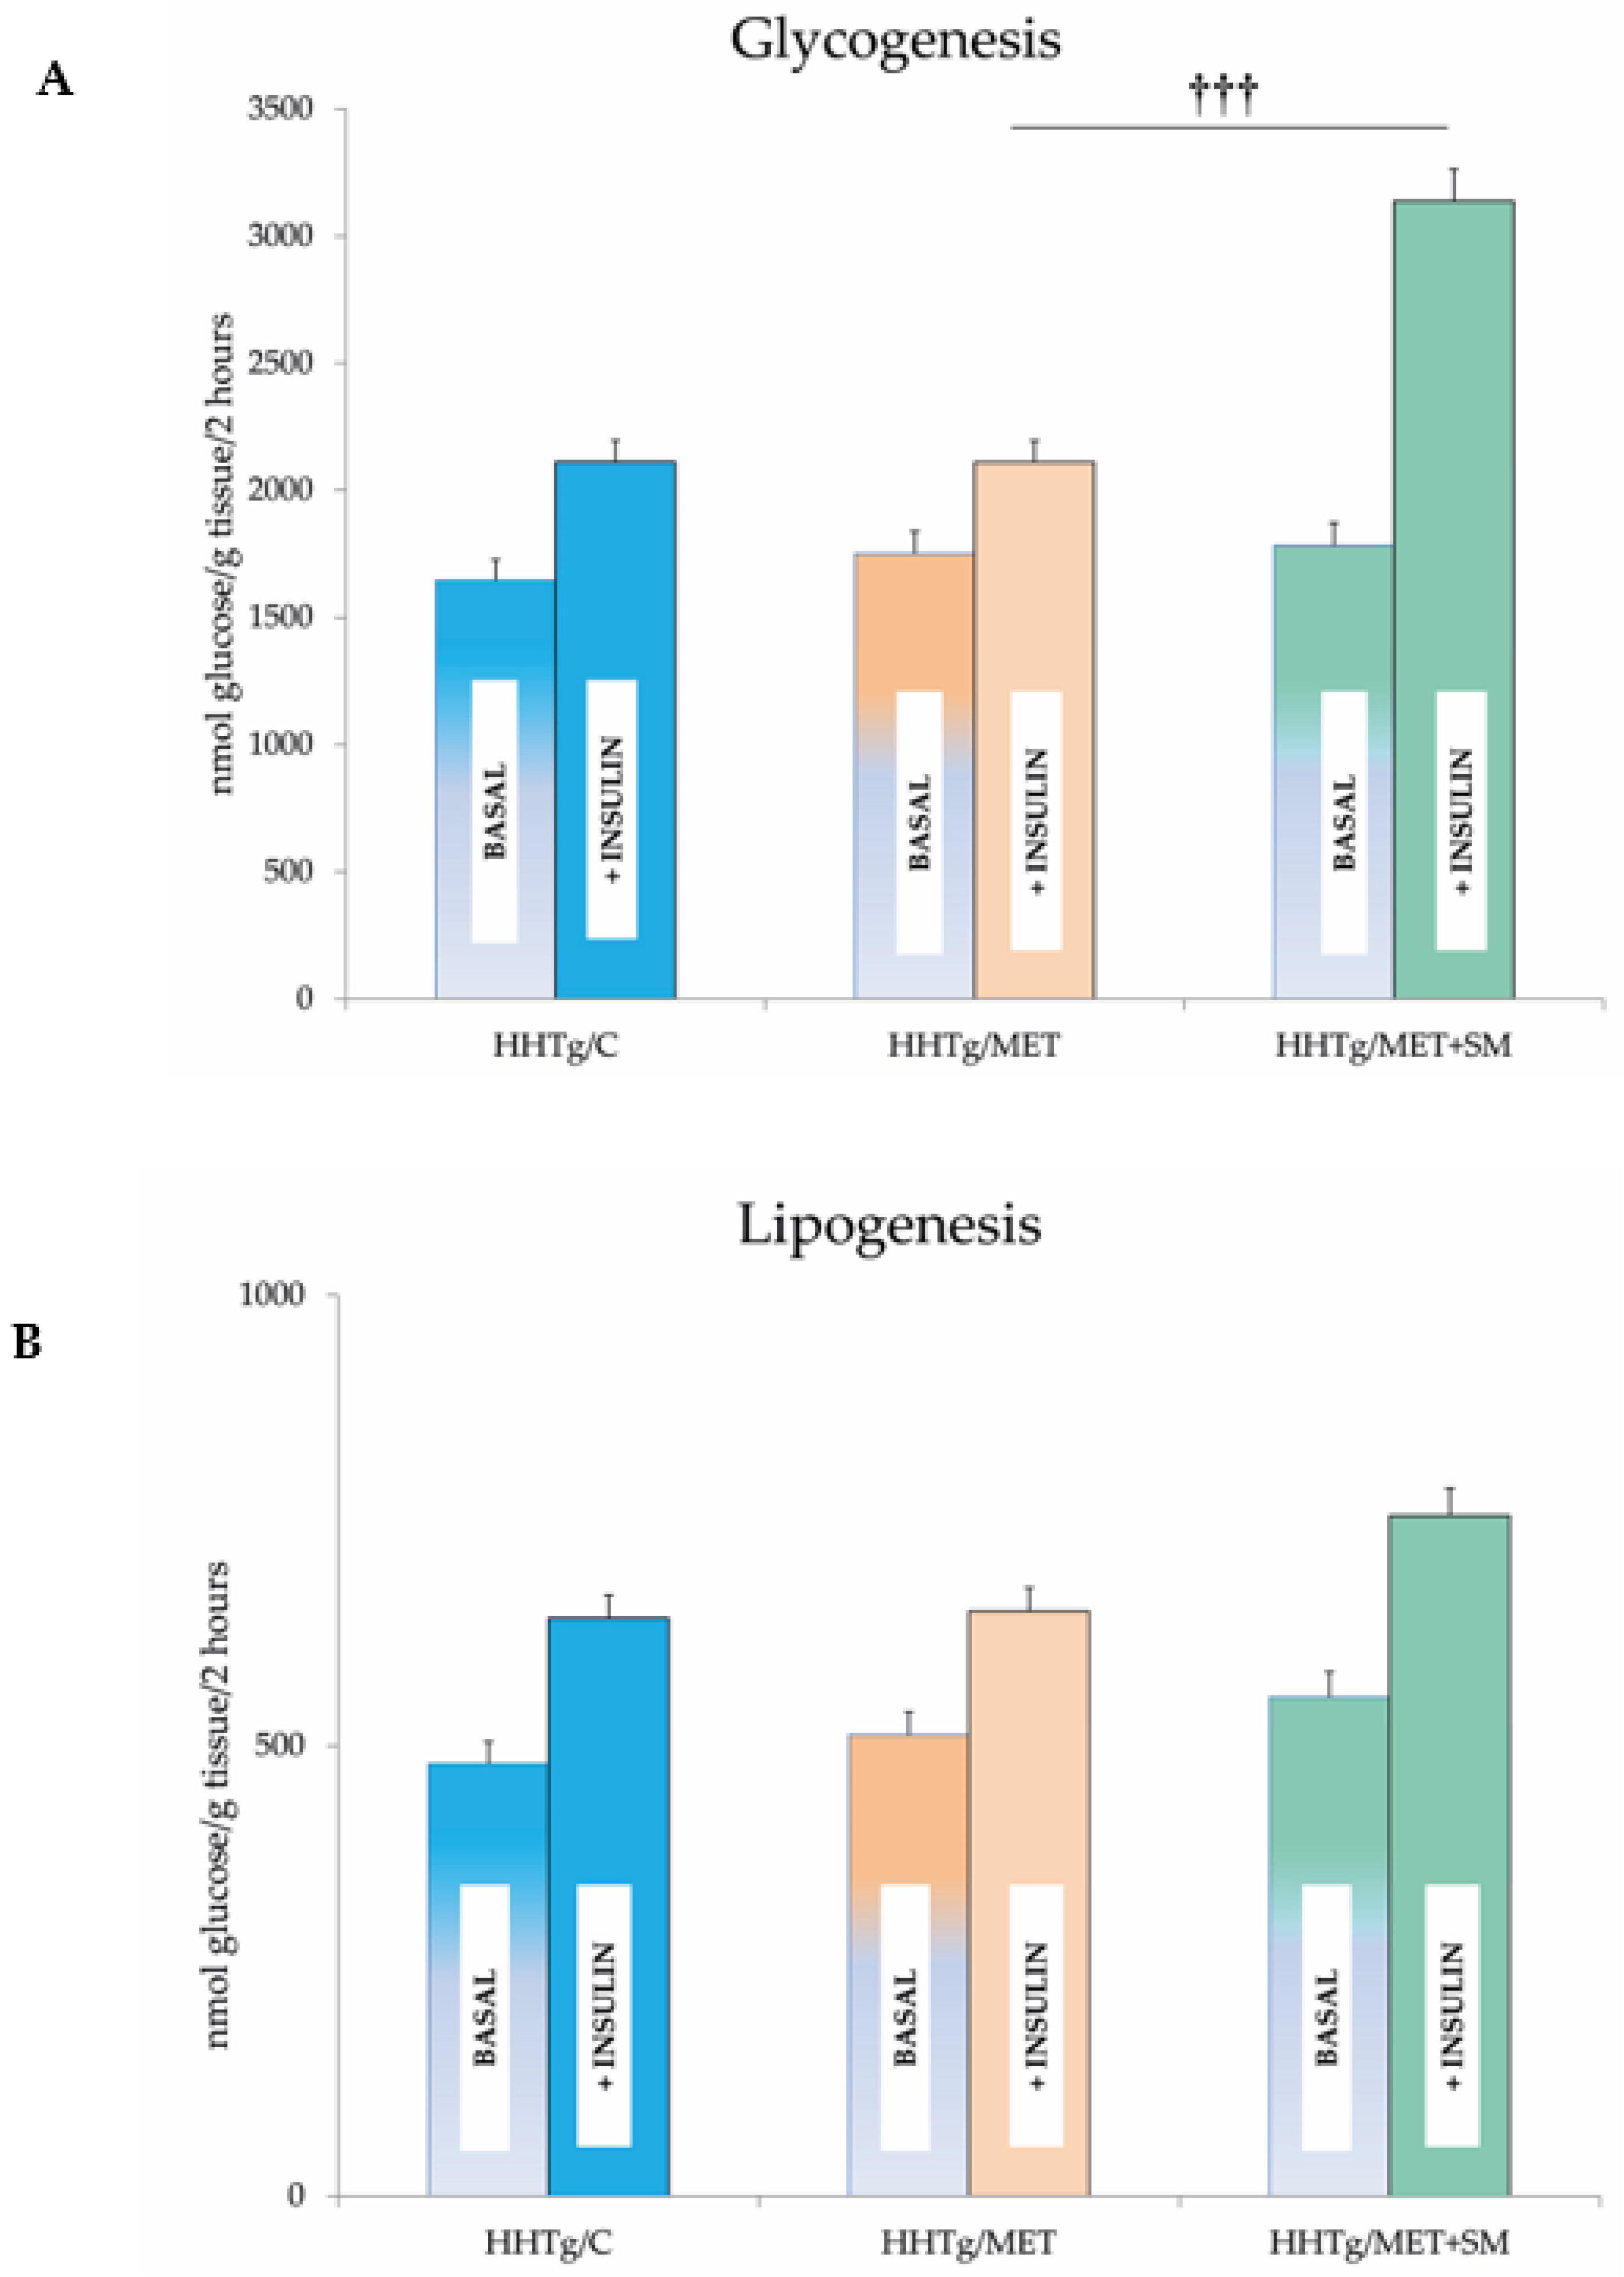
2.5. Tissue Insulin Sensitivity
2.6. Oxidative Stress Parameters
2.7. Histological Evaluation
2.8. Relative mRNA Expression
2.9. Statistical Analysis
3. Results
3.1. Effect of Metformin Monotherapy
3.2. Effect of Metformin and Silymarin Combination Therapy on Basal Metabolic Parameters
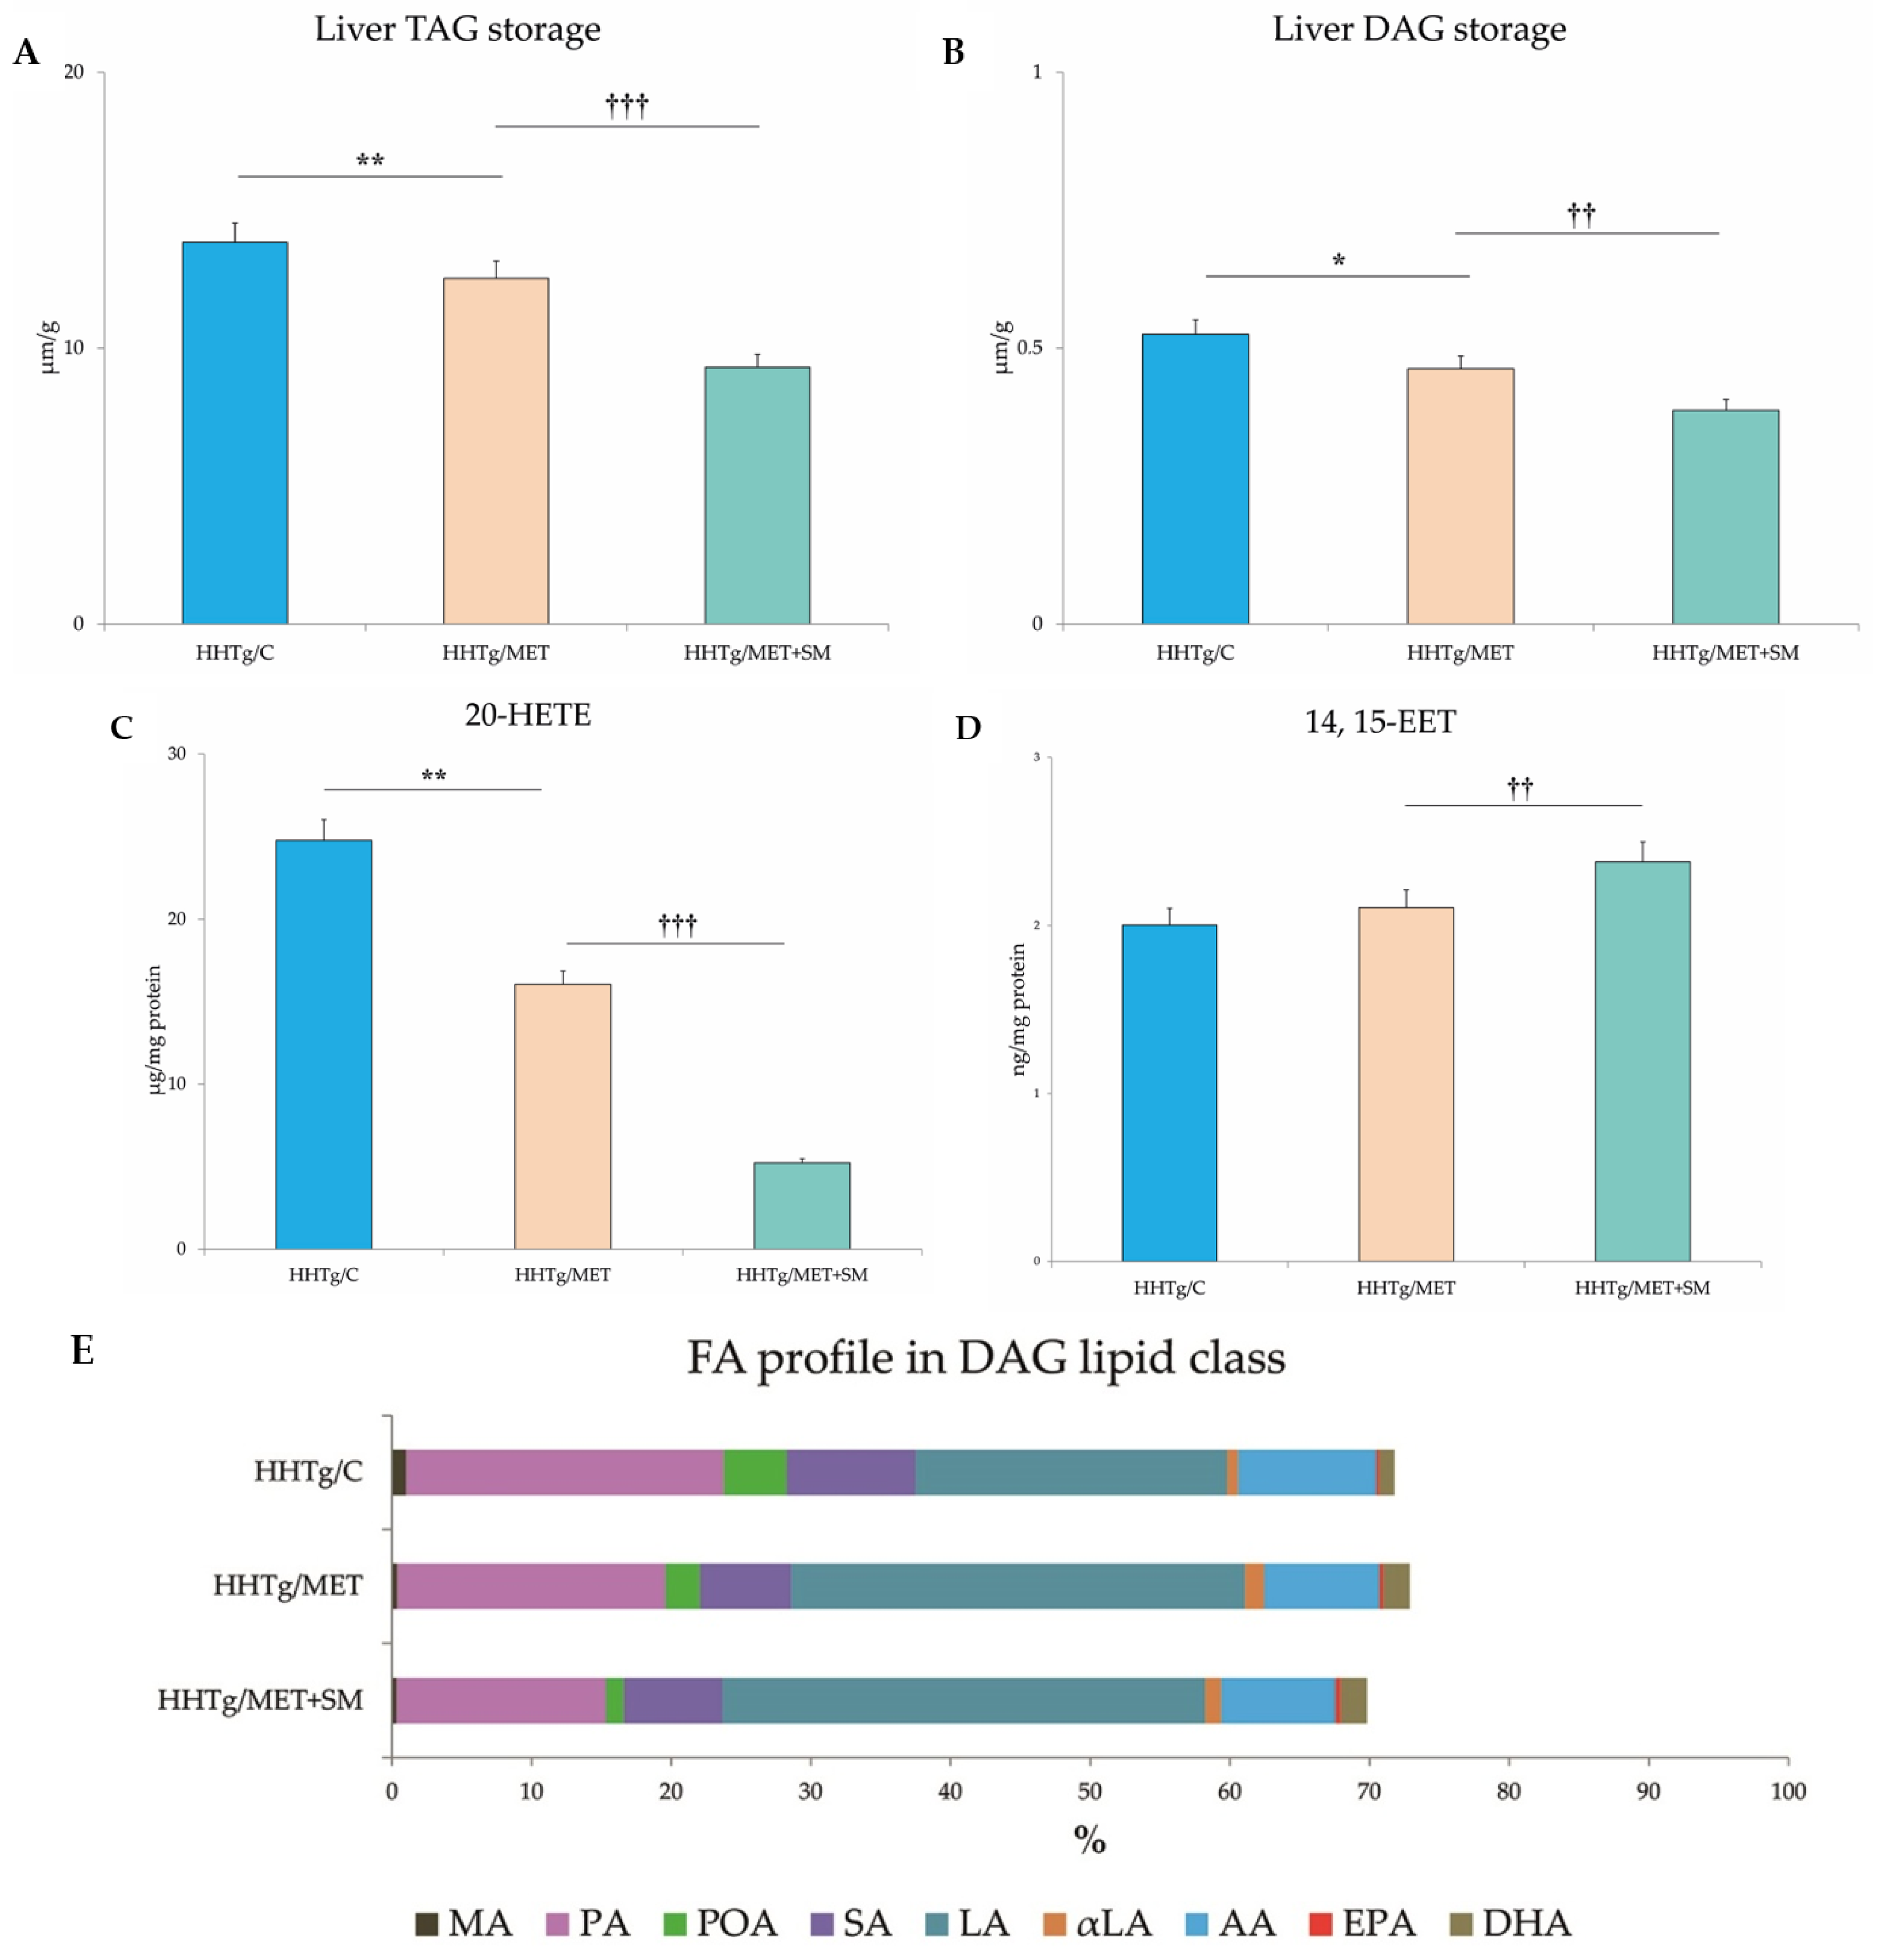
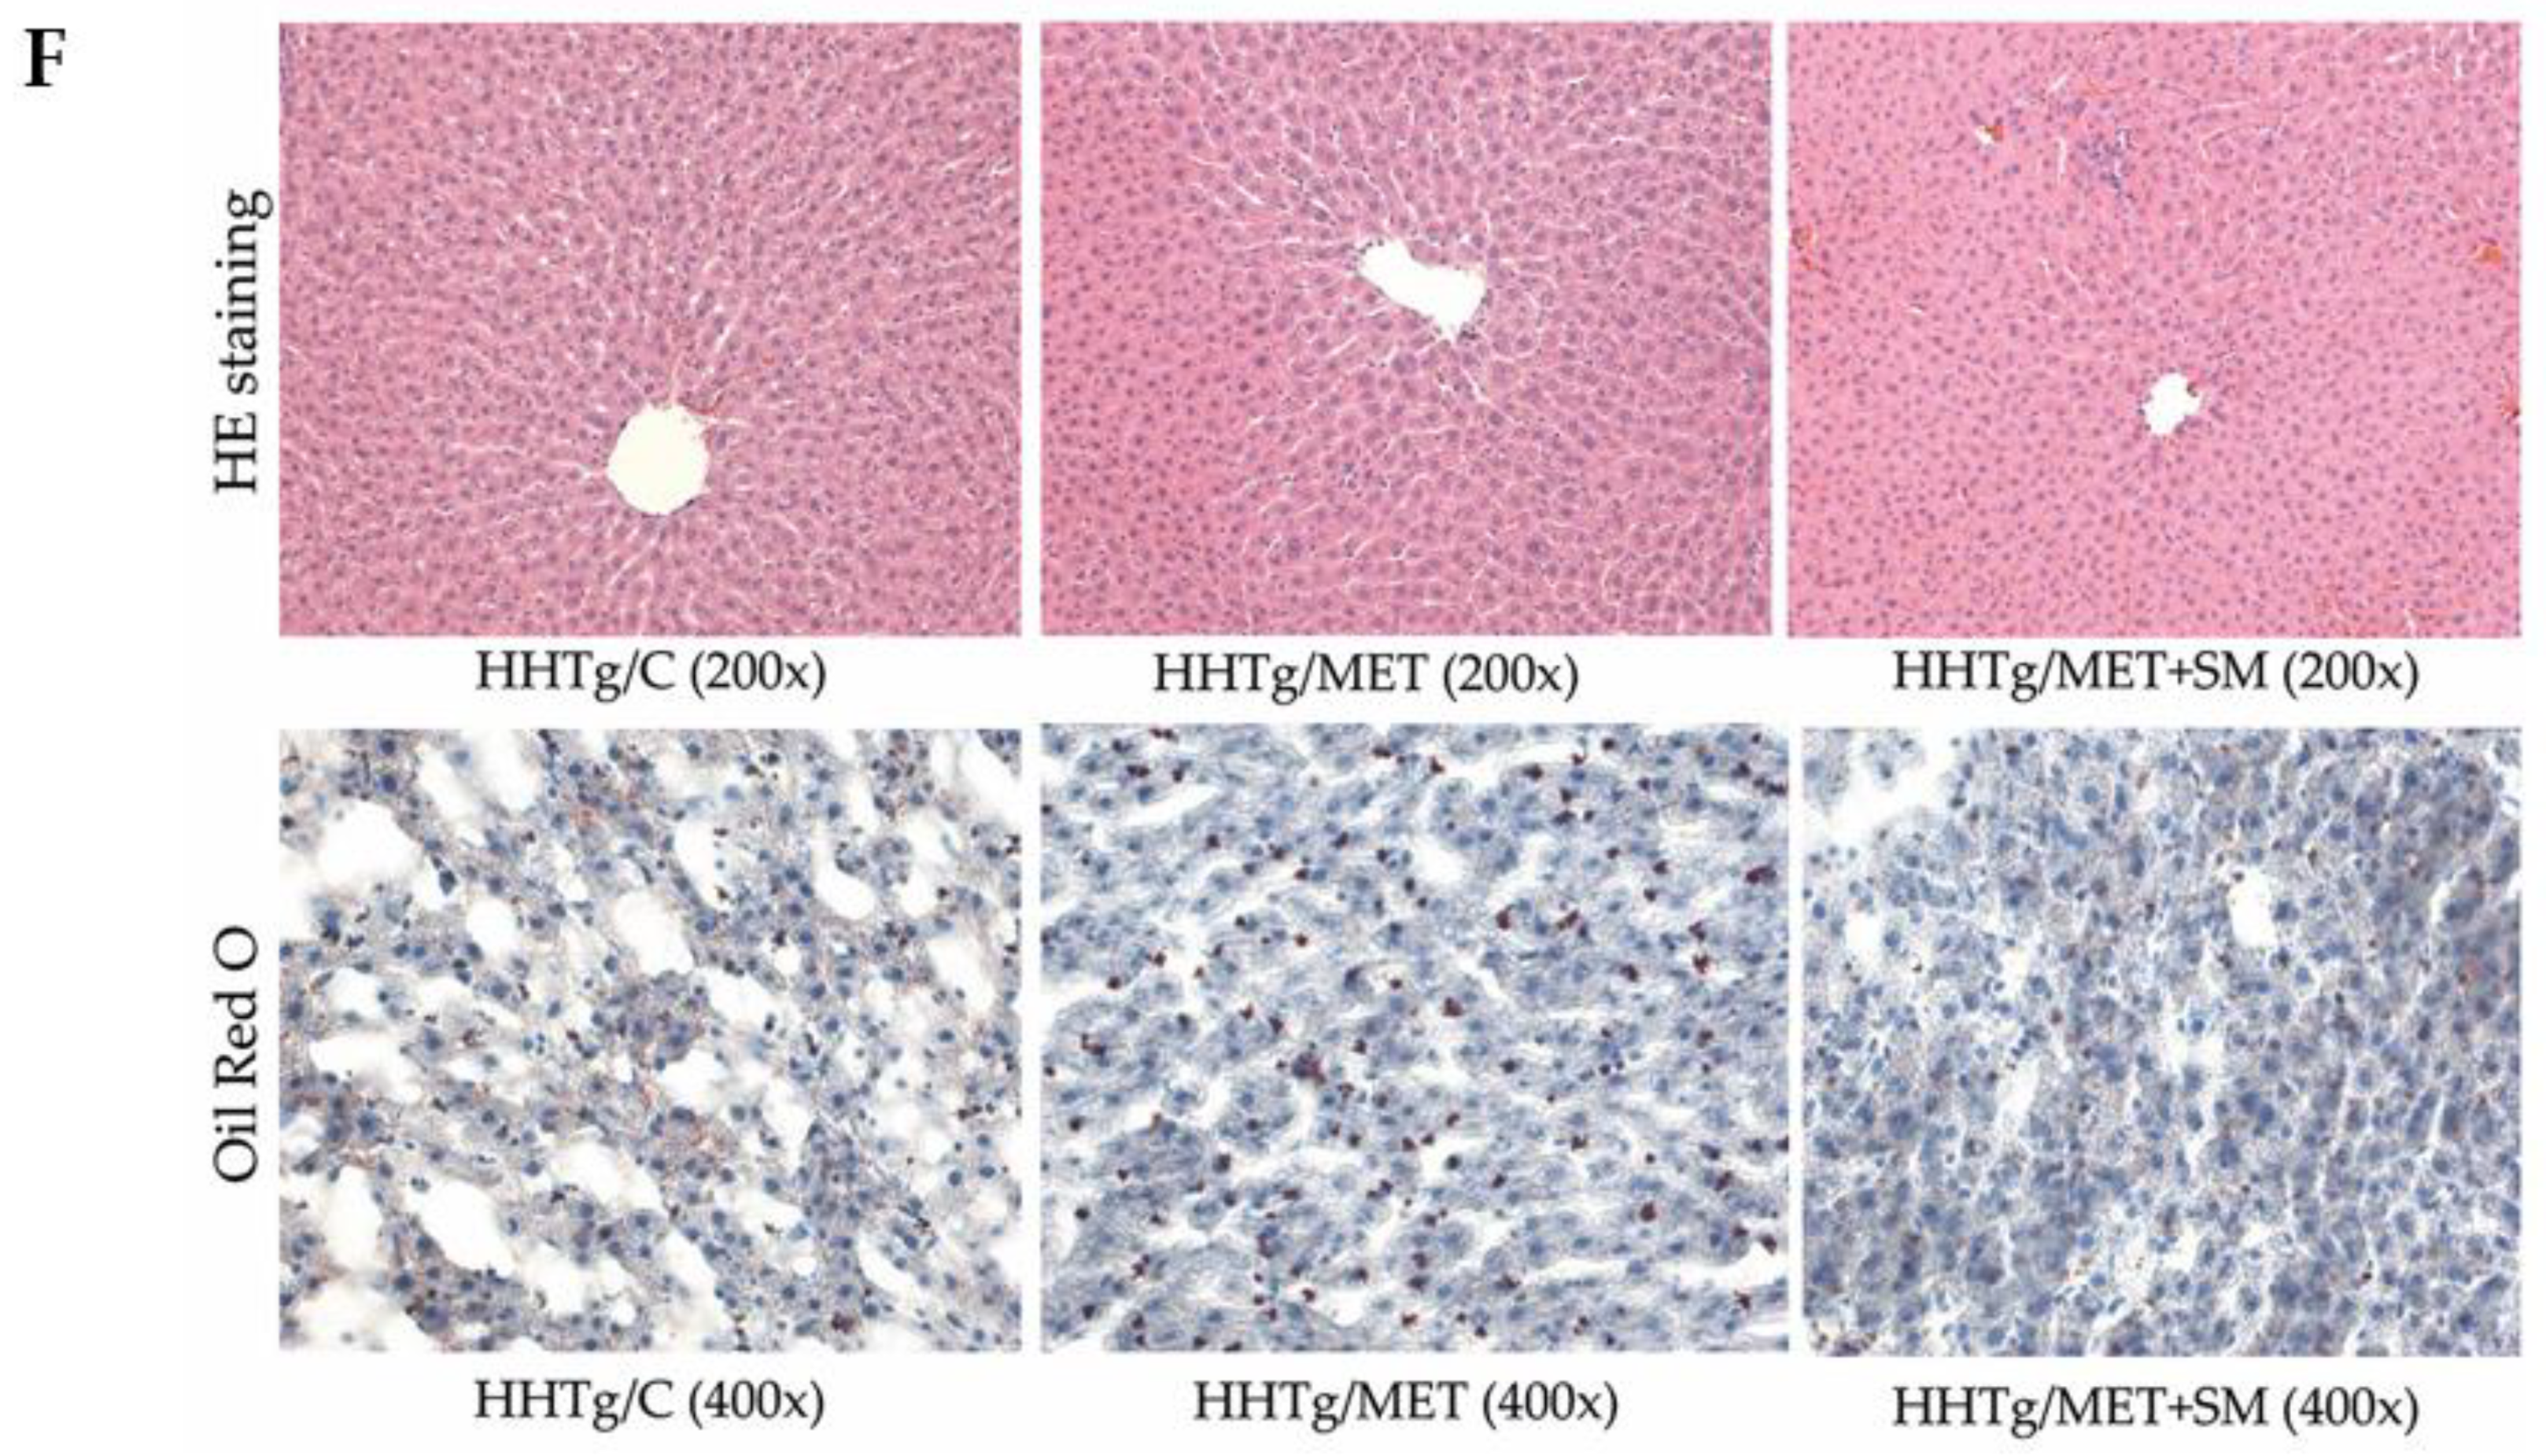
3.3. Effect of Metformin and Silymarin Combination Therapy on Hepatic Lipid Storage, Lipotoxic Intermediates, and Fatty Acid Profiles
3.4. Effect of Metformin and Silymarin Combination Therapy on Hepatic Oxidative Stress
3.5. Effect of Metformin and Silymarin Combination Therapy on Inflammation Parameters
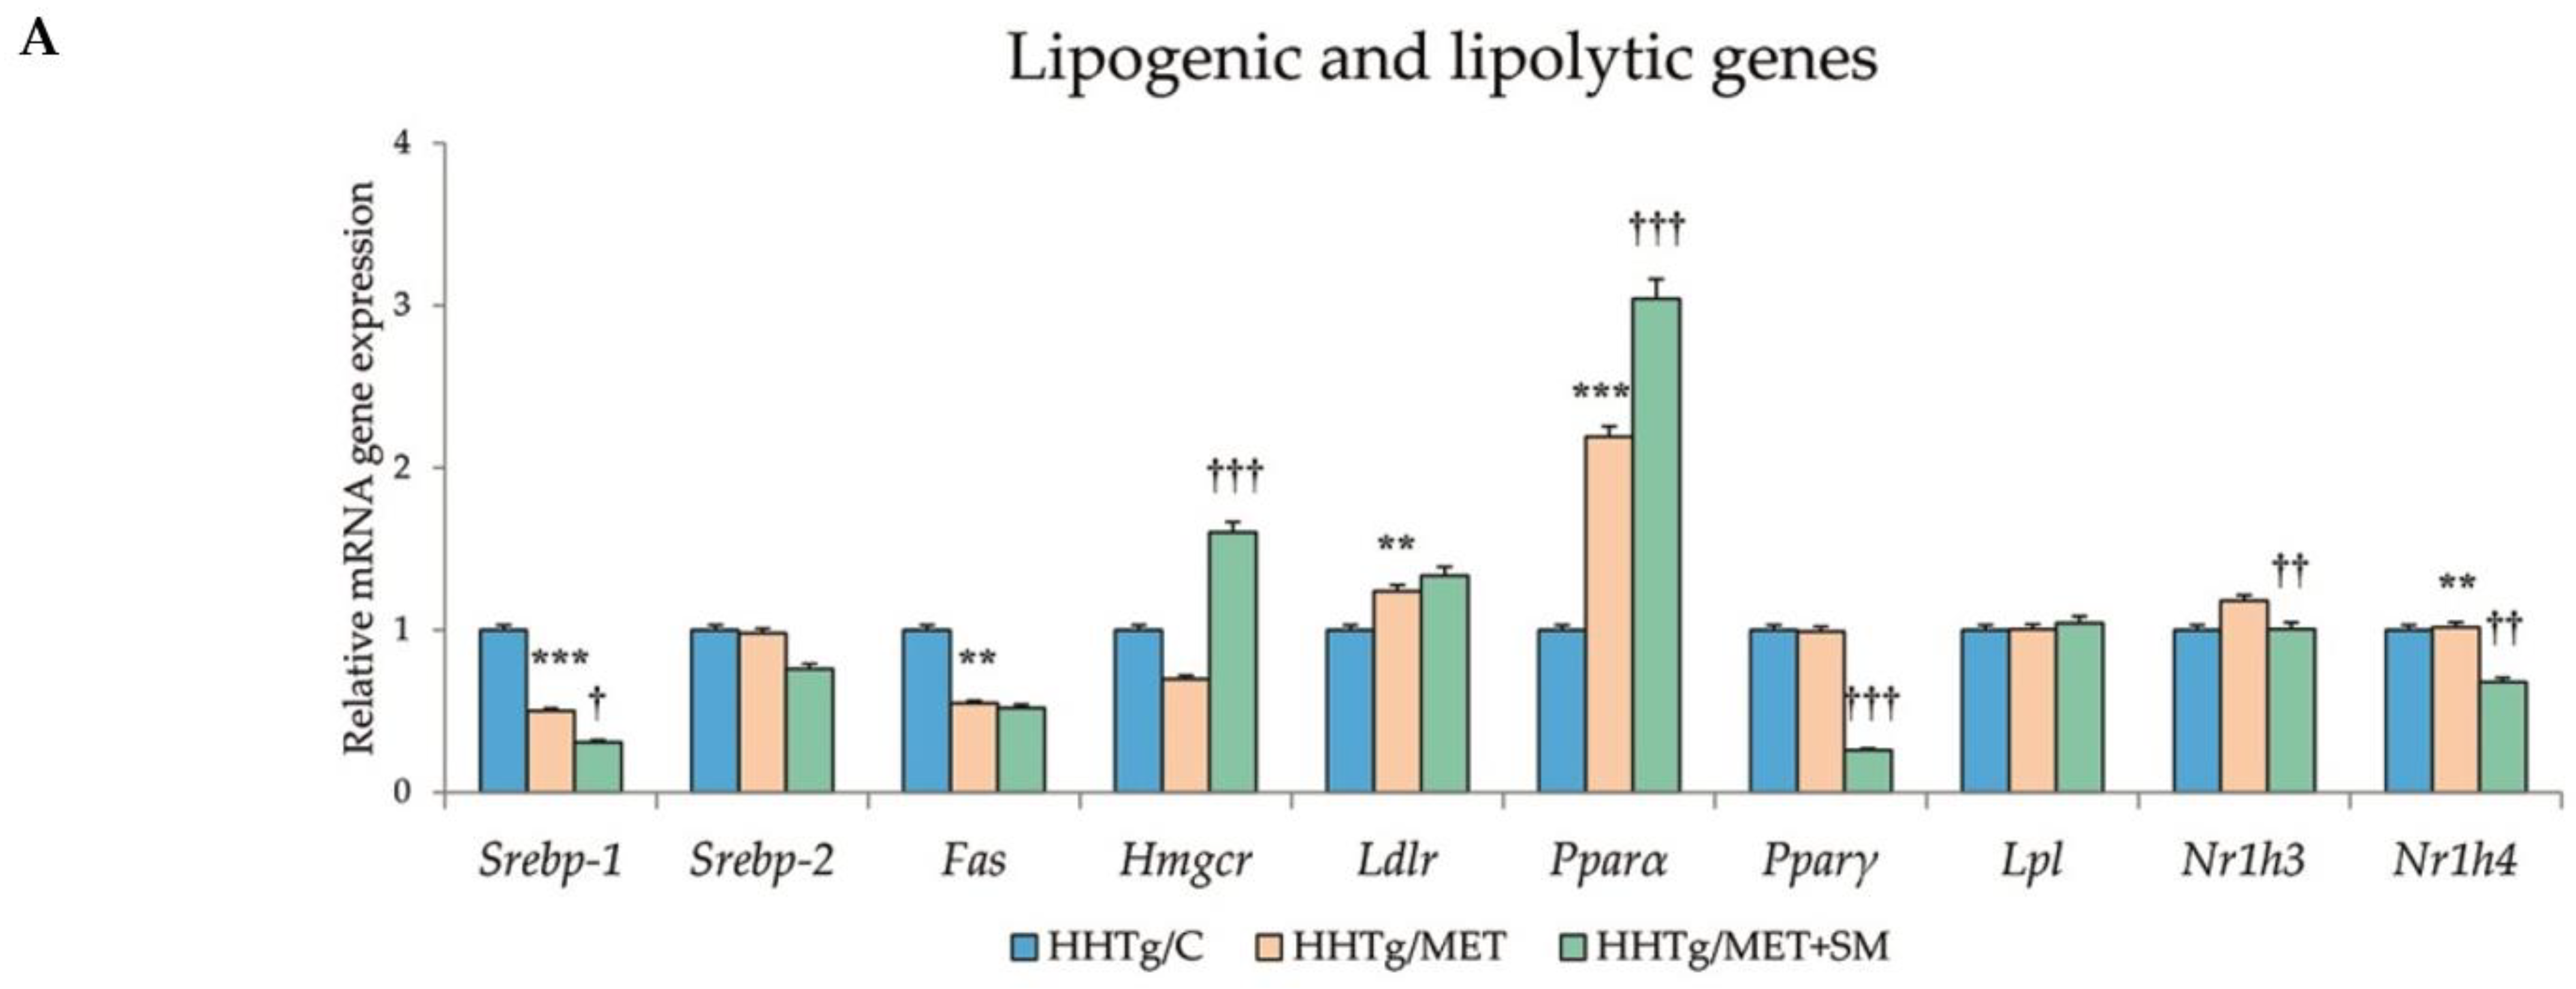
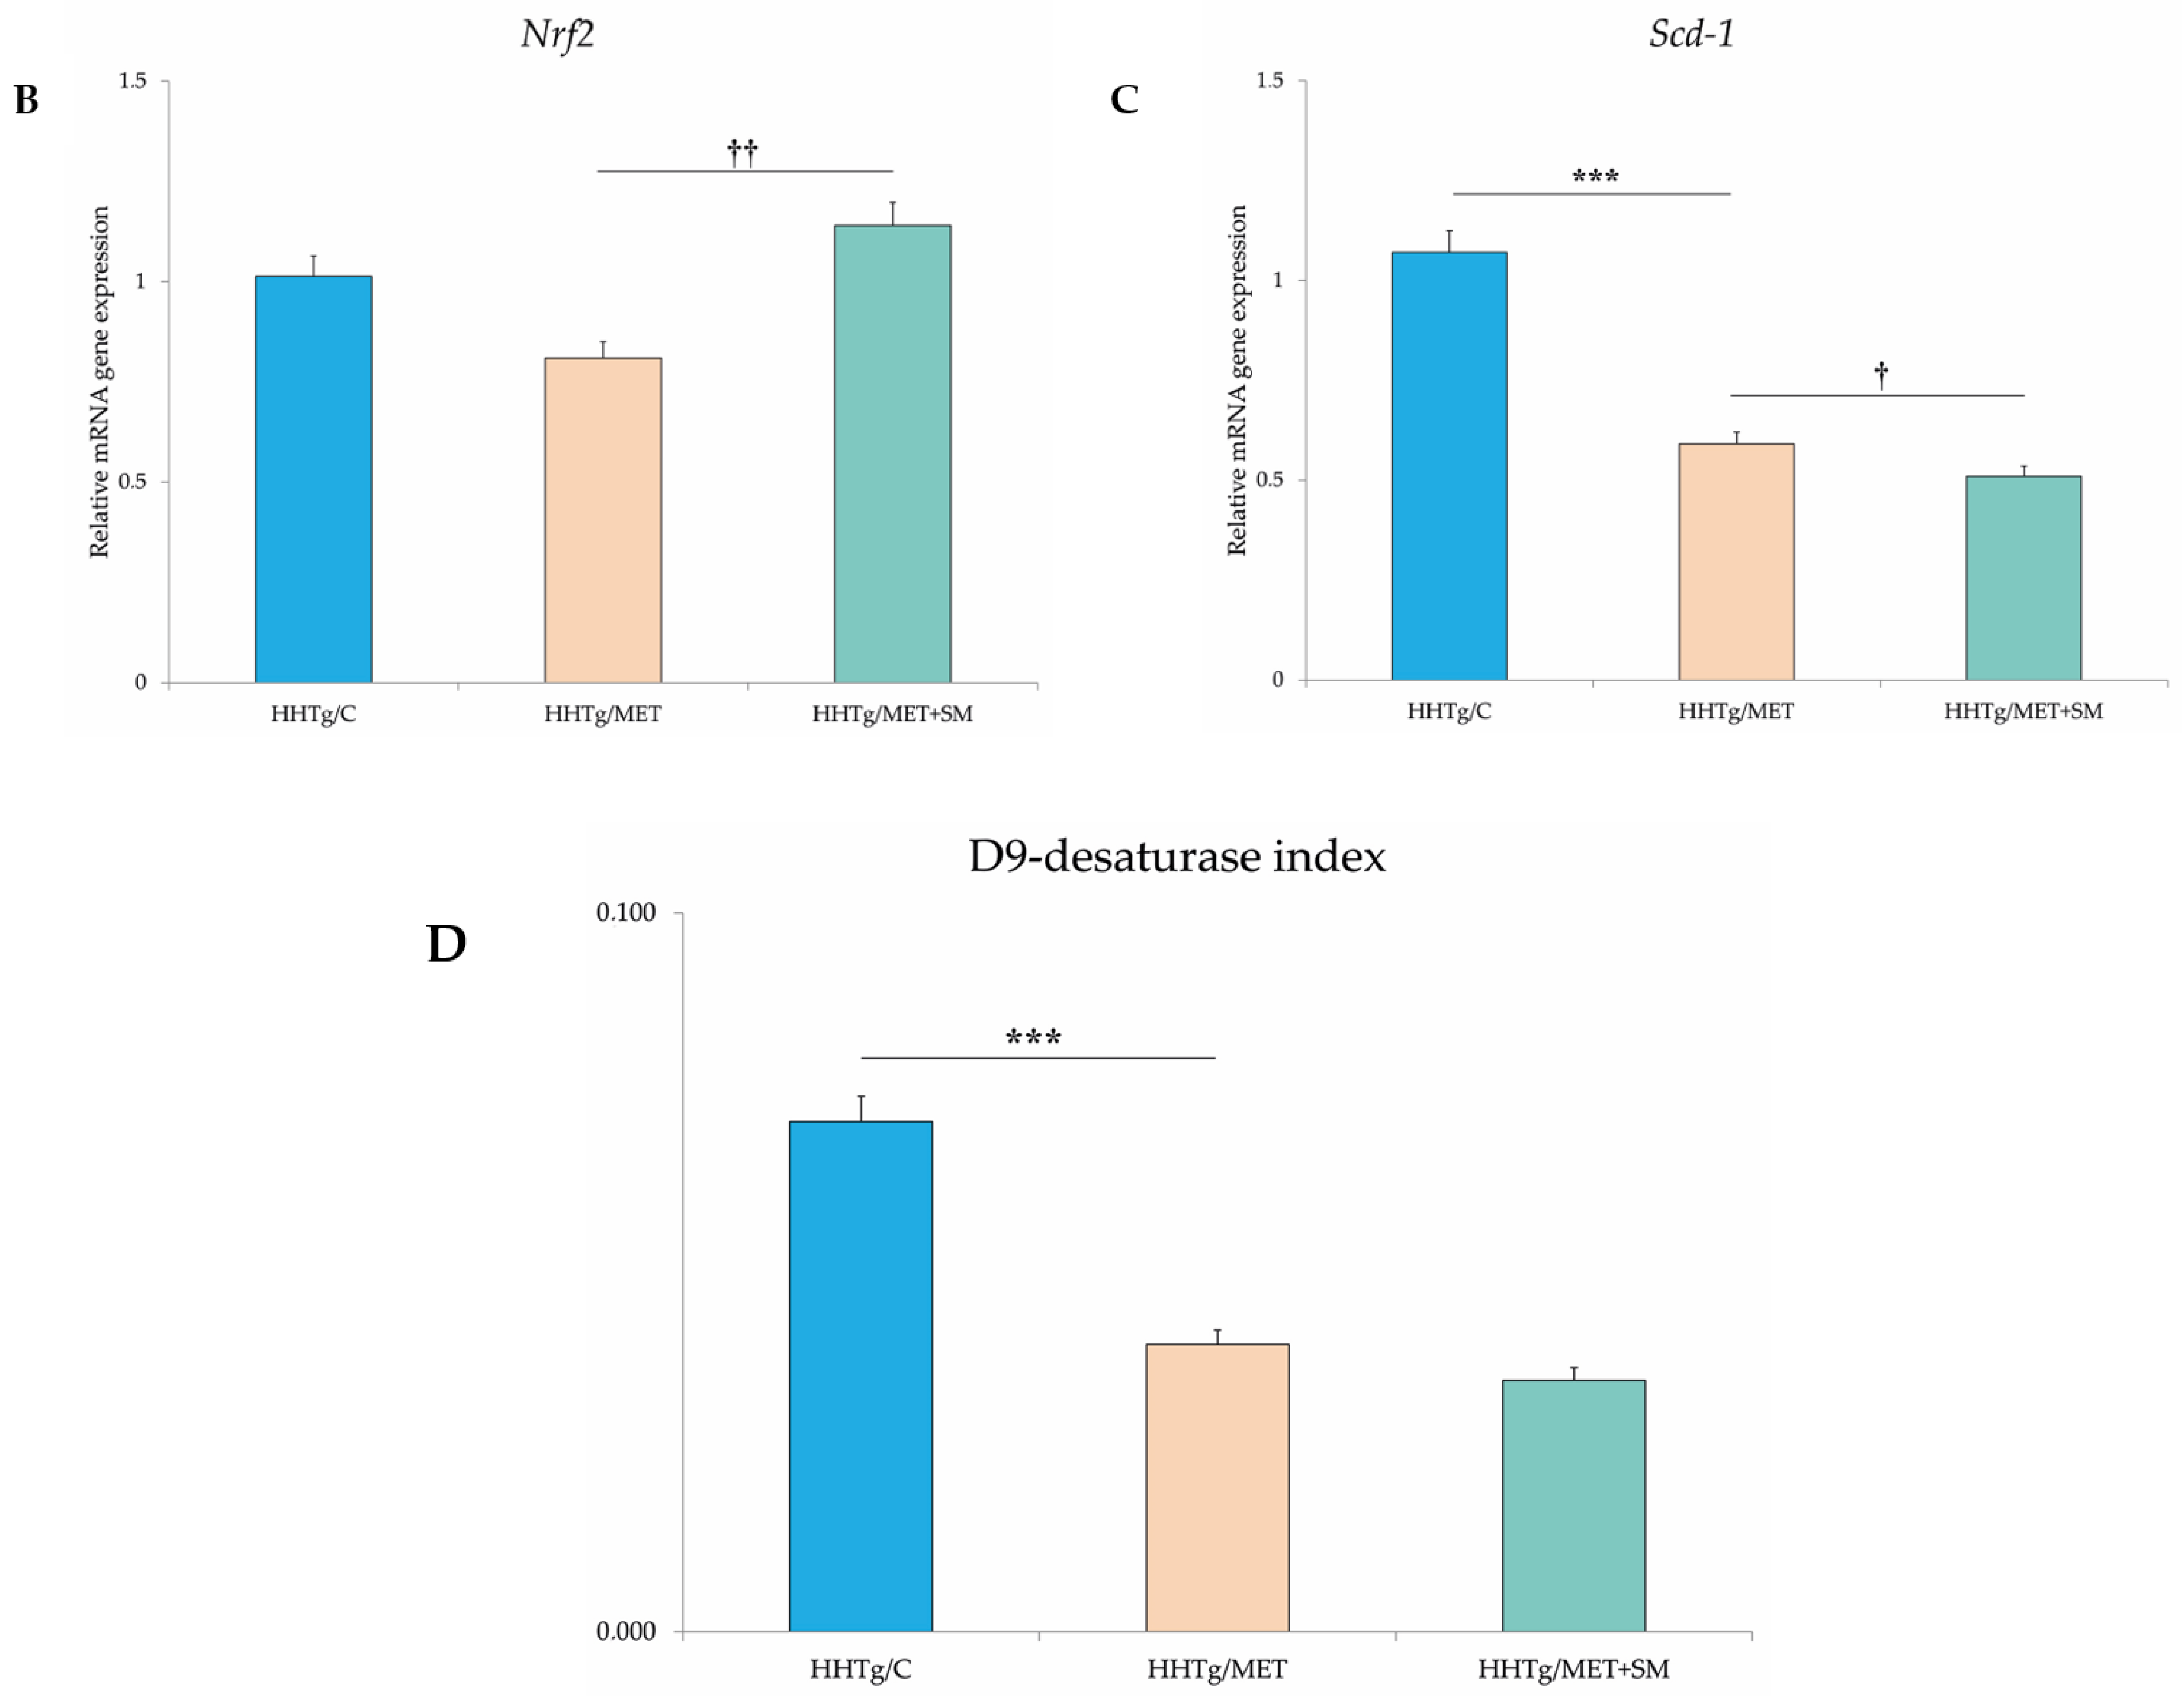
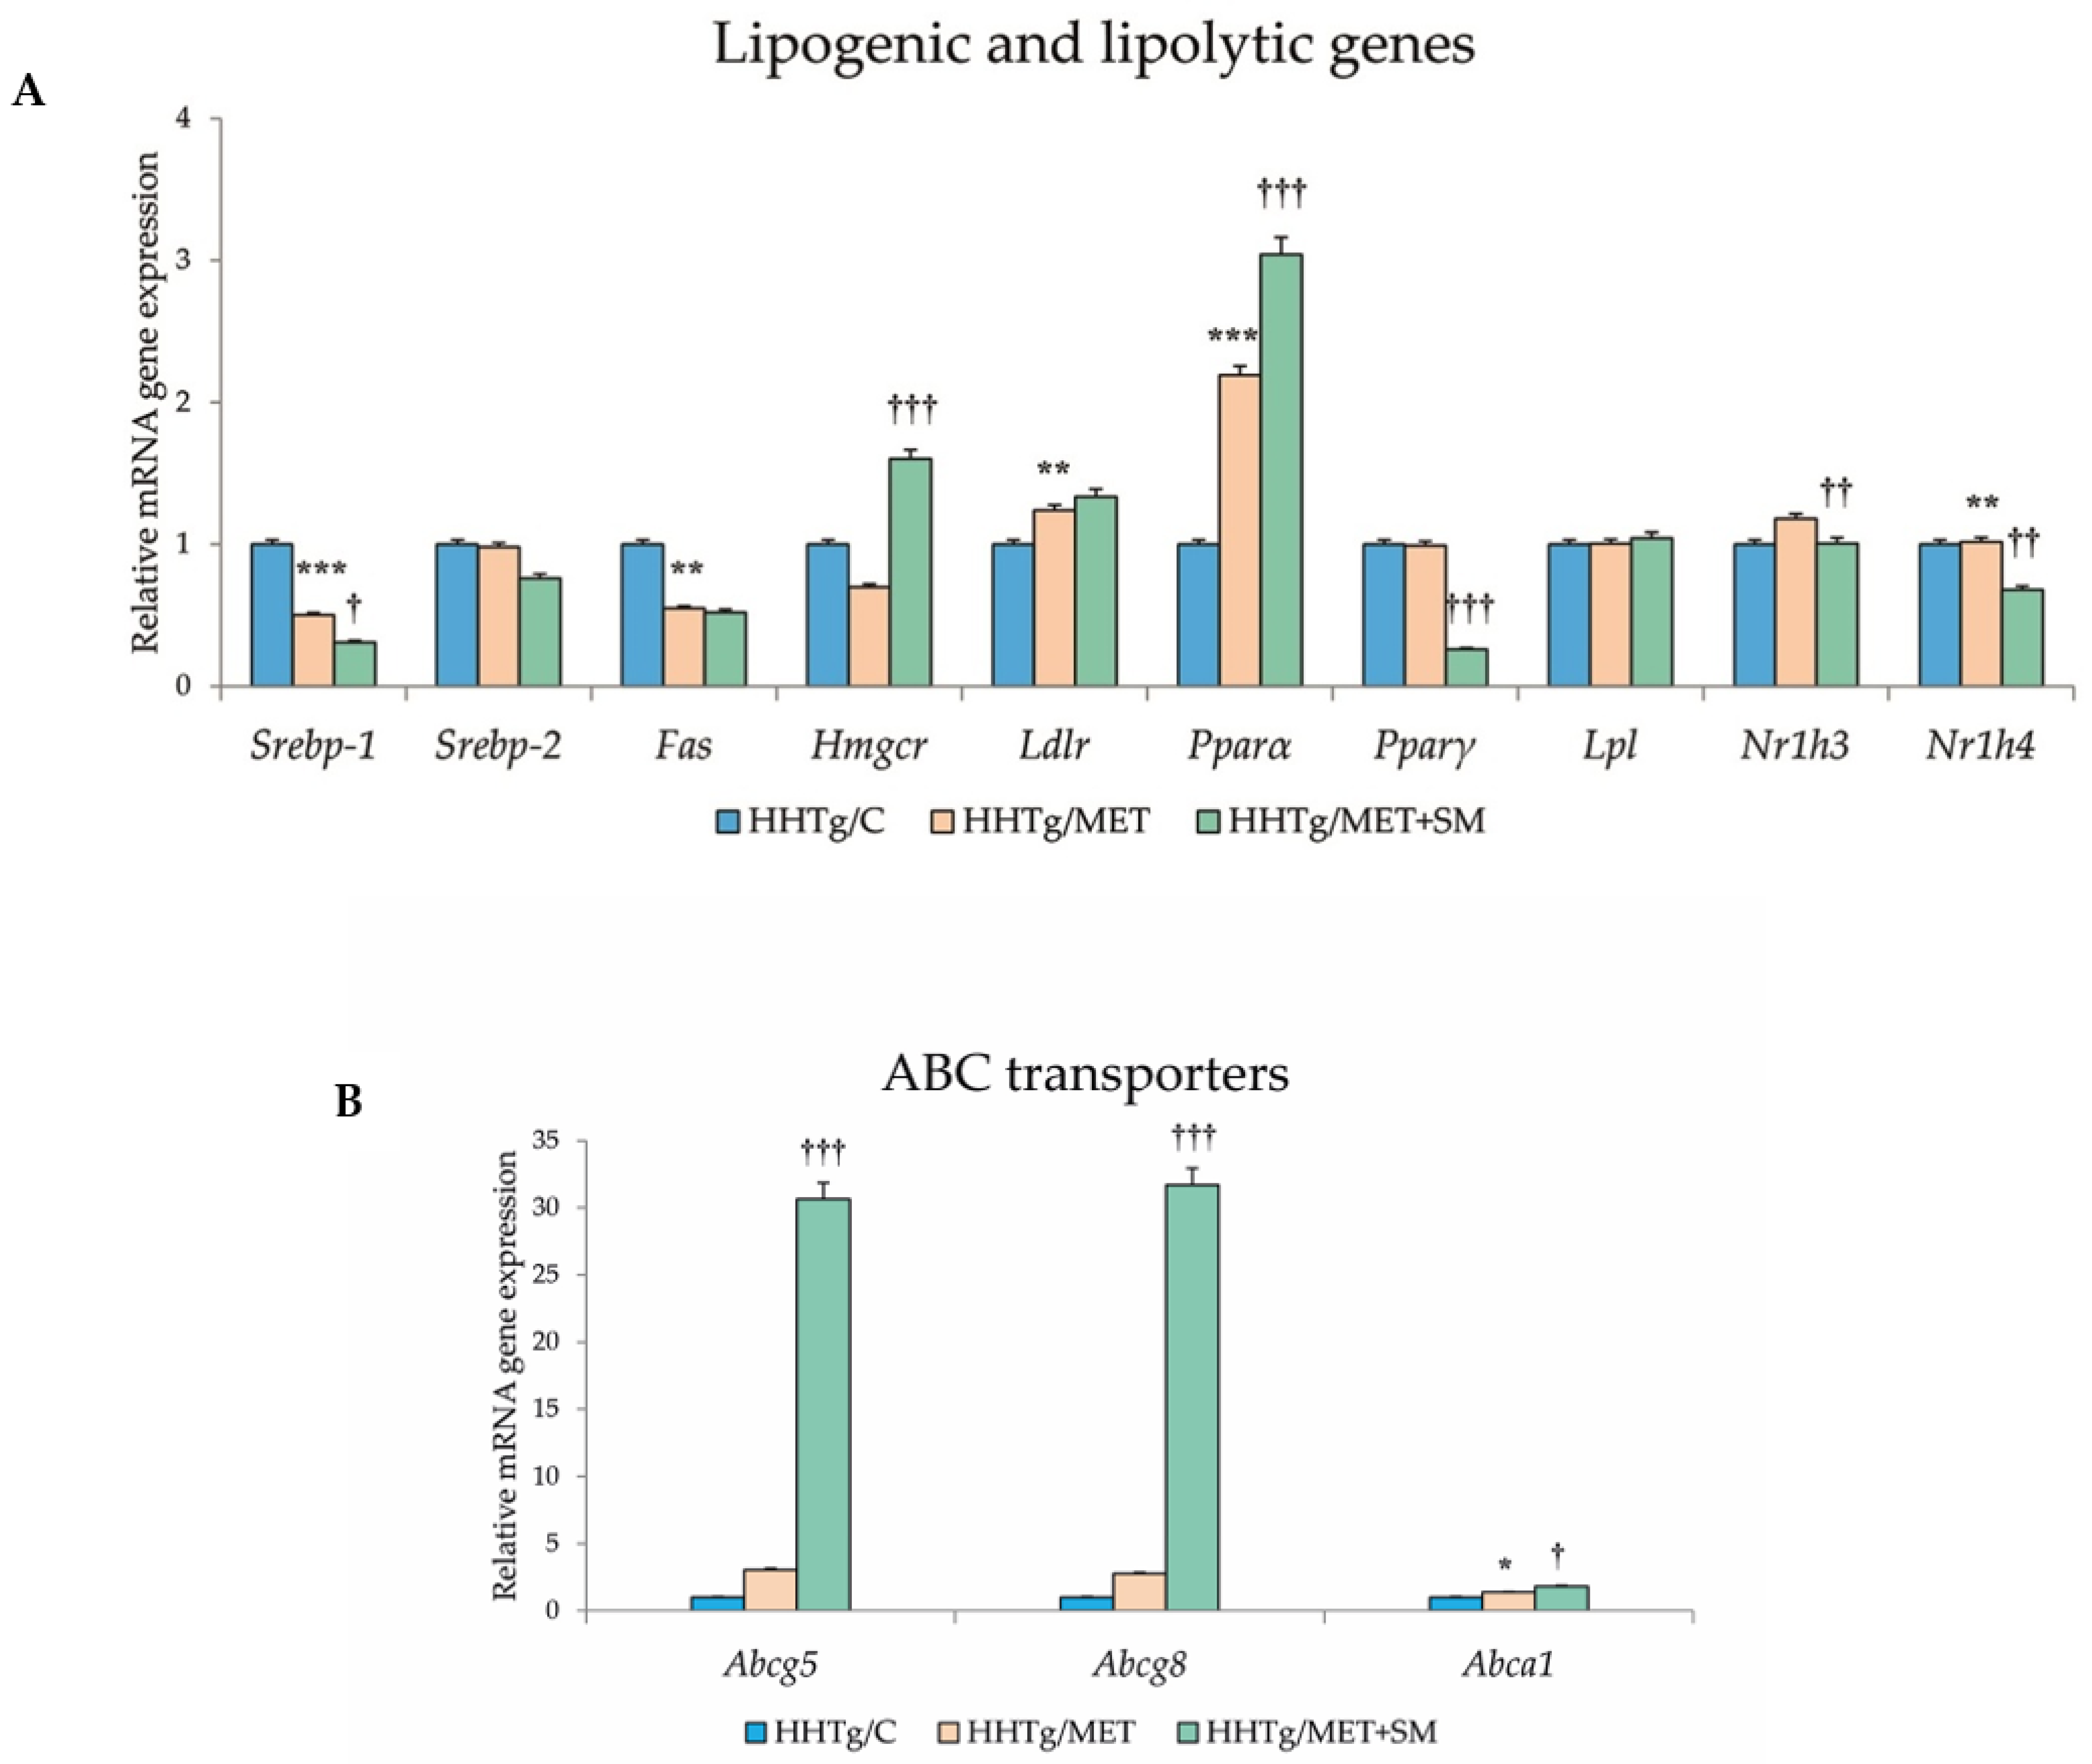
3.6. Effect of Metformin and Silymarin Combination Therapy on Relative mRNA Expression of Genes and Enzymes Involved in Lipid Metabolism
4. Discussion
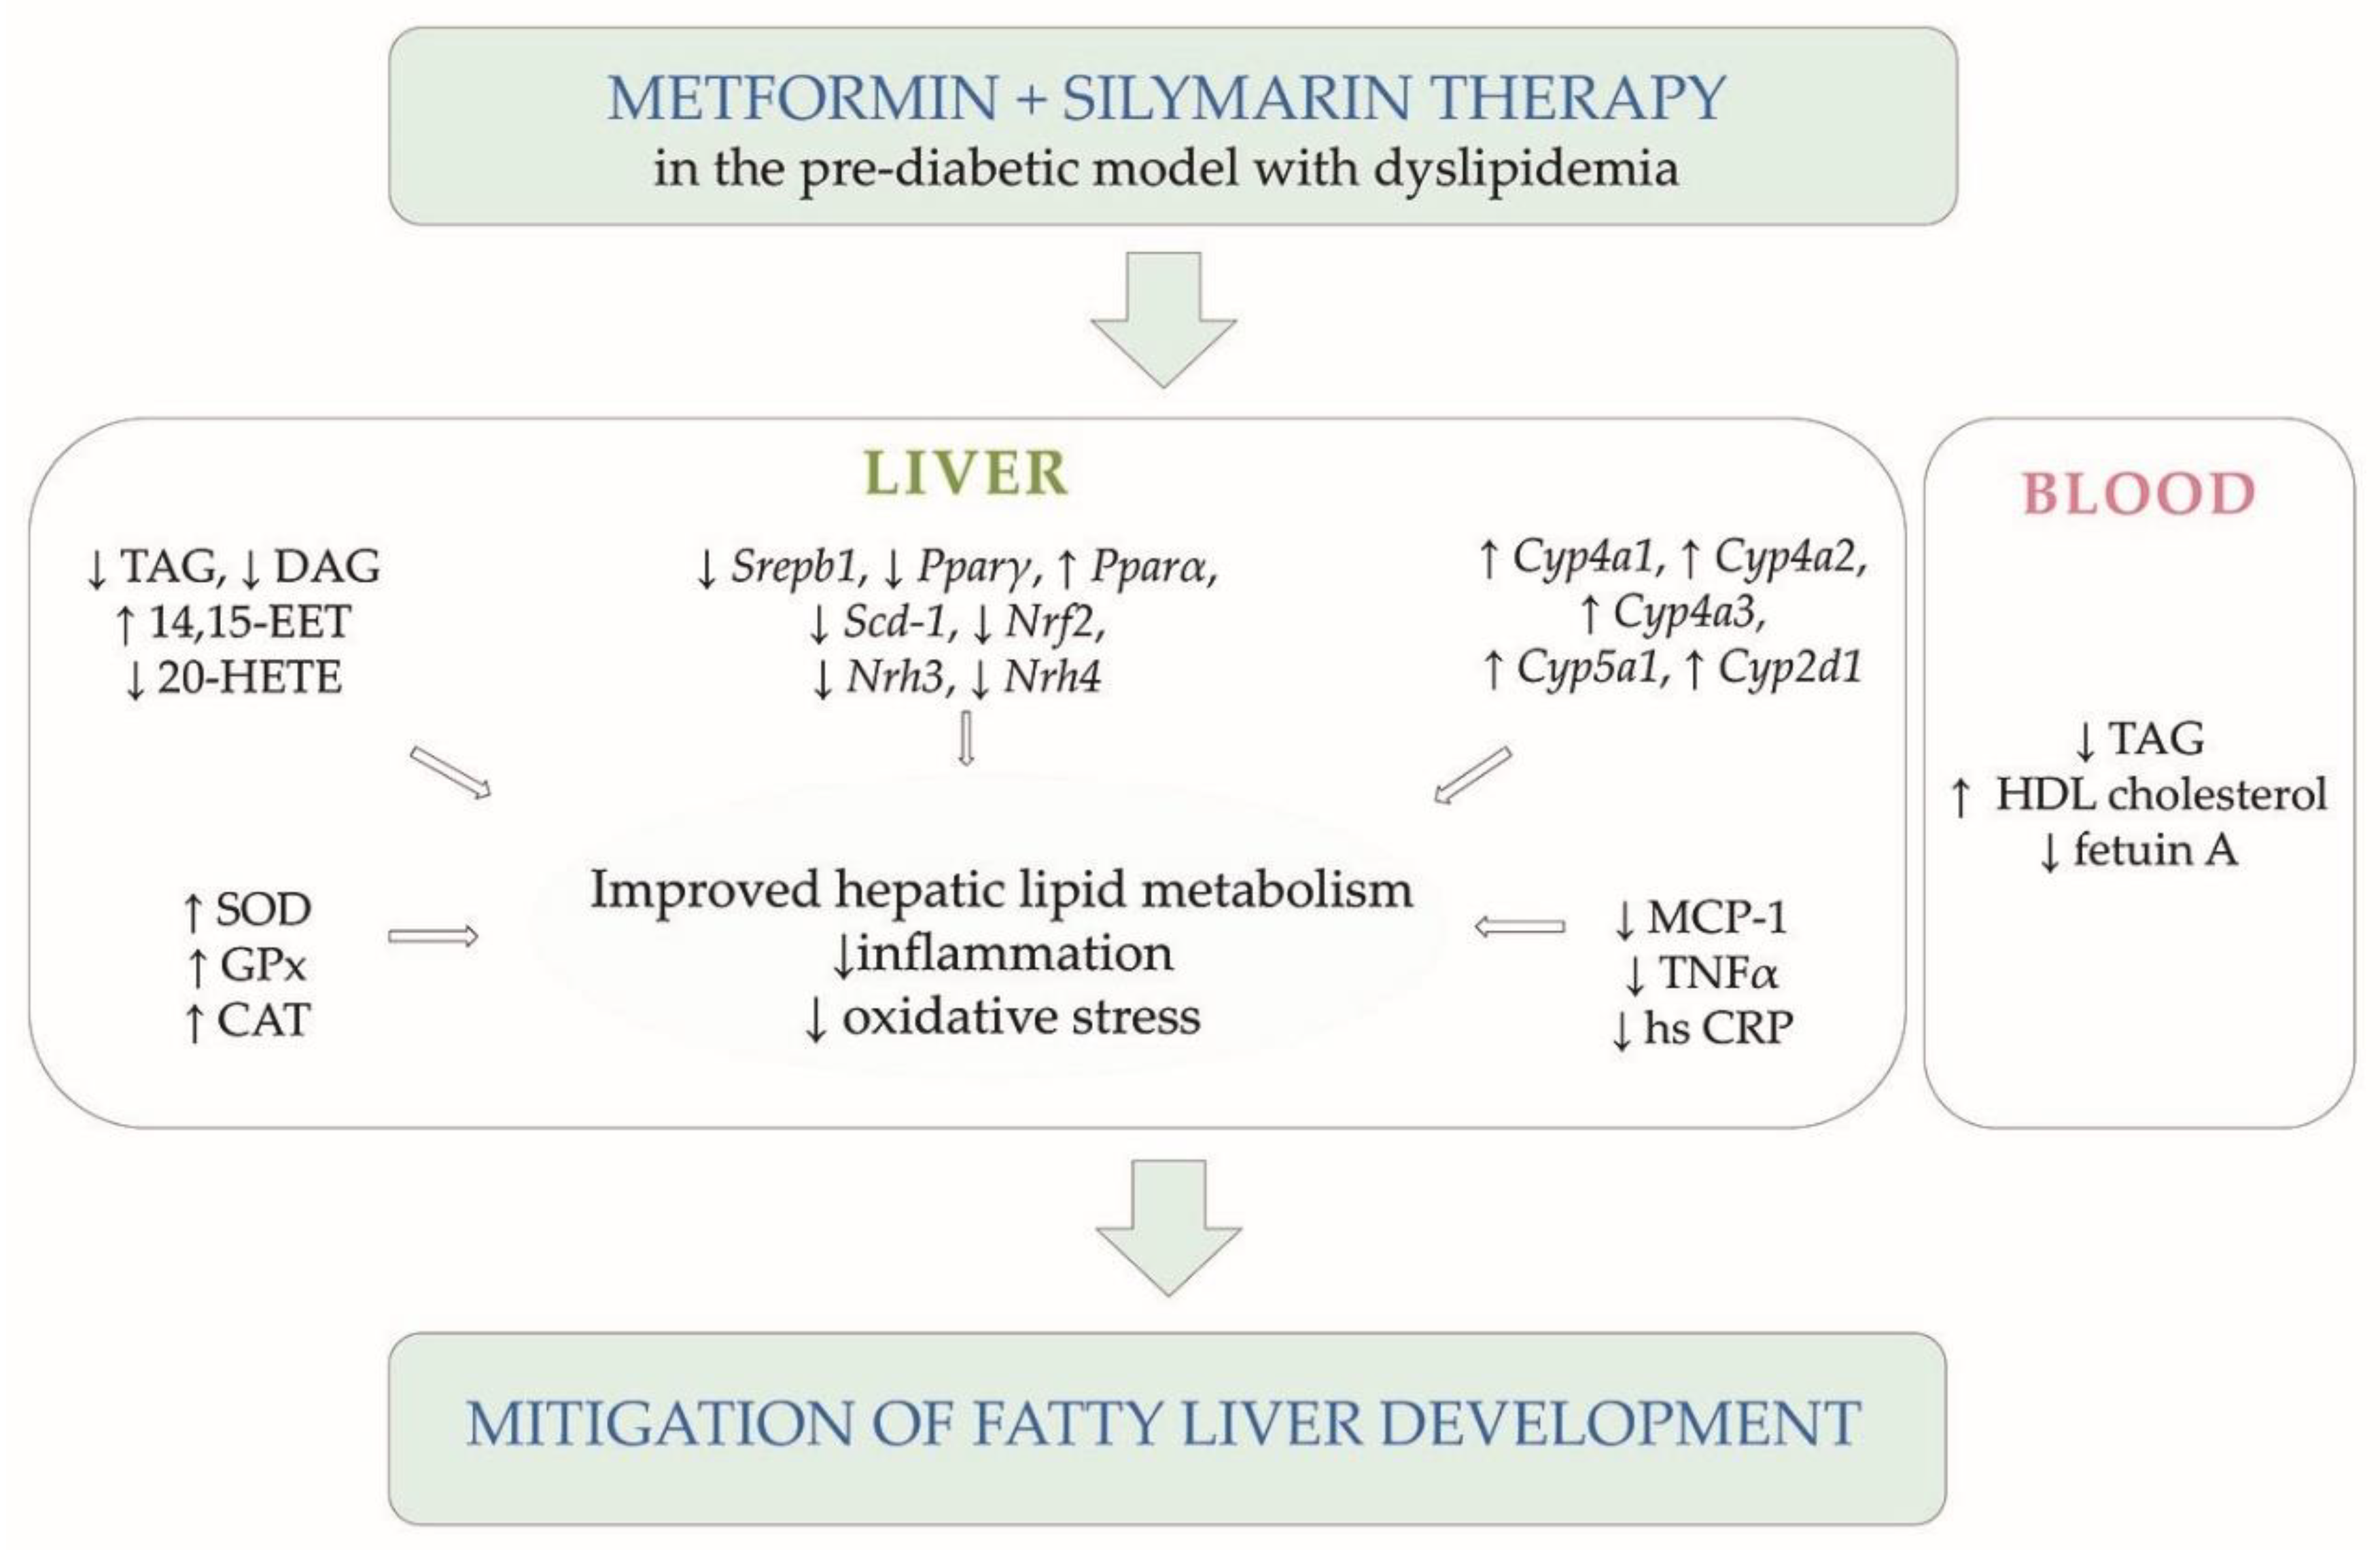
5. Conclusions
Author Contributions
Funding
Institutional Review Board Statement
Informed Consent Statement
Data Availability Statement
Acknowledgments
Conflicts of Interest
Abbreviations
| AMPK | adenosine monophosphate-activated protein kinase |
| DAG | diacylglycerol |
| EET | eicosatetraenoic acid |
| FAS | fatty acid synthase |
| GSH | reduced form of glutathione |
| GSSG | oxidised form of glutathione |
| HETE | hydroxytetraenoic acid |
| HHTg | hereditary hypertriglyceridaemia |
| HMGCR | 3-hydroxy-3-methylglutaryl-coenzyme A reductase |
| HPLC | High Performance Liquid Chromatography |
| 4-HNE | 4-hydroxynonenale |
| hsCRP | high-sensitivity C-reactive protein |
| IL-6 | interleukin 6 |
| MDA | malondialdehyde |
| MAPK | mitogen-activated protein kinase |
| MCP-1 | monocyte chemoattractant protein-1 |
| NAFLD | non-alcoholic fatty liver disease |
| FFA | free fatty acid |
| NF-κB | nuclear factor kappa B |
| NASH | non-alcoholic steatohepatitis |
| NRF2 | nuclear factor erythroid-2-related factor 2 |
| PPAR | peroxisome proliferator-activated receptor |
| PUFA | polyunsaturated fatty acid |
| ROS | reactive oxygen species |
| SCD | stearoyl-coenzyme A desaturase |
| SOD | superoxide dismutase |
| SREBP | sterol regulatory element-binding protein |
| TAG | triacylglycerol |
| TNFα | tumour necrosis factor alpha |
| VLDL | very-low-density lipoprotein |
References
- Buysschaert, M.; Bergman, M. Definition of prediabetes. Med. Clin. N. Am. 2011, 95, 289–297. [Google Scholar] [CrossRef] [PubMed]
- Francque, S.M. The Role of Non-alcoholic Fatty Liver Disease in Cardiovascular Disease. Eur. Cardiol. 2014, 9, 10–15. [Google Scholar] [CrossRef] [PubMed]
- Zelber-Sagi, S.; Lotan, R.; Shibolet, O.; Webb, M.; Buch, A.; Nitzan-Kaluski, D.; Halpern, Z.; Santo, E.; Oren, R. Non-alcoholic fatty liver disease independently predicts prediabetes during a 7-year prospective follow-up. Liver Int. 2013, 33, 1406–1412. [Google Scholar] [CrossRef]
- Bellentani, S.; Scaglioni, F.; Marino, M.; Bedogni, G. Epidemiology of non-alcoholic fatty liver disease. Dig. Dis. 2010, 28, 155–161. [Google Scholar] [CrossRef] [PubMed]
- Friedman, S.L.; Neuschwander-Tetri, B.A.; Rinella, M.; Sanyal, A.J. Mechanisms of NAFLD development and therapeutic strategies. Nat. Med. 2018, 24, 908–922. [Google Scholar] [CrossRef] [PubMed]
- Caussy, C.; Soni, M.; Cui, J.; Bettencourt, R.; Schork, N.; Chen, C.H.; Ikhwan, M.A.; Bassirian, S.; Cepin, S.; Gonzalez, M.P.; et al. Nonalcoholic fatty liver disease with cirrhosis increases familial risk for advanced fibrosis. J. Clin. Investig. 2017, 127, 2697–2704. [Google Scholar] [CrossRef] [Green Version]
- Loomba, R.; Schork, N.; Chen, C.H.; Bettencourt, R.; Bhatt, A.; Ang, B.; Nguyen, P.; Hernandez, C.; Richards, L.; Salotti, J.; et al. Heritability of Hepatic Fibrosis and Steatosis Based on a Prospective Twin Study. Gastroenterology 2015, 149, 1784–1793. [Google Scholar] [CrossRef] [Green Version]
- Albhaisi, S.; Chowdhury, A.; Sanyal, A.J. Non-alcoholic fatty liver disease in lean individuals. JHEP Rep. 2019, 1, 329–341. [Google Scholar] [CrossRef] [Green Version]
- Kim, D.; Kim, W.R. Nonobese Fatty Liver Disease. Clin. Gastroenterol. Hepatol. 2017, 15, 474–485. [Google Scholar] [CrossRef] [Green Version]
- Sookoian, S.; Pirola, C.J. Systematic review with meta-analysis: Risk factors for non-alcoholic fatty liver disease suggest a shared altered metabolic and cardiovascular profile between lean and obese patients. Aliment. Pharmacol. Ther. 2017, 46, 85–95. [Google Scholar] [CrossRef] [Green Version]
- American Diabetes Association. Prevention or Delay of Type 2 Diabetes: Standards of Medical Care in Diabetes-2020. Diabetes Care 2020, 43, S32–S36. [Google Scholar] [CrossRef] [Green Version]
- Nasri, H.; Rafieian-Kopaei, M. Metformin: Current knowledge. J. Res. Med. Sci. 2014, 19, 658–664. [Google Scholar] [PubMed]
- Green, C.J.; Marjot, T.; Tomlinson, J.W.; Hodson, L. Of mice and men: Is there a future for metformin in the treatment of hepatic steatosis? Diabetes Obes. Metab. 2019, 21, 749–760. [Google Scholar] [CrossRef] [PubMed]
- Bayat Mokhtari, R.; Homayouni, T.S.; Baluch, N.; Morgatskaya, E.; Kumar, S.; Das, B.; Yeger, H. Combination therapy in combating cancer. Oncotarget 2017, 8, 38022–38043. [Google Scholar] [CrossRef] [Green Version]
- Zhang, A.; Sun, H.; Yuan, Y.; Sun, W.; Jiao, G.; Wang, X. An in vivo analysis of the therapeutic and synergistic properties of Chinese medicinal formula Yin-Chen-Hao-Tang based on its active constituents. Fitoterapia 2011, 82, 1160–1168. [Google Scholar] [CrossRef]
- Abenavoli, L.; Capasso, R.; Milic, N.; Capasso, F. Milk thistle in liver diseases: Past, present, future. Phytother. Res. 2010, 24, 1423–1432. [Google Scholar] [CrossRef] [PubMed]
- Zhang, Z.B.; Shen, Z.G.; Wang, J.X.; Zhang, H.X.; Zhao, H.; Chen, J.F.; Yun, J. Micronization of silybin by the emulsion solvent diffusion method. Int. J. Pharm. 2009, 376, 116–122. [Google Scholar] [CrossRef]
- Poruba, M.; Kazdova, L.; Oliyarnyk, O.; Malinska, H.; Matuskova, Z.; Tozzi di Angelo, I.; Skop, V.; Vecera, R. Improvement bioavailability of silymarin ameliorates severe dyslipidemia associated with metabolic syndrome. Xenobiotica 2015, 45, 751–756. [Google Scholar] [CrossRef]
- Poruba, M.; Matuskova, Z.; Kazdova, L.; Oliyarnyk, O.; Malinska, H.; Tozzi di Angelo, I.; Vecera, R. Positive effects of different drug forms of silybin in the treatment of metabolic syndrome. Physiol. Res. 2015, 64, S507–S512. [Google Scholar] [CrossRef]
- MacDonald-Ramos, K.; Michan, L.; Martinez-Ibarra, A.; Cerbon, M. Silymarin is an ally against insulin resistance: A review. Ann. Hepatol. 2021, 23, 100255. [Google Scholar] [CrossRef]
- Krecman, V.; Skottova, N.; Walterova, D.; Ulrichova, J.; Simanek, V. Silymarin inhibits the development of diet-induced hypercholesterolemia in rats. Planta Med. 1998, 64, 138–142. [Google Scholar] [CrossRef] [PubMed]
- Wah Kheong, C.; Nik Mustapha, N.R.; Mahadeva, S. A Randomized Trial of Silymarin for the Treatment of Nonalcoholic Steatohepatitis. Clin. Gastroenterol. Hepatol. 2017, 15, 1940–1949.e8. [Google Scholar] [CrossRef] [PubMed] [Green Version]
- Sobolova, L.; Skottova, N.; Vecera, R.; Urbanek, K. Effect of silymarin and its polyphenolic fraction on cholesterol absorption in rats. Pharmacol. Res. 2006, 53, 104–112. [Google Scholar] [CrossRef] [PubMed]
- Skottova, N.; Kazdova, L.; Oliyarnyk, O.; Vecera, R.; Sobolova, L.; Ulrichova, J. Phenolics-rich extracts from Silybum marianum and Prunella vulgaris reduce a high-sucrose diet induced oxidative stress in hereditary hypertriglyceridemic rats. Pharmacol. Res. 2004, 50, 123–130. [Google Scholar] [CrossRef]
- Zicha, J.; Pechanova, O.; Cacanyiova, S.; Cebova, M.; Kristek, F.; Torok, J.; Simko, F.; Dobesova, Z.; Kunes, J. Hereditary hypertriglyceridemic rat: A suitable model of cardiovascular disease and metabolic syndrome? Physiol. Res. 2006, 55, S49–S63. [Google Scholar] [PubMed]
- Hanley, A.J.; Williams, K.; Stern, M.P.; Haffner, S.M. Homeostasis model assessment of insulin resistance in relation to the incidence of cardiovascular disease: The San Antonio Heart Study. Diabetes Care 2002, 25, 1177–1184. [Google Scholar] [CrossRef] [Green Version]
- Miklankova, D.; Markova, I.; Huttl, M.; Zapletalova, I.; Poruba, M.; Malinska, H. Metformin Affects Cardiac Arachidonic Acid Metabolism and Cardiac Lipid Metabolite Storage in a Prediabetic Rat Model. Int. J. Mol. Sci. 2021, 22, 7680. [Google Scholar] [CrossRef]
- Qi, N.; Kazdova, L.; Zidek, V.; Landa, V.; Kren, V.; Pershadsingh, H.A.; Lezin, E.S.; Abumrad, N.A.; Pravenec, M.; Kurtz, T.W. Pharmacogenetic evidence that cd36 is a key determinant of the metabolic effects of pioglitazone. J. Biol. Chem. 2002, 277, 48501–48507. [Google Scholar] [CrossRef] [Green Version]
- Stephen Robert, J.M.; Peddha, M.S.; Srivastava, A.K. Effect of Silymarin and Quercetin in a Miniaturized Scaffold in Wistar Rats against Non-alcoholic Fatty Liver Disease. ACS Omega 2021, 6, 20735–20745. [Google Scholar] [CrossRef]
- Roxo, D.F.; Arcaro, C.A.; Gutierres, V.O.; Costa, M.C.; Oliveira, J.O.; Lima, T.F.O.; Assis, R.P.; Brunetti, I.L.; Baviera, A.M. Curcumin combined with metformin decreases glycemia and dyslipidemia, and increases paraoxonase activity in diabetic rats. Diabetol. Metab. Syndr. 2019, 11, 33. [Google Scholar] [CrossRef] [Green Version]
- Rahimi-Madiseh, M.; Heidarian, E.; Kheiri, S.; Rafieian-Kopaei, M. Effect of hydroalcoholic Allium ampeloprasum extract on oxidative stress, diabetes mellitus and dyslipidemia in alloxan-induced diabetic rats. Biomed. Pharmacother. 2017, 86, 363–367. [Google Scholar] [CrossRef]
- Mohammadi, H.; Manouchehri, H.; Changizi, R.; Bootorabi, F.; Khorramizadeh, M.R. Concurrent metformin and silibinin therapy in diabetes: Assessments in zebrafish (Danio rerio) animal model. J. Diabetes Metab. Disord. 2020, 19, 1233–1244. [Google Scholar] [CrossRef] [PubMed]
- Poruba, M.; Anzenbacher, P.; Racova, Z.; Oliyarnyk, O.; Huttl, M.; Malinska, H.; Markova, I.; Gurska, S.; Kazdova, L.; Vecera, R. The effect of combined diet containing n-3 polyunsaturated fatty acids and silymarin on metabolic syndrome in rats. Physiol. Res. 2019, 68, S39–S50. [Google Scholar] [CrossRef]
- Markova, I.; Malinska, H.; Huttl, M.; Miklankova, D.; Oliyarnyk, O.; Poruba, M.; Racova, Z.; Kazdova, L.; Vecera, R. The combination of atorvastatin with silymarin enhances hypolipidemic, antioxidant and anti-inflammatory effects in a rat model of metabolic syndrome. Physiol. Res. 2021, 70, 33–43. [Google Scholar] [CrossRef] [PubMed]
- Lv, W.S.; Wen, J.P.; Li, L.; Sun, R.X.; Wang, J.; Xian, Y.X.; Cao, C.X.; Wang, Y.L.; Gao, Y.Y. The effect of metformin on food intake and its potential role in hypothalamic regulation in obese diabetic rats. Brain Res. 2012, 1444, 11–19. [Google Scholar] [CrossRef]
- Obradovic, M.; Sudar-Milovanovic, E.; Soskic, S.; Essack, M.; Arya, S.; Stewart, A.J.; Gojobori, T.; Isenovic, E.R. Leptin and Obesity: Role and Clinical Implication. Front. Endocrinol. 2021, 12, 585887. [Google Scholar] [CrossRef]
- Antunes, L.C.; Elkfury, J.L.; Jornada, M.N.; Foletto, K.C.; Bertoluci, M.C. Validation of HOMA-IR in a model of insulin-resistance induced by a high-fat diet in Wistar rats. Arch. Endocrinol. Metab. 2016, 60, 138–142. [Google Scholar] [CrossRef] [PubMed] [Green Version]
- Yao, J.; Zhi, M.; Gao, X.; Hu, P.; Li, C.; Yang, X. Effect and the probable mechanisms of silibinin in regulating insulin resistance in the liver of rats with non-alcoholic fatty liver. Braz. J. Med. Biol. Res. 2013, 46, 270–277. [Google Scholar] [CrossRef] [Green Version]
- Zhang, Y.; Hai, J.; Cao, M.; Zhang, Y.; Pei, S.; Wang, J.; Zhang, Q. Silibinin ameliorates steatosis and insulin resistance during non-alcoholic fatty liver disease development partly through targeting IRS-1/PI3K/Akt pathway. Int. Immunopharmacol. 2013, 17, 714–720. [Google Scholar] [CrossRef]
- Zhang, D.; Ma, Y.; Liu, J.; Deng, Y.; Zhou, B.; Wen, Y.; Li, M.; Wen, D.; Ying, Y.; Luo, S.; et al. Metformin Alleviates Hepatic Steatosis and Insulin Resistance in a Mouse Model of High-Fat Diet-Induced Nonalcoholic Fatty Liver Disease by Promoting Transcription Factor EB-Dependent Autophagy. Front. Pharmacol. 2021, 12, 689111. [Google Scholar] [CrossRef]
- Meex, R.C.R.; Watt, M.J. Hepatokines: Linking nonalcoholic fatty liver disease and insulin resistance. Nat. Rev. Endocrinol. 2017, 13, 509–520. [Google Scholar] [CrossRef] [PubMed]
- Rees, D.C.; Johnson, E.; Lewinson, O. ABC transporters: The power to change. Nat. Rev. Mol. Cell. Biol. 2009, 10, 218–227. [Google Scholar] [CrossRef] [PubMed] [Green Version]
- Hu, W.Y.; Ma, X.H.; Zhou, W.Y.; Li, X.X.; Sun, T.T.; Sun, H. Preventive effect of Silibinin in combination with Pu-erh tea extract on non-alcoholic fatty liver disease in ob/ob mice. Food Funct. 2017, 8, 1105–1115. [Google Scholar] [CrossRef] [PubMed]
- Piehler, A.P.; Haug, K.B.; Wenzel, J.J.; Kierulf, P.B.; Kaminski, W.E. ABCA-transporters: Regulators of cellular lipid transport. Tidsskr. Nor. Laegeforen. 2007, 127, 2930–2933. [Google Scholar] [PubMed]
- Zhao, C.; Dahlman-Wright, K. Liver X receptor in cholesterol metabolism. J. Endocrinol. 2010, 204, 233–240. [Google Scholar] [CrossRef] [Green Version]
- Divisova, J.; Kazdova, L.; Hubova, M.; Meschisvili, E. Relationship between insulin resistance and muscle triglyceride content in nonobese and obese experimental models of insulin resistance syndrome. Ann. N. Y. Acad. Sci. 2002, 967, 440–445. [Google Scholar] [CrossRef]
- Buzzetti, E.; Pinzani, M.; Tsochatzis, E.A. The multiple-hit pathogenesis of non-alcoholic fatty liver disease (NAFLD). Metabolism 2016, 65, 1038–1048. [Google Scholar] [CrossRef]
- Takahashi, Y.; Fukusato, T. Histopathology of nonalcoholic fatty liver disease/nonalcoholic steatohepatitis. World J. Gastroenterol. 2014, 20, 15539–15548. [Google Scholar] [CrossRef]
- Yu, Z.W.; Li, D.; Ling, W.H.; Jin, T.R. Role of nuclear factor (erythroid-derived 2)-like 2 in metabolic homeostasis and insulin action: A novel opportunity for diabetes treatment? World J. Diabetes 2012, 3, 19–28. [Google Scholar] [CrossRef]
- Liu, J.; Han, L.; Zhu, L.; Yu, Y. Free fatty acids, not triglycerides, are associated with non-alcoholic liver injury progression in high fat diet induced obese rats. Lipids Health Dis. 2016, 15, 27. [Google Scholar] [CrossRef] [Green Version]
- Markova, I.; Miklankova, D.; Huttl, M.; Kacer, P.; Skibova, J.; Kucera, J.; Sedlacek, R.; Kacerova, T.; Kazdova, L.; Malinska, H. The Effect of Lipotoxicity on Renal Dysfunction in a Nonobese Rat Model of Metabolic Syndrome: A Urinary Proteomic Approach. J. Diabetes Res. 2019, 2019, 8712979. [Google Scholar] [CrossRef] [PubMed]
- Roumans, K.H.M.; Lindeboom, L.; Veeraiah, P.; Remie, C.M.E.; Phielix, E.; Havekes, B.; Bruls, Y.M.H.; Brouwers, M.; Stahlman, M.; Alssema, M.; et al. Hepatic saturated fatty acid fraction is associated with de novo lipogenesis and hepatic insulin resistance. Nat. Commun. 2020, 11, 1891. [Google Scholar] [CrossRef] [PubMed]
- Lee, J.J.; Lambert, J.E.; Hovhannisyan, Y.; Ramos-Roman, M.A.; Trombold, J.R.; Wagner, D.A.; Parks, E.J. Palmitoleic acid is elevated in fatty liver disease and reflects hepatic lipogenesis. Am. J. Clin. Nutr. 2015, 101, 34–43. [Google Scholar] [CrossRef] [Green Version]
- Sztolsztener, K.; Chabowski, A.; Harasim-Symbor, E.; Bielawiec, P.; Konstantynowicz-Nowicka, K. Arachidonic Acid as an Early Indicator of Inflammation during Non-Alcoholic Fatty Liver Disease Development. Biomolecules 2020, 10, 1133. [Google Scholar] [CrossRef] [PubMed]
- Capdevila, J.H.; Falck, J.R. The CYP P450 arachidonic acid monooxygenases: From cell signaling to blood pressure regulation. Biochem. Biophys. Res. Commun. 2001, 285, 571–576. [Google Scholar] [CrossRef] [PubMed]
- Schuck, R.N.; Zha, W.; Edin, M.L.; Gruzdev, A.; Vendrov, K.C.; Miller, T.M.; Xu, Z.; Lih, F.B.; DeGraff, L.M.; Tomer, K.B.; et al. The cytochrome P450 epoxygenase pathway regulates the hepatic inflammatory response in fatty liver disease. PLoS ONE 2014, 9, e110162. [Google Scholar] [CrossRef] [Green Version]
- Park, S.Y.; Kim, C.H.; Lee, J.Y.; Jeon, J.S.; Kim, M.J.; Chae, S.H.; Kim, H.C.; Oh, S.J.; Kim, S.K. Hepatic expression of cytochrome P450 in Zucker diabetic fatty rats. Food Chem. Toxicol. 2016, 96, 244–253. [Google Scholar] [CrossRef] [PubMed]
- Albracht-Schulte, K.; Rosairo, S.; Ramalingam, L.; Wijetunge, S.; Ratnayake, R.; Kotakadeniya, H.; Dawson, J.A.; Kalupahana, N.S.; Moustaid-Moussa, N. Obesity, adipocyte hypertrophy, fasting glucose, and resistin are potential contributors to nonalcoholic fatty liver disease in South Asian women. Diabetes Metab. Syndr. Obes. 2019, 12, 863–872. [Google Scholar] [CrossRef] [Green Version]
- Park, H.K.; Kwak, M.K.; Kim, H.J.; Ahima, R.S. Linking resistin, inflammation, and cardiometabolic diseases. Korean J. Intern. Med. 2017, 32, 239–247. [Google Scholar] [CrossRef]
- Zhao, S.; Jiang, J.; Jing, Y.; Liu, W.; Yang, X.; Hou, X.; Gao, L.; Wei, L. The concentration of tumor necrosis factor-alpha determines its protective or damaging effect on liver injury by regulating Yap activity. Cell Death Dis. 2020, 11, 70. [Google Scholar] [CrossRef] [Green Version]
- Zimmermann, E.; Anty, R.; Tordjman, J.; Verrijken, A.; Gual, P.; Tran, A.; Iannelli, A.; Gugenheim, J.; Bedossa, P.; Francque, S.; et al. C-reactive protein levels in relation to various features of non-alcoholic fatty liver disease among obese patients. J. Hepatol. 2011, 55, 660–665. [Google Scholar] [CrossRef] [PubMed] [Green Version]
- Haukeland, J.W.; Dahl, T.B.; Yndestad, A.; Gladhaug, I.P.; Loberg, E.M.; Haaland, T.; Konopski, Z.; Wium, C.; Aasheim, E.T.; Johansen, O.E.; et al. Fetuin A in nonalcoholic fatty liver disease: In vivo and in vitro studies. Eur. J. Endocrinol. 2012, 166, 503–510. [Google Scholar] [CrossRef] [PubMed]
- Sato, M.; Kamada, Y.; Takeda, Y.; Kida, S.; Ohara, Y.; Fujii, H.; Akita, M.; Mizutani, K.; Yoshida, Y.; Yamada, M.; et al. Fetuin-A negatively correlates with liver and vascular fibrosis in nonalcoholic fatty liver disease subjects. Liver Int. 2015, 35, 925–935. [Google Scholar] [CrossRef] [PubMed]
- Pal, D.; Dasgupta, S.; Kundu, R.; Maitra, S.; Das, G.; Mukhopadhyay, S.; Ray, S.; Majumdar, S.S.; Bhattacharya, S. Fetuin-A acts as an endogenous ligand of TLR4 to promote lipid-induced insulin resistance. Nat. Med. 2012, 18, 1279–1285. [Google Scholar] [CrossRef]
- Oguntibeju, O.O. Type 2 diabetes mellitus, oxidative stress and inflammation: Examining the links. Int. J. Physiol. Pathophysiol. Pharmacol. 2019, 11, 45–63. [Google Scholar]
- Rives, C.; Fougerat, A.; Ellero-Simatos, S.; Loiseau, N.; Guillou, H.; Gamet-Payrastre, L.; Wahli, W. Oxidative Stress in NAFLD: Role of Nutrients and Food Contaminants. Biomolecules 2020, 10, 1702. [Google Scholar] [CrossRef]
- Swiderska, M.; Maciejczyk, M.; Zalewska, A.; Pogorzelska, J.; Flisiak, R.; Chabowski, A. Oxidative stress biomarkers in the serum and plasma of patients with non-alcoholic fatty liver disease (NAFLD). Can plasma AGE be a marker of NAFLD? Oxidative stress biomarkers in NAFLD patients. Free Radic Res. 2019, 53, 841–850. [Google Scholar] [CrossRef]
- Gillessen, A.; Schmidt, H.H. Silymarin as Supportive Treatment in Liver Diseases: A Narrative Review. Adv. Ther. 2020, 37, 1279–1301. [Google Scholar] [CrossRef] [Green Version]
- Wang, Y.; Nakajima, T.; Gonzalez, F.J.; Tanaka, N. PPARs as Metabolic Regulators in the Liver: Lessons from Liver-Specific PPAR-Null Mice. Int. J. Mol. Sci. 2020, 21, 2061. [Google Scholar] [CrossRef] [Green Version]
- Sampath, S.; Karundevi, B. Effect of troxerutin on insulin signaling molecules in the gastrocnemius muscle of high fat and sucrose-induced type-2 diabetic adult male rat. Mol. Cell. Biochem. 2014, 395, 11–27. [Google Scholar] [CrossRef]
- Zhu, X.; Yan, H.; Xia, M.; Chang, X.; Xu, X.; Wang, L.; Sun, X.; Lu, Y.; Bian, H.; Li, X.; et al. Metformin attenuates triglyceride accumulation in HepG2 cells through decreasing stearyl-coenzyme A desaturase 1 expression. Lipids Health Dis. 2018, 17, 114. [Google Scholar] [CrossRef] [PubMed] [Green Version]
- Xiao, P.; Yang, Z.; Sun, J.; Tian, J.; Chang, Z.; Li, X.; Zhang, B.; Ye, Y.; Ji, H.; Yu, E.; et al. Silymarin inhibits adipogenesis in the adipocytes in grass carp Ctenopharyngodon idellus in vitro and in vivo. Fish Physiol. Biochem. 2017, 43, 1487–1500. [Google Scholar] [CrossRef] [PubMed]
- El Kasmi, K.C.; Anderson, A.L.; Devereaux, M.W.; Balasubramaniyan, N.; Suchy, F.J.; Orlicky, D.J.; Shearn, C.T.; Sokol, R.J. Interrupting tumor necrosis factor-alpha signaling prevents parenteral nutrition-associated cholestasis in mice. J. Parenter. Enteral Nutr. 2021. [Google Scholar] [CrossRef]
- Tewari, D.; Nabavi, S.F.; Nabavi, S.M.; Sureda, A.; Farooqi, A.A.; Atanasov, A.G.; Vacca, R.A.; Sethi, G.; Bishayee, A. Targeting activator protein 1 signaling pathway by bioactive natural agents: Possible therapeutic strategy for cancer prevention and intervention. Pharmacol. Res. 2018, 128, 366–375. [Google Scholar] [CrossRef] [PubMed]
- Fallah, M.; Davoodvandi, A.; Nikmanzar, S.; Aghili, S.; Mirazimi, S.M.A.; Aschner, M.; Rashidian, A.; Hamblin, M.R.; Chamanara, M.; Naghsh, N.; et al. Silymarin (milk thistle extract) as a therapeutic agent in gastrointestinal cancer. Biomed. Pharmacother. 2021, 142, 112024. [Google Scholar] [CrossRef]


| Microbiological Control | ||
|---|---|---|
| Yeast and mold (cfu/g) | <102 | |
| Salmonella spp. | 0 | |
| Staphylococcus aureus (cfu/g) | <102 | |
| Pseudomonas aeruginosa (cfu/g) | <102 | |
| E. coli (cfu/mL) | <102 | |
| Heavy metals | ||
| Arsenic (As) (μg/kg) | 20–60 | |
| Lead (Pb) (μg/kg) | 52 ± 11 | |
| Mercury (Hg) (μg/kg) | 0.55 ± 0.11 | |
| Compound | UV/VIS ratio (%) | MS/MS ratio (%) |
| Silychristin A + B + isomers Silydianin | 31.87 0.43 | 32.02 0.86 |
| Silybin A + B + isomers | 54.39 | 48.27 |
| Isosilybin A + B + isomers | 13.32 | 18.85 |
| HHTg/C | HHTg/MET | HHTg/MET+SM | PMET | PMET+SM | |
|---|---|---|---|---|---|
| Body weight (g) | 447.5 ± 3.3 | 436.7 ± 5.4 | 414.6 ± 10.1 | ns | 0.05 |
| Adiposity index (g/100 g b.wt.) | 2.094 ± 0.106 | 1.896 ± 0.044 | 1.900 ± 0.114 | ns | ns |
| Relative liver weight (g/100 g b.wt.) | 3.089 ± 0.033 | 2.962 ± 0.032 | 2.687 ± 0.114 | ns | 0.01 |
| Non-fasting glucose (mmol/L) | 9.300 ± 0.379 | 8.257 ± 0.252 ** | 7.638 ± 0.173 | 0.01 | ns |
| Insulin (nmol/L) | 0.285 ± 0.047 | 0.261 ± 0.013 | 0.237 ± 0.017 | ns | ns |
| HOMA-IR | 3.037 ± 0.239 | 3.369 ± 0.322 | 2.657 ± 0.119 * | ns | 0.01 |
| TAG (mmol/L) | 6.667 ± 0.364 | 5.446 ± 0.352 * | 3.350 ± 0.205 * | 0.01 | 0.001 |
| Total cholesterol (mmol/L) | 2.040 ± 0.055 | 2.111 ± 0.057 * | 2.001 ± 0.017 | ns | ns |
| HDL cholesterol (mmol/L) | 0.813 ± 0.137 | 1.029 ± 0.118 *** | 1.186 ± 0.152 | 0.01 | 0.05 |
| FFA (mmol/L) | 0.608 ± 0.011 | 0.621 ± 0.021 | 0.631 ± 0.064 | ns | ns |
| ALT (µkat/L) | 1.242 ± 0.156 | 1.433 ± 0.249 | 1.441 ± 0.274 | ns | ns |
| MCP-1 (ng/mL) | 4.917 ± 0.348 | 3.772 ± 0.270 | 4.818 ± 0.225 | ns | ns |
| TNFα (pg/mL) | 11.488 ± 0.917 | 8.732 ± 0.322 ** | 10.744 ± 0.523 | 0.01 | 0.05 |
| Leptin (pg/mL) | 9120 ± 359 | 6636 ± 278 *** | 6023 ± 352 * | 0.001 | ns |
| HMW adiponectin (μg/mL) | 5.48 ± 0.24 | 5.79 ± 0.51 | 5.55 ± 0.15 | ns | ns |
| Fetuin-A (μg/mL) | 106.89 ± 15.04 | 152.69 ± 11.69 | 104.11 ± 12.88*** | 0.05 | 0.01 |
| HHTg/C | HHTg/MET | HHTg/MET+SM | PMET | PMET+SM | |
|---|---|---|---|---|---|
| GSH/GSSG | 27.06 ± 2.41 | 39.44 ± 2.38 | 44.09 ± 2.64 ** | 0.01 | n.s. |
| SOD (U/mg protein) | 0.127 ± 0.01 | 0.152 ± 0.01 | 0.183 ± 0.01 | 0.05 | 0.01 |
| CAT (µM H2O2 min/mg protein) | 1437 ± 80 | 1311 ± 88 | 1662 ± 130 | n.s. | 0.05 |
| GPx (µM NADPH/min/mg protein) | 249 ± 14 | 272 ± 12 | 349 ± 15 | n.s. | 0.001 |
| 4-HNE (ng/mg protein) | 69.1 ± 4.4 | 47.7 ± 1.6 *** | 46.6 ± 1.4 | 0.001 | 0.05 |
| MDA (nM/mg protein) | 3.43 ± 0.37 | 2.10 ± 0.29 | 2.28 ± 0.14 *** | 0.01 | ns |
| MCP-1 (pg/mg protein) | 27.132 ± 1.494 | 27.187 ± 2.579 ** | 13.366 ± 1.074 ** | ns | 0.001 |
| TNFα (pg/mg protein) | 68.615 ± 5.493 | 54.114 ± 0.994 *** | 45.274 ± 0.984 | 0.01 | 0.05 |
| hsCRP (ng/mg protein) | 93.618 ± 7.824 | 68.836 ± 2.616 *** | 50.240 ± 2.423 * | 0.001 | 0.01 |
| Resistin (pg/mg protein) | 4.672 ± 0.315 | 3.715 ± 0.178 *** | 3.767 ± 0.161 | 0.01 | ns |
Publisher’s Note: MDPI stays neutral with regard to jurisdictional claims in published maps and institutional affiliations. |
© 2021 by the authors. Licensee MDPI, Basel, Switzerland. This article is an open access article distributed under the terms and conditions of the Creative Commons Attribution (CC BY) license (https://creativecommons.org/licenses/by/4.0/).
Share and Cite
Hüttl, M.; Markova, I.; Miklankova, D.; Zapletalova, I.; Poruba, M.; Racova, Z.; Vecera, R.; Malinska, H. The Beneficial Additive Effect of Silymarin in Metformin Therapy of Liver Steatosis in a Pre-Diabetic Model. Pharmaceutics 2022, 14, 45. https://doi.org/10.3390/pharmaceutics14010045
Hüttl M, Markova I, Miklankova D, Zapletalova I, Poruba M, Racova Z, Vecera R, Malinska H. The Beneficial Additive Effect of Silymarin in Metformin Therapy of Liver Steatosis in a Pre-Diabetic Model. Pharmaceutics. 2022; 14(1):45. https://doi.org/10.3390/pharmaceutics14010045
Chicago/Turabian StyleHüttl, Martina, Irena Markova, Denisa Miklankova, Iveta Zapletalova, Martin Poruba, Zuzana Racova, Rostislav Vecera, and Hana Malinska. 2022. "The Beneficial Additive Effect of Silymarin in Metformin Therapy of Liver Steatosis in a Pre-Diabetic Model" Pharmaceutics 14, no. 1: 45. https://doi.org/10.3390/pharmaceutics14010045
APA StyleHüttl, M., Markova, I., Miklankova, D., Zapletalova, I., Poruba, M., Racova, Z., Vecera, R., & Malinska, H. (2022). The Beneficial Additive Effect of Silymarin in Metformin Therapy of Liver Steatosis in a Pre-Diabetic Model. Pharmaceutics, 14(1), 45. https://doi.org/10.3390/pharmaceutics14010045