Enhanced Lymphatic Delivery of Methotrexate Using W/O/W Nanoemulsion: In Vitro Characterization and Pharmacokinetic Study


Abstract

1. Introduction
2. Materials and Methods
2.1. Materials and Reagents
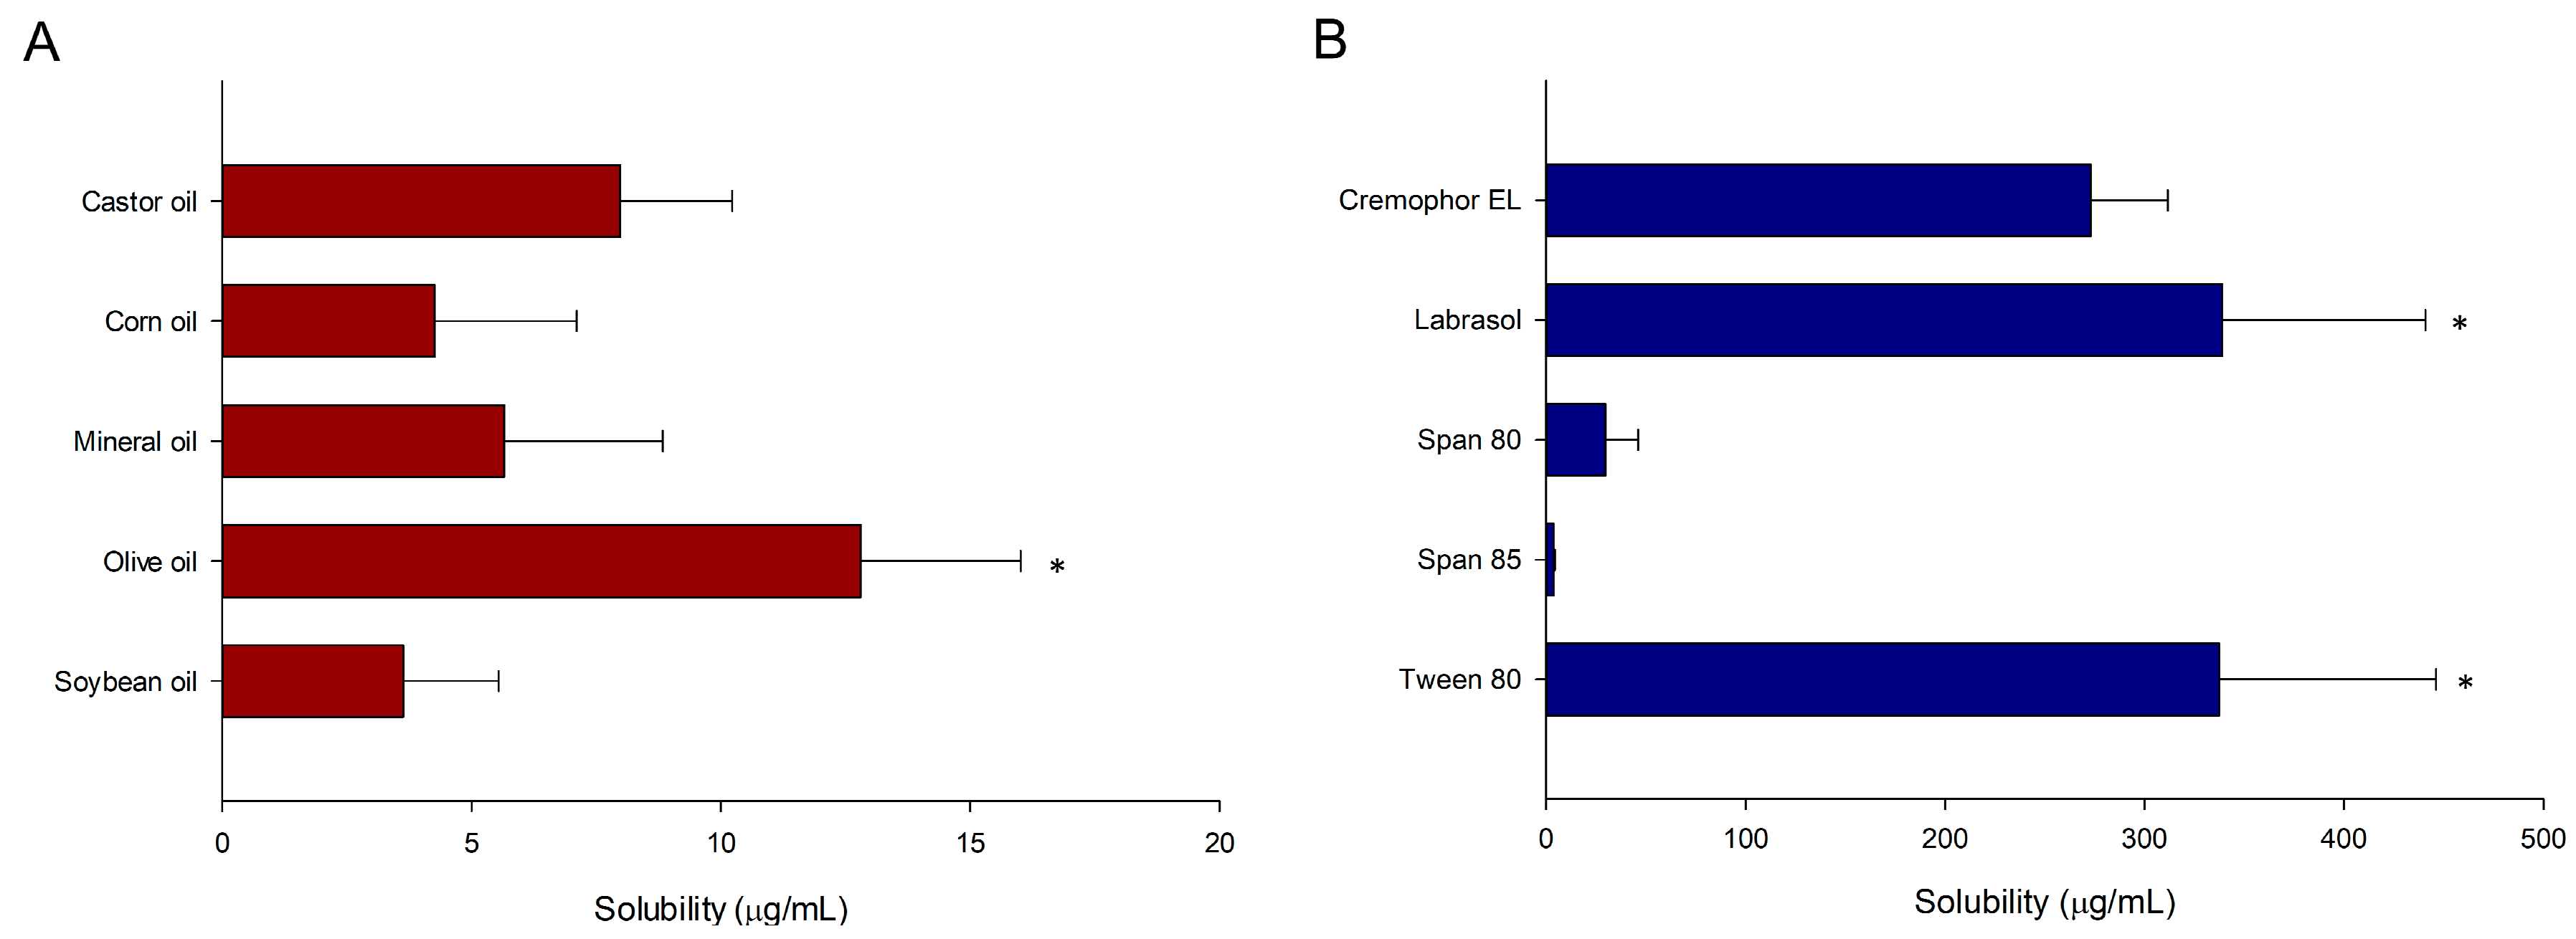
2.2. Screening of Solubility
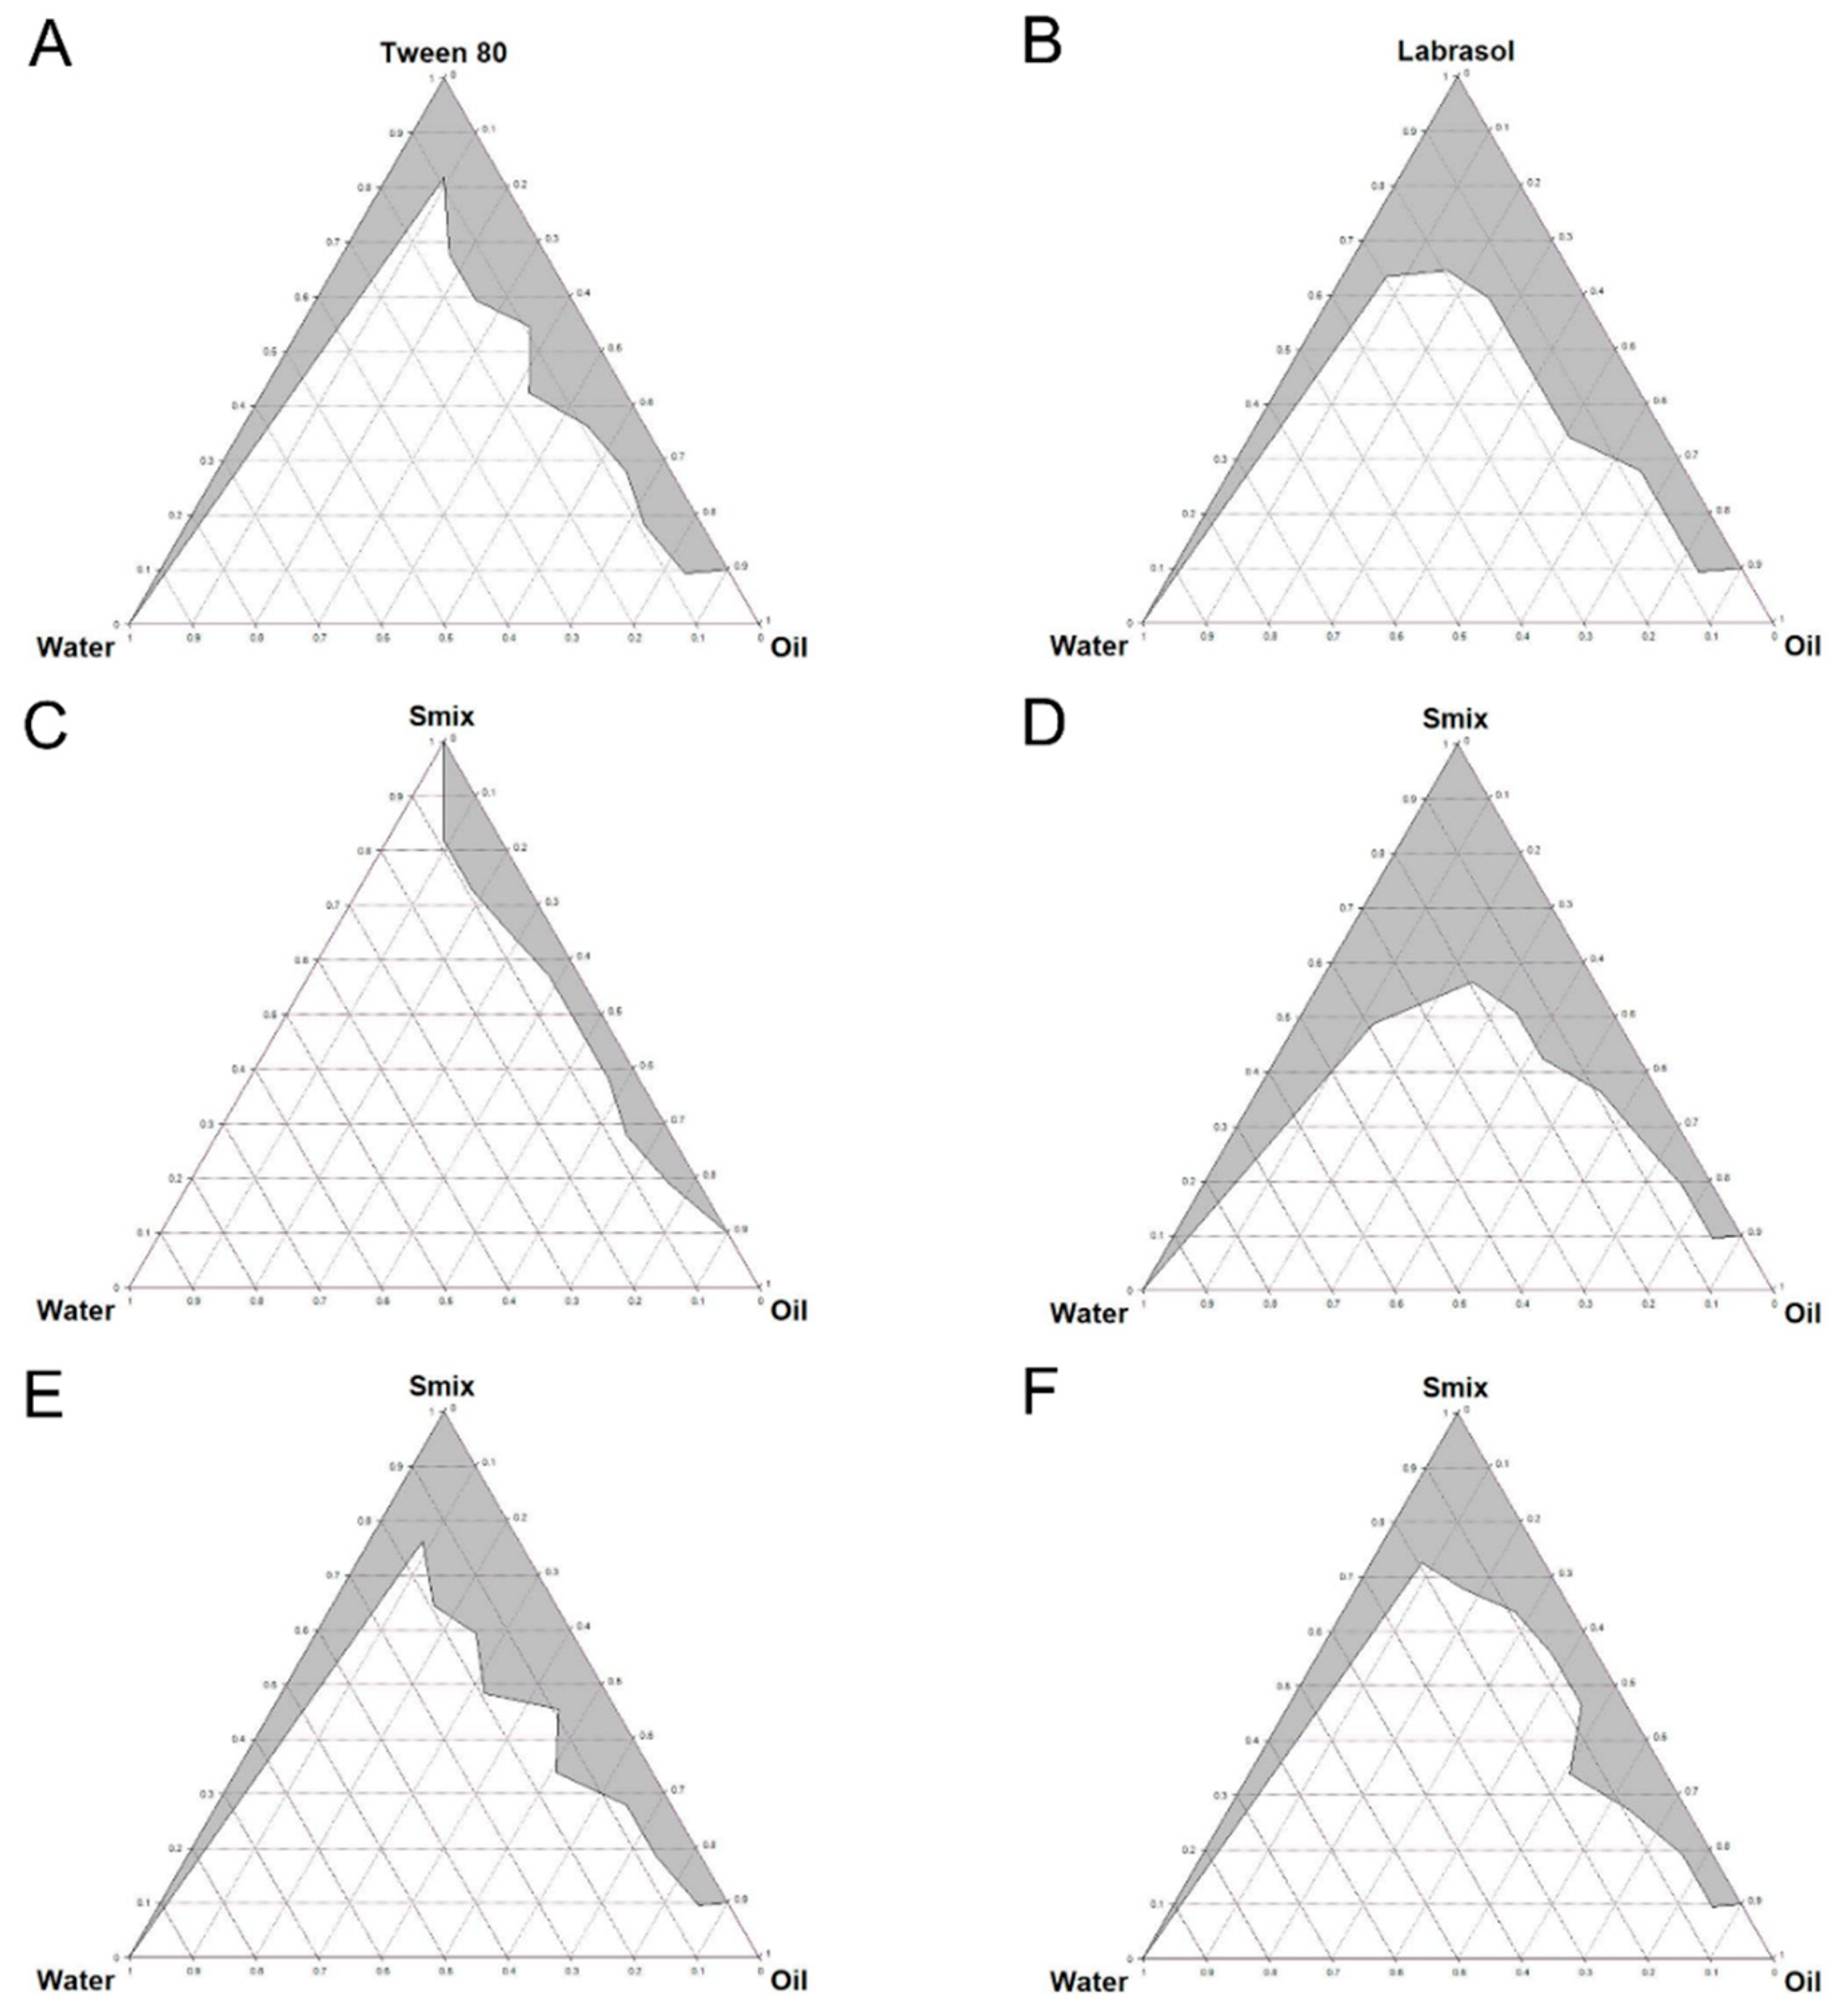
2.3. Constructing Pseudo-Ternary Phase Diagrams
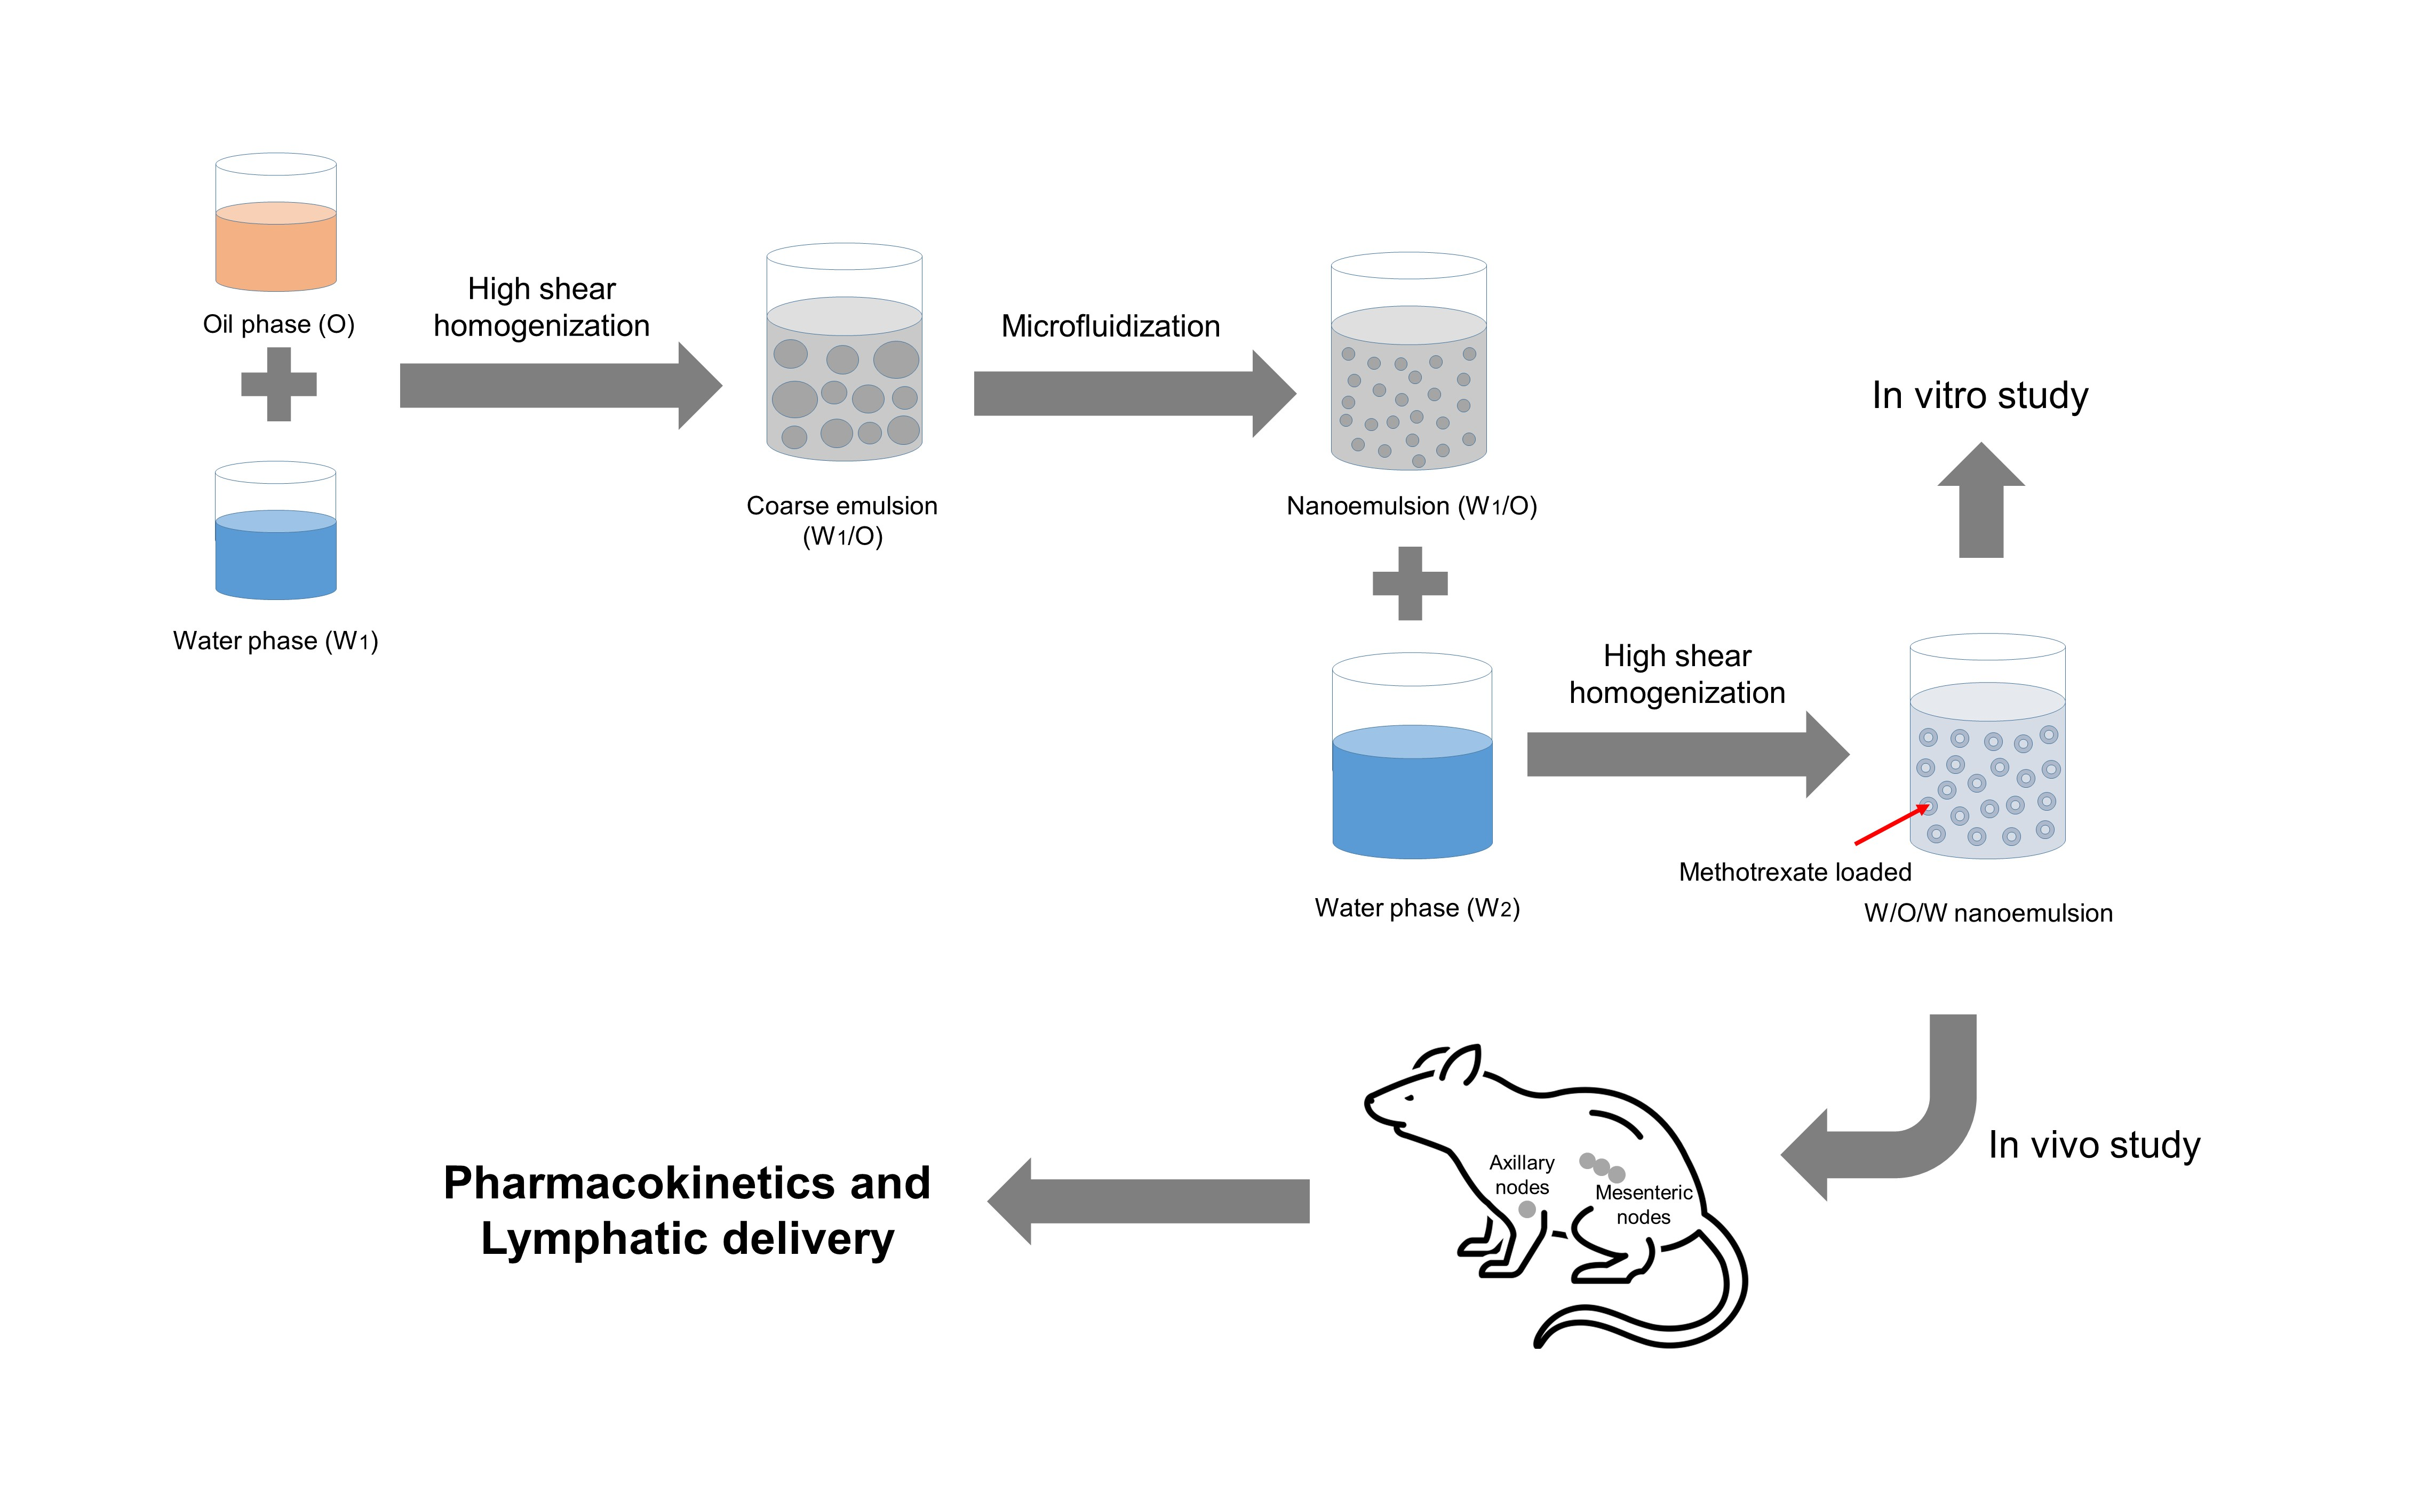
2.4. Preparing the Nanoemulsion
2.5. In Vitro Characterization of Nanoemulsion
2.5.1. Droplet Size, Zeta Potential, and pH
2.5.2. Drug Encapsulation Efficiency
2.5.3. Stability Study
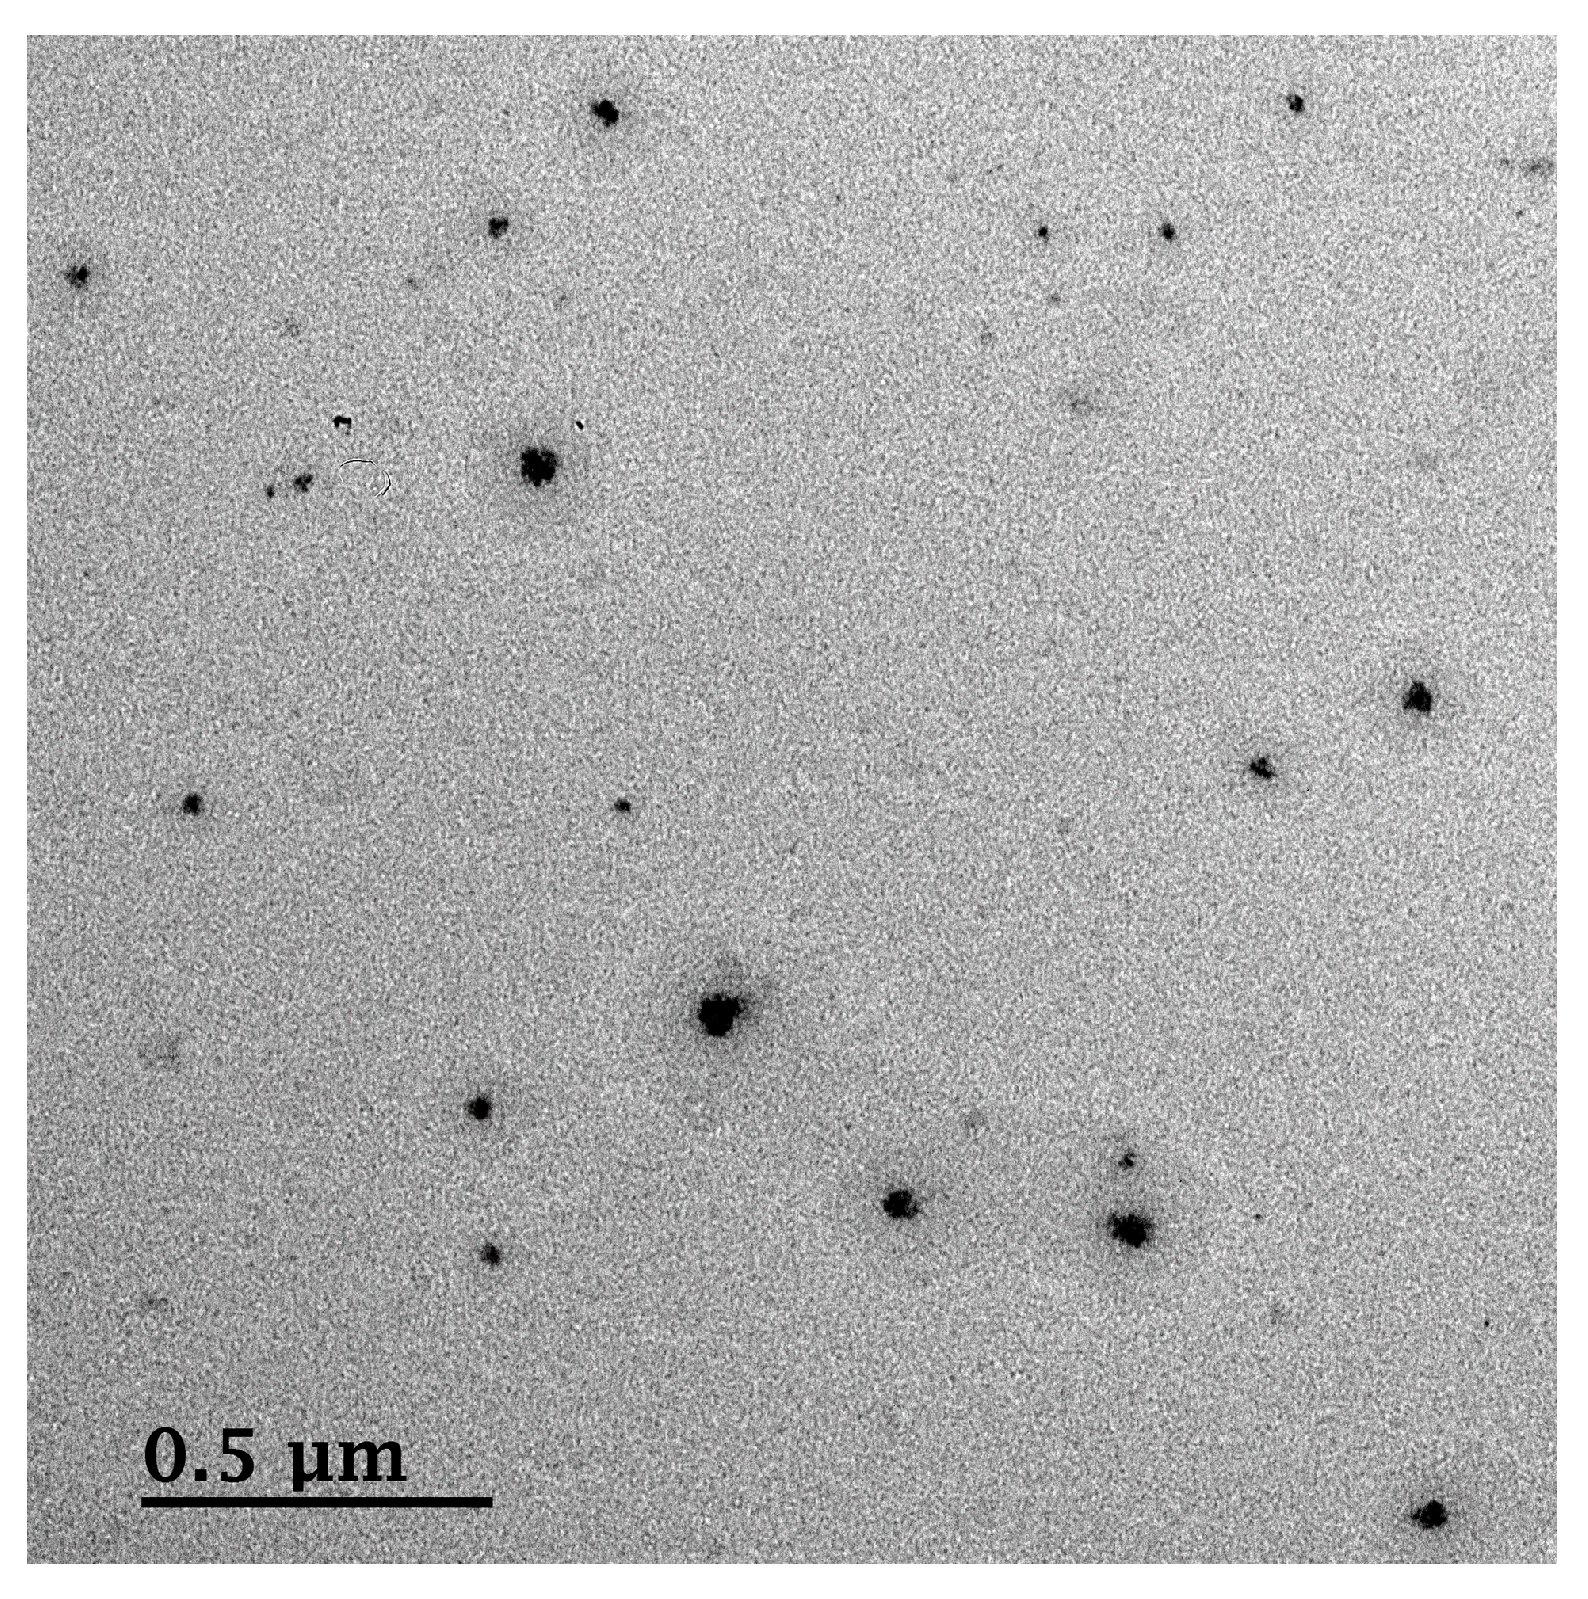
2.5.4. Morphological Analysis
2.5.5. In Vitro Release Study
2.6. In Vivo Studies of Nanoemulsion
2.6.1. Animal Experiments
2.6.2. Quantification of Methotrexate in Biological Samples
2.6.3. Pharmacokinetic Analysis
2.7. Statistical Analysis
3. Results and Discussion
3.1. Screening of Solubility
3.2. Pseudo-Ternary Phase Diagrams
3.3. Preparing the Nanoemulsion
3.3.1. Surfactant/Co-Surfactant Ratio in Water-in-Oil (W1/O) Emulsion
3.3.2. Volume Ratio of Internal Water Phase to Oil Phase (W1:O) and W1/O Emulsion Phase to External Water Phase (W1/O:W2)
3.3.3. Ratio of Methotrexate:Oil in Nanoemulsion
3.3.4. Number of Microfluidizer Passes
3.4. In Vitro Characterization
3.4.1. Physicochemical Characteristics
3.4.2. Morphology
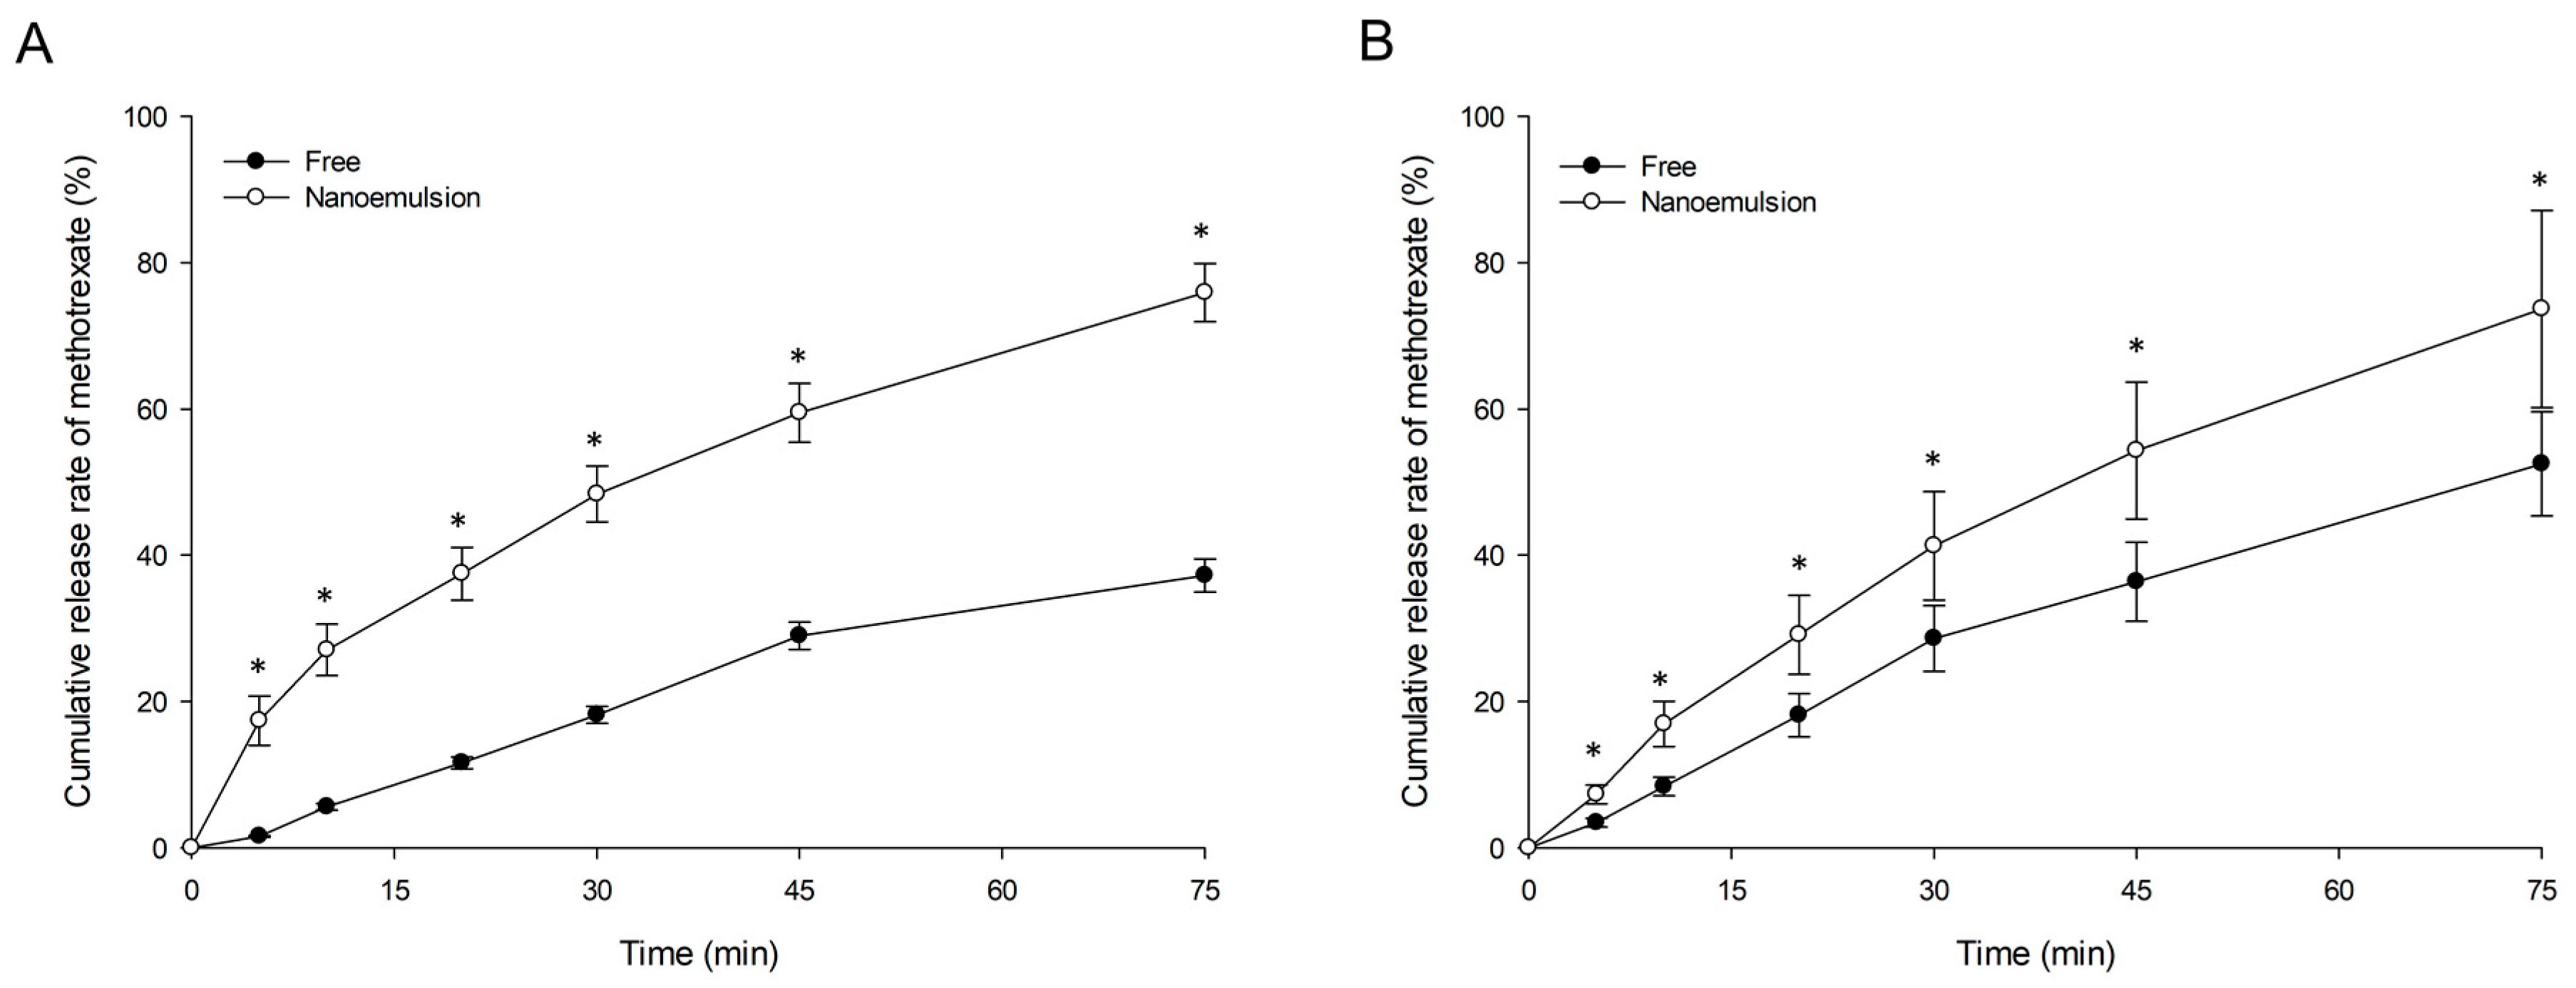
3.4.3. In Vitro Drug Release
3.5. In Vivo Studies
3.5.1. Quantification of Methotrexate in Biological Samples
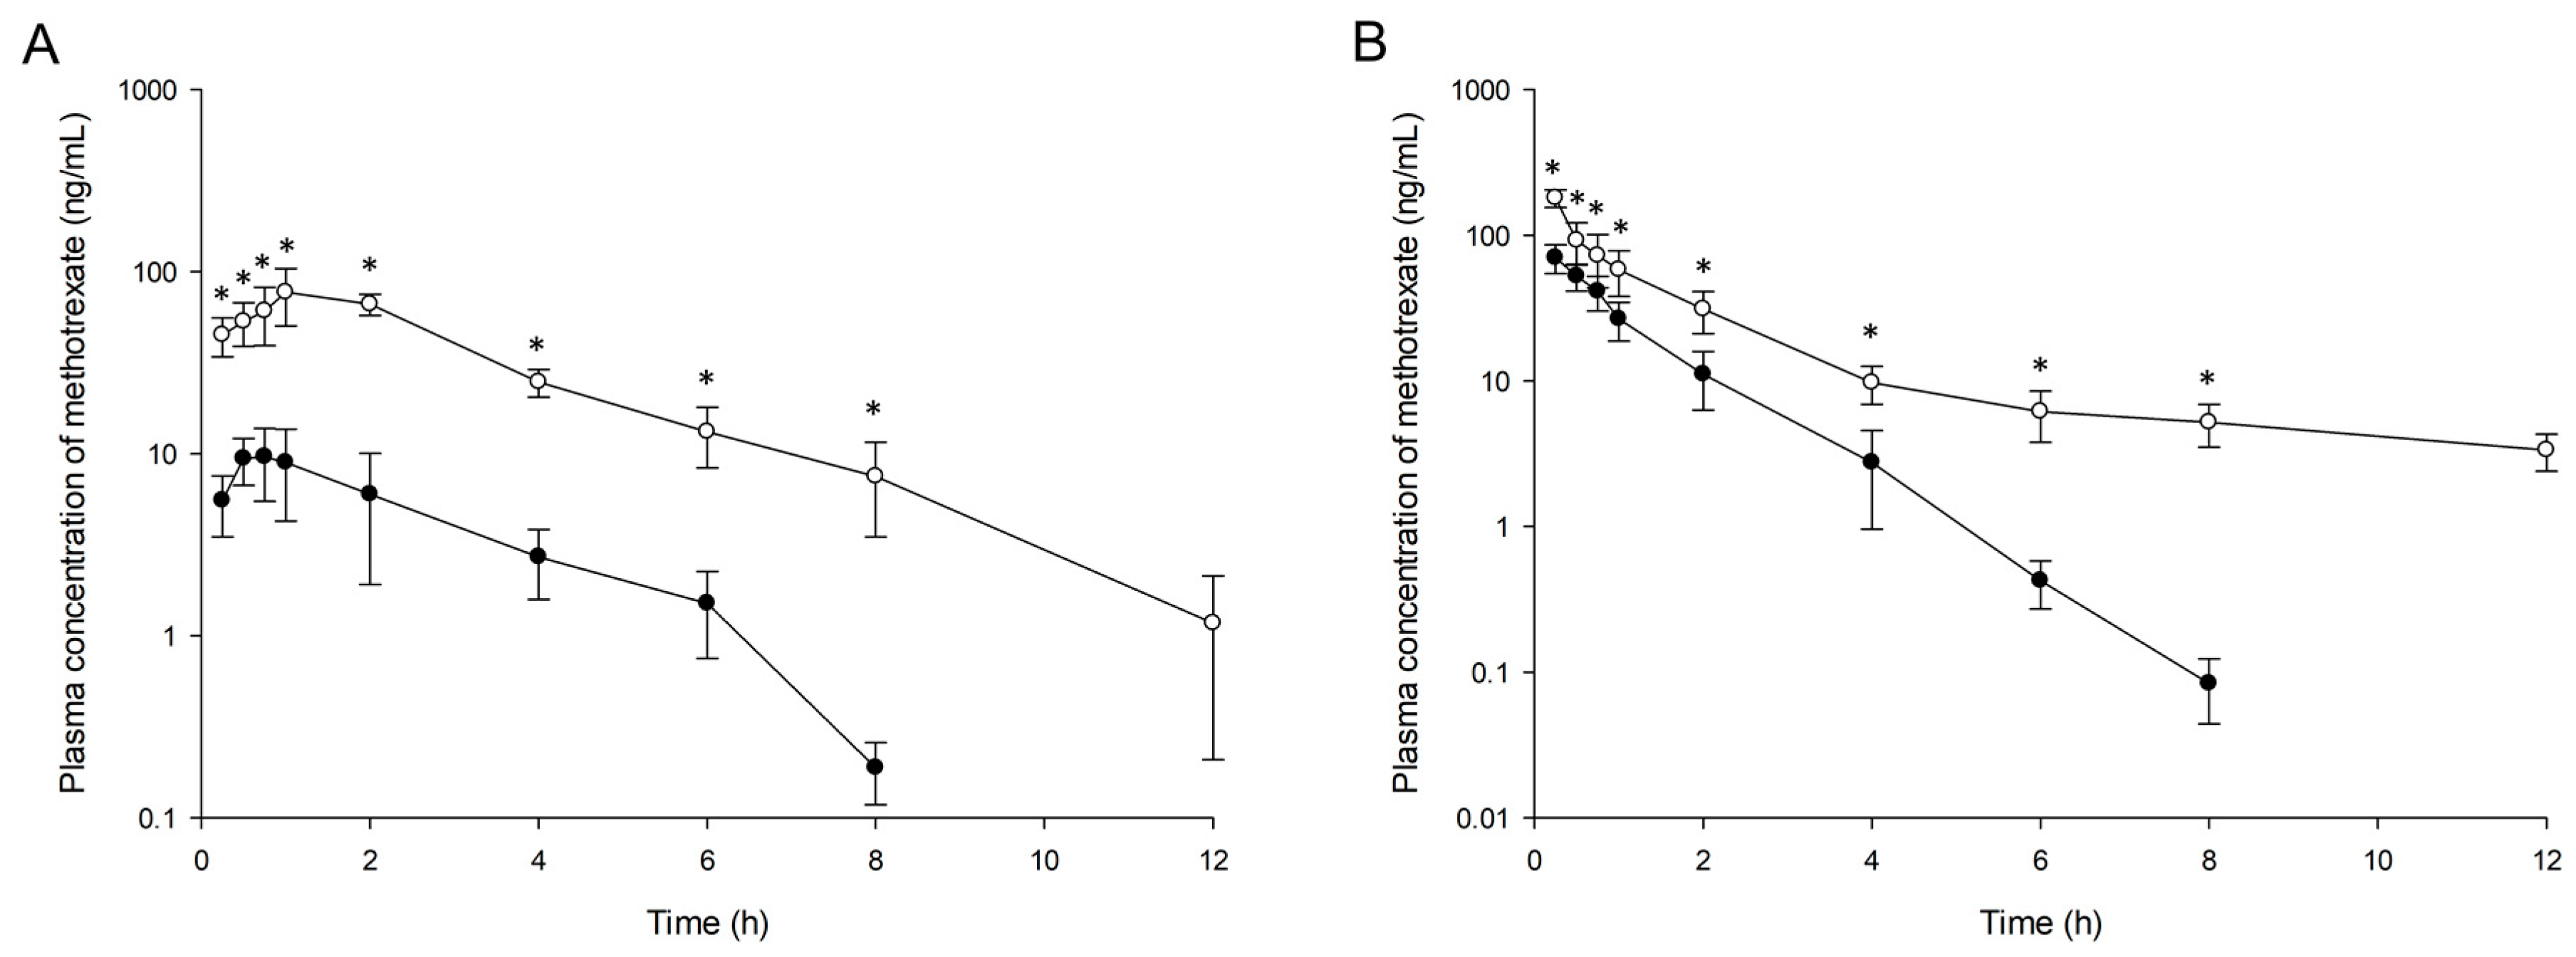
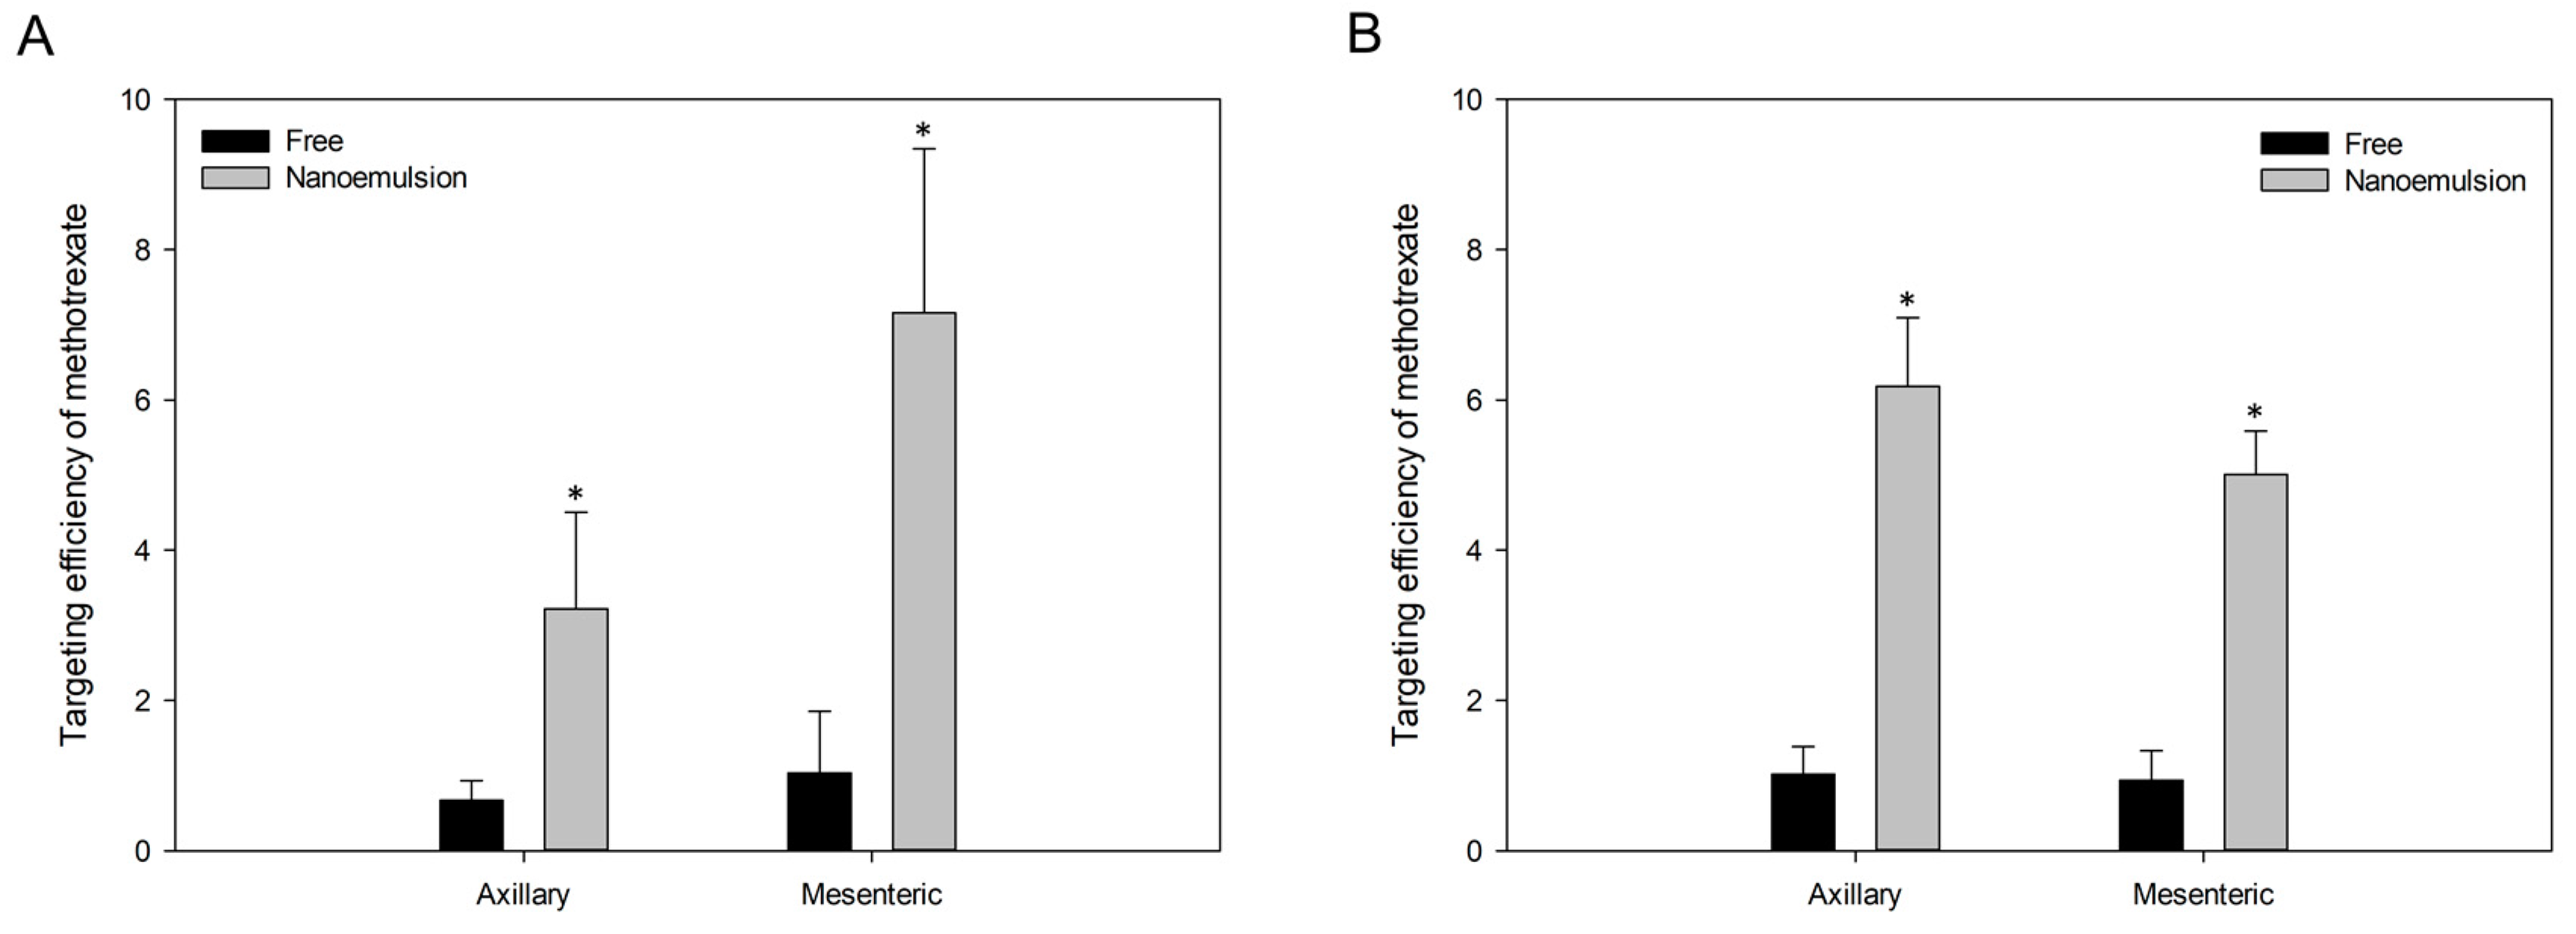
3.5.2. Pharmacokinetics and Targeting Delivery Study
4. Conclusions
Author Contributions
Funding
Conflicts of Interest
References
- Swartz, M.A.; Skobe, M. Lymphatic function, lymphangiogenesis, and cancer metastasis. Microsc. Res. Tech. 2001, 55, 92–99. [Google Scholar] [CrossRef]
- Jurisic, G.; Detmar, M. Lymphatic endothelium in health and disease. Cell Tissue Res. 2009, 335, 97–108. [Google Scholar] [CrossRef]
- Cho, H.-Y.; Lee, Y.-B. Nano-sized drug delivery systems for lymphatic delivery. J. Nanosci. Nanotechnol. 2014, 14, 868–880. [Google Scholar] [CrossRef]
- Padera, T.P.; Meijer, E.F.J.; Munn, L.L. The lymphatic system in disease processes and cancer progression. Annu. Rev. Biomed. Eng. 2016, 18, 125–158. [Google Scholar] [CrossRef]
- Ubellacker, J.M.; Tasdogan, A.; Ramesh, V.; Shen, B.; Mitchell, E.C.; Martin-Sandoval, M.S.; Gu, Z.; McCormick, M.L.; Durham, A.B.; Spitz, D.R.; et al. Lymph protects metastasizing melanoma cells from ferroptosis. Nature 2020, 585, 113–118. [Google Scholar] [CrossRef]
- Porter, C. Drug delivery to the lymphatic system. Crit. Rev. Ther. Drug Carrier Syst. 1997, 14, 333–393. [Google Scholar]
- Zhang, X.-Y.; Lu, W.-Y. Recent advances in lymphatic targeted drug delivery system for tumor metastasis. Cancer Biol. Med. 2014, 11, 247–254. [Google Scholar]
- Jeong, S.-H.; Jang, J.-H.; Cho, H.-Y.; Lee, Y.-B. Soft- and hard-lipid nanoparticles: A novel approach to lymphatic drug delivery. Arch. Pharm. Res. 2018, 41, 797–814. [Google Scholar] [CrossRef]
- Cote, B.; Rao, D.; Alany, R.G.; Kwon, G.S.; Alani, A.W.G. Lymphatic changes in cancer and drug delivery to the lymphatics in solid tumors. Adv. Drug Deliv. Rev. 2019, 144, 16–34. [Google Scholar] [CrossRef]
- Abellan-Pose, R.; Teijeiro-Valiño, C.; Santander-Ortega, M.J.; Borrajo, E.; Vidal, A.; Garcia-Fuentes, M.; Csaba, N.; Alonso, M.J. Polyaminoacid nanocapsules for drug delivery to the lymphatic system: Effect of the particle size. Int. J. Pharm. 2016, 509, 107–117. [Google Scholar] [CrossRef]
- Shrivastava, S.; Gidwani, B.; Kaur, C.D. Development of mebendazole loaded nanostructured lipid carriers for lymphatic targeting: Optimization, characterization, in-vitro and in-vivo evaluation. Part. Sci. Technol. 2020. [Google Scholar] [CrossRef]
- Yasir, M.; Gaur, P.K.; Puri, D.; Shehkar, P.; Kumar, S.S. Solid lipid nanoparticles approach for lymphatic targeting through intraduodenal delivery of quetiapine fumarate. Curr. Drug Deliv. 2018, 15, 818–828. [Google Scholar] [CrossRef] [PubMed]
- Jo, K.; Kim, H.; Khadka, P.; Jang, T.; Kim, S.J.; Hwang, S.-H.; Lee, J. Enhanced intestinal lymphatic absorption of saquinavir through supersaturated self-microemulsifying drug delivery systems. Asian J. Pharm. Sci. 2020, 15, 336–346. [Google Scholar] [CrossRef] [PubMed]
- Purcell, W.T.; Ettinger, D.S. Novel antifolate drugs. Curr. Oncol. Rep. 2003, 5, 114–125. [Google Scholar] [CrossRef] [PubMed]
- Braun, J.; Rau, R. An update on methotrexate. Curr. Opin. Rheumatol. 2009, 21, 216–223. [Google Scholar] [CrossRef]
- Iqbal, M.P. Accumulation of methotrexate in human tissues following high-dose methotrexate therapy. J. Pak. Med. Assoc. 1998, 48, 341–343. [Google Scholar]
- Abolmaali, S.S.; Tamaddon, A.M.; Dinarvand, R. A review of therapeutic challenges and achievements of methotrexate delivery systems for treatment of cancer and rheumatoid arthritis. Cancer Chemother. Pharmacol. 2013, 71, 1115–1130. [Google Scholar] [CrossRef]
- Mahmoodzadeh, F.; Jannat, B.; Ghorbani, M. Chitosan-based nanomicelle as a novel platform for targeted delivery of methotrexate. Int. J. Biol. Macromol. 2019, 126, 517–524. [Google Scholar] [CrossRef]
- Singh, A.; Thotakura, N.; Kumar, R.; Singh, B.; Sharma, G.; Katare, O.P.; Raza, K. PLGA-soya lecithin based micelles for enhanced delivery of methotrexate: Cellular uptake, cytotoxic and pharmacokinetic evidences. Int. J. Biol. Macromol. 2017, 95, 750–756. [Google Scholar] [CrossRef]
- Dhanka, M.; Shetty, C.; Srivastava, R. Injectable methotrexate loaded polycaprolactone microspheres: Physicochemical characterization, biocompatibility, and hemocompatibility evaluation. Mater. Sci. Eng. C 2017, 81, 542–550. [Google Scholar] [CrossRef]
- Ahmadi, D.; Zarei, M.; Rahimi, M.; Khazaie, M.; Asemi, Z.; Mir, S.M.; Sadeghpour, A.; Karimian, A.; Alemi, F.; Rahmati-Yamchi, M.; et al. Preparation and in-vitro evaluation of pH-responsive cationic cyclodextrin coated magnetic nanoparticles for delivery of methotrexate to the Saos-2 bone cancer cells. J. Drug Deliv. Sci. Technol. 2020, 57. [Google Scholar] [CrossRef]
- Muntoni, E.; Martina, K.; Marini, E.; Giorgis, M.; Lazzarato, L.; Salaroglio, I.C.; Riganti, C.; Lanotte, M.; Battaglia, L. Methotrexate-loaded solid lipid nanoparticles: Protein functionalization to improve brain biodistribution. Pharmaceutics 2019, 11, 65. [Google Scholar] [CrossRef]
- Bahramizadeh, M.; Bahramizadeh, M.; Kiafar, B.; Jafarian, A.H.; Nikpoor, A.R.; Hatamipour, M.; Esmaily, H.; Rezaeemehr, Z.; Golmohammadzadeh, S.; Moosavian, S.A.; et al. Development, characterization and evaluation of topical methotrexate-entrapped deformable liposome on imiquimod-induced psoriasis in a mouse model. Int. J. Pharm. 2019, 569. [Google Scholar] [CrossRef]
- Nosrati, H.; Adinehvand, R.; Manjili, H.K.; Rostamizadeh, K.; Danafar, H. Synthesis, characterization, and kinetic release study of methotrexate loaded mPEG–PCL polymersomes for inhibition of MCF-7 breast cancer cell line. Pharm. Dev. Technol. 2019, 24, 89–98. [Google Scholar] [CrossRef] [PubMed]
- Jang, J.-H.; Jeong, S.-H.; Lee, Y.-B. Preparation and in vitro/in vivo characterization of polymeric nanoparticles containing methotrexate to improve lymphatic delivery. Int. J. Mol. Sci. 2019, 20, 3312. [Google Scholar] [CrossRef] [PubMed]
- Sheng, Y.; Liu, C.; Yuan, Y.; Tao, X.; Yang, F.; Shan, X.; Zhou, H.; Xu, F. Long-circulating polymeric nanoparticles bearing a combinatorial coating of PEG and water-soluble chitosan. Biomaterials 2009, 30, 2340–2348. [Google Scholar] [CrossRef] [PubMed]
- Dobrovolskaia, M.A.; Aggarwal, P.; Hall, J.B.; McNeil, S.E. Preclinical studies to understand nanoparticle interaction with the immune system and its potential effects on nanoparticle biodistribution. Mol. Pharm. 2008, 5, 487–495. [Google Scholar] [CrossRef]
- Jaiswal, M.; Dudhe, R.; Sharma, P.K. Nanoemulsion: An advanced mode of drug delivery system. 3 Biotech 2015, 5, 123–127. [Google Scholar] [CrossRef]
- Gupta, P.K.; Bhandari, N.; Shah, H.N.; Khanchandani, V.; Keerthana, R.; Nagarajan, V.; Hiremath, L. An Update on Nanoemulsions Using Nanosized Liquid in Liquid Colloidal Systems. In Nanoemulsions-Properties, Fabrications and Applications; Koh, K.S., Ed.; IntechOpen: London, UK, 2019. [Google Scholar]
- Sheth, T.; Seshadri, S.; Prileszky, T.; Helgeson, M.E. Multiple nanoemulsions. Nat. Rev. Mater. 2020, 5, 214–228. [Google Scholar] [CrossRef]
- McClements, D.J.; Decker, E.A.; Weiss, J. Emulsion-based delivery systems for lipophilic bioactive components. J. Food Sci. 2007, 72, R109–R124. [Google Scholar] [CrossRef]
- Wang, J.; Shi, A.; Agyei, D.; Wang, Q. Formulation of water-in-oil-in-water (W/O/W) emulsions containing trans-resveratrol. RSC Adv. 2017, 7, 35917–35927. [Google Scholar] [CrossRef]
- Lee, P.J.; Langer, R.; Shastri, V.P. Novel microemulsion enhancer formulation for simultaneous transdermal delivery of hydrophilic and hydrophobic drugs. Pharm. Res. 2003, 20, 264–269. [Google Scholar] [CrossRef] [PubMed]
- Lawrence, M.J.; Rees, G.D. Microemulsion-based media as novel drug delivery systems. Adv. Drug Deliv. Rev. 2000, 45, 89–121. [Google Scholar] [CrossRef]
- Rajitha, P.; Shammika, P.; Aiswarya, S.; Gopikrishnan, A.; Jayakumar, R.; Sabitha, M. Chaulmoogra oil based methotrexate loaded topical nanoemulsion for the treatment of psoriasis. J. Drug Deliv. Sci. Technol. 2019, 49, 463–476. [Google Scholar] [CrossRef]
- Syed, H.K.; Peh, K.K. Identification of phases of various oil, surfactant/co-surfactants and water system by ternary phase diagram. Acta Pol. Pharm. 2014, 71, 301–309. [Google Scholar]
- D’Souza, S. A review of in vitro drug release test methods for nano-sized dosage forms. Adv. Pharm. 2014, 2014. [Google Scholar] [CrossRef]
- Shin, S.B.; Cho, H.Y.; Kim, D.D.; Choi, H.G.; Lee, Y.B. Preparation and evaluation of tacrolimus-loaded nanoparticles for lymphatic delivery. Eur. J. Pharm. Biopharm. 2010, 74, 164–171. [Google Scholar] [CrossRef]
- Gajanan, G.V.; Milind, G.M.; Adhikrao, Y. Different techniques for preparation of nanoemulsion with characterisation and various application of it—A review. World J. Pharm. Res 2017, 6, 112–128. [Google Scholar]
- Sarker, A.; Shimu, I.J.; Tuhin, R.H.; Raju, A.A. Nanoemulsion: An excellent mode for delivery of poorly soluble drug through different routes. J. Chem. Pharm. Res. 2015, 7, 966–976. [Google Scholar]
- Trotta, M.; Gallarate, M.; Pattarino, F.; Carlotti, M.E. Investigation of the phase behaviour of systems containing lecithin and 2-acyl lysolecithin derivatives. Int. J. Pharm. 1999, 190, 83–89. [Google Scholar] [CrossRef]
- Zheng, W.-W.; Zhao, L.; Wei, Y.-M.; Ye, Y.; Xiao, S.-H. Preparation and the in vitro evaluation of nanoemulsion system for the transdermal delivery of granisetron hydrochloride. Chem. Pharm. Bull. 2010, 58, 1015–1019. [Google Scholar] [CrossRef]
- Yen, C.-C.; Chen, Y.-C.; Wu, M.-T.; Wang, C.-C.; Wu, Y.-T. Nanoemulsion as a strategy for improving the oral bioavailability and anti-inflammatory activity of andrographolide. Int. J. Nanomed. 2018, 13, 669–680. [Google Scholar] [CrossRef] [PubMed]
- McClements, D.J.; Rao, J. Food-grade nanoemulsions: Formulation, fabrication, properties, performance, biological fate, and potential toxicity. Crit. Rev. Food Sci. Nutr. 2011, 51, 285–330. [Google Scholar] [CrossRef]
- Paliwal, R.; Rai, S.; Vaidya, B.; Khatri, K.; Goyal, A.K.; Mishra, N.; Mehta, A.; Vyas, S.P. Effect of lipid core material on characteristics of solid lipid nanoparticles designed for oral lymphatic delivery. Nanomedicine 2009, 5, 184–191. [Google Scholar] [CrossRef] [PubMed]
- Gupta, A.; Eral, H.B.; Hatton, T.A.; Doyle, P.S. Nanoemulsions: Formation, properties and applications. Soft Matter 2016, 12, 2826–2841. [Google Scholar] [CrossRef]
- Gothsch, T.; Finke, J.H.; Beinert, S.; Lesche, C.; Schur, J.; Büttgenbach, S.; Müller-Goymann, C.; Kwade, A. Effect of microchannel geometry on high-pressure dispersion and emulsification. Chem. Eng. Technol. 2011, 34, 335–343. [Google Scholar] [CrossRef]
- Kaszuba, M.; Corbett, J.; Watson, F.M.; Jones, A. High-concentration zeta potential measurements using light-scattering techniques. Phil. Trans. R. Soc. A 2010, 368, 4439–4451. [Google Scholar] [CrossRef]
- Lu, G.W.; Gao, P. Emulsions and Microemulsions for Topical and Transdermal Drug Delivery. In Handbook of Non-Invasive Drug Delivery Systems; Kulkarni, V.S., Ed.; William Andrew Publishing: Boston, MA, USA, 2010; pp. 59–94. [Google Scholar]
- Ganta, S.; Talekar, M.; Singh, A.; Coleman, T.P.; Amiji, M.M. Nanoemulsions in translational research-opportunities and challenges in targeted cancer therapy. AAPS PharmSciTech 2014, 15, 694–708. [Google Scholar] [CrossRef] [PubMed]
- Lorenzer, C.; Dirin, M.; Winkler, A.M.; Baumann, V.; Winkler, J. Going beyond the liver: Progress and challenges of targeted delivery of siRNA therapeutics. J. Control. Release 2015, 203, 1–15. [Google Scholar] [CrossRef] [PubMed]
- Turner, P.V.; Pekow, C.; Vasbinder, M.A.; Brabb, T. Administration of substances to laboratory animals: Equipment considerations, vehicle selection, and solute preparation. J. Am. Assoc. Lab. Anim. Sci. 2011, 50, 614–627. [Google Scholar]
- Li, P.; Zhao, L. Developing early formulations: Practice and perspective. Int. J. Pharm. 2007, 341, 1–19. [Google Scholar] [CrossRef] [PubMed]
- Yeom, D.W.; Chae, B.R.; Son, H.Y.; Kim, J.H.; Chae, J.S.; Song, S.H.; Oh, D.; Choi, Y.W. Enhanced oral bioavailability of valsartan using a polymer-based supersaturable self-microemulsifying drug delivery system. Int. J. Nanomed. 2017, 12, 3533–3545. [Google Scholar] [CrossRef] [PubMed]
- Kallakunta, V.R.; Bandari, S.; Jukanti, R.; Veerareddy, P.R. Oral self emulsifying powder of lercanidipine hydrochloride: Formulation and evaluation. Powder Technol. 2012, 221, 375–382. [Google Scholar] [CrossRef]
- FDA. Guidance for Industry: Bioanalytical Method Validation; US Department of Health and Human Services, Food and Drug Administration, Center for Drug Evaluation and Research (CDER), Center for Veterinary Medicine (CVM): Rockville, MD, USA, 2018. [Google Scholar]
- Manaargadoo-Catin, M.; Ali-Cherif, A.; Pougnas, J.-L.; Perrin, C. Hemolysis by surfactants—A review. Adv. Colloid Interface Sci. 2016, 228, 1–16. [Google Scholar] [CrossRef] [PubMed]
- McCartney, F.; Jannin, V.; Chevrier, S.; Boulghobra, H.; Hristov, D.R.; Ritter, N.; Miolane, C.; Chavant, Y.; Demarne, F.; Brayden, D.J. Labrasol® is an efficacious intestinal permeation enhancer across rat intestine: ex vivo and in vivo rat studies. J. Control. Release 2019, 310, 115–126. [Google Scholar] [CrossRef] [PubMed]
- Chavda, V.P.; Shah, D. Self-emulsifying delivery systems: One step ahead in improving solubility of poorly soluble drugs. In Nanostructures for Cancer Therapy; Ficai, A., Grumezescu, A.M., Eds.; Elsevier: Amsterdam, The Netherlands, 2017; pp. 653–718. [Google Scholar]


| Smix (%, v/v) | W1/O (%, v/v) | Size (nm) |
|---|---|---|
| 40 | 12/48 | 6865.13 ± 438.91 |
| 50 | 10/40 | 5018.33 ± 52.21 |
| 60 † | 8/32 | 379.4 ± 21.43 |
| W1:O Ratio (v/v) | Size (nm) |
|---|---|
| 10:90 | 1130.73 ± 112.04 |
| 20:80 † | 449.27 ± 31.68 |
| 30:70 | 586.73 ± 20.87 |
| 40:60 | 5035.20 ± 579.16 |
| W1/O:W2 Ratio (v/v) | Size (nm) |
|---|---|
| 1:2 | 1142.17 ± 102.62 |
| 1:3 † | 449.27 ± 31.68 |
| 1:4 | 1812.30 ± 232.11 |
| Methotrexate/Oil Ratio (w/v) | Size (nm) |
|---|---|
| 0:1 | 449.27 ± 31.68 |
| 1:4 | 1142.00 ± 117.55 |
| 1:2 † | 530.53 ± 40.19 |
| 1:1 | 713.43 ± 43.75 |
| 2:1 | 2206.67 ± 249.35 |
| Time (Day) | Size (nm) | Zeta Potential (mV) | Encapsulation Efficiency (%) | pH |
|---|---|---|---|---|
| 0 | 173.77 ± 5.76 | −35.63 ± 0.78 | 90.37 ± 0.96 | 4.07 ± 0.03 |
| 1 | 178.23 ± 6.95 | −35.57 ± 0.65 | 90.20 ± 1.21 | 4.08 ± 0.06 |
| 3 | 178.83 ± 9.14 | −35.43 ± 0.78 | 90.77 ± 1.12 | 4.11 ± 0.05 |
| 7 | 178.47 ± 4.96 | −35.23 ± 0.80 | 89.57 ± 0.47 | 4.06 ± 0.05 |
| 14 | 178.57 ± 5.73 | −34.93 ± 0.65 | 90.13 ± 1.46 | 4.09 ± 0.06 |
| Parameters | Oral (0.06 mg/kg as Methotrexate) | IV (0.024 mg/kg as Methotrexate) | ||
|---|---|---|---|---|
| Free | Nanoemulsion | Free | Nanoemulsion | |
| AUC0–t (ng·h/mL) | 29.31 ± 7.70 | 288.35 ± 51.14 * | 93.10 ± 17.72 | 268.94 ± 41.85 * |
| AUC0–∞ (ng·h/mL) | 29.62 ± 7.77 | 291.34 ± 54.01 * | 93.20 ± 17.70 | 300.56 ± 36.10 * |
| Cmax (ng/mL) | 12.13 ± 3.38 | 81.72 ± 23.01 * | - | - |
| Tmax (h) | 0.70 ± 0.21 | 1.35 ± 0.60 | - | - |
| t1/2 (h) | 1.11 ± 0.20 | 1.58 ± 0.30 * | 0.83 ± 0.15 | 6.38 ± 1.77 * |
| CL (mL/h·kg) | - | - | 263.98 ± 43.02 | 80.94 ± 11.38 * |
| Vd (mL/kg) | - | - | 320.49 ± 88.50 | 748.38 ± 232.69 * |
| F (%) | 12.71 | 38.77 | - | - |
Publisher’s Note: MDPI stays neutral with regard to jurisdictional claims in published maps and institutional affiliations. |
© 2020 by the authors. Licensee MDPI, Basel, Switzerland. This article is an open access article distributed under the terms and conditions of the Creative Commons Attribution (CC BY) license (http://creativecommons.org/licenses/by/4.0/).
Share and Cite
Jang, J.-H.; Jeong, S.-H.; Lee, Y.-B. Enhanced Lymphatic Delivery of Methotrexate Using W/O/W Nanoemulsion: In Vitro Characterization and Pharmacokinetic Study. Pharmaceutics 2020, 12, 978. https://doi.org/10.3390/pharmaceutics12100978
Jang J-H, Jeong S-H, Lee Y-B. Enhanced Lymphatic Delivery of Methotrexate Using W/O/W Nanoemulsion: In Vitro Characterization and Pharmacokinetic Study. Pharmaceutics. 2020; 12(10):978. https://doi.org/10.3390/pharmaceutics12100978
Chicago/Turabian StyleJang, Ji-Hun, Seung-Hyun Jeong, and Yong-Bok Lee. 2020. "Enhanced Lymphatic Delivery of Methotrexate Using W/O/W Nanoemulsion: In Vitro Characterization and Pharmacokinetic Study" Pharmaceutics 12, no. 10: 978. https://doi.org/10.3390/pharmaceutics12100978
APA StyleJang, J.-H., Jeong, S.-H., & Lee, Y.-B. (2020). Enhanced Lymphatic Delivery of Methotrexate Using W/O/W Nanoemulsion: In Vitro Characterization and Pharmacokinetic Study. Pharmaceutics, 12(10), 978. https://doi.org/10.3390/pharmaceutics12100978