
Sex-Dependent Differences in Predictive Value of the C2HEST Score in Subjects with COVID-19—A Secondary Analysis of the COLOS Study

 , ,
, ,  , , , , , , ,
  ,
,  , , , , , , add
Show full author list
, , , , , , add
Show full author list
Abstract
1. Introduction
2. Materials and Methods
2.1. Study Design and Population
2.2. Follow-Up and Outcomes
2.3. Statistical Analysis
3. Results
3.1. Baseline Demographical and Clinical Features of the Studied Population
3.2. Specific Treatment Applied during Hospitalization
3.3. Association C2HEST Score with Results and Mortality
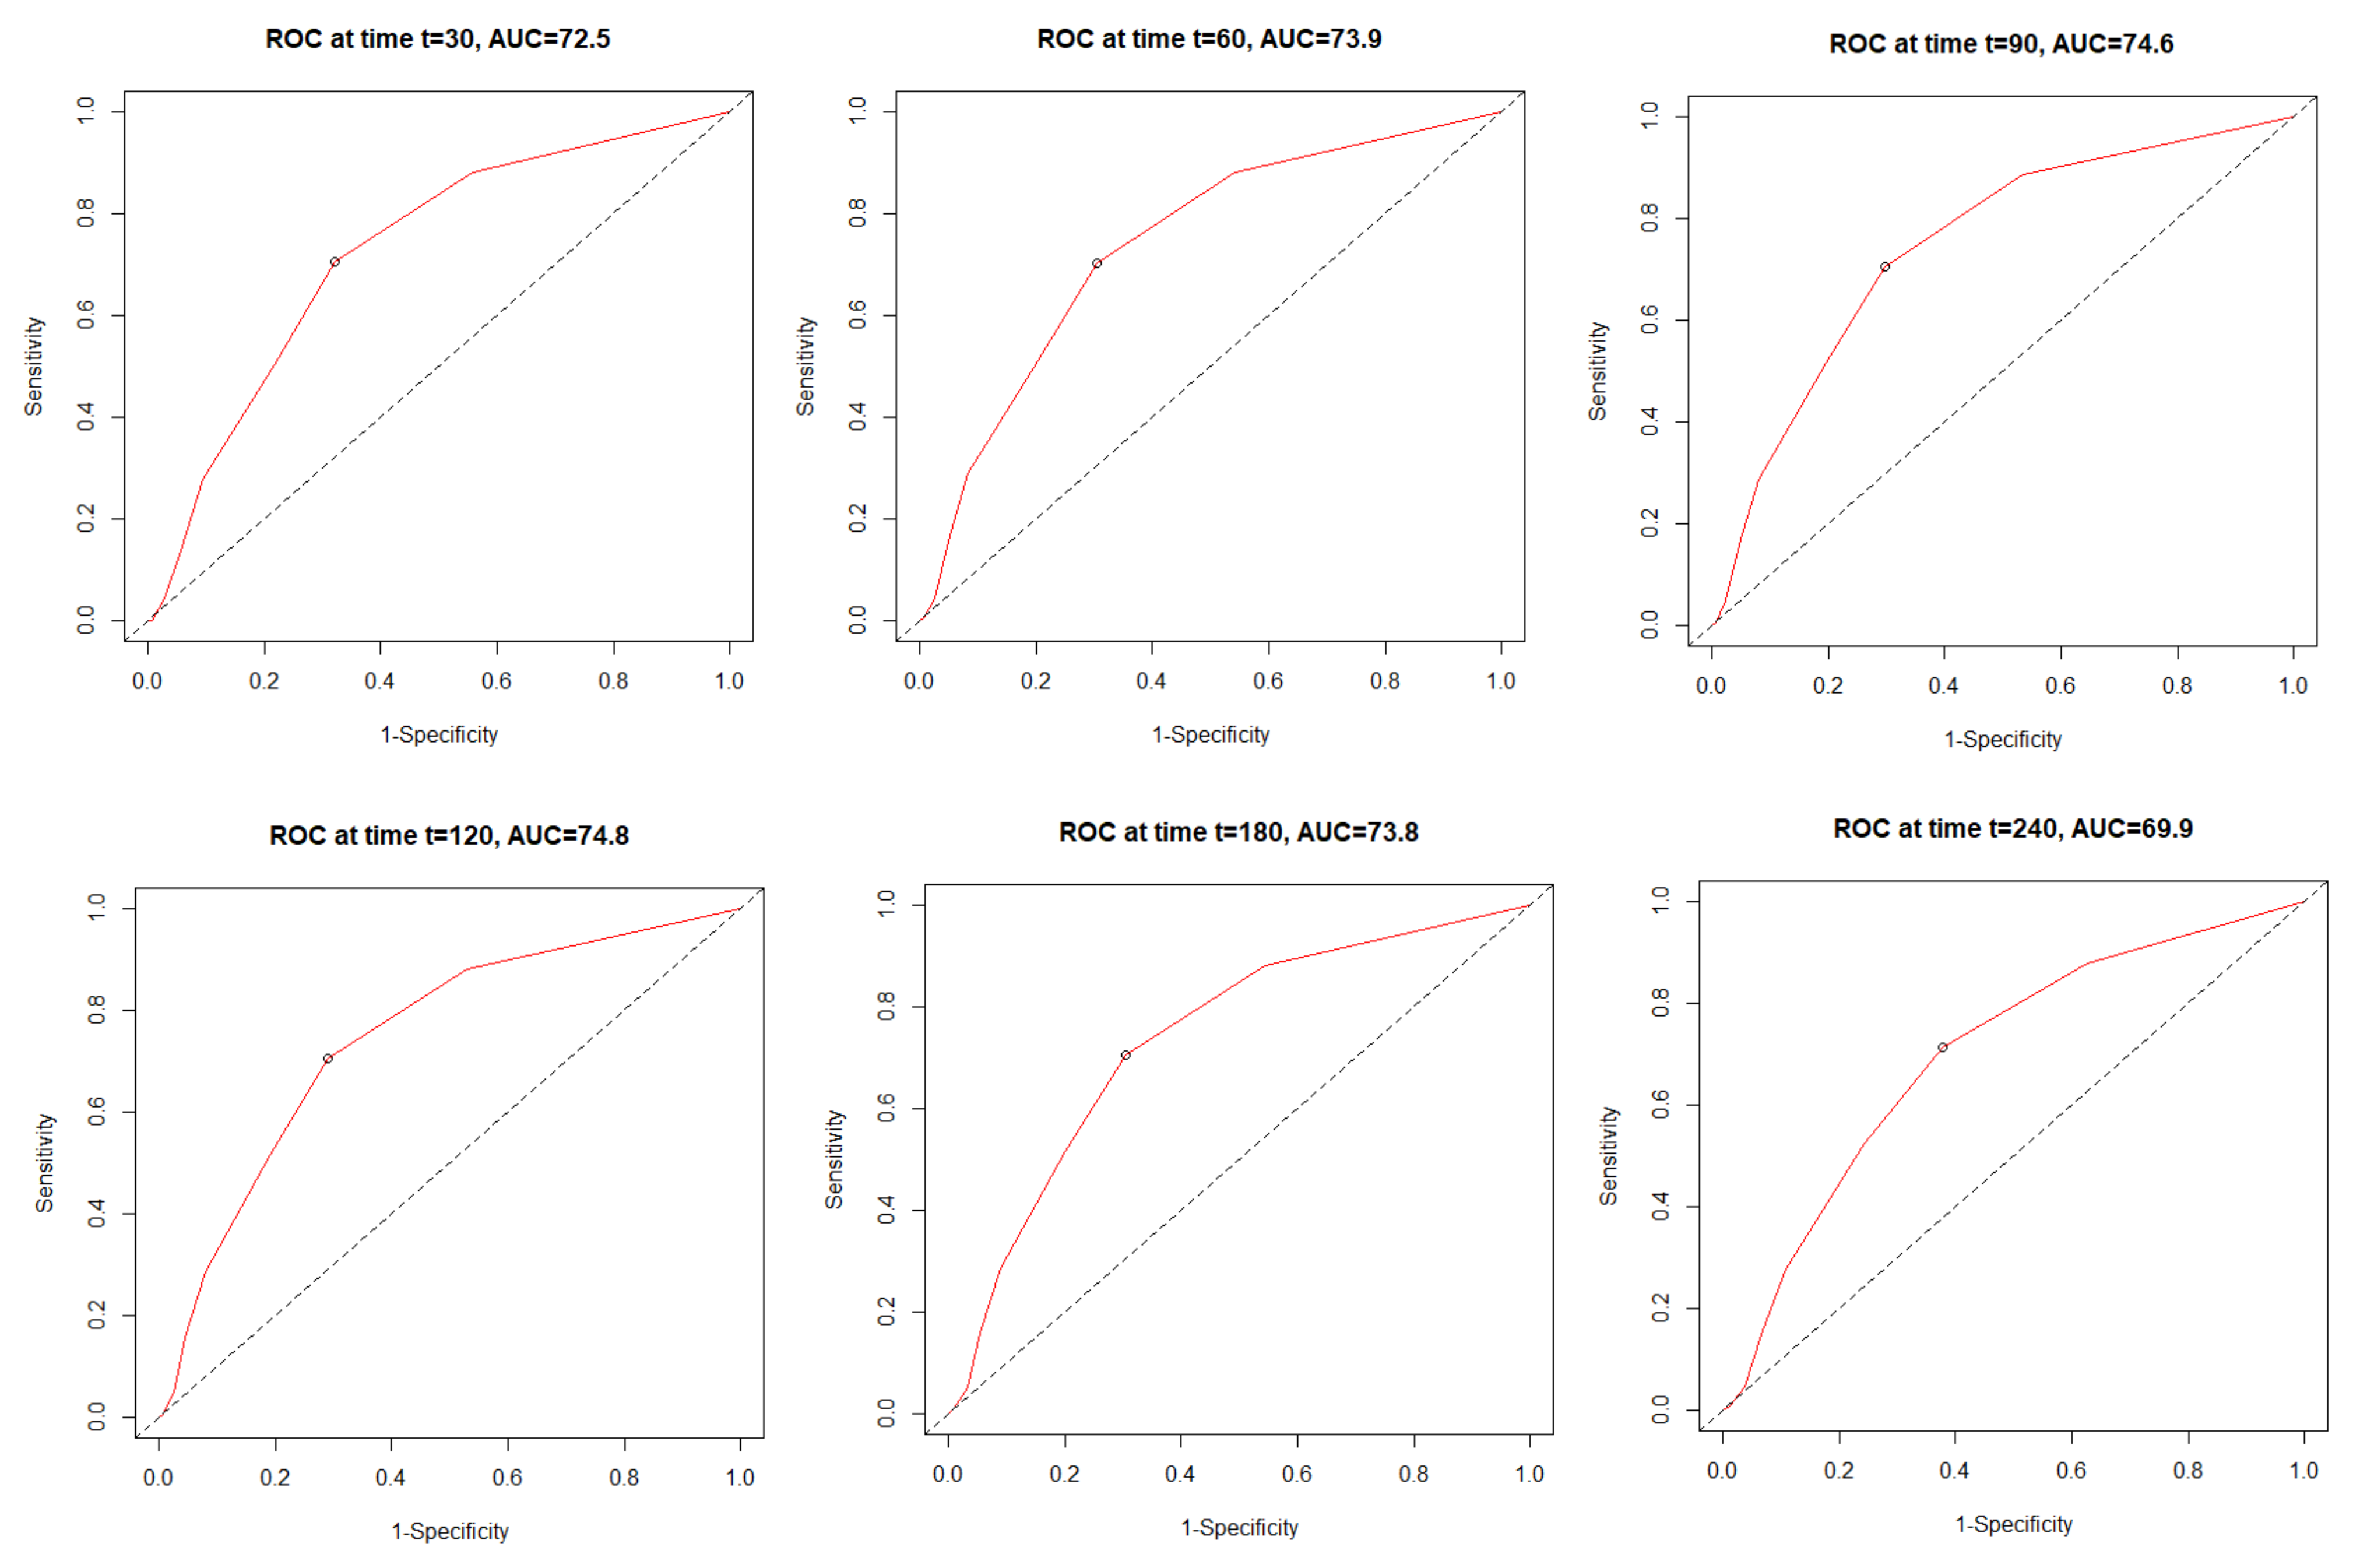
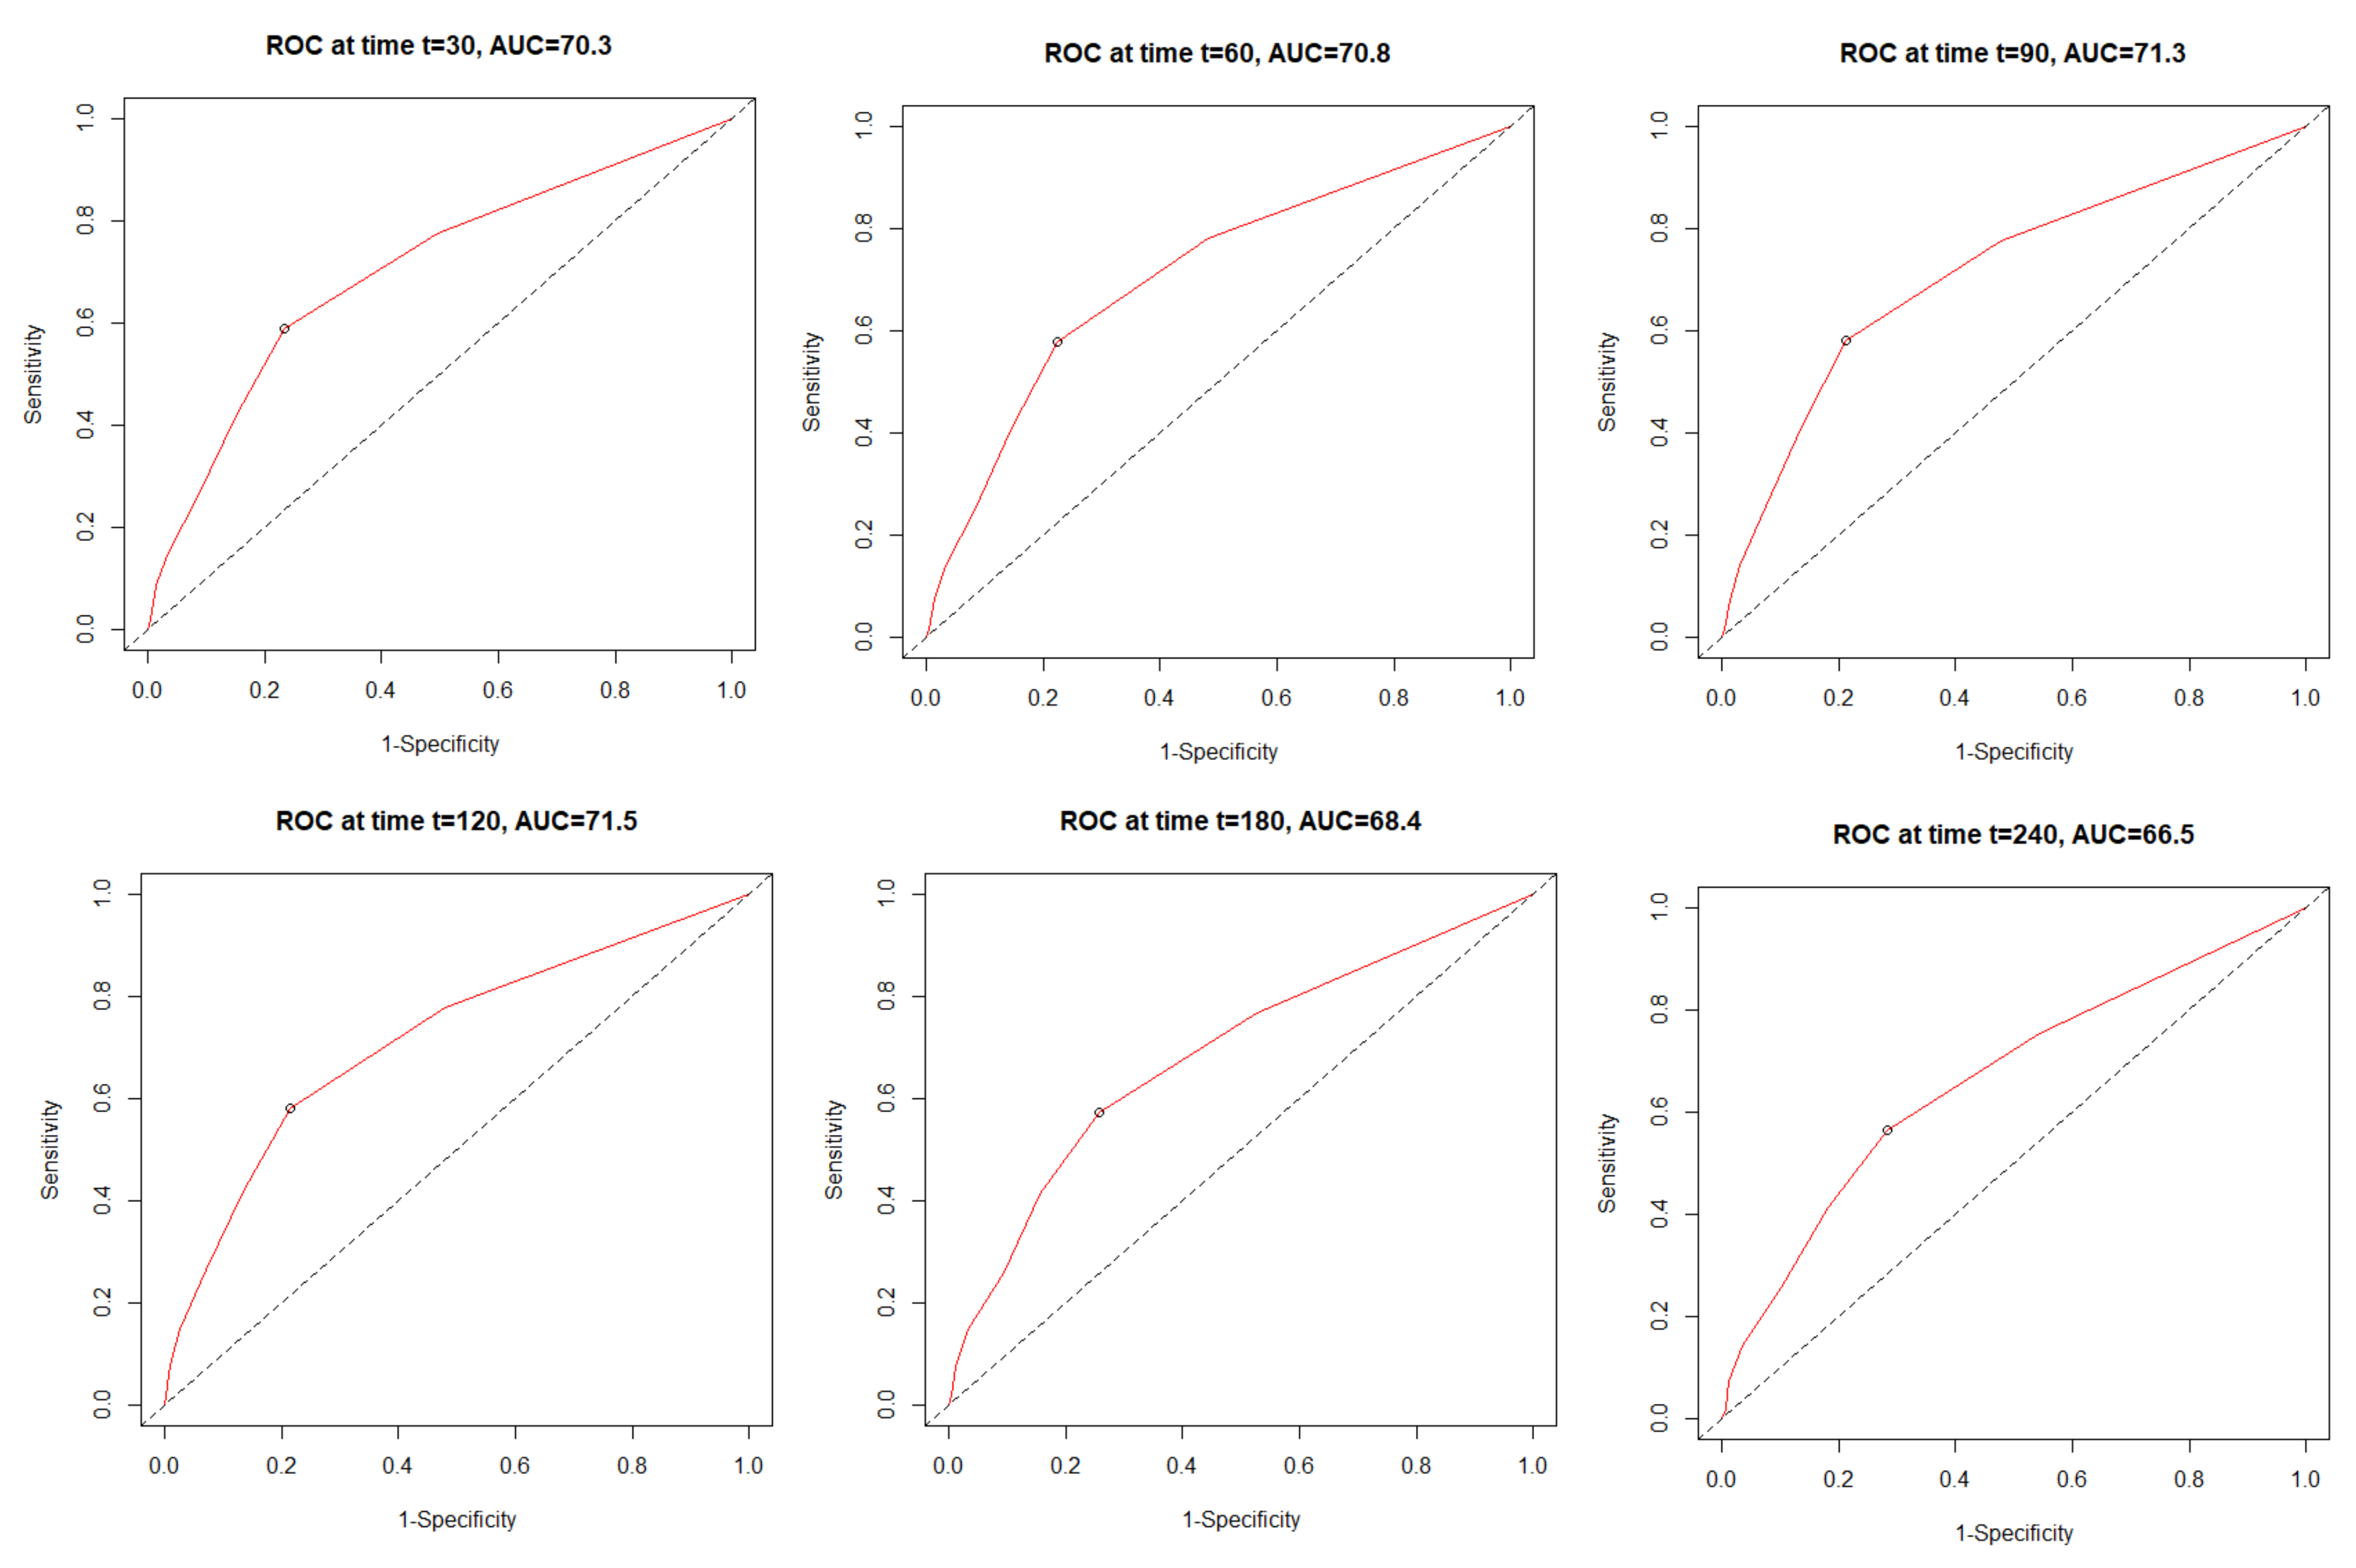
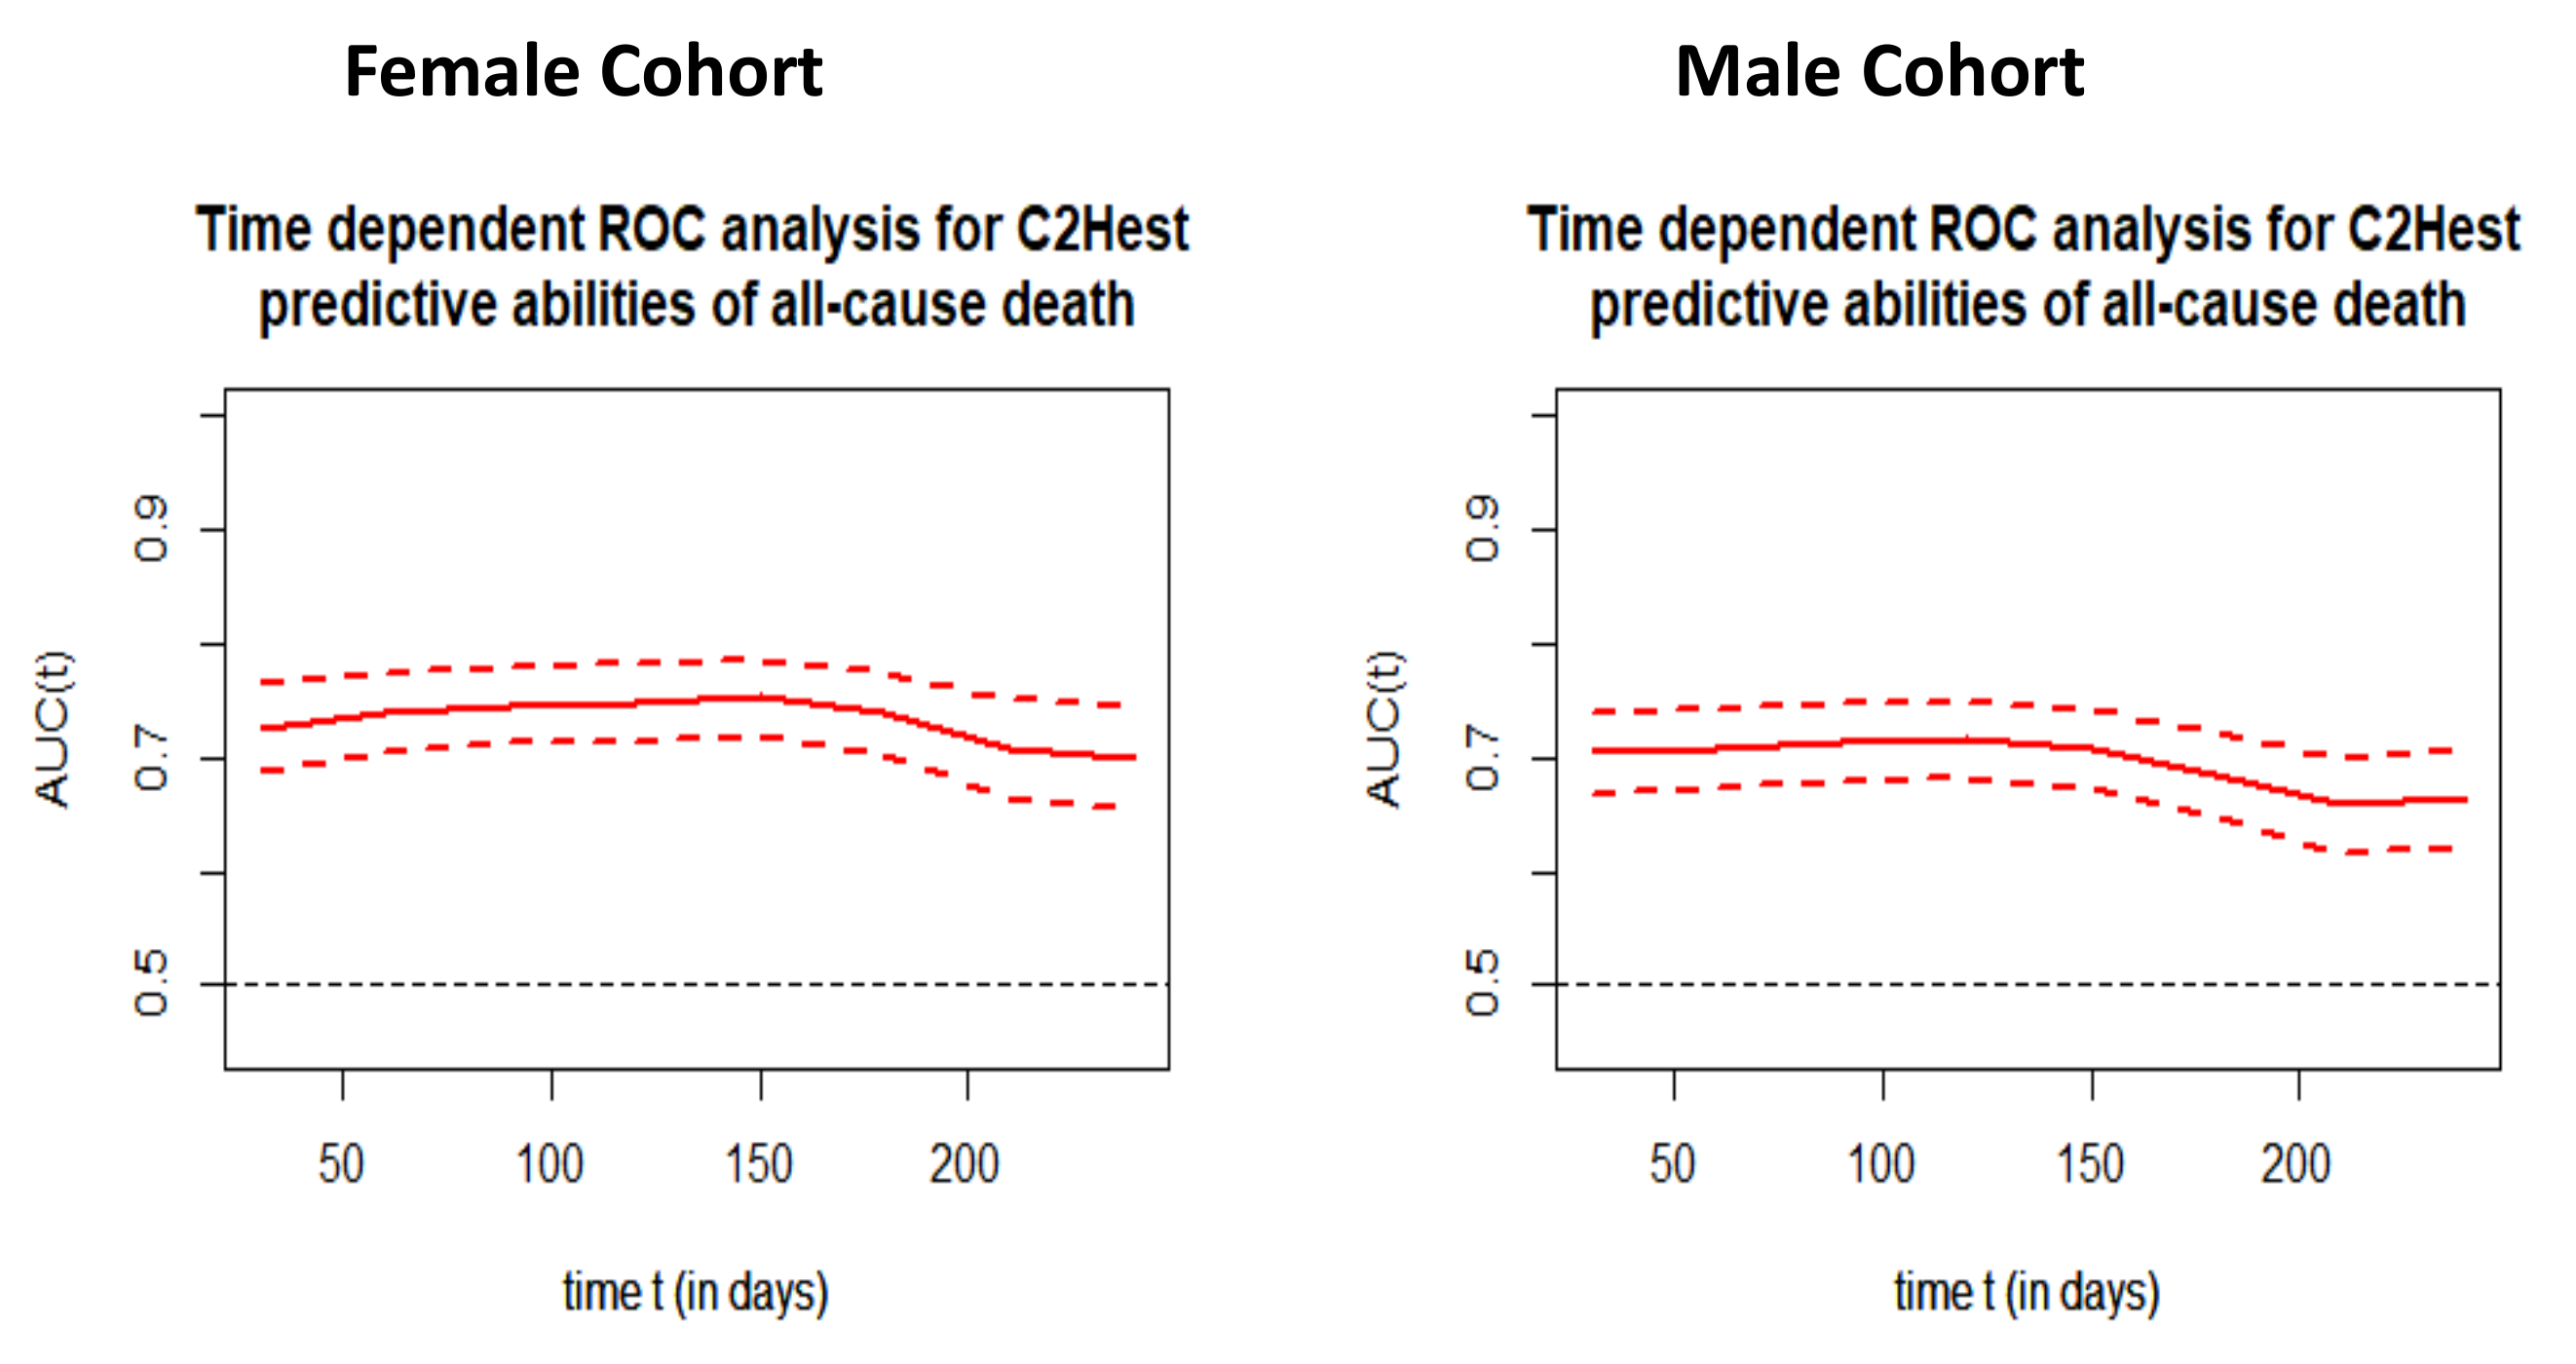
3.4. The All-Cause Mortality Discriminatory Performance of the C2HEST Score
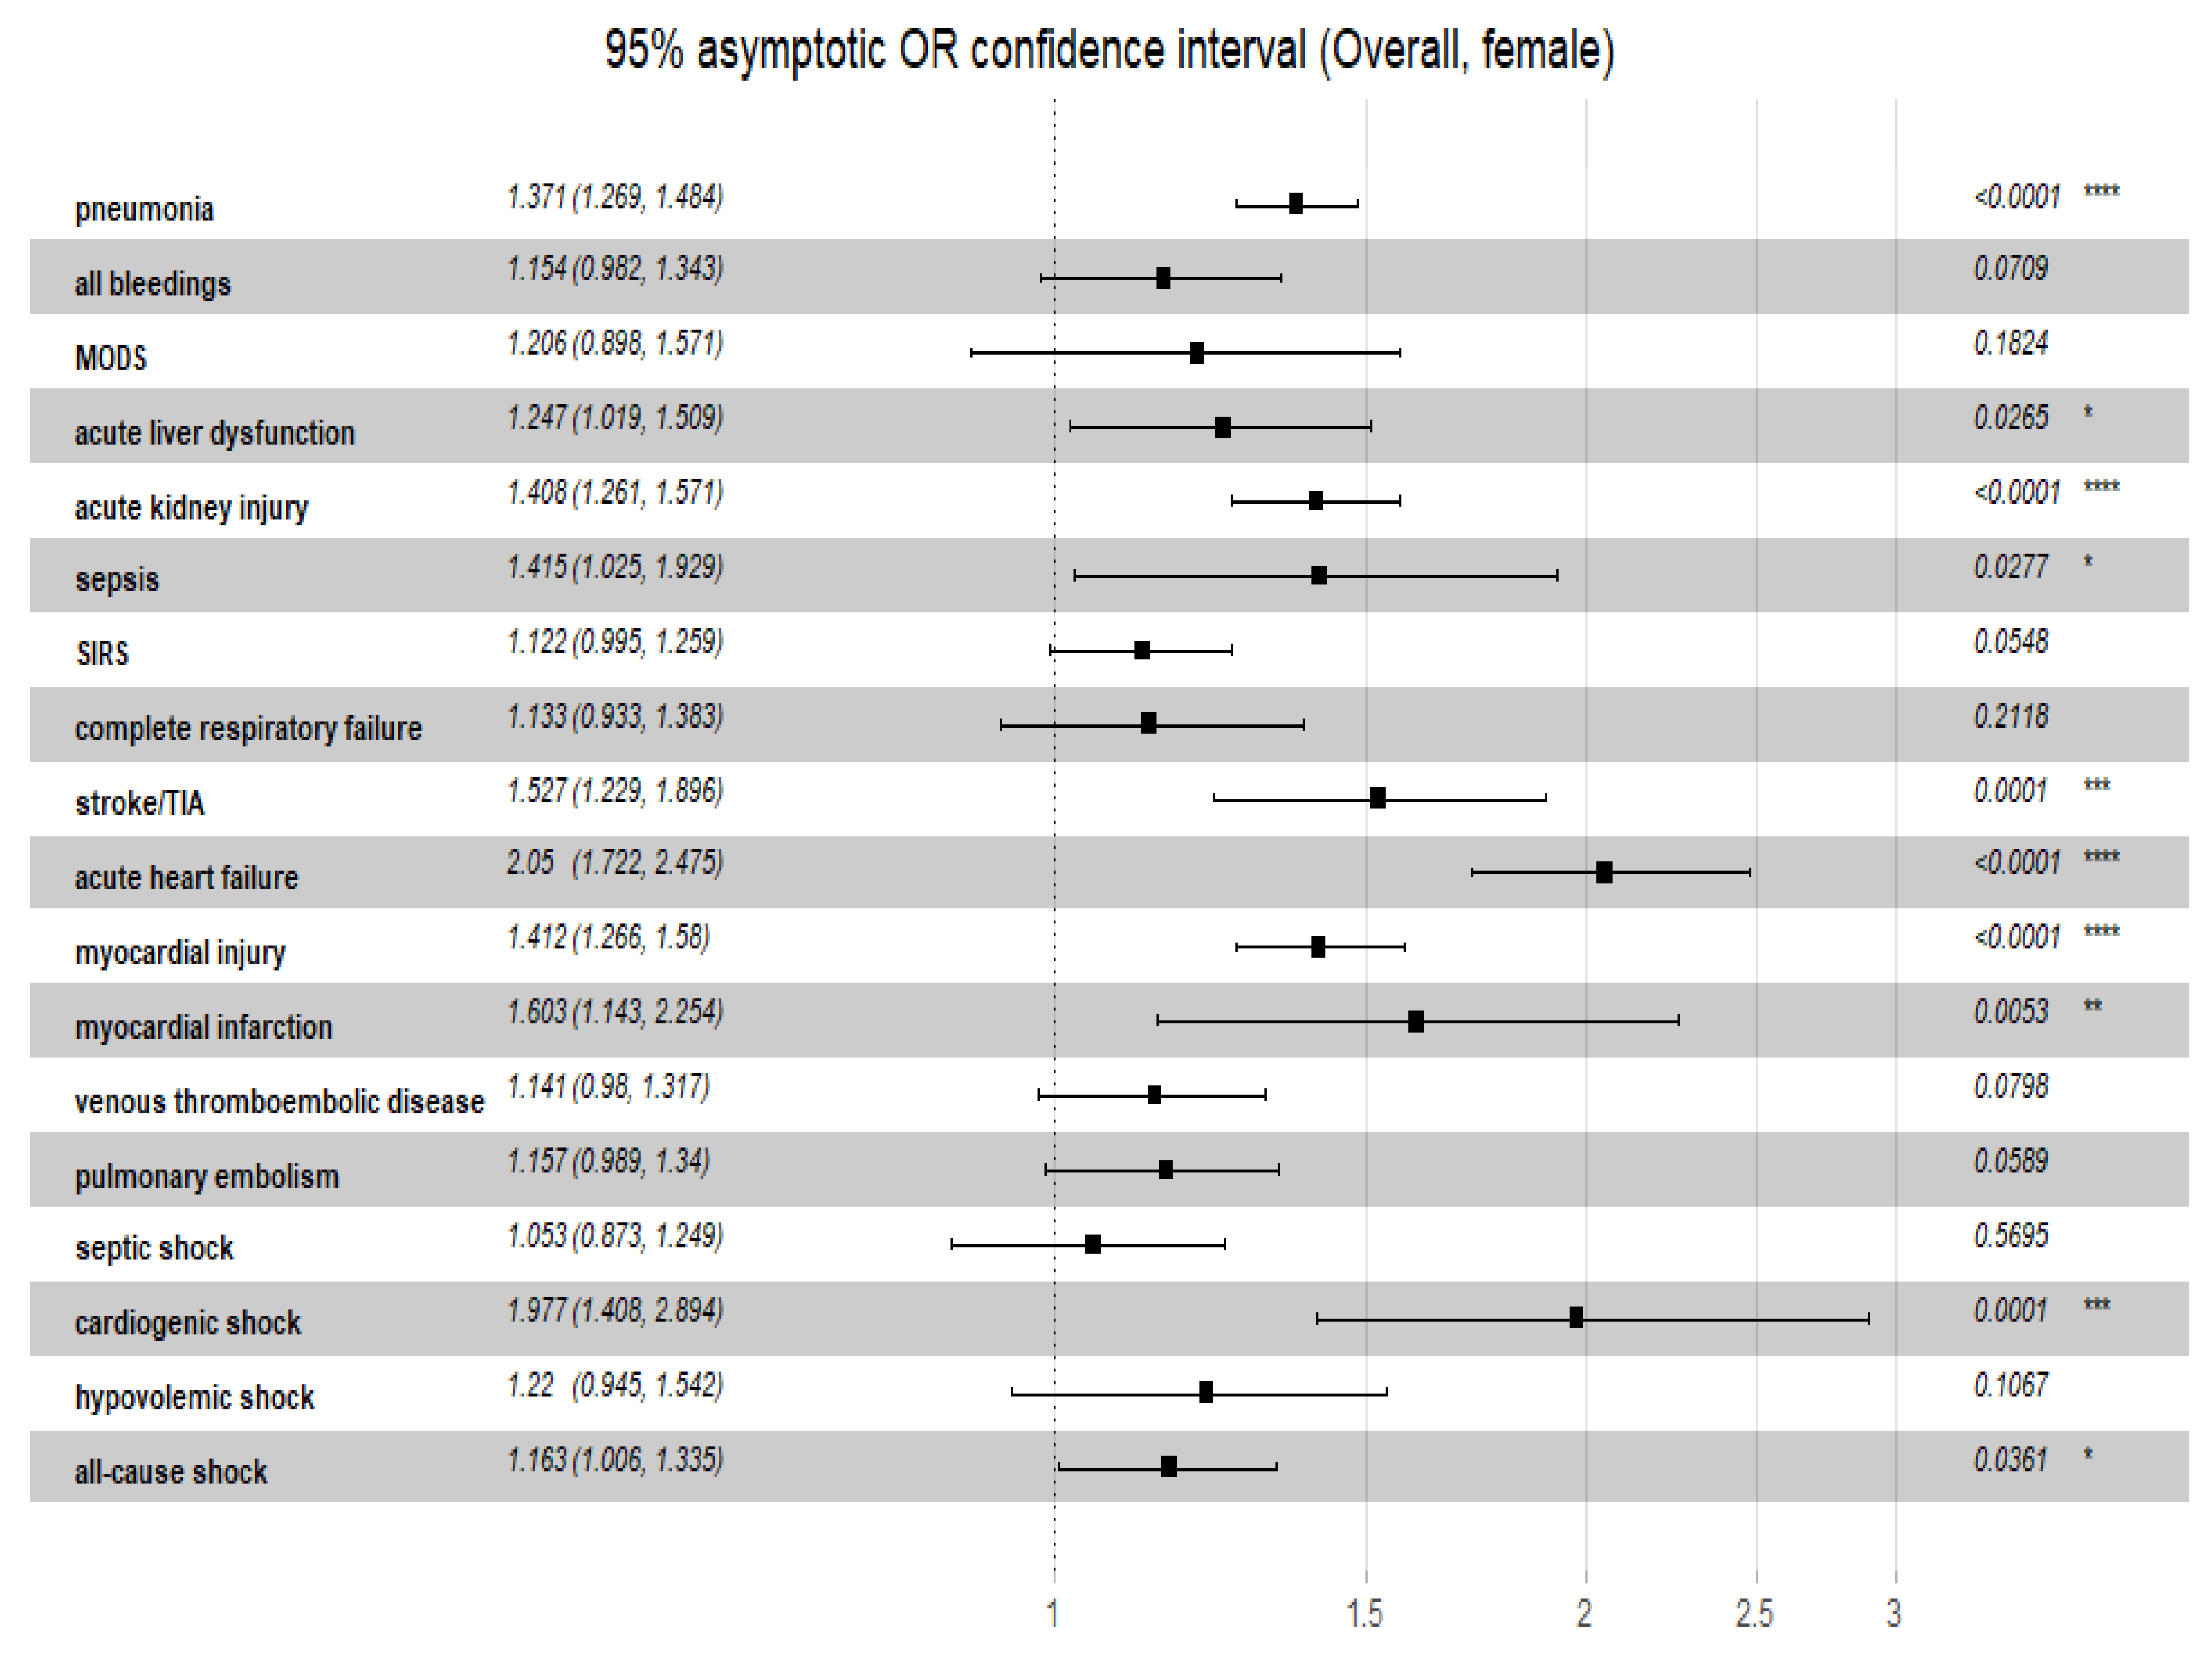
3.5. Relationship of C2HEST Score with Non-Fatal Outcomes
4. Discussion
Limitations
5. Conclusions
Author Contributions
Funding
Institutional Review Board Statement
Informed Consent Statement
Data Availability Statement
Acknowledgments
Conflicts of Interest
References
- WHO Coronavirus (COVID-19) Dashboard. Available online: https://covid19.who.int/ (accessed on 12 March 2022).
- Scully, E.P.; Haverfield, J.; Ursin, R.L.; Tannenbaum, C.; Klein, S.L. Considering how biological sex impacts immune responses and COVID-19 outcomes. Nat. Rev. Immunol. 2020, 20, 442–447. Available online: https://www.nature.com/articles/s41577-020-0348-8 (accessed on 1 December 2021). [CrossRef] [PubMed]
- Mendiola-Pastrana, I.R.; López-Ortiz, E.; Río de la Loza-Zamora, J.G.; González, J.; Gómez-García, A.; López-Ortiz, G. SARS-CoV-2 Variants and Clinical Outcomes: A Systematic Review. Life 2022, 12, 170. [Google Scholar] [CrossRef] [PubMed]
- Tsukagoshi, H.; Shinoda, D.; Saito, M.; Okayama, K.; Sada, M.; Kimura, H.; Saruki, N. Relationships between Viral Load and the Clinical Course of COVID-19. Viruses 2021, 13, 304. [Google Scholar] [CrossRef] [PubMed]
- Rahban, M.; Stanek, A.; Hooshmand, A.; Khamineh, Y.; Ahi, S.; Kazim, S.N.; Ahmad, F.; Muronetz, V.; Samy Abousenna, M.; Zolghadri, S.; et al. Infection of Human Cells by SARS-CoV-2 and Molecular Overview of Gastrointestinal, Neurological, and Hepatic Problems in COVID-19 Patients. J. Clin. Med. 2021, 10, 4802. [Google Scholar] [CrossRef]
- Li, Y.G.; Pastori, D.; Farcomeni, A.; Yang, P.S.; Jang, E.; Joung, B.; Wang, Y.T.; Guo, Y.T.; Lip, G. A simple clinical risk score (C2HEST) for predicting incident atrial fibrillation in Asian subjects: Derivation in 471,446 Chinese subjects, with internal validation and external application in 451,199 Korean subjects. Chest 2019, 155, 510–518. [Google Scholar] [CrossRef]
- Robin, X.; Turck, N.; Hainard, A.; Tiberti, N.; Lisacek, F.; Sanchez, J.-C.; Müller, M. pROC: An open-source package for R and S+ to analyze and compare ROC curves. BMC Bioinform. 2011, 12, 77. [Google Scholar] [CrossRef]
- Therneau, T. A Package for Survival Analysis in R. R Package Version 3.2-7. Available online: https://CRAN.R-project.org/package=survival (accessed on 1 November 2021).
- Hothorn, T.; Hornik, K.; Van De Wiel, M.A.; Zeileis, A. A lego system for conditional inference. Am. Stat. 2006, 60, 257–263. [Google Scholar] [CrossRef]
- Schratz, P. R Package ‘Oddsratio’: Odds Ratio Calculation for GAM(M)s & GLM(M)s, Version: 1.0.2. Available online: https://doi.org/10.5281/zenodo.1095472 (accessed on 1 November 2021). [CrossRef]
- Mukherjee, S.; Pahan, K. Is COVID-19 Gender-sensitive? J. Neuroimmune Pharmacol. 2021, 16, 38–47. [Google Scholar] [CrossRef]
- Peckham, H.; de Gruijter, N.M.; Raine, C.; Radziszewska, A.; Ciurtin, C.; Wedderburn, L.R.; Rosser, E.C.; Webb, K.; Deakin, C.T. Male sex identified by global COVID-19 meta-analysis as a risk factor for death and ITU admission. Nat. Commun. 2020, 11, 6317. [Google Scholar] [CrossRef]
- Aleksova, A.; Gagno, G.; Sinagra, G.; Beltrami, A.P.; Janjusevic, M.; Ippolito, G.; Zumla, A.; Fluca, A.L.; Ferro, F. Effects of SARS-CoV-2 on Cardiovascular System: The Dual Role of Angiotensin-Converting Enzyme 2 (ACE2) as the Virus Receptor and Homeostasis Regulator-Review. Int. J. Mol. Sci. 2021, 22, 4526. [Google Scholar] [CrossRef]
- Channappanavar, R.; Fett, C.; Mack, M.; Ten Eyck, P.P.; Meyerholz, D.K.; Perlman, S. Sex-Based Differences in Susceptibility to Severe Acute Respiratory Syndrome Coronavirus Infection. J. Immunol. 2017, 198, 4046–4053. [Google Scholar] [CrossRef] [PubMed]
- Maleki Dana, P.; Sadoughi, F.; Hallajzadeh, J.; Asemi, Z.; Mansournia, M.A.; Yousefi, B.; Momen-Heravi, M. An Insight into the Sex Differences in COVID-19 Patients: What are the Possible Causes? Prehosp. Disaster Med. 2020, 35, 438–441. [Google Scholar] [CrossRef] [PubMed]
- Gemmati, D.; Bramanti, B.; Serino, M.L.; Secchiero, P.; Zauli, G.; Tisato, V. COVID-19 and Individual Genetic Susceptibility/Receptivity: Role of ACE1/ACE2 Genes, Immunity, Inflammation and Coagulation. Might the Double X-chromosome in Females Be Protective against SARS-CoV-2 Compared to the Single X-Chromosome in Males? Int. J. Mol. Sci. 2020, 21, 3474. [Google Scholar] [CrossRef]
- Haitao, T.; Vermunt, J.; Abeykoon, J.; Ghamrawi, R.; Gunaratne, M.; Jayachandran, M.; Narang, K.; Parashuram, S.; Suvakov, S.; Garovic, V. COVID-19 and sex differences: Mechanisms and biomarkers. Mayo Clin. Proc. 2020, 95, 2189–2203. [Google Scholar] [CrossRef] [PubMed]
- Doroszko, A.; Andrzejak, R.; Szuba, A. Role of the nitric oxide metabolic pathway and prostanoids in the pathogenesis of endothelial dysfunction and essential hypertension in young men. Hypertens. Res. 2011, 34, 79–86. [Google Scholar] [CrossRef] [PubMed][Green Version]
- Ackermann, M.; Verleden, S.E.; Kuehnel, M.; Haverich, A.; Welte, T.; Laenger, F.; Vanstapel, A.; Werlein, C.; Stark, H.; Tzankov, A.; et al. Pulmonary Vascular Endothelialitis, Thrombosis, and Angiogenesis in COVID-19. NEJM 2020, 383, 120–128. [Google Scholar] [CrossRef] [PubMed]
- Clerkin, K.J.; Fried, J.A.; Raikhelkar, J.; Sayer, G.; Griffin, J.M.; Masoumi, A.; Jain, S.S.; Burkhoff, D.; Kumaraiah, D.; Rabbani, L.; et al. COVID-19 and cardiovascular disease. Circulation 2020, 141, 1648–1655. [Google Scholar] [CrossRef]
- Sheth, A.R.; Grewal, U.S.; Patel, H.P.; Thakkar, S.; Garikipati, S.; Gaddam, J.; Bawa, D. Possible mechanisms responsible for acute coronary events in COVID-19. Med. Hypotheses 2020, 143, 110125. [Google Scholar] [CrossRef]
- Lei, F.; Liu, Y.M.; Zhou, F.; Qin, J.J.; Zhang, P.; Zhu, L.; Zhang, X.J.; Cai, J.; Lin, L.; Ouyang, S.; et al. Longitudinal Association Between Markers of Liver Injury and Mortality in COVID-19 in China. Hepatology 2020, 72, 389–398. [Google Scholar] [CrossRef]
- Phipps, M.M.; Barraza, L.H.; LaSota, E.D.; Sobieszczyk, M.E.; Pereira, M.R.; Zheng, E.X.; Fox, A.N.; Zucker, J.; Verna, E.C. Acute Liver Injury in COVID-19: Prevalence and Association with Clinical Outcomes in a Large U. S. Cohort. Hepatol. 2020, 72, 807–817. [Google Scholar] [CrossRef]
- Ahlawat, S.; Sharma, K.K. Immunological co-ordination between gut and lungs in SARS-CoV-2 infection. Virus Res. 2020, 286, 198103. [Google Scholar] [CrossRef] [PubMed]
- Moon, A.M.; Singal, A.G.; Tapper, E.B. Contemporary Epidemiology of Chronic Liver Disease and Cirrhosis. Clin. Gastroenterol. Hepatol. 2020, 18, 2650–2666. [Google Scholar] [CrossRef] [PubMed]
- Doroszko, A.; Szahidewicz-Krupska, E.; Janus, A.; Jakubowski, M.; Turek, A.; Ilnicka, P.; Szuba, A.; Mazur, G.; Derkacz, A. Endothelial dysfunction in young healthy men is associated with aspirin resistance. Vasc. Pharmacol. 2015, 67–69, 30–37. [Google Scholar] [CrossRef] [PubMed]
- Stanek, A.; Fazeli, B.; Bartuś, S.; Sutkowska, E. The Role of Endothelium in Physiological and Pathological States: New Data. Biomed Res. Int. 2018, 2018, 1098039 doi101155/2018/1098039. [Google Scholar] [CrossRef]
- Jin, X.; Duan, Y.; Bao, T.; Gu, J.; Chen, Y.; Li, Y.; Mao, S.; Chen, Y.; Xie, W. The values of coagulation function in COVID-19 patients. PLoS ONE 2020, 15, e0241329. [Google Scholar] [CrossRef]
- Mondal, S.; Quintili, A.L.; Karamchandani, K.; Bose, S. Thromboembolic disease in COVID-19 patients: A brief narrative review. J. Intensive Care 2020, 8, 70. [Google Scholar] [CrossRef]
- Maiese, A.; Manetti, A.C.; La Russa, R.; Di Paolo, M.; Turillazzi, E.; Frati, P.; Fineschi, V. Autopsy findings in COVID-19-related deaths: A literature review. Forensic Sci. Med. Pathol. 2021, 17, 279–296. [Google Scholar] [CrossRef]
- Protasiewicz, M.; Reszka, K.; Kosowski, W.; Adamik, B.; Bombala, W.; Doroszko, A.; Gajecki, D.; Gawryś, J.; Guziński, M.; Jedrzejczyk, M.; et al. Anticoagulation Prior to COVID-19 Infection Has No Impact on 6 Months Mortality: A Propensity Score–Matched Cohort Study. J. Clin. Med. 2022, 11, 352. [Google Scholar] [CrossRef]
- Dorgalaleh, A. Bleeding and Bleeding Risk in COVID-19. Semin. Thromb Hemost. 2020, 46, 815–818 doi101055/s. [Google Scholar] [CrossRef]
- Jayakrishnan, T.; Haag, A.; Mealy, S.; Minich, C.; Attah, A.; Turk, M.; Alrifai, N.; Alhuneafat, L.; Khoury, F.; Nasrullah, A.; et al. Novel Coronavirus Infection (COVID-19) Related Thrombotic and Bleeding Complications in Critically Ill Patients: Experience from an Academic Medical Center. J. Clin. Med. 2021, 10, 5652. [Google Scholar] [CrossRef]
- Demelo-Rodriguez, P.; Galeano-Valle, F.; Ordieres-Ortega, L.; Siniscalchi, C.; Martín Del Pozo, M.; Fidalgo, Á.; Gil-Díaz, A.; Lobo, J.L.; De Ancos, C.; Monreal, M. For the RIETE-Bleeding Investigators. Validation of a Prognostic Score to Identify Hospitalized Patients with COVID-19 at Increased Risk for Bleeding. Viruses 2021, 13, 2278. [Google Scholar] [CrossRef] [PubMed]


| Variables Units | Low Risk [0–1] | Medium [2–3] | High Risk [≥4] | OMNIBUS p-Value | p Value for Post-Hoc Analysis | |||||
|---|---|---|---|---|---|---|---|---|---|---|
| Females N = 682 | Males N = 735 | Females N = 284 | Males N = 208 | Females N = 135 | Males N = 139 | Females | Males | Females | Males | |
| Demographics | ||||||||||
| Age, years mean ± SD/min-max | 47.8 ± 17.1 17–74 | 54.2 ± 14.0 17–74 | 76.7 ± 12.0 29–100 | 74.0 ± 1.2 37–99 | 81.0 ± 8.7 47–100 | 76.2 ± 9.4 38–92 | <0.0001 | <0.0001 | 0.0 a,b 0.0001 c | 0.0 a <0.0001 b 0.115 c |
| Age ≥ 65 years n/n(%) | 165 (24.2) | 211 (28.7) | 247 (87.0) | 172 (82.7) | 129 (95.6) | 123 (88.5) | <0.0001 | <0.0001 | <0.0001 a,b 0.0339 c | <0.0001 a,b 0.5515 c |
| BMI, kg/m2 mean ± SD/min-max/N | 28.3 ±5.3 17.1–45.7 199 | 28.2 ± 4.8 15.4–49.4 198 | 30.1 ±5.9 18.6–47.8 48 | 28.3 ±5.2 20.9–46.7 42 | 27.1 ±6.7 16.4–45.8 17 | 28.0 ± 5.6 17.3–48.2 50 | 0.1255 | 0.9609 | N/A | N/A |
| Co-morbidities | ||||||||||
| Hypertension n/n(%) | 179 (26.2) | 236 (32.1) | 213 (75.0) | 144 (69.2) | 126 (93.3) | 123 (88.5) | <0.0001 | <0.0001 | <0.0001 a,b,c | <0.0001 a,b 0.0002 c |
| Dyslipidaemia n/n(%)/N | 74 (59.2) 125 | 138 (57.3) 241 | 37 (44.6) 83 | 32 (39.0) 82 | 29 (48.3) 60 | 17 (29.8) 57 | 0.0932 | 0.00011 | N/A | 0.0191 a 0.001 b 1.0 c |
| Atrial fibrilation/flutter n/n(%) | 14 (2.1) | 35 (4.8) | 60 (21.1) | 46 (22.1) | 65 (48.1) | 70 (50.4) | <0.0001 | <0.0001 | <0.0001 a,b,c | <0.0001 a,b,c |
| Previous coronary revascularisation n/n(%) | 0 (0.0) | 6 (0.8) | 9 (3.2) | 28 (13.5) | 35 (25.9) | 76 (54.7) | <0.0001 | <0.0001 | <0.0001 a,b,c | <0.0001 a,b,c |
| Previous myocardial infarction n/n(%) | 1 (0.1) | 10 (1.4) | 18 (6.3) | 45 (21.6) | 37 (27.4) | 80 (57.6) | <0.0001 | <0.0001 | <0.0001 a,b,c | <0.0001 a,b,c |
| Heart failure n/n(%) | 0 (0.0) | 0 (0.0) | 20 (7.0) | 33 (15.9) | 91 (67.4) | 111 (79.9) | <0.0001 | <0.0001 | <0.0001 a,b,c | <0.0001 a,b,c |
| Moderate/severe valvular heart disease or previous valve heart surgery n/n(%) | 7 (1.0) | 6 (0.8) | 14 (4.9) | 18 (8.7) | 26 (19.3) | 25 (18.0) | <0.0001 | <0.0001 | 0.0012 a <0.0001 b,c | <0.0001 a,b 0.0467 c |
| Peripheral artery disease n/n(%) | 7 (1.0) | 19 (2.6) | 14 (4.9) | 17 (8.2) | 11 (8.1) | 32 (23.0) | <0.0001 | <0.0001 | 0.0012 a <0.0001 b 0.5813 c | 0.0014 a <0.0001 b 0.0006 c |
| Previous stroke/TIA n/n(%) | 17 (2.5) | 30 (4.1) | 33 (11.6) | 26 (12.5) | 24 (17.8) | 34 (24.5) | <0.0001 | <0.0001 | <0.0001 a,b 0.3522 c | <0.0001 a,b 0.0183 c |
| Chronic kidney disease n/n(%) | 33 (4.8) | 37 (5.0) | 26 (9.2) | 44 (21.2) | 39 (28.9) | 52 (37.4) | <0.0001 | <0.0001 | 0.0486 a <0.0001 b,c | <0.0001 a,b 0.0042 c |
| Haemodialysis n/n(%) | 11 (1.6) | 8 (1.1) | 5 (1.8) | 15 (7.2) | 8 (5.9) | 11 (7.9) | 0.01467 | <0.0001 | 1.0 a 0.0204 b 0.0963 c | <0.0001 a,b 1.0 c |
| Asthma n/n(%) | 32 (4.7) | 22 (3.0) | 17 (6.0) | 3 (1.4) | 7 (5.2) | 4 (2.9) | 0.7053 | 0.4996 | N/A | N/A |
| COPD n/n(%) | 1 (0.1) | 5 (0.7) | 9 (3.2) | 16 (7.7) | 16 (11.9) | 28 (20.1) | <0.0001 | <0.0001 | 0.0003 a <0.0001 b 0.0041 c | <0.0001 a,b 0.0035 c |
| Hypothyroidism n/n(%) | 65 (9.5) | 11 (1.5) | 56 (19.7) | 12 (5.8) | 52 (38.5) | 12 (8.6) | <0.0001 | <0.0001 | <0.0001 a,b 0.0002 c | 0.004 a <0.0001 b 1.0 c |
| Hyperthyroidism n/n(%) | 3 (0.4) | 1 (0.1) | 7 (2.5) | 3 (1.4) | 3 (2.2) | 4 (2.9) | 0.0083 | 0.0009 | 0.0272 a 0.1807 b 1.0 c | 0.1065 a 0.0081 b 1.0 c |
| Variables Units | Low Risk [0–1] | Medium [2–3] | High Risk [≥4] | OMNIBUS p-Value | p Value for Post-Hoc Analysis | |||||
|---|---|---|---|---|---|---|---|---|---|---|
| Females N = 682 | Males N = 735 | Females N = 284 | Males N = 208 | Females N = 135 | Males N = 139 | Females | Males | Females | Males | |
| Treatment applied before hospitalization | ||||||||||
| ACEI n/n(%) | 47 (6.9) | 69 (9.4) | 57 (20.1) | 63 (30.3) | 54 (40.0) | 62 (44.6) | <0.0001 | <0.0001 | <0.0001 a,b,c | <0.0001 a,b 0.0273 c |
| ARB n/n(%) | 33 (4.8) | 43 (5.9) | 26 (9.2) | 12 (5.8) | 14 (10.4) | 16 (11.5) | 0.0087 | 0.0413 | 0.04855 a 0.0611 b 1.0 c | 1.0 a 0.0724 b 0.2546 c |
| MRA n/n(%) | 3 (0.4) | 15 (2.0) | 13 (4.6) | 20 (9.6) | 20 (14.8) | 29 (20.9) | <0.0001 | <0.0001 | <0.0001 a,b 0.0021 c | <0.0001 a,b 0.0158 c |
| β-blocker n/n(%) | 78 (11.4) | 119 (16.2) | 102 (35.9) | 77 (37.0) | 76 (56.3) | 81 (58.3) | <0.0001 | <0.0001 | <0.0001 a,b 0.0004 c | <0.0001 a,b 0.0005 c |
| Calcium channel blocker dihydropiridines n/n(%) | 37 (5.4) | 66 (9.0) | 48 (16.9) | 36 (17.3) | 34 (25.2) | 40 (28.8) | <0.0001 | <0.0001 | <0.0001 a,b 0.1863 c | 0.003 a <0.0001 b 0.0493 c |
| α-adrenergic blocker n/n(%) | 10 (1.5) | 35 (4.8) | 6 (2.1) | 28 (13.5) | 8 (5.9) | 31 (22.3) | 0.0113 | <0.0001 | 1.0 a 0.0137 b 0.2272 c | <0.0001 a,b 0.1358 c |
| Amiodarone n/n(%) | 1 (0.1) | 0 (0.0) | 1 (0.4) | 1 (0.5) | 0 (0.0) | 1 (0.7) | 0.6165 | 0.1027 | N/A | N/A |
| Thiazide or thiazide-like diuretic n/n(%) | 29 (4.3) | 39 (5.3) | 36 (12.7) | 11 (5.3) | 16 (11.9) | 19 (13.7) | <0.0001 | 0.0008 | <0.0001 a 0.0026 b 1 c |
1.0 a 0.0017 b 0.0345 c |
| Loop diuretic n/n(%) | 13 (1.9) | 26 (3.5) | 25 (8.8) | 40 (19.2) | 33 (24.4) | 48 (34.5) | <0.0001 | <0.0001 | <0.0001 a,b,c | <0.0001 a,b0.0061c |
| Statin n/n(%) | 40 (5.9) | 63 (8.6) | 56 (19.7) | 65 (31.3) | 49 (36.3) | 77 (55.4) | <0.0001 | <0.0001 | <0.0001 a,b 0.0012 c | <0.0001 a, b, c |
| Acetylsalicylic acid n/n(%) | 35 (5.1) | 46 (6.3) | 44 (15.5) | 51 (24.5) | 33 (24.4) | 49 (35.3) | <0.0001 | <0.0001 | <0.0001 a,b 0.1137 c | <0.0001 a,b 0.1234 c |
| The second antiplatelet drug n/n(%) | 1 (0.1) | 6 (0.8) | 5 (1.8) | 5 (2.4) | 4 (3.0) | 18 (12.9) | 0.0009 | <0.0001 | 0.0292 a 0.0094 b 1.0 c | 0.2154 a <0.0001 b 0.0007 c |
| LMWH n/n(%) | 32 (4.7) | 42 (5.7) | 23 (8.1) | 18 (8.7) | 11 (8.1) | 15 (10.8) | 0.0674 | 0.0535 | N/A | N/A |
| VKA n/n(%) | 4 (0.6) | 6 (0.8) | 6 (2.1) | 8 (3.8) | 10 (7.4) | 13 (9.4) | <0.0001 | <0.0001 | 0.2172 a <0.0001 b 0.038 c | 0.0129 a <0.0001 b 0.1213 c |
| NOAC n/n(%) | 6 (0.9) | 12 (1.6) | 22 (7.7) | 15 (7.2) | 23 (17.0) | 29 (20.9) | <0.0001 | <0.0001 | <0.0001 a,b 0.0207 c | 0.0002 a <0.0001 b 0.001 c |
| Insulin n/n(%) | 23 (3.4) | 39 (5.3) | 14 (4.9) | 15 (7.2) | 22 (16.3) | 18 (12.9) | <0.0001 | 0.0038 | 1.0 a <0.0001 b 0.0007 c | 1.0 a 0.0047 b 0.3296 c |
| Metformin n/n(%) | 40 (5.9) | 64 (8.7) | 35 (12.3) | 32 (15.4) | 22 (16.3) | 29 (20.9) | <0.0001 | <0.0001 | 0.0031 a 0.0002 b 1.0 c | 0.022 a 0.0001 b 0.7261 c |
| SGLT2 inhibitor n/n(%) | 4 (0.6) | 7 (1.0) | 4 (1.4) | 3 (1.4) | 3 (2.2) | 6 (4.3) | 0.12658 | 0.018 | N/A | 1.0 a 0.0286 b 0.4938 c |
| Oral antidiabetics other than SGLT2 inhibitor and metformin n/n(%) | 10 (1.5) | 17 (2.3) | 20 (7.0) | 14 (6.7) | 11 (8.1) | 17 (12.2) | <0.0001 | <0.0001 | <0.0001 a,b 1.0 c | 0.01 a <0.0001 b 0.3507 c |
| Proton pump inhibitor n/n(%) | 31 (4.5) | 58 (7.9) | 39 (13.7) | 36 (17.3) | 37 (27.4) | 49 (35.3) | <0.0001 | <0.0001 | <0.0001 a,b 0.0034 c | 0.0003 a <0.0001 b 0.0007 c |
| Oral corticosteroid n/n(%) | 31 (4.5) | 31 (4.2) | 17 (6.0) | 7 (3.4) | 5 (3.7) | 1 (0.7) | 0.5164 | 0.125 | N/A | N/A |
| Immuno-suppression other than oral corticosteroid n/n(%) | 24 (3.5) | 25 (3.4) | 12 (4.2) | 10 (4.8) | 2 (1.5) | 0 (0.0) | 0.3606 | 0.0185 | N/A | 1.0 a 0.0686 b 0.0209 c |
| VariablesUnits | Low Risk [0–1] | Medium [2–3] | High Risk [≥4] | OMNIBUS p Value | p Value for Post-Hoc Analysis | |||||
|---|---|---|---|---|---|---|---|---|---|---|
| Females N = 682 | Males N = 735 | Females N = 284 | Males N = 208 | Females N = 135 | Males N = 139 | Females | Males | Females | Males | |
| Patient-reported symptoms | ||||||||||
| Cough n/n(%) | 219 (32.1) | 236 (32.1) | 71 (25.0) | 53 (25.5) | 27 (20.0) | 42 (30.2) | 0.0047 | 0.1859 | 0.102 a 0.0208 b 0.9427 c | n/A |
| Dyspnoea n/n(%) | 244 (35.8) | 325 (44.2) | 110 (38.7) | 96 (46.2) | 63 (46.7) | 83 (59.7) | 0.0551 | 0.0035 | N/A | 1.0 a 0.0033 b 0.0538 c |
| Chest pain n/n(%) | 49 (7.2) | 53 (7.2) | 18 (6.3) | 16 (7.7) | 11 (8.1) | 16 (11.5) | 0.7855 | 0.2237 | N/A | N/A |
| Smell dysfunction n/n(%) | 26 (3.8) | 35 (4.8) | 3 (1.1) | 7 (3.4) | 0 (0.0) | 5 (3.6) | 0.0039 | 0.6142 | 0.0656 a 0.0414 b 1.0 c | N/A |
| Diarrhoea n/n(%) | 37 (5.4) | 38 (5.2) | 22 (7.7) | 11 (5.3) | 11 (8.1) | 8 (5.8) | 0.2667 | 0.9606 | N/A | N/A |
| Nausea/Vomiting n/n(%) | 36 (5.3) | 21 (2.9) | 18 (6.3) | 9 (4.3) | 11 (8.1) | 3 (2.2) | 0.4065 | 0.4662 | N/A | N/A |
| Measured vital signs | ||||||||||
| Body temperature, °C mean ± SD/min-max/N | 37.1 ± 0.8 35.0–40.5 416 | 37.1 ± 0.9 34.4–40.0 393 | 36.9 ± 0.9 35.8–40.0 131 | 36.9 ± 1.0 35.0–40.0 104 | 36.8 ± 0.9 35.2–40.0 63 | 37.1 ± 0.8 35.5–40.0 78 | 0.0456 | 0.3888 | 0.3 a 0.07 b 0.588 c | N/A |
| Heart rate, beats/minute mean ± SD/min-max/N | 85.9 ± 14.6 48–150 490 | 86.9 ± 16.5 48–160 555 | 84.6 ± 17.2 50–160 217 | 83.5 ± 15.5 52–140 170 | 87.4 ± 21.3 36–170 116 | 82.3 ± 15.8 58–140 124 | 0.4159 | 0.0035 | N/A | 0.045 a 0.012 b 0.773 c |
| Respiratory rate breaths/minute mean ± SD/min-max/N | 17.9 ± 5.9 12–50 107 | 18.9 ± 5.7 12–50 97 | 17.8 ± 3.8 12–31 34 | 19.6 ± 6.7 12–45 34 | 19.0 ± 4.1 12–29 22 | 19.6 ± 7.6 12–50 24 | 0.5185 | 0.8014 | N/A | N/A |
| Systolic blood pressure mmHg mean ± SD/min-max/N | 128.6 ± 21.3 74–240 488 | 132.6 ± 21.1 60–220 552 | 133.2 ± 24.2 50–210 216 | 135.6 ± 26.7 50–270 169 | 135.6 ± 25.5 70–210 117 | 133.5 ± 24.0 85–200 127 | 0.004 | 0.4149 | 0.042 a 0.018 b 0.687 c | N/A |
| Diastolic blood pressure, mmHg mean ± SD/min-max/N | 77.4 ± 12.5 40–150 487 | 79.5 ± 12.7 40–130 550 | 77.1 ± 13.7 40–157 214 | 79.3 ± 13.5 45–150 166 | 7.5 ± 15.5 40–143 117 | 75.1 ± 15.2 40–120 127 | 0.8167 | 0.0091 | N/A | 0.986 a 0.007 b 0.034 c |
| SpO2 on room air, % (FiO2 = 21%) mean ± SD/min-max/N | 94.4 ± 5.9 56–100 421 | 91.1 ± 7.9 48–99 393 | 90.8 ± 8.5 50–100 160 | 88.2 ± 10.9 50–99 121 | 91.2 ± 6.9 64–99 84 | 89.2 ± 9.9 50–99 83 | <0.0001 | 0.0102 | <0.0001 a 0.0003 b 0.934 c | 0.018 a 0.205 b 0.79 c |
| Abnormalities detected during physical examination | ||||||||||
| Cracles n/n(%) | 62 (9.1) | 92 (12.5) | 47 (16.5) | 52 (25.0) | 30 (22.2) | 36 (25.9) | <0.0001 | <0.0001 | 0.0038 a <0.0001 b 0.6164 c | <0.0001 a 0.0002 b 1.0 c |
| Wheezing n/n(%) | 32 (4.7) | 62 (8.4) | 23 (8.1) | 33 (15.9) | 32 (23.7) | 37 (26.6) | <0.0001 | <0.0001 | 0.1611 a <0.0001 b,c | 0.0078 a <0.0001 b 0.0628 c |
| Pulmonarycongestion n/n(%) | 70 (10.3) | 114 (15.5) | 51 (18.0) | 54 (26.0) | 37 (27.4) | 41 (29.5) | <0.0001 | <0.0001 | 0.0044 a <0.0001 b 0.1096 c | 0.0022 a 0.0004 b 1.0 c |
| Parameter Time of Assessment | Units | Low Risk [0–1] | Medium [2–3] | High Risk [≥4] | p-Value OMNIBUS | p-Value for Post-Hoc Analysis | |||||
|---|---|---|---|---|---|---|---|---|---|---|---|
| Females | Males | Females | Males | Females | Males | Females | Males | Females | Males | ||
| Morphology | |||||||||||
| Leucocytes n/n(%)/N On admission | >12 × 103/µL | 85 (13.8) 615 | 116 (16.9) 686 | 52 (18.8) 277 | 32 (15.8) 203 | 23 (17.7) 130 | 29 (212) 137 | 0.3085 | 0.3279 | N/A | N/A |
| 4–12× 103/µL | 467 (75.9) 615 | 504 (73.5) 686 | 198 (71.5) 277 | 147 (72.4) 203 | 91 (70.0) 130 | 100 (73.0) 137 | |||||
| <4 × 10³/µL | 63 (10.2) 615 | 66 (9.6) 686 | 27 (9.7) 277 | 24 (11.8) 203 | 16 (12.3) 130 | 8 (5.8) 137 | |||||
| On discharge | >12 × 103/µL | 81 (13.2) 615 | 119 (17.3) 686 | 55 (19.9) 277 | 48 (23.6) 203 | 36 (27.7) 130 | 28 (20.4) 137 | 0.0008 | 0.0028 | 0.0971 a 0.0006 b 0.5375 c | 0.002 a 1.0 b 0.1331 c |
| 4–12× 103/µL | 487 (79.2) 615 | 530 (77.3) 686 | 205 (74.0) 277 | 132 (65.0) 203 | 85 (65.4) 130 | 103 (75.2) 137 | |||||
| <4 × 10³/µL | 47 (7.6) 615 | 37 (5.4) 686 | 17 (6.1) 277 | 23 (11.3) 203 | 9 (6.9) 130 | 6 (4.4) 137 | |||||
| Haemoglobin n/n(%)/N On admission | <12 g/dL females <13 g/dL males anaemia | 172 (28.0) 615 | 173 (25.2) 686 | 91 (32.9) 277 | 104 (51.2) 203 | 63 (48.5) 130 | 84 (61.3) 137 | <0.0001 | <0.0001 |
0.4836 a <0.0001 b 0.0106 c | <0.0001 a,b 0.2546 c |
| On discharge | 266 (43.3) 615 | 244 (35.6) 686 | 122 (44.0) 277 | 136 (67.0) 203 | 79 (60.8) 130 | 92 (67.2) 137 | 0.0011 | <0.0001 |
1.0 a 0.0012 b 0.0071 c | <0.0001 a,b 1.0 c | |
| Platelets mean ± SD/min-max/N On admission | ×103/µL | 244.8 ± 115.7 4.0–1356 615 | 227.4 ± 101.0 0.0–746.0 686 | 244.9 ± 115.8 41.0–740.0 277 | 209.8 ± 108.3 3.0–730.0 203 | 236.9 ± 98.7 8.0–537.0 130 | 198.9 ± 83.6 15.0–578.0 137 | 0.7077 | 0.001 | N/A | 0.099 a 0.002 b 0.548 c |
| On discharge | 267.7 ± 122.9 2.0–929.0 614 | 273.6 ± 133.0 6.0–1101.0 685 | 259.6 ± 117.1 27.0–694.0 277 | 225.7 ± 124.3 3.0–606.0 203 | 225.6 ± 102.3 4.0–592.0 130 | 203.3 ± 92.3 15.0–472.0 137 | 0.0003 | <0.0001 |
0.614 a 0.0002 b 0.009 c | <0.0001 a,b 0.139 c | |
| Acid -base balance in the arterial blood gas | |||||||||||
| PH mean ± SD/min-max/N On admission | 7.42 ± 0.08 7.19–7.58 48 | 7.43 ± 0.09 7.04–7.57 73 | 7.43 ± 0.07 7.24–7.53 37 | 7.43 ± 0.07 7.10–7.54 51 | 7.39 ± 0.08 7.09–7.52 32 | 7.42 ± 0.07 7.28–7.54 35 | 0.2287 | 0.8496 | N/A | N/A | |
| On discharge | 7.43 ± 0.07 7.22–7.54 48 | 7.42 ± 0.09 7.06–7.54 73 | 7.43 ± 0.06 7.27–7.53 37 | 7.42 ± 0.09 7.01–7.55 51 | 7.44 ± 0,06 7.26–7.56 32 | 7.40 ± 0.06 7.25–7.52 35 | 0.8782 | 0.5746 | N/A | N/A | |
| PaO2 mean ± SD/min-max/N On admission | mmHg | 75.3 ± 33.0 12.8–207.0 48 | 70.2 ± 22.8 23.5–136.0 73 | 80.7 ± 54.2 28.3–286.0 37 | 73.2 ± 42.5 28.6–298.0 51 | 70.7 ± 25.7 32.8–134.0 32 | 70.5 ± 41.4 23.7–222.0 35 | 0.562 | 0.9031 | N/A | N/A |
| On discharge | 74.8 ± 27.7 12.8–207..0 48 | 75.7 ± 26.0 23.5–165.0 73 | 81.9 ± 55.0 23.3–286.0 37 | 74.6 ± 43.5 28.6–298.0 51 | 69.5 ± 27.6 28.5–134.0 32 | 63.6 ± 20.5 28.5–129.0 35 | 0.4499 | 0.0316 | N/A | 0.985 a 0.028 b 0.268 c | |
| PaCO2 mean ± SD/min-max/N On admission | mmHg | 38.3 ± 8.2 20.2–58.0 48 | 37.8 ± 11.5 25.7–82.4 73 | 37.2 ± 9.3 26.9–79.4 37 | 36.3 ± 9.6 20.9–67.0 51 | 38.6 ± 13.6 25.0–88,4 32 | 38.7 ± 8.0 19.7–61.0 35 | 0.8084 | 0.4415 | N/A | N/A |
| On discharge | 38.3 ± 8.4 20.2–62.2 48 | 38.5 ± 10.7 24.1–75.5 73 | 38.5 ± 10.0 27.8–84.4 37 | 37.5 ± 11.7 20.9–88.4 51 | 37.4 ± 11.5 25.0–88.4 32 | 39.9 ± 8.7 26.8–67.8 35 | 0.9071 | 0.5398 | N/A | N/A | |
| HCO3 standard mean ± SD/min-max/N On admission | mmol/L | 25.0 ± 3.7 12.5–32.9 47 | 24.9 ± 3.8 12.1–32.8 73 | 24.9 ± 4.4 16.9–39.5 36 | 24.0 ± 4.0 14.3–32.4 49 | 23.4 ± 4.6 13.5–32.3 32 | 24.8 ± 4.5 17.5–38.6 35 | 0.2666 | 0.4967 | N/A | N/A |
| On discharge | 25.3 ± 3.4 12.5–35.7 47 | 24.8 ± 4.0 12.1–33.6 73 | 25.7 ± 4.8 16.9–40.3 36 | 25.0 ± 6.1 13.7–51.7 49 | 25.1 ± 4.3 17.4–35.8 32 | 24.7 ± 3.7 19.4–36.7 35 | 0.8862 | 0.9539 | N/A | N/A | |
| BE mean ± SD/min-max/N On admission | mmol/L | 0.63 ± 5.06 [−]15.7–5.9 16 | 1.12 ± 4.67 [−]9.1–10.5 25 | 2.96 ± 4.72 [−]3.3–15.7 17 | 0.88 ± 5.59 [−]12.5–9.7 26 | [−]0.1 ± 4.75 [−]7.4–7.9 7 | 2.92 ± 5.21 [−]3.3–14.6 17 | 0.2745 | 0.4315 | N/A | N/A |
| On discharge | 1.21 ± 5.91 [−]15.7–11.9 16 | 0.46 ± 5.21 [−]11.0–8.3 25 | 3.54 ± 4.99 [−]3.3–17.1 17 | 1.62 ± 6.58 [−]14.7–11.8 26 | 0.91 ± 4.58 [−]7.4–7.9 7 | 1.65 ± 5.0 [−]5.3–13.2 17 | 0.363 | 0.6978 | N/A | N/A | |
| Lactates mean ± SD/min-max/N On admission | mmol/L | 2.0 ± 0.8 0.6–4.3 38 | 2.7 ± 1.9 1.1–12.8 67 | 2.0 ± 1.0 0.6–5.7 32 | 2.0 ± 0.7 0.5–3.8 47 | 2.9 ± 2.1 0.8–12.0 31 | 2.1 ± 1.4 0.6–5.7 30 | 0.1027 | 0.0291 | N/A | 0.02 a 0.199 b 0.913 c |
| On discharge | 2.1 ± 0.8 0.7–4.9 38 | 2.7 ± 1.9 1.0–12.8 67 | 2.0 ± 0.9 0.6–5.7 32 | 2.2 ± 1.1 0.5–6.4 47 | 2.6 ± 1.3 0.8–6.0 31 | 2.2 ± 1.1 0.8–4.3 30 | 0.0544 | 0.239 | N/A | N/A | |
| Electrolytes, inflammatory and iron biomarkers | |||||||||||
| Na mean ± SD/min-max/N On admission | mmol/L | 138.3 ± 3.8 106.0−155.0 605 | 138.2 ± 4.8 109.0−159.0 683 | 137.7 ± 7.6 101.0−175.0 272 | 137.7 ± 6.1 105.0−158.0 203 | 138.3 ± 7.7 108.0−174.0 130 | 137.6 ± 5.9 112.0−158.0 137 | 0.4803 | 0.3745 | N/A | N/A |
| On discharge | 138.9 ± 3.7 113.0−167.0 605 | 139.3 ± 4.8 109.0−175.0 683 | 139.0 ± 7.4 101.0−172.0 272 | 139.4 ± 7.2 105.0−165.0 203 | 140.7 ± 7.1 124.0−172.0 130 | 139.8 ± 6.3 120.0–157.0 137 | 0.0179 | 0.6389 | 0.977 a 0.013 b 0.062 c | N/A | |
| K mean ± SD/min-max/N On admission | mmol/L | 3.99 ± 0.54 2.33–6.5 609 | 4.13 ± 0.61 2.0–7.5 684 | 4.06 ± 0.7 2.42 ± 5.9 275 | 4.25 ± 0.69 2.4–7.0 202 | 4.14 ± 0.74 2.53–6.6 130 | 4.43 ± 0.87 3.0–8.7 137 | 0.0403 | 0.0002 | 0.325 a 0.059 b 0.479 c | 0.072 a 0.0005 b 0.1 c |
| On discharge | 4.13 ± 0.56 2.47–7.4 609 | 4.33 ± 0.6 2.0–6.9 684 | 4.26 ± 0.75 2.28–6.32 275 | 4.5 ± 0.77 2.4–7.0 202 | 4.36 ± 0.69 2.53–6.5 130 | 4.51 ± 0.69 2.76–6.64 137 | 0.0004 | 0.0011 | 0.033 a 0.002 b 0.373 c | 0.015 a,b 0.983 c | |
| CRP mean ± SD/min-max/N On admission | mg/L | 60.49 ± 72.41 0.13−531.58 597 | 90.54 ± 91.63 0.32−496.98 677 | 74.25 ± 84.61 0.4−538.55 275 | 95.36 ± 88.06 0.29–487.38 202 | 64.75 ± 72.93 0.4–344.95 130 | 87.45 ± 87.37 0.4–390.94 137 | 0.0674 | 0.69258 | N/A | N/A |
| On discharge | 36.85 ± 64.5 0.13–494.73 597 | 58.33± 88.96 0.25–496.98 677 | 62.6 ± 89.56 0.22–538.55 275 | 86.23± 99.39 0.46–447.61 202 | 63.78± 80.7 0.4–431.9 130 | 83.42± 90.91 0.42–390.94 137 | <0.0001 | 0.0001 | <0.0001 a 0.001 b 0.99 c | 0.001 a 0.01 b 0.961 c | |
| Procalcitonin mean ± SD/min-max/N On admission | ng/mL | 0.33 ± 1.55 0.01–24.95 404 | 1.24 ± 5.79 0.01–61.28 514 | 2.0 ± 15.13 0.01–196.04 188 | 1.62 ± 6.6 0.01–72.61 156 | 1.36 ± 6.46 0.01–60.77 98 | 1.59 ± 5.81 0.01–49.83 113 | 0.0993 | 0.7214 | N/A | N/A |
| On discharge | 0.57 ± 3.26 0.01–41.32 404 | 1.16 ± 6.14 0.01–75.16 514 | 0.86 ± 3.62 0.01–30.67 188 | 2.49 ± 8.44 0.01–81.09 156 | 1.11 ± 6.17 0.01–60.77 98 | 1.19 ± 3.68 0.01–27.61 113 | 0.5044 | 0.1807 | N/A | N/A | |
| IL-6 mean ± SD/min-max/N On admission | pg/mL | 85.5 ± 660.2 2.0–9099.0 192 | 45.2 ± 98.7 2.0–1000.0 288 | 34.3 ± 52.7 2.0–398.0 84 | 55.9 ± 75.3 2.0–499.0 59 | 55.2 ± 94.1 2.0–421.0 38 | 69.2 ± 97.8 2.0–369.0 40 | 0.2692 | 0.2811 | N/A | N/A |
| On discharge | 90.3 ± 672.0 2.0–9099.0 192 | 42.0 ± 111.0 2.0–1000.0 288 | 28.5 ± 53.5 2.0–398.0 84 | 56.5 ± 94.3 2.0–499.0 59 | 67.6 ± 170.4 2.0–1000.0 38 | 82.3 ± 150.6 2.0–804.0 40 | 0.1877 | 0.1939 | N/A | N/A | |
| D-dimer mean ± SD/min-max/N On admission | µg/mL | 2.60 ± 8.39 0.15–-118.32 444 | 4.63 ± 14.46 0.18–132.82 558 | 5.40 ± 12.57 0.2–107.65 206 | 7.84 ± 20.75 0.23–127.24 167 | 3.78 ± 11.48 0.24–107.54 100 | 7.01 ± 21.41 0.22–128.0 103 | 0.0133 | 0.1192 | 0.011 a 0.596 b 0.501 c | N/A |
| On discharge | 3.17 ± 11.99 0.15–128.0 444 | 3.25 ± 9.63 0.21–115.13 558 | 4.38 ± 8.28 0.21–74.28 206 | 7.2 ± 17.51 0.23–106.02 167 | 3.65 ± 11.23 0.21–107.54 100 | 3.72 ± 6.9 0.22–46.72 103 | 0.3287 | 0.0215 | N/A | 0.016 a 0.821 b 0.059 c | |
| INR mean ± SD/min-max/N On admission | 1.07 ± 0.2 0.82–3.6 580 | 1.19 ± 0.63 0.83–15.2 647 | 1.25 ± 0.69 0.87–7.8 257 | 1.27 ± 0.44 0.89–4.37 188 | 1.58 ± 1.75 0.9–18.74 127 | 1.99 ± 2.98 0.89–21.1 124 | <0.0001 | 0.0031 | 0.0002 a 0.005 b 0.112 c | 0.136 a 0.01 b 0.023 c | |
| On discharge | 1.1 ± 0.4 0.82–9.2 580 | 1.17 ± 0.33 0.87–6.82 647 | 1.2 ± 0.8 0.88–13.1 257 | 1.32 ± 0.7 0.92–7.85 188 | 1.4 ± 0.8 0.9–8.0 127 | 1.53 ± 1.88 0.87–21.1 124 | 0.0003 | 0.0019 | 0.048 a 0.001 b 0.251 c | 0.011 a 0.082 b 0.452 c | |
| APTT n/n(%)/N On admission | >60 s | 6 1.1 561 | 22 3.5 630 | 3 1.2 247 | 4 2.2 184 | 6 4.8 124 | 5 4.2 120 | 0.0243 | 0.5704 | 1.0 a 0.0337 b 0.1964 c | N/A |
| On discharge | 14 2.5 561 | 32 5.1 630 | 3 1.2 247 | 5 2.7 184 | 4 3.2 124 | 8 6.7 120 | 0.3472 | 0.2518 | N/A | N/A | |
| Fibrinogen mean ± SD/min-max/N On admission | g/dL | 4.69 ± 1.53 0.35–9.04 153 | 5.11 ± 2.14 0.44–10.0 132 | 4.34 ± 1.4 0.35–6.72 29 | 4.93 ± 2.0 0.37–9.2 52 | 3.62 ± 1.06 1.78–5.51 24 | 5.31 ± 1.71 2.54–9.1 29 | 0.0004 | 0.6765 | 0.441 a 0.0003 b 0.096 c | N/A |
| On discharge | 4.58 ± 1.8 0.44–10.0 153 | 4.95 ± 2.13 0.6–10.0 132 | 5.01 ± 2.11 0.35–9.4 29 | 4.98 ± 2.3 0.37–11.3 52 | 3.84 ± 1.21 1.53–5.75 24 | 5.71 ± 2.07 2.2–9.04 29 | 0.0184 | 0.2055 |
0.561 a 0.037 b 0.04 c | N/A | |
| Parameter Time of Assessment | Units | Low Risk [0–1] | Medium [2–3] | High Risk [≥4] | p-Value OMNIBUS | p-Value for Post-Hoc Analysis | |||||
|---|---|---|---|---|---|---|---|---|---|---|---|
| Females | Males | Females | Males | Females | Males | Females | Males | Females | Males | ||
| Biochemistry | |||||||||||
| Glucose mean ± SD/min-max/N On admission | mg/dL | 128.1 ± 67.0 61.0–671.0 425 | 139.3 ± 79.5 28.0–933.0 638 | 144.1 ± 74.9 54.0–662.0 257 | 160.5 ± 110.3 47.0–1026.0 192 | 149.1 ± 86.5 70–685 120 | 152.0 ± 109.4 37.0–1064.0 126 | 0.0035 | 0.0315 | 0.014 a 0.039 b 0.849 c | 0.038 a 0.433 b 0.779 c |
| On discharge | 119.0 ± 56.0 37.0–595.0 425 | 127.3 ± 78.8 50.0–1444.0 638 | 136.4 ± 75.3 54.0–596.0 257 | 150.7 ± 92.2 47.0–578.0 192 | 144.8 ± 90.4 14.0–685.0 120 | 143.5 ± 63.1 37.0–406.0 126 | 0.0003 | 0.0012 | 0.004 a 0.01 b 0.653 c | 0.005 a 0.033 b 0.688 c | |
| Glycated hemoglobin (HbA1c) mean ± SD/min-max/N On admission | % | 7.1 ± 1.9 4.2–12.2 47 | 7.9 ± 2.5 4.9–14.9 80 | 7.9 ± 2.7 4.9–16.6 39 | 7.2 ± 1.4 4.8–12.2 36 | 7.2 ± 1.7 5.1–11.4 33 | 7.4 ± 1.9 5.1–13.7 28 | 0.3182 | 0.1497 | N/A | N/A |
| On discharge | 7.0 ± 1.8 4.2–12.2 47 | 7.8 ± 2,4 4.9–14.9 80 | 7.9 ± 2.7 4.9–16.8 39 | 7.1 ± 1.4 4.7–12.2 36 | 7.2 ± 1.7 5.1–11.4 33 | 7.4 ± 1.9 5.1–13.7 28 | 0.2299 | 0.1563 | N/A | N/A | |
| Urea mean ± SD/min-max/N On admission | mg/dL | 36.3 ± 35.1 7.0–301.0 481 | 47.6 ± 35.8 5.0–307.0 664 | 60.2 ± 50.6 8.0–353.0 256 | 69.9 ± 47.5 15.0–271.0 199 | 69.5 ± 48.9 12.0–336.0 124 | 84.4 ± 57.1 17.0–369.0 133 | <0.0001 | <0.0001 | <0.0001a,b 0.197 c | <0.0001a,b 0.042 c |
| On discharge | 35.5 ± 29.6 7.0–231.0 481 | 44.9 ± 32.9 5.0–307.0 664 | 59.0 ± 48.2 10.0–353.0 256 | 75.6 ± 59.8 12.0–396.0 199 | 66.9 ± 41.7 15.0–204.0 124 | 88.9 ± 58.6 21.0–342.0 133 | <0.0001 | <0.0001 | <0.0001a,b 0.236 c | <0.0001a,b 0.11 c | |
| Creatinine mean ± SD/min-max/N On admission | mg/dL | 1.0 ± 0.99 0.34–11.99 533 | 1.26 ± 1.3 0.26–14.87 683 | 1.22 ± 0.97 0.48–9.56 275 | 1.76 ± 1.6 0.58–12.66 203 | 1.58 ± 1.27 0.44–8.46 130 | 2.02 ± 1.81 0.49–11.3 137 | <0.0001 | <0.0001 | 0.008 a < 0.0001 b 0.012 c | 0.0002 a < 0.0001 b 0.369 c |
| On discharge | 0.96 ± 0.86 0.34–9.11 533 | 1.16 ± 1.18 0.26–14.87 683 | 1.16 ± 0.92 0.45–9.06 275 | 1.81 ± 1.72 0.43–12.35 203 | 1.42 ± 1.21 0.43–7.66 130 | 1.89 ± 1.58 0.43–9.27 137 | <0.0001 | <0.0001 | 0.009 a 0.0002 b 0.084 c | <0.0001a,b 0.877 c | |
| eGFR mean ± SD/min-max/N On admission | mL/min/1.73 m2 | 84.6 ± 32.1 0.0–207.0 531 | 85.3 ± 35.9 3.0–433.0 680 | 60.8 ± 25.0 4.0–136.0 275 | 63.7 ± 33.1 4.0–149.0 203 | 49.7 ± 26.4 5.0–145.0 130 | 55.3 ± 32.0 5.0–180.0 137 | <0.0001 | <0.0001 | 0.0 a < 0.0001 b 0.0002 c | 0.0 a 0.0 b 0.054 c |
| On discharge | 86.6 ± 32.1 0.0–207.0 531 | 91.5 ± 36.5 3.0–433.0 680 | 65.0 ± 26.6 4.0–148.0 275 | 66.0 ± 36.1 4.0–208,0 203 | 58.2 ± 30.3 5.0–147.0 130 | 58.6 ± 35.7 6.0–209.0 137 | <0.0001 | <0.0001 | 0.0 a < 0.0001 b 0.076 c | <0.0001a,b 0.147 c | |
| Total protein mean ± SD/min-max/N On admission | g/L | 6.1 ± 0.8 3.9–8.2 145 | 6.1 ± 0.8 3.5–8.1 186 | 5.8 ± 0.8 3.6–8.2 78 | 6.0 ± 1.0 4.2–9.5 74 | 5.7 ± 0.9 3.3–8.1 62 | 5.7 ± 0.9 3.4–8.2 61 | 0.0235 | 0.0555 | 0.148 a 0.033 b 0.741 c | N/A |
| On discharge | 6.0 ± 0.9 3.9–8.2 145 | 6.0 ± 0.9 3.0–8.1 186 | 5.7 ± 0.9 3.7–8.2 78 | 5.9 ± 0.9 4.3–9.1 74 | 5.5 ± 1.0 3.3–8.1 62 | 5.7 ± 0.9 3.4–7.8 61 | 0.0012 | 0.0162 | 0.049 a 0.002 b 0.388 c | 0.799 a 0.012 b 0.158 c | |
| Albumin mean ± SD/min-max/N On admission | g/L | 3.1 ± 0.6 1.6–4.6 152 | 3.2 ± 0.6 1.5–5.1 222 | 3.0 ± 0.5 1.1–4.3 78 | 3.2 ± 0.6 2.1–4.4 82 | 2.9 ± 0.6 0.7–3.7 62 | 3.1 ± 0.6 1.5–4.9 67 | 0.0134 | 0.3087 | 0.287 a 0.011 b 0.307 c | N/A |
| On discharge | 3.1 ± 0.6 1.1–4.6 152 | 3.0 ± 0.7 0.4–5.1 222 | 3.0 ± 0.5 1.9–4.2 78 | 3.1 ± 0.6 1.7–4,4 82 | 2.8 ± 0.5 1.4–3.7 62 | 2.8 ± 0.7 0.9–4..5 67 | 0.005 | 0.0549 | 0.64 a 0.004 b 0.277 c | N/A | |
| AST mean ± SD/min-max/N On admission = | IU/L | 56.8 ± 139.7 6.0–2405.0 384 | 62.7 ± 89.4 5.0–1261.0 499 | 72.7 ± 343.6 8.0–4776 193 | 58.8 ± 49.5 7.0–323.0 154 | 113.5 ± 450.8 8.0–3866.0 104 | 60.2 ± 101.8 10.0–731.0 107 | 0.3869 | 0.7844 | N/A | N/A |
| On discharge | 123.4 ± 1244.4 10.0–23,896.0 384 | 68.3 ± 255.1 5.0–3761.0 499 | 43.3 ± 46.5 8.0–380.0 193 | 107.5 ± 537.6 11.0–6591.0 154 | 148.9 ± 702.4 8.0–6088.0 104 | 97.4 ± 402.4 7.0–4019.0 107 | 0.1438 | 0.5525 | N/A | N/A | |
| ALT mean ± SD/min-max/N On admission | IU/L | 47.0 ± 87.7 5.0–1411.0 435 | 61.4 ± 96.4 4.0–1278.0 537 | 52.2 ± 251.2 5.0–3700.0 219 | 45.0 ± 43.2 4.0–270.0 172 | 57.1 ± 183.6 5.0–1361.0 112 | 46.7 ± 88.2 6.0–612.0 113 | 0.8212 | 0.0081 | N/A | 0.006 a 0.256 b 0.98 c |
| On discharge | 65.5 ± 265.4 6.0–5163.0 435 | 74.3 ± 105.0 4.0–1217.0 537 | 38.5 ± 46.1 5.0–449.0 219 | 65.1 ± 124.7 7.0–1247.0 172 | 74.4 ± 308.8 5.0–2985.0 112 | 71.4 ± 207.3 9.0–1570.0 113 | 0.0624 | 0.6835 | N/A | N/A | |
| Bilirubin mean ± SD/min-max/N On admission | mg/dL | 0.78 ± 1.68 0.1–19.1 363 | 0.88 ± 1.24 0.1–15.1 489 | 0.85 ± 0.88 0.2–9.2 195 | 0.80 ± 0.49 0.2–3.1 157 | 0.77 ± 0.51 0.1–4.2 100 | 0.98 ± 0.84 0.3–6.6 103 | 0.5771 | 0.1292 | N/A | N/A |
| On discharge | 0.77 ± 1.65 0.1–19.0 363 | 0.95 ± 1.91 0.1–25.9 489 | 0.95 ± 2.55 0.2–35.3 195 | 0.76 ± 0.47 0.2–3.1 157 | 0.78 ± 0.67 0.3–6.1 100 | 1.06 ± 1.33 0.2–12.8 103 | 0.6611 | 0.0224 | N/A | 0.123 a 0.754 b 0.08 c | |
| LDH mean ± SD/min-max/N On admission | U/L | 404.5 ± 478.5 50.0–7100.0 328 | 448.6 ± 282.2 120.0–3194.0 448 | 368.2 ± 189.8 44.0–1357.0 156 | 418.9 ± 212.9 134.0–1172.0 130 | 468.1 ± 1015.3 71.0–9505.0 83 | 416.9 ± 269.7 113.0–1863.0 86 | 0.3576 | 0.3427 | N/A | N/A |
| On discharge | 387.2 ± 739.3 50.0–11,227.0 328 | 389.2 ± 396.2 93.0–6577.0 448 | 340.3 ± 167.3 44.0–1357.0 156 | 407.1 ± 243.5 112.0–1584.0 130 | 474.0 ± 1028.1 106.0–9505.0 83 | 388.8 ± 215.4 97.0–1260.0 86 | 0.292 | 0.7848 | N/A | N/A | |
| Cardiacbiomarkers | |||||||||||
| BNP mean ± SD/min-max/N On admission | pg/mL | 152.5 ± 241.1 1.7–1130.8 54 | 254.1 ± 763.7 1.7–6924.2 107 | 455.4 ± 872.4 10.1–4890.6 50 | 433.3 ± 747.2 3.0–3153.2 50 | 711.7 ± 995.6 22.3–4993.0 56 | 1432.8 ± 2864.5 5.9–13,368.4 42 | <0.0001 | 0.0206 | 0.054 a 0.0004 b 0.338 c | 0.35 a 0.031 b 0.082 c |
| On discharge | 177.7 ± 308.1 5.3–1877.0 54 | 239.8 ± 753.1 1.7–6924.2 107 | 536.1 ± 1562.6 10.1–10,622.8 50 | 396.2 ± 697.6 3.0–3153.2 50 | 592.3 ± 769.1 22.3–3729.8 56 | 1389.2 ± 2735.4 11.9–13,368.4 42 | 0.0008 | 0.0206 | 0.257 a 0.001 b 0.971 c | 0.412 a 0.027 b 0.067 c | |
| NT-proBNP mean ± SD/min-max/N On admission | ng/mL | 1467.1± 3250.7 18.7–16,551.7 62 | 2126.5± 9426.7 12.0–70,000.0 110 | 6608.9± 12,708.7 49.6–70,000.0 54 | 10,323.4 ± 16,141.4 18.2–70,000.0 55 | 14,888.1 ± 18,982.5 119.6–70,000.0 43 | 13,522.6 ± 19,276.7 343.7–70,000.0 55 | <0.0001 | <0.0001 | 0.015 a 0.0001 b 0.043 c | 0.002 a 0.0003 b 0.614 c |
| On discharge | 1694.0 ± 5047.8 28.5–35,000.0 62 | 1893.4 ± 7660.6 12.0–70,000.0 110 | 7852.3 ± 15,159.0 49.6–70,000.0 54 | 10,661.5 ± 16,202.2 18.2–70,000.0 55 | 13,084.8 ± 17,275.9 119.6–69,519.7 43 | 13,265.6 ± 17,873.3 391.3–70,000.0 55 | <0.0001 | <0.0001 | 0.016 a 0.0003 b 0.267 c | 0.0009 a <0.0001 b 0.703 c | |
| Troponin I, mean ± SD/min-max/N On admission | ng/mL | 53.1 ± 211.1 0.0–1994.8 263 | 189.6 ± 1015.9 1.3–11,758.2 415 | 658.5 ± 7215.3 1.9–94,365.5 171 | 3044.2 ± 15,485.9 1.0–125,592.6 134 | 988.4 ± 3316.8 3.3–21,022.9 94 | 542.0 ± 1724.6 4.8–14,128.8 97 | 0.015 | 0.0185 | 0.517 a 0.02 b 0.867 c | 0.087 a 0.133 b 0.156 c |
| On discharge | 105.7 ± 873.1 0.2–12,391.6 263 | 124.0 ± 797.8 0.8–11,758.2 415 | 692.7 ± 7243.6 1.9–94,365.5 171 | 3359.3 ± 18,244.2 0.8–174,652.6 134 | 838.2 ± 3666.2 1.8–29.828.3 94 | 493.1 ± 1504.8 4.8–12,657.2 97 | 0.0977 | 0.0095 | N/A | 0.104 a 0.055 b 0.17 c | |
| n/n(%)/N = F: >46.8 ng/mL M: >102.6 ng/mL | >3-fold upper range | 46 17.5 263 | 67 16.1 415 | 51 29.8 171 | 47 35.1 134 | 49 52.1 94 | 38 39.2 97 | <0.0001 | <0.0001 | 0.0113 a <0.0001b 0.0017 c | <0.0001a,b 1.0 c |
| LDL-cholesterol mean ± SD/min-max/N On admission | mg/dL | 106.8 ± 64.8 6.0–510.0 85 | 96.2 ± 40.5 27.0–242.0 147 | 93.9 ± 39.7 23.0–199.0 69 | 79.4 ± 40.6 17.0–230.0 60 | 83.3 ± 44.2 14.0–187.0 49 | 64.2 ± 37.6 6.0–210.0 39 | 0.0498 | <0.0001 | 0.283 a 0.038 b 0.381 c | 0.022 a <0.0001 b 0.142 c |
| HDL-cholesterol mean ± SD/min-max/N On admission | mg/dL | 43.9 ± 17.9 2.0–120.0 86 | 37.7 ± 14.5 10.0–101.0 150 | 44.5 ± 16.7 12.0–110.0 69 | 35.2 ± 11.9 7.0–66.0 60 | 39.8 ± 17.5 8.0–79.0 48 | 34.0 ± 10.3 17.0–61.0 38 | 0.303979 | 0.154387 | N/A | N/A |
| Triglycerides mean ± SD/min-max/N On admission | mg/dL | 189.4 ± 154.5 40.0–1100.0 122 | 173.7 ± 105.1 44.0–664.0 237 | 141.0 ± 94.5 48.0–595.0 83 | 148.0 ± 98.8 50.0–550.0 81 | 133.4 ± 56.7 46.0–282.0 60 | 124.8 ± 66.9 51.0–413.0 56 | 0.0022 | 0.0001 | 0.016 a 0.001 b 0.817 c | 0.117 a <0.0001 b 0.232 c |
| Hormones | |||||||||||
| 25-hydroxy-vitamin D mean ± SD/min-max/N On admission | ng/mL | 27.4 ± 21.8 3.5–146.1 99 | 23.4 ± 15.0 3.5–126.4 206 | 26.1 ± 17.2 3.5–77.7 63 | 22.9 ± 15.4 5.1–75.6 45 | 22.4 ± 16.8 3.5–63.5 36 | 14.5 ± 9.6 3.5–39.1 25 | 0.3738 | 0.0006 | N/A | 0.974 a 0.0006 b 0.018 c |
| TSH mean ± SD/min-max/N On admission | mIU/L | 1.55 ± 2.0 0.01–18.6 186 | 1.2 ± 1.06 0.0–6.33 255 | 1.72 ± 2.98 0.01–28.81 137 | 1.31 ± 1.39 0.01–8.28 95 | 2.74 ±5.04 0.0–38.24 85 | 1.43 ± 1.25 0.0–6.36 62 | 0.1063 | 0.3834 | N/A | N/A |
| Variables, Units | Low Risk [0–1] | Medium [2–3] | High Risk [≥4] | p-Value OMNIBUS | p Value for Post-Hoc Analysis | |||||
|---|---|---|---|---|---|---|---|---|---|---|
| Females N = 682 | Males N = 735 | Females N = 384 | Males N = 208 | Females N = 135 | Males N = 139 | Females | Males | Females | Males | |
| Applied treatment and procedures | ||||||||||
| Systemic corticosteroid n/n(%) | 299 (43.8) | 409 (55.6) | 127 (44.7) | 119 (57.2) | 64 (47.4) | 78 (56.1) | 0.7456 | 0.9222 | N/A | N/A |
| Convalescentplasma n/n(%) | 54 (7.9) | 113 (15.4) | 12 (4.2) | 29 (13.9) | 15 (11.1) | 16 (11.5) | 0.0274 | 0.4749 | 0.1599 a 0.8816 b 0.0406 c | N/A |
| Tocilizumab n/n(%) | 11 (1.6) | 11 (1.5) | 0 (0.0) | 2 (1.0) | 1 (0.7) | 0 (0.0) | 0.054 | 0.4308 | N/A | N/A |
| Remdesivir n/n(%) | 83 (12.2) | 153 (20.8) | 37 (13.0) | 35 (16.8) | 12 (8.9) | 23 (16.5) | 0.4627 | 0.2822 | N/A | N/A |
| Antibiotic n/n(%) | 338 (49.6) | 408 (55.5) | 157 (55.3) | 146 (70.2) | 88 (65.2) | 103 (74.1) | 0.0026 | <0.0001 | 0.3633 a 0.0038 b 0.2079 c | 0.0006 a 0.0002 b 1.0 c |
| Variables | Low Risk [0–1] | Medium [2–3] | High Risk [≥4] | p Value OMNIBUS | p Value for Post-Hoc Analysis | |||||
|---|---|---|---|---|---|---|---|---|---|---|
| Females N = 681 | Males N = 734 | Females N= 284 | Males N = 207 | Females N = 135 | Males N = 139 | Females | Males | Females | Males | |
| Applied treatment and procedures | ||||||||||
| The most advanced respiratory support applied during the hospitalisation no oxygen n/n(%) | 409 (60.1) | 332 (45.2) | 140 (49.3) | 62 (30.0) | 50 (37.0) | 39 (28.1) | <0.0001 | <0.0001 | 0.001a <0.0001 b 0.0114 c | 0.0001 a 0.0007b 1.0 c |
| low flow oxygen support n/n(%) | 199 (29.2) | 252 (34.3) | 103 (36.3) | 85 (41.1) | 65 (48.1) | 59 (42.4) | ||||
| high flow nasal cannula non-invasive ventilation n/n(%) | 26 (3.8) | 56 (7.6) | 24 (8.5) | 28 (13.5) | 17 (12.6) | 22 (15.8) | ||||
| invasive ventilation n/n(%) | 47 (6.9) | 94 (12.8) | 17 (6.0) | 32 (15.5) | 3 (2.2) | 19 (13.7) | ||||
| Oxygenation parameters from the period of qualification for advanced respiratory support: SpO2, % mean ± SD/(min-max/N | 92.2 ± 6.8 (59–100) 221 | 88.8 ± 8.6 (50–100) 189 | 87.0 ± 11.0 (55–99) 64 | 86.0 ± 8.4 (60–99) 69 | 86.2 ± 9.3 (59–98) 40 | 85.1 ± 10.5 (60–99) 48 | <0.0001 | 0.0159 | 0.002 a 0.0008 b 0.908 c | 0.057 a 0.072 b 0.87 c |
| Therapy with catecholamines n/n(%)/N | 39 (5.7) 682 | 92 (12.5) 735 | 14 (4.9) | 31 (14.9) 208 | 9 (6.7) | 33 (23.7) | 0.7614 | 0.0025 | N/A | 1.0 a 0.0026 b 0.1576 c |
| Coronary revascularisation or/and an indication for coronary revascularisation, n/n(%)/N | 1 (0.1) 682 | 7 (1.0) 735 | 3 (1.1) | 8 (3.8) 208 | 1 (0.7) | 6 (4.3) | 0.0795 | 0.0021 | N/A | 0.0225 a 0.0286 b 1.0 c |
| Haemodialysis n/n(%)/N | 15 (2.2) 682 | 31 (4.2) 735 | 2 (0.7) | 11 (0.7) 208 | 4 (3.0) | 8 (5.8) | 0.1486 | 0.6417 | N/A | N/A |
| Variables | Low Risk [0–1] | Medium [2–3] | High Risk [≥4] | p Value OMNIBUS | p Value for Post-Hoc Analysis | |||||
|---|---|---|---|---|---|---|---|---|---|---|
| Females N = 682 | Males N = 735 | Females N = 284 | Males N = 208 | Females N = 135 | Males N = 139 | Females | Males | Females | Males | |
| All-cause mortality rate | ||||||||||
| In-hospital mortality n/n(%) | 36 (5.3) | 83 (11.3) | 50 (17.6) | 60 (28.8) | 43 (31.9) | 54 (38.8) | <0.0001 | <0.0001 | <0.0001 a,b 0.0048 c | <0.0001 a,b 0.2029 c |
| 3-month mortality n/n(%) | 68 (10.0) | 134 (18.2) | 95 (33.5) | 103 (49.5) | 65 (48.1) | 82 (59.0) | <0.0001 | <0.0001 | <0.0001 a,b 0.016 c | <0.0001 a,b 0.3134 c |
| 6-month mortality n/n(%/)/N | 72 (17.3) 415 | 142 (31.4) 452 | 104 (49.3) 211 | 104 (60.1) 173 | 70 (61.4) 114 | 86 (68.8) 125 | <0.0001 | <0.0001 | <0.0001 a,b 0.1454 c | <0.0001 a,b 0.4696 c |
| Hospitalization | ||||||||||
| Duration of hospitalization days mean ± SD/(min-max) | 10.4 ±12.7 (1–131) | 12.4 ± 14.4 (1–130) | 12.1 ± 11.9 (1–68) | 14.6 ± 15.6 (1–124) | 18.3 ±17.5 (1–87) | 13.9 ± 13.9 (1–121) | <0.0001 | 0.1386 | 0.128 a <0.0001 b 0.0007 c | NA |
| End of hospitalisation death n/n(%) | 36 (5.3) | 83 (11.3) | 50 (17.6) | 60 (28.8) | 43 (31.9) | 54 (38.8) | <0.0001 | <0.0001 | <0.0001 a,b 0.0143 c | <0.0001 a,b 0.3663 c |
| discharge to home–full recovery | 515 (75.5) | 478 (65.0) | 141 (49.6) | 79 (38.0) | 57 (42.2) | 46 (33.1) | ||||
| transfer to another hospital –worsening) | 60 (8.8) | 79 (10.7) | 59 (20.8) | 38 (18.3) | 17 (12.6) | 27 (19.4) | ||||
| transfer to another hospital –in recovery | 71 (10.4) | 95 (12.9) | 34 (12.0) | 31 (14.9) | 18 (13.3) | 12 (8.6) | ||||
| Total Death | |||
| HR | 95%CI | p Value | |
| Overall | 1.428 | 1.349–1.513 | <0.0001 |
| Risk strata | |||
| Low risk vs. Medium risk | 4.267 | 3.170–5.732 | <0.0001 |
| Low risk vs. High risk | 6.524 | 4.714–9.031 | <0.0001 |
| Total Death | |||
| HR | 95%CI | p Value | |
| Overall | 1.400 | 1.331–1.474 | <0.0001 |
| Risk strata | |||
| Low risk vs. Medium risk | 3.289 | 2.559–4.227 | <0.0001 |
| Low risk vs.High risk | 4.476 | 3.438–5.827 | <0.0001 |
| Component | HR | CI Min. | CI Max. | p Value | |
|---|---|---|---|---|---|
| All-causemortality | Coronaryarterydisease | 1.133 | 0.743 | 1.728 | 0.5627 |
| COPD | 2.083 | 1.299 | 3.532 | 0.0064 | |
| Age > 75 | 2.750 | 2.088 | 3.6216 | <0.0001 | |
| Thyroiddisease | 0.784 | 0.566 | 1.105 | 0.1649 | |
| Hypertension | 1.881 | 1.394 | 2.537 | <0.0001 | |
| HfrEF | 1.584 | 1.134 | 2.212 | 0.007 |
| Component | HR | CI Min. | CI Max. | p Value | |
|---|---|---|---|---|---|
| All-causemortality | Coronaryarterydisease | 1.568 | 1.180 | 2.084 | 0.0019 |
| COPD | 1.182 | 0.786 | 1.615 | 0.4227 | |
| Age > 75 | 3.0541 | 2.411 | 3.869 | <0.0001 | |
| Thyroiddisease | 1.126 | 0.688 | 1.842 | 0.6378 | |
| Hypertension | 1.200 | 0.952 | 1.513 | 0.1233 | |
| HfrEF | 1.415 | 1.055 | 1.899 | 0.0206 |
| H2 | h3 | h4 | h5 | h6 | h7 | h8 | |
|---|---|---|---|---|---|---|---|
| m1 | 164.317 | 148.669 | 142.661 | 121.294 | 105.396 | 105.533 | 10.259 |
| m2 | 158.373 | 166.213 | 158.483 | 155.603 | 155.940 | 12.436 | |
| m3 | 122.464 | 116.484 | 116.367 | 116.190 | 10.699 | ||
| m4 | 79.813 | 86.505 | 82.846 | 8.919 | |||
| m5 | 45.423 | 40.946 | 6.156 | ||||
| m6 | 3.820 | 1.793 | |||||
| m7 | 0.139 |
| H2 | h3 | h4 | h5 | h6 | h7 | h8 | |
|---|---|---|---|---|---|---|---|
| m1 | 152.361 | 134.106 | 118.904 | 112.785 | 98.649 | 84.149 | 8.929 |
| m2 | 152.619 | 154.813 | 159.181 | 155.352 | 149.997 | 12.183 | |
| m3 | 116.694 | 121.473 | 118.900 | 115.004 | 10.673 | ||
| m4 | 84.079 | 82.389 | 79.865 | 8.909 | |||
| m5 | 58.586 | 58.244 | 7.628 | ||||
| m6 | 32.326 | 5.686 | |||||
| m7 | 2.769 |
| Variables | Low Risk [0,1] | Medium [2,3] | High Risk [≥4] | p-Value OMNIBUS | p-Value for Post-Hoc Analysis | |||||
|---|---|---|---|---|---|---|---|---|---|---|
| Females N = 682 | Males N = 735 | Females N= 284 | Males N = 208 | Females N = 135 | Males N = 139 | Females | Males | Females | Males | |
| Shock n/n(%) | 34 (5.0) | 74 (10.1) | 15 (5.3) | 31 (14.9) | 11 (8.1) | 22 (15.8) | 0.3314 | 0.0443 | N/A | 0.2006 a 0.1958 b 1.0 c |
| Hypovolemic shock n/n(%) | 9 (1.3) | 13 (1.8) | 4 (1.4) | 3 (1.4) | 5 (3.7) | 1 (0.7) | 0.1362 | 0.811 | N/A | N/A |
| Cardiogenic shock n/n(%) | 2 (0.3) | 5 (0.7) | 1 (0.4) | 10 (4.8) | 5 (3.7) | 9 (6.5) | 0.0018 | <0.0001 |
1.0 a 0.0055 b 0.0439 c | 0.0007 a 0.0002 b 1.0 c |
| Septic shock n/n(%) | 26 (3.8) | 62 (8.4) | 12 (4.2) | 18 (8.7) | 4 (3.0) | 18 (12.9) | 0.8198 | 0.2296 | N/A | N/A |
| Venous thromboembolic disease n/n(%) | 30 (4.4) | 53 (7.2) | 18 (6.3) | 12 (5.8) | 8 (5.9) | 7 (5.0) | 0.4093 | 0.5447 | N/A | N/A |
| Pulmonary embolism n/n(%) | 24 (3.5) | 44 (6.0) | 15 (5.3) | 11 (5.3) | 8 (5.9) | 5 (3.6) | 0.5516 | 0.8214 | N/A | N/A |
| Myocardial infarction n/n(%) | 2 (0.3) | 6 (0.8) | 3 (1.1) | 7 (3.4) | 3 (2.2) | 5 (3.6) | 0.0251 | 0.0038 | 0.464 a 0.1026 b 1.0 c | 0.035 a 0.0586 b 1.0 c |
| Myocardial injury, 3x, n/n(%)/N | 46 (17.5) 263 | 67 (16.1) 415 | 51 (29.8) 171 | 47 (35.1) 134 | 49 (52.1) 94 | 38 (39.2) 97 | <0.0001 | <0.0001 | 0.0114 a <0.0001 b 0.0017 c | <0.0001 a,b 1.0 c |
| Acute heart failure n/n(%) | 5 (0.7) | 3 (0.4) | 8 (2.8) | 14 (6.7) | 24 (17.8) | 22 (15.8) | <0.0001 | <0.0001 | 0.0777 a <0.0001 b,c | <0.0001 a,b 0.0329 c |
| Stroke/TIA n/n(%) | 4 (0.6) | 14 (1.9) | 12 (4.2) | 7 (3.4) | 4 (3.0) | 3 (2.2) | 0.0002 | 0.4167 | 0.0006 a 0.0872 b 1.0 c | N/A |
| Pneumonia n/n(%) | 268 (39.3) | 414 (56.3) | 164 (57.4) | 141 (67.8) | 88 (65.2) | 98 (70.5) | <0.0001 | 0.0004 | <0.0001 a, b 0.5343 c | 0.0117 a 0.0076 b 1.0 c |
| Complete respiratory failure n/n(%)/N | 23 (47.9) 48 | 34 (46.6) 73 | 16 (43.2) 37 | 30 (58.8) 51 | 20 (62.5) 32 | 23 (65.7) 35 | 0.2528 | 0.1348 | N/A | N/A |
| SIRS n/n(%)/N | 53 (8.2) 647 | 89 (12.6) 705 | 22 (7.8) 283 | 20 (9.7) 206 | 21 (15.7) 134 | 15 (10.8) 139 | 0.0158 | 0.4818 | 1.0 a 0.0343 b 0.0636 c | N/A |
| Sepsis n/n(%)/N | 3 (1.0) 288 | 6 (2.1) 288 | 3 (2.9) 104 | 4 (5.1) 79 | 3 (5.3) 57 | 4 (5.9) 68 | 0.053 | 0.1334 | N/A | N/A |
| Acute kidney injury n/n(%) | 37 (5.4) | 73 (9.9) | 30 (10.6) | 37 (17.8) | 28 (20.7) | 31 (22.3) | <0.0001 | <0.0001 | 0.0193 a <0.0001 b 0.0229 c | 0.0083 a 0.0002 b 1.0 c |
| Acute liver dysfunction n/n(%)/N | 11 (1.9) 592 | 19 (2.9) 664 | 12 (4.5) 268 | 10 (5.1) 197 | 5 (4.0) 126 | 9 (7.1) 127 | 0.0619 | 0.0458 | N/A | 0.5214 a 0.0936 b 1.0 c |
| Multiple organ dysfunction syndrome n/n(%) | 7 (1.0) | 14 (1.9) | 3 (1.1) | 5 (2.4) | 4 (3.0) | 4 (2.9) | 0.1674 | 0.6162 | N/A | N/A |
| Bleedings n/n(%) | 27 (4.0) | 37 (5.0) | 13 (4.6) | 12 (5.8) | 9 (6.7) | 16 (11.5) | 0.3758 | 0.0128 | N/A | 1.0 a 0.0184 b 0.2545 c |
Publisher’s Note: MDPI stays neutral with regard to jurisdictional claims in published maps and institutional affiliations. |
© 2022 by the authors. Licensee MDPI, Basel, Switzerland. This article is an open access article distributed under the terms and conditions of the Creative Commons Attribution (CC BY) license (https://creativecommons.org/licenses/by/4.0/).
Share and Cite
Rola, P.; Doroszko, A.; Trocha, M.; Giniewicz, K.; Kujawa, K.; Skarupski, M.; Gajecki, D.; Gawryś, J.; Matys, T.; Szahidewicz-Krupska, E.; et al. Sex-Dependent Differences in Predictive Value of the C2HEST Score in Subjects with COVID-19—A Secondary Analysis of the COLOS Study. Viruses 2022, 14, 628. https://doi.org/10.3390/v14030628
Rola P, Doroszko A, Trocha M, Giniewicz K, Kujawa K, Skarupski M, Gajecki D, Gawryś J, Matys T, Szahidewicz-Krupska E, et al. Sex-Dependent Differences in Predictive Value of the C2HEST Score in Subjects with COVID-19—A Secondary Analysis of the COLOS Study. Viruses. 2022; 14(3):628. https://doi.org/10.3390/v14030628
Chicago/Turabian StyleRola, Piotr, Adrian Doroszko, Małgorzata Trocha, Katarzyna Giniewicz, Krzysztof Kujawa, Marek Skarupski, Damian Gajecki, Jakub Gawryś, Tomasz Matys, Ewa Szahidewicz-Krupska, and et al. 2022. "Sex-Dependent Differences in Predictive Value of the C2HEST Score in Subjects with COVID-19—A Secondary Analysis of the COLOS Study" Viruses 14, no. 3: 628. https://doi.org/10.3390/v14030628
APA StyleRola, P., Doroszko, A., Trocha, M., Giniewicz, K., Kujawa, K., Skarupski, M., Gajecki, D., Gawryś, J., Matys, T., Szahidewicz-Krupska, E., Adamik, B., Kaliszewski, K., Kiliś-Pstrusińska, K., Matera-Witkiewicz, A., Pomorski, M., Protasiewicz, M., Madziarski, M., Chrostek, U., Radzik-Zając, J., ... Madziarska, K. (2022). Sex-Dependent Differences in Predictive Value of the C2HEST Score in Subjects with COVID-19—A Secondary Analysis of the COLOS Study. Viruses, 14(3), 628. https://doi.org/10.3390/v14030628