Abstract
The relationships between white spruce radial increment and wood properties were investigated in relation to tree and stand attributes using data from mature white spruce stands in the boreal forest of western Canada that experienced a range of shelterwood treatments. The model with the highest predictive ability was radial increment (adj-R2 = 67%) and included crown attributes, diameter at breast height (DBH), average height of competitors, and a climate index. Radial growth was positively related to live crown ratio, whereas wood density and modulus of elasticity were negatively correlated to the crown attribute. Tree slenderness had a significant negative effect on wood density and modulus of elasticity, as it reflects the mechanical stability requirement of the tree. The models consistently improved when using annual averages calculated over longer periods of time. However, when the annual averages were calculated using time periods of 5–10 and 10–20 years prior to sampling, the predictive ability of the models decreased, which indicated that the current tree and stand conditions were the best predictors of growth and wood properties up to five years prior to sampling. This study suggests that crown length equal to 2/3 of the tree height might represent an optimal balance between radial growth and wood quality.
1. Introduction
White spruce (Picea glauca (Moench) Voss) has high ecological and economic value and is a key component of the boreal forests of North America. Radial growth rates and wood and fibre characteristics have important effects on the mechanical properties of wood and fibre products (e.g., [1,2,3]), therefore, accurate tree level estimates of these factors can improve planning of wood flow to industrial plants and can add value to wood products [4].
Shelterwood systems affect total stand density and therefore the resources available for tree growth by partially removing the overstory canopy while protecting the advanced regeneration in the understory [5]. These treatments also have a strong influence on tree crown characteristics which in turn have direct effects on wood formation and fibre properties [6]. Several studies have also shown that site characteristics [7], climate [8] and genotype [9] are important factors to be considered when investigating wood and fibre properties.
Several models have already indicated a strong link between white spruce radial growth and: 1—competition levels [10], and 2—climate [11]. Likewise, wood properties have been successfully modeled in relation to crown attributes and climate [6]. While climate information can be easily obtained [12], collecting crown and competition information is costly and time consuming, thus only one measurement per plot is often available. In this regard, this study investigated the challenges related to modeling past growth rates and wood characteristics in relation to current crown attributes and competition levels.
This study developed predictive models of radial growth, wood density, microfibril angle, and modulus of elasticity using white spruce data from eight mature stands that underwent a wide range of shelterwood treatments in the boreal forests of western Canada. The base models were built using the three most recently produced annual rings to: 1—assess the influence of current crown and stand characteristics, and 2—test the predictive ability of the base models using time periods of different length and age.
2. Materials and Methods
Data for this study came from eight mature white spruce stands in the boreal forest of western Canada that experienced a wide range of shelterwood treatments (for more details, please refer to Table 1 and Figure 1).

Table 1.
Study information and treatment description. Coordinates are expressed in decimal degrees and elevation in meters. AW, Trembling aspen; SW, White spruce; FB, Balsam fir; and SB, Black spruce. The provinces (Prov.) represented are Alberta (AB), Saskatchewan (SK) and Manitoba (MB). Lat., latitude; Long., longitude; Elev., elevation; Trt.Yr., year of treatment; Age@Trt., stand age at the time of treatment.
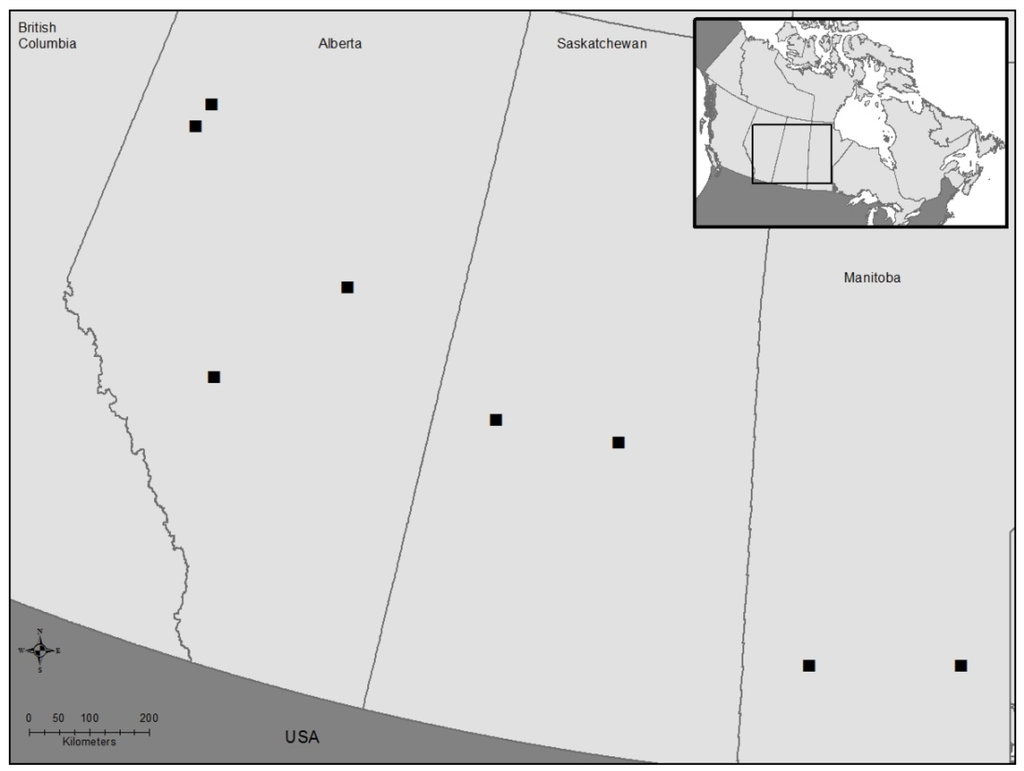
Figure 1.
Location of the eight long-term studies.
Treatments had been completed by Canadian Forest Service staff between 1952 and 2000 on the various study sites. Soils are predominantly luvisolic with medium to fine texture. Crown information (e.g., crown radius, crown length) was collected on the white spruce trees that were either destructively sampled (i.e., four trees per treatment at each site) or cored (i.e., seven trees per treatment at each site). The trees were randomly selected based on the average tree size in the plot in order to be representative of the range of diameter size classes of each site. Cores or tree cookies were taken at breast height. The cored trees were sampled at breast height only, whereas the disked trees had disks taken at five heights along the tree, for more in-depth analysis (not included in this study). Destructive sampling was restricted, as the trees were sampled from long-term Permanent Sample Plots, thus the cored trees were added to obtain a larger sample size. On both the cored and destructively sampled trees, the same height and crown attributes were measured, and the same methodology was followed on non- and destructively sampled trees.
The total number of white spruce trees selected was 218. For the sampled trees age ranged between 29 and 153 years (average = 69 years), diameter at breast height (DBH) ranged between 14.4 cm and 35.9 cm (average = 21.7 cm) and height ranged between 9.9 m and 32.1 m (average = 18.2 m). The crown attributes of each measured tree included: crown radii and crown length in four cardinal directions, while competition measurements included: diameter (i.e., DBH), height and distance from the subject tree for every tree within a 6 m radius. The height to the base of the live crown ranges from 0.8 to 18.8 m (average = 8.5 m) and the crown extended below breast height (1.3 m) for only two of the sampled trees (0.9% of total). This information suggests that the dataset is likely composed exclusively by mature wood.
The disks and cores collected were analyzed at the FPInnovations laboratory in Vancouver, British Columbia, Canada using the SilviScan™ system [13]. SilviScan™ combines image analysis, X-ray densitometry, and X-ray diffractometry to provide multiple wood and fibre properties including pith-to-bark profiles of wood density (WD), microfibril angle (MFA), and modulus of elasticity (MOE).
Several preliminary tests explored the correlation between average current tree and stand variables available at the time of sampling and annual: (1) radial area increment; (2) wood density (WD); (3) microfibril angle (MFA); and (4) modulus of elasticity (MOE). The base model was built using the most current information on growth and wood properties represented by the three-year annual averages similar to [14].
Linear and non-linear mixed effect models were tested to account for the hierarchical structure of the dataset (i.e., treatments nested within sites and sites nested within the study). The base model was built by testing and retaining only those explanatory variables that were significant at α = 0.05 and that improved the overall predictive ability of the model. The models were compared using several criteria including: (1) Akaike’s information criterion (AIC, [15]); (2) the coefficient of determination (Adjusted-R2, [16]); and, (3) residual plots. Parameter estimation for the mixed effects model was completed using the NLME statistical package in R (version 3.1.2) [17].
Variables related to the crown attributes of the subject tree were tested first (i.e., crown radius, crown length, live crown ratio, crown volume, crown projected base area, crown lateral surface area) followed by the remaining tree variables related to the subject tree (i.e., tree age, DBH, height, and tree slenderness). The estimates of competition within 6 m of the subject trees were then added to the model (i.e., DBH sum, BA sum, basal area of larger trees within the plot (BALT), average height of the competitors, average distance of the closest competitor per quadrant, average height of the competitors divided by the average distance and number of competitors. Finally, several climate variables were calculated for each site using the software ClimateNA (version 5.10) [12], including: mean annual temperature (MAT), mean warmest month temperature, mean coldest month temperature, mean annual precipitation (MAP), mean summer precipitation (MSP), precipitation as snow (PAS), annual heat-moisture index (i.e., AHM = (MAT + 10)/(MAP/1000)), growing degree-days above 5 °C and 18 °C. These variables were averaged over the five-year period (2005–2009) prior to the field measurements and added to the model (Table 2).
Table 2.
List of climate variables by study location together with the average value over the 5-year period (2005–2009): mean annual temperature (MAT, °C), mean warmest month temperature (MWMT, °C), mean coldest month temperature (WCMT, °C), mean annual precipitation (MAP, mm), mean summer precipitation (MSP, mm), annual heat-moisture index (i.e., AHM = (MAT + 10)/(MAP/1000)), growing degree-days above 5 °C and 18 °C (DD5 and DD18, respectively), and precipitation as snow (PAS, mm).
The base models selected for radial growth and wood properties were then tested using the annual averages over longer periods of time (i.e., five, ten and 20 years), and for older time periods including average values for the 5–10 and 10–20 years prior to sampling.
3. Results
The site level random effect was removed from the final equations because it did not improve the overall predictive ability of the model. This outcome is likely related to the inclusion of stand and climate variables that already capture most of the variability between sites.
3.1. Radial Area Increment
The results for the average annual radial area increment over three years indicated that the model improved (lower AIC and higher adjusted R-square) when more variables were added to the model up to a total of five variables (Table 3). The final model Equation (1) included: live crown ratio, crown radius, DBH, average height of the competitors, and AHM.
where Yijz is average annual radial area increment over three years (cm2/year) of tree z, in treatment j, in site i; LCRjz, Live crown ratio of the subject tree; CrRadjz, Crown Radius (m) of the subject tree; DBHjz, Diameter at Breast Height of the subject tree (cm); HtCAvjz, average height of competitors (m) for each subject tree; AHMi, Annual Heat-Moisture index for each site; an (n = 0, 1, 2, 3, 4, and 5) are the fixed effects parameters; au1 is the random effect (normally distributed with mean zero and an unknown variance component) relative to LCRjz for tree z, in treatment j; the εijz term represents the unexplained error.
Yijz = a0 + (a1 + au1) × LCR2jz + a2 × CrRad2jz + a3 × DBHjz + a4 × HtCAvjz + a5 × AHMi + εijz
Table 3.
Average annual radial area increment over three years: parameter estimates reported with standard error and goodness-of-fit for Equation (1). Akaike’s information criterion (AIC) and adjusted-R2 values for the fixed effects and treatment-level mixed effects models are included for comparison.
Adjusted R-square values for the final model were: 49% for the fixed effect model (i.e., au1 = 0), and 67% for the mixed effect model with treatment as the random effect (RMSE = 10.7%) (Table 3 and Figure 2). The coefficient values of Equation (1) indicated that radial area increment: (1) increased as live crown ratio (LCR) (a1 = 11.166332) (Figure 3), crown radius (a2 = 0.651599), and DBH (a3 = 0.344003) of the subject tree increased; (2) decreased as the average height values of the competitors (a4 = −0.431336) increased; and, (3) increased as the climate variable AHM (a5 = 1.164386) increased (Table 3).
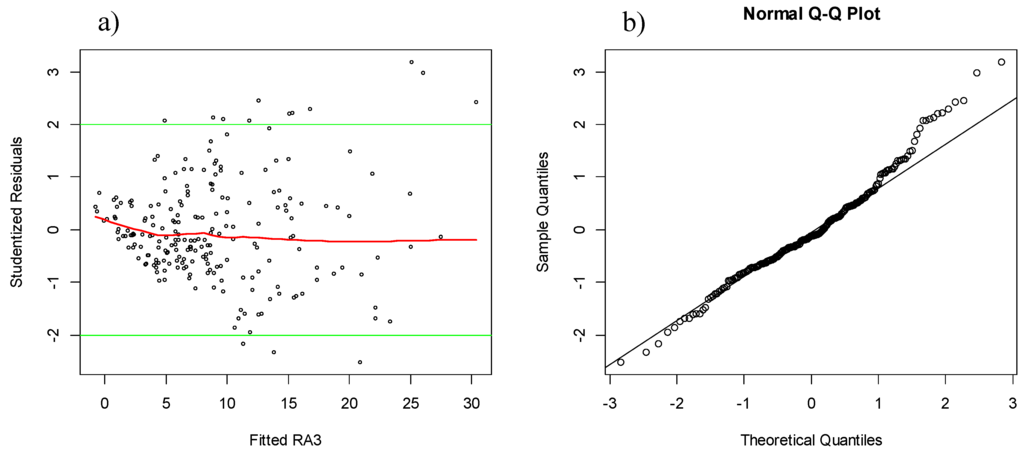
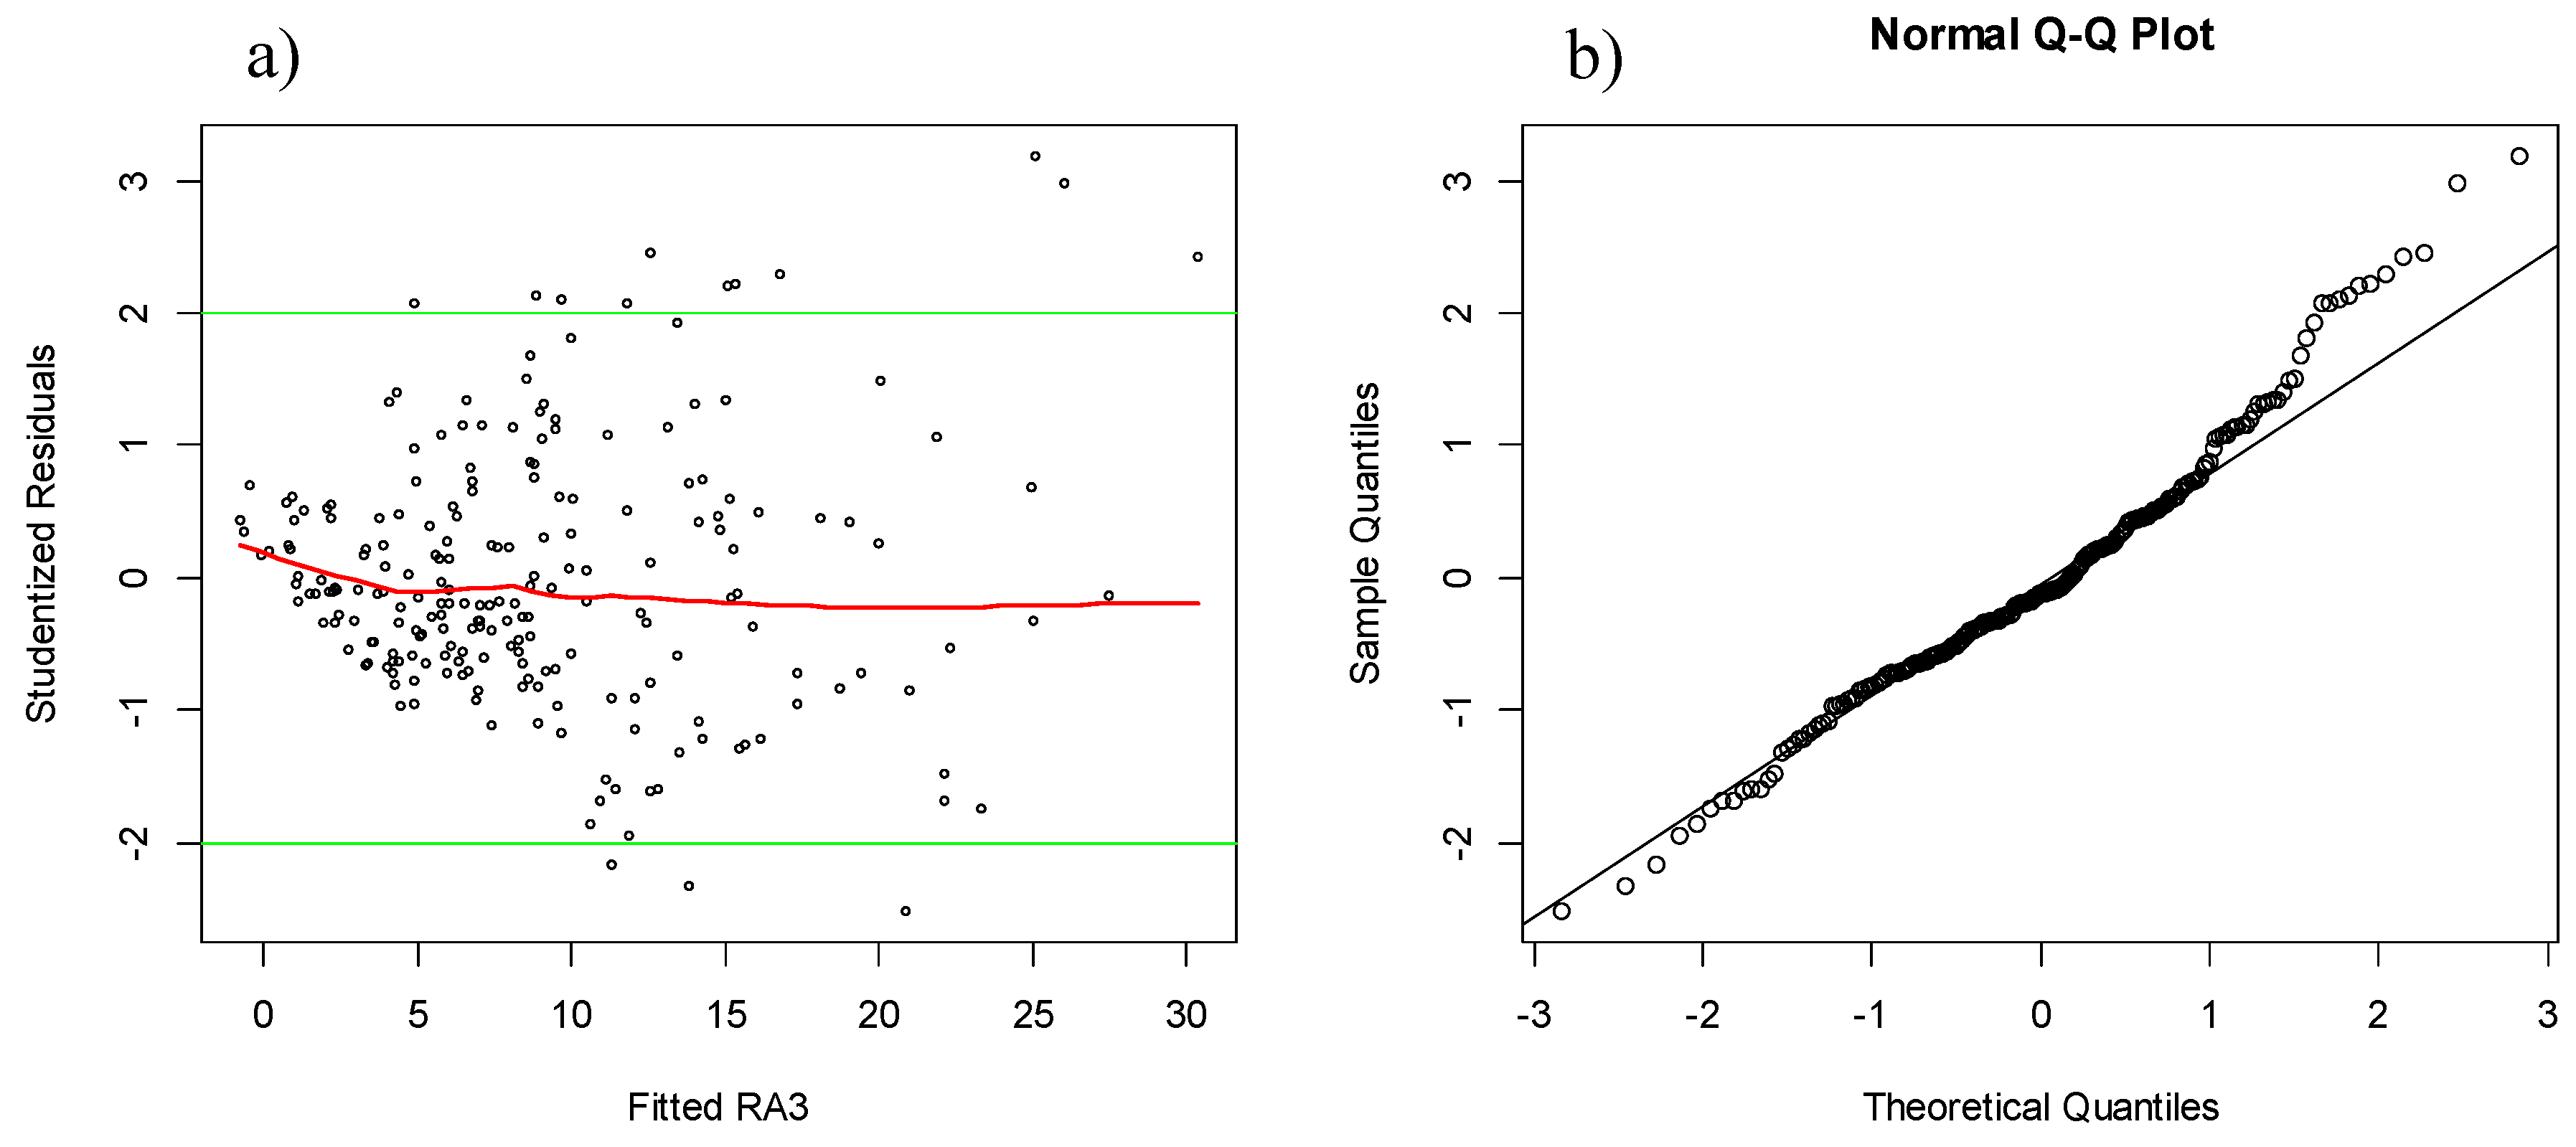
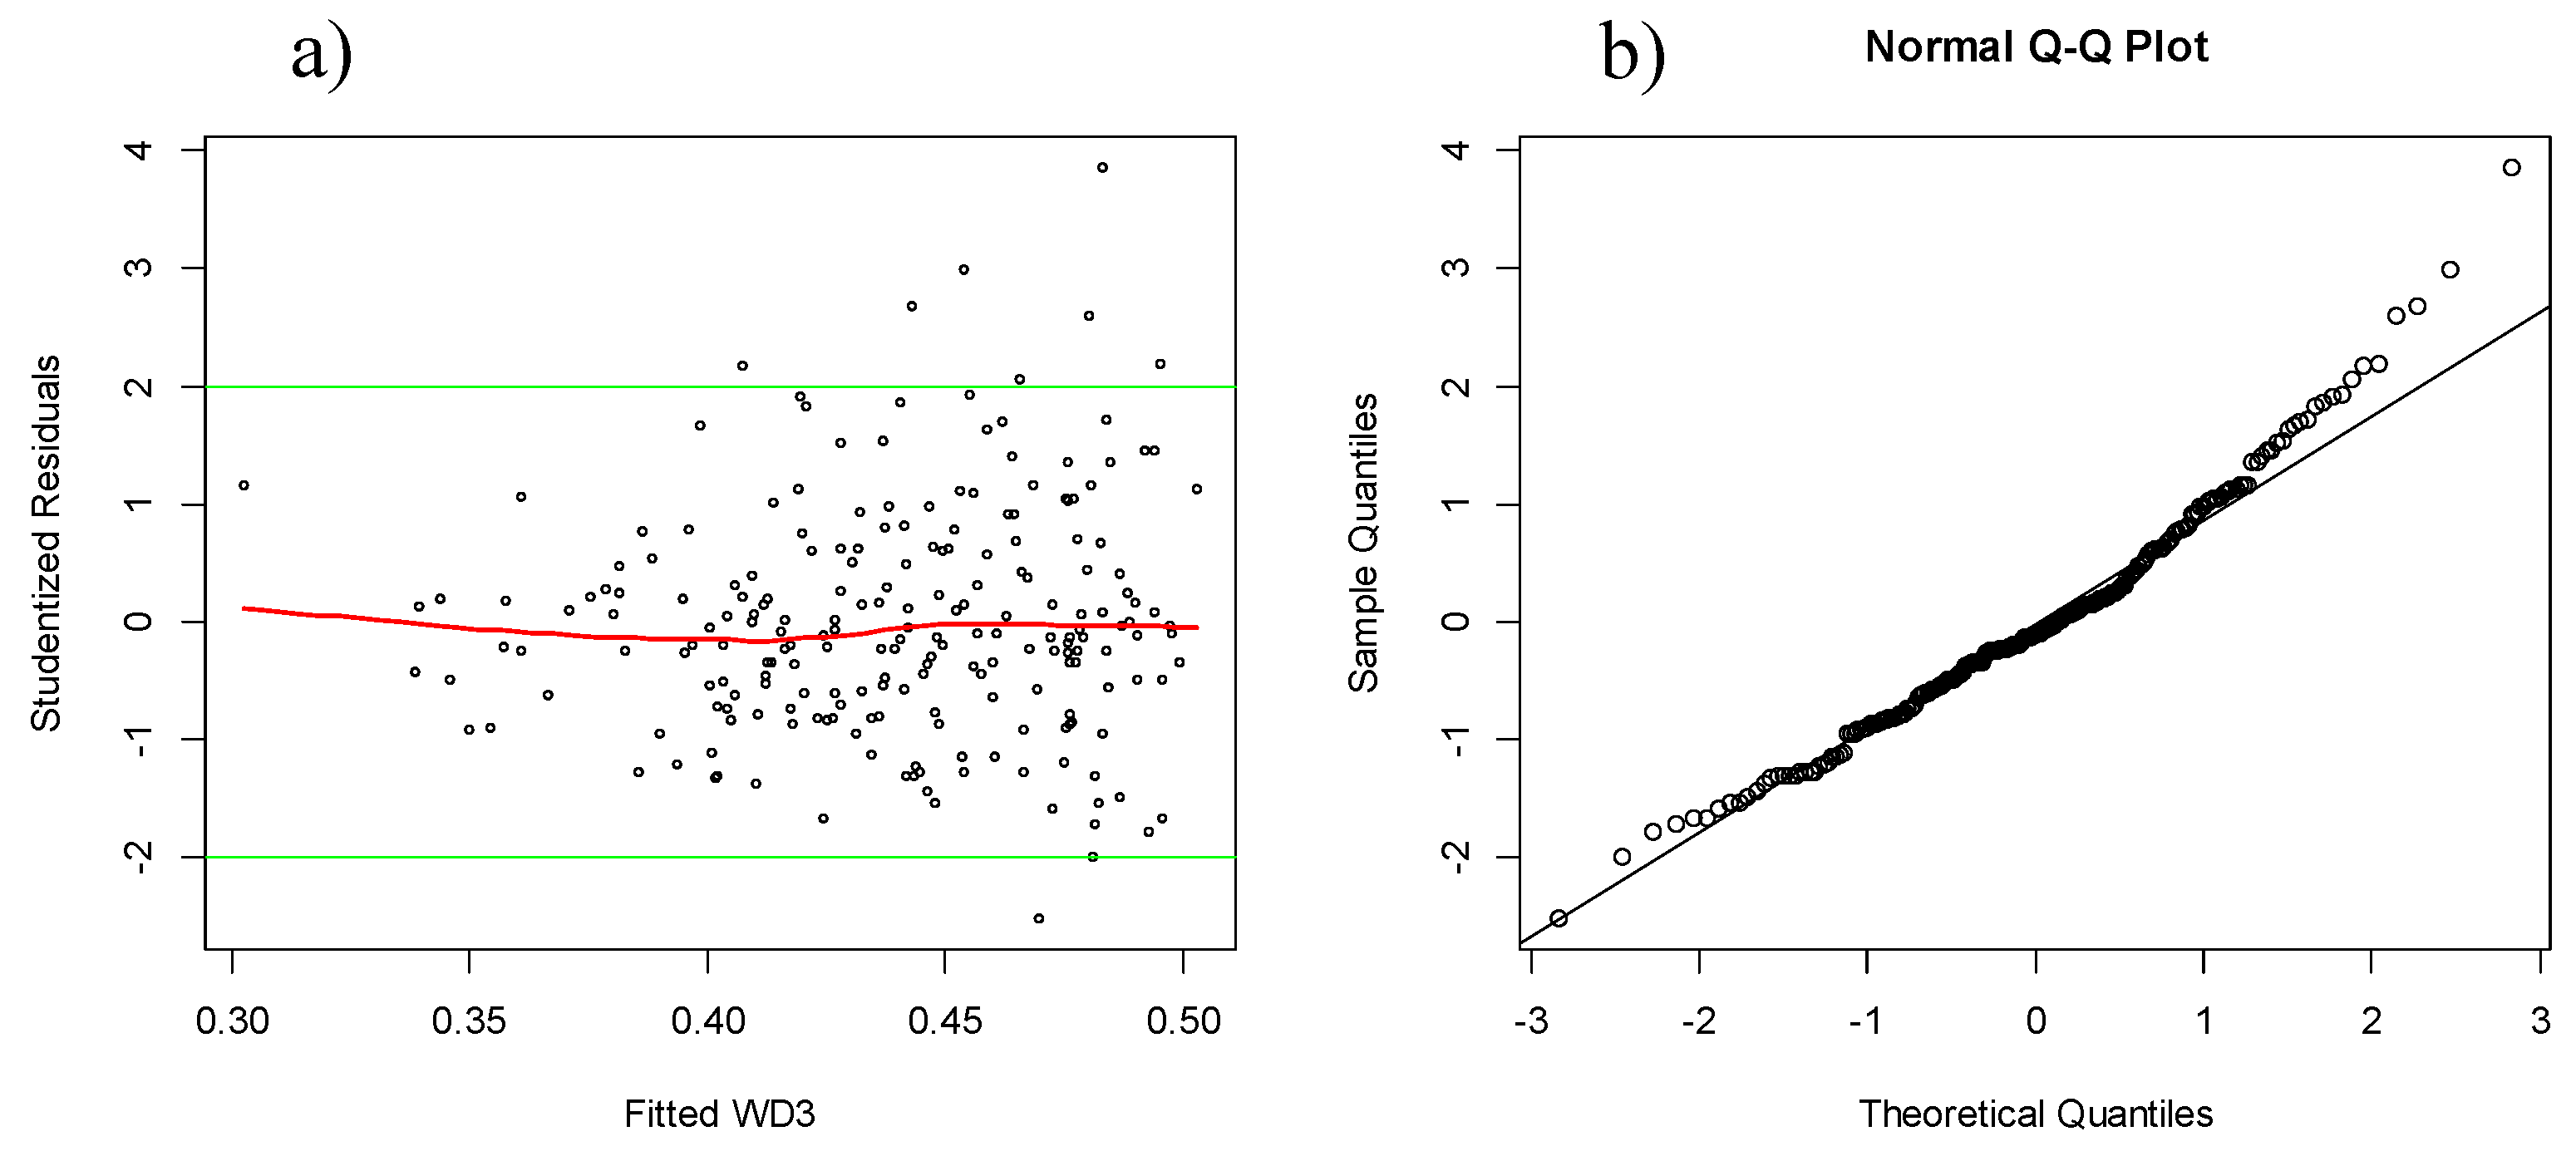
Figure 2.
Plots representing the goodness-of-fit for Equation (1): (a) scatter plots of studentized residuals against predicted together with the fitted Lowess line and (b) normal Q-Q plot.
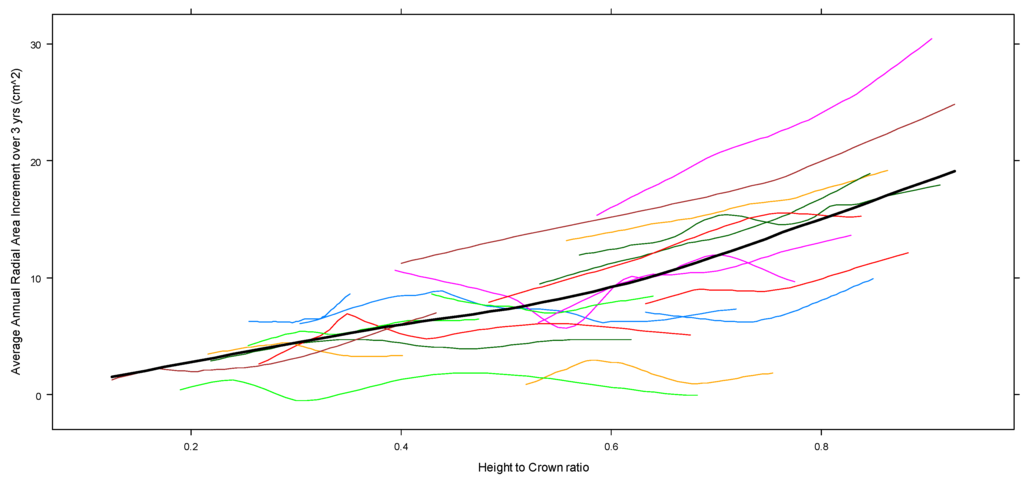
Figure 3.
Predicted values of average annual three-year radial area increment Equation (1) by treatment (thin lines) in relation to LCR of the subject tree. The thicker black line represents the fitted values at the study level (i.e., fixed effects).
The overall predictive ability of the model improved as the annual average of basal area increment was calculated over increasingly longer periods of time (i.e., 5, 10, and 20 years) (Table 4). The climate variable AHM was not significantly different from zero for the two longer time periods (i.e., 10 and 20 years). However, the predictive ability of the model decreased (i.e., higher AIC) when radial area annual increment over the 5–10 and 10–20 year periods (prior to sampling) were tested.
Table 4.
Average annual radial area increment, parameter estimates reported with standard error and goodness-of-fit for Equation (1) using time periods of 3, 5, 10, and 20 years. AIC and the adjusted R-square values for the fixed effects and treatment-level mixed effects models are included for comparison.
3.2. Wood Density
The results for average annual wood density over three years indicated that the model improved (lower AIC and higher adjusted R-square) when more variables were added to the model up to a total of three variables (Table 5). The final model Equation (2) included: live crown ratio, tree slenderness; and the climate variable DD18 (i.e., growing degree days above 18 °C).
where Yijz is average annual wood density over three years (g/cm2·year−1) of tree z, in treatment j, in site i; LCRjz, Live Crown ratio of the subject tree; HDjz, Height to Diameter ratio of the subject tree; DD18i, Growing Degree Days above 18 °C of each site; an (n = 0, 1, 2, and 3) are the fixed effects parameters; au1 is the random effect (normally distributed with mean zero and an unknown variance component) relative to LCRjz for tree z, in treatment j; the εijz term represents the unexplained error.
Yijz = a0 + (a1 + au1) × LCRjz + a2 × HDjz + a3 × DD18i + εijz
Table 5.
Average annual wood density over three years: parameter estimates reported with standard error and goodness-of-fit for Equation (2). AIC and adjusted R-square values for the fixed effects and treatment-level mixed effects models are included for comparison.
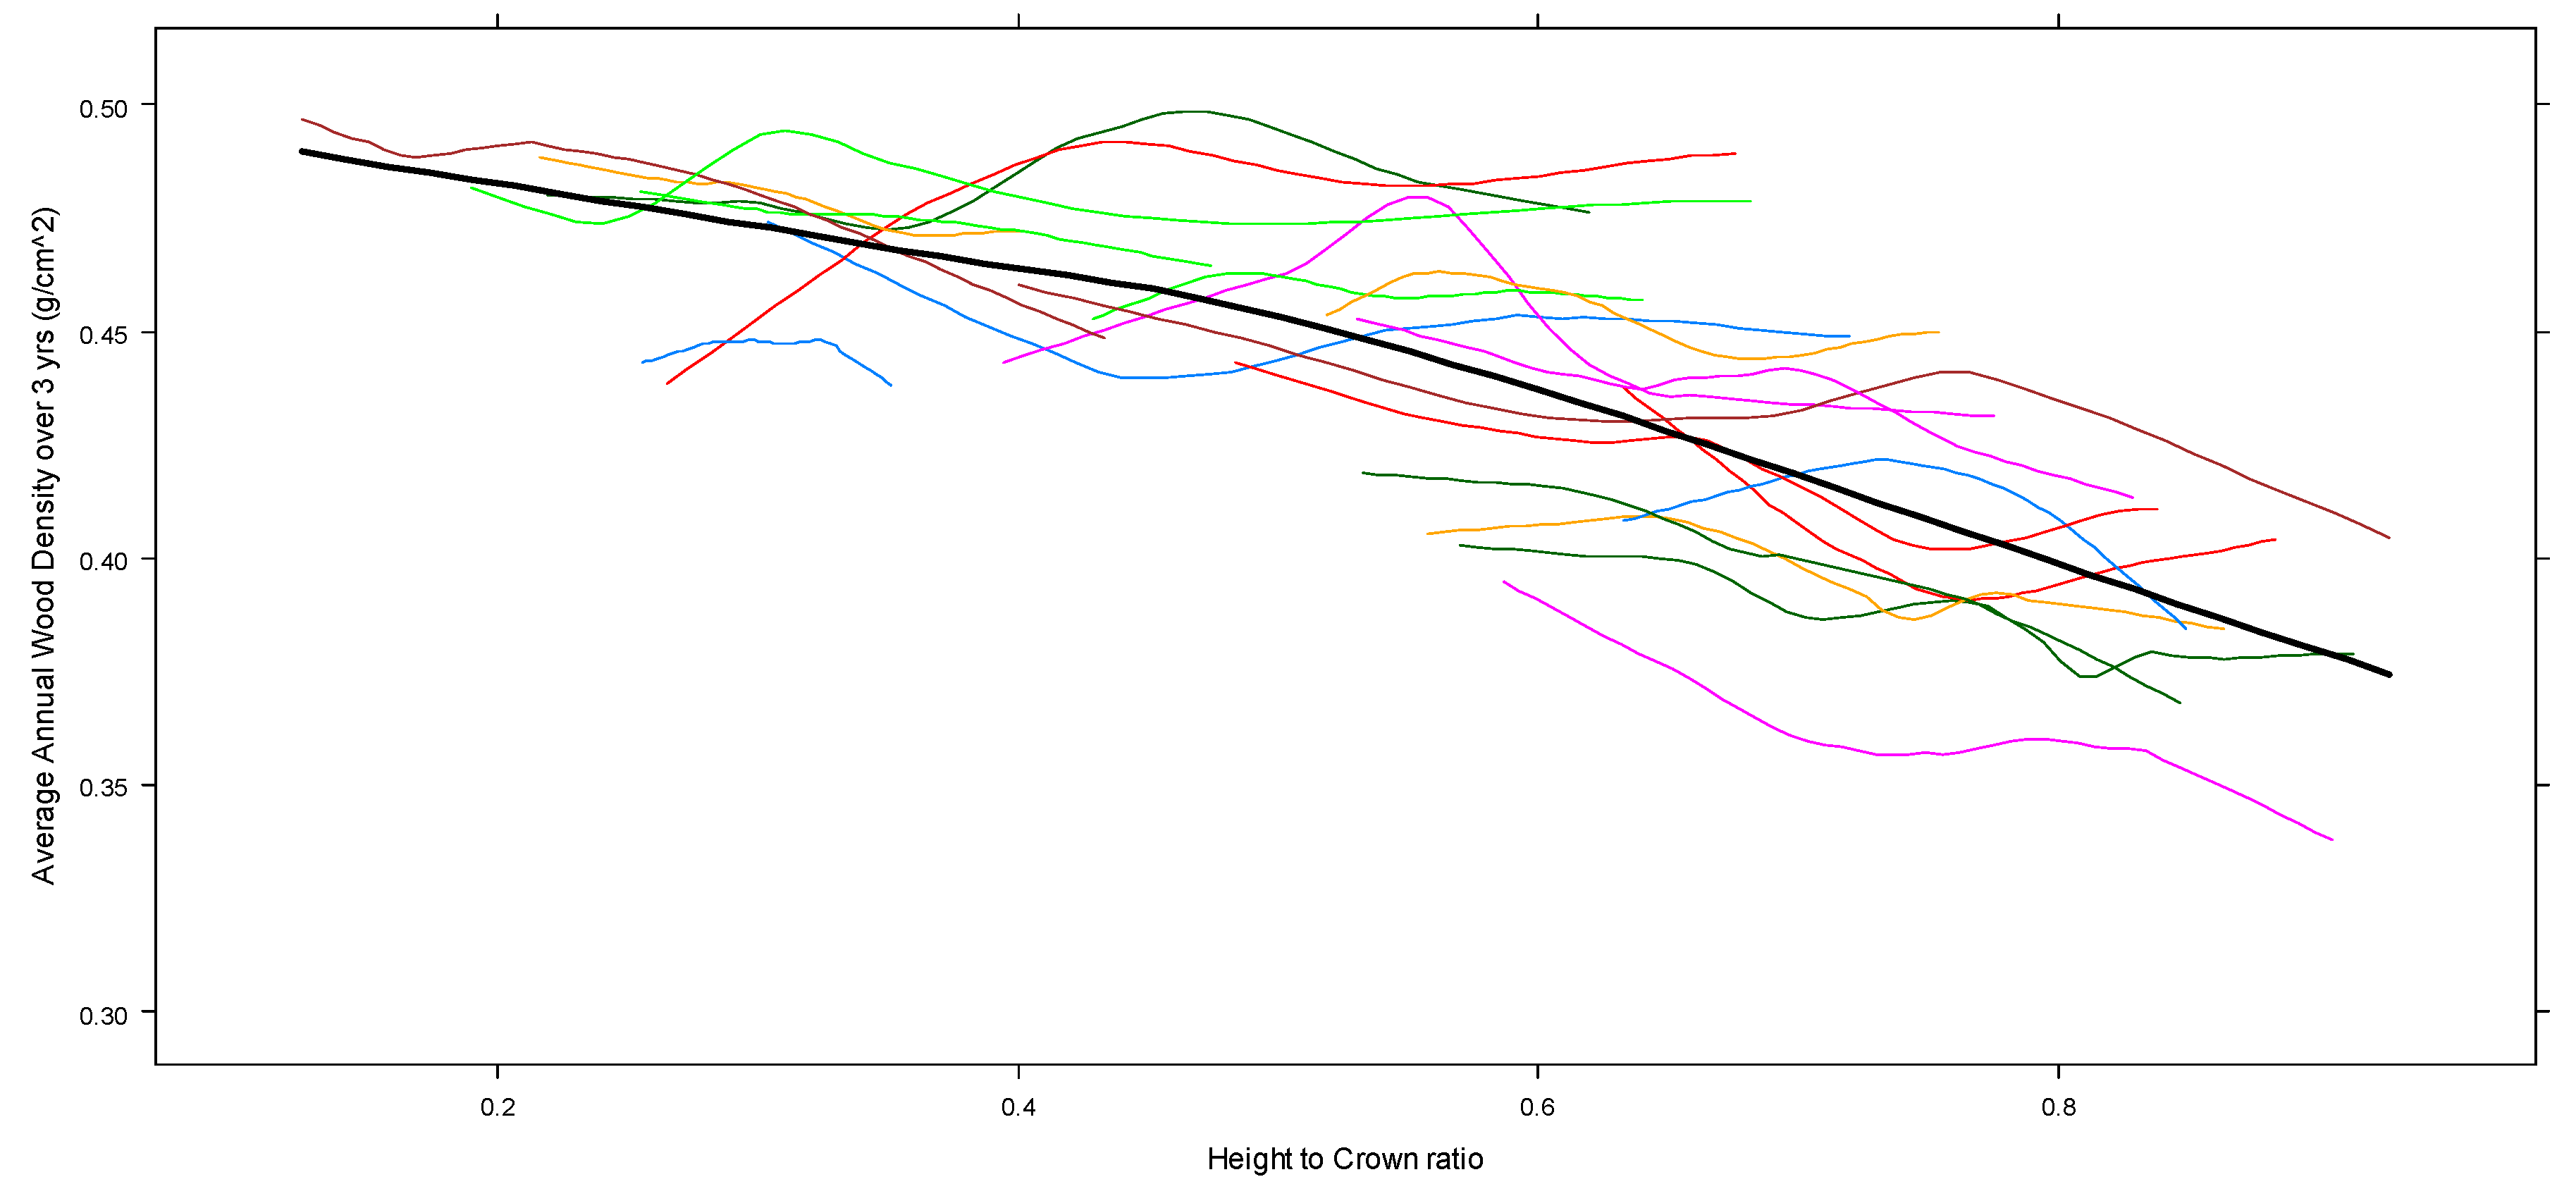
The adjusted R-square values of the final model were: 34% for the fixed effect model (i.e., au1 = 0), and 38% for the mixed effect model with treatment as the random effect (RMSE = 10.3%) (Table 5 and Figure 4). The coefficient values of Equation (2) indicated that wood density: (1) decreased as LCR (a1 = −0.0661430) (Figure 5) and slenderness (a2 = −0.0978845) of the subject tree increased; and, (2) increased as the climate variable DD >18 (a3 = 0.0004606) increased (Table 5).
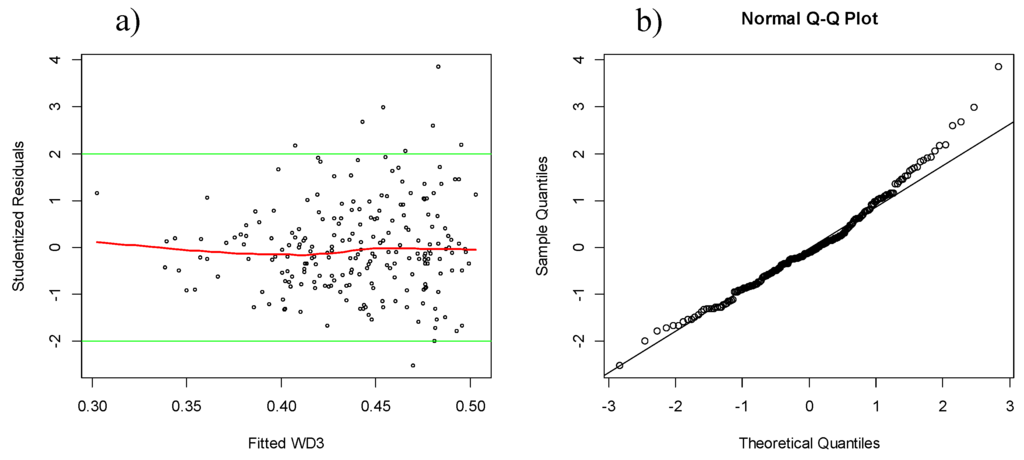
Figure 4.
Plots representing the goodness-of-fit for Equation (2): (a) scatter plots of studentized residuals against predicted together with the fitted Lowess line and (b) normal Q-Q plot.

Figure 5.
Predicted values of average annual three-year wood density Equation (2) by treatment (thin lines) in relation to LCR of the subject tree. The thicker black line represents the fitted values at the study level (i.e., fixed effects).
The overall predictive ability of the model improved (i.e., lower AIC) as the annual average of wood density was calculated over increasingly longer periods of time (i.e., five, ten, and 20 years) (Table 6). Live crown ratio and the climate variable DD >18 were not significantly different from zero for the five and ten-year time periods, respectively. However, the predictive ability of the model decreased (i.e., lower adjusted R-square) when annual wood density over the 5–10 and 10–20 year periods (prior to sampling) were tested.
Table 6.
Average annual wood density, parameter estimates reported with standard error and goodness-of-fit for Equation (2) using time periods of 3, 5, 10, and 20 years. AIC and the adjusted R-square values for the fixed effects and treatment-level mixed effects versions are included for comparison.
3.3. Microfibril Angle (MFA)
The results for average annual MFA over three years indicated that the model improved (lower AIC and higher adjusted R-square) when more variables were added to the model up to a total of three variables (Table 7). The final model Equation (3) included: live crown ratio of the subject tree, average height of the competitors, and the climate variable PAS (i.e., precipitation as snow).
where Yijz, average annual MFA over three years (°C/year) of tree z, in treatment j, in site i; LCRjz, Live crown ratio of the subject tree; HtCAvjz, Average Height of the Competitors of the subject tree; PASi, Precipitation as Snow of each site; an (n = 0, 1, 2, and 3) are the fixed effects parameters; au1 is the random effect (normally distributed with mean zero and an unknown variance component) relative to LCRjz for tree z; in treatment j, the εijz term represents the unexplained error.
Yijz = a0 + (a1 + au1) × LCRjz + a2 × HtCAv2jz + a3 × PASi + εijz
Table 7.
Average annual microfibril angle (MFA) over three years: parameter estimates reported with standard error and goodness-of-fit for Equation (3). AIC and adjusted R-square values for the fixed effects and treatment-level mixed effects models are included for comparison.
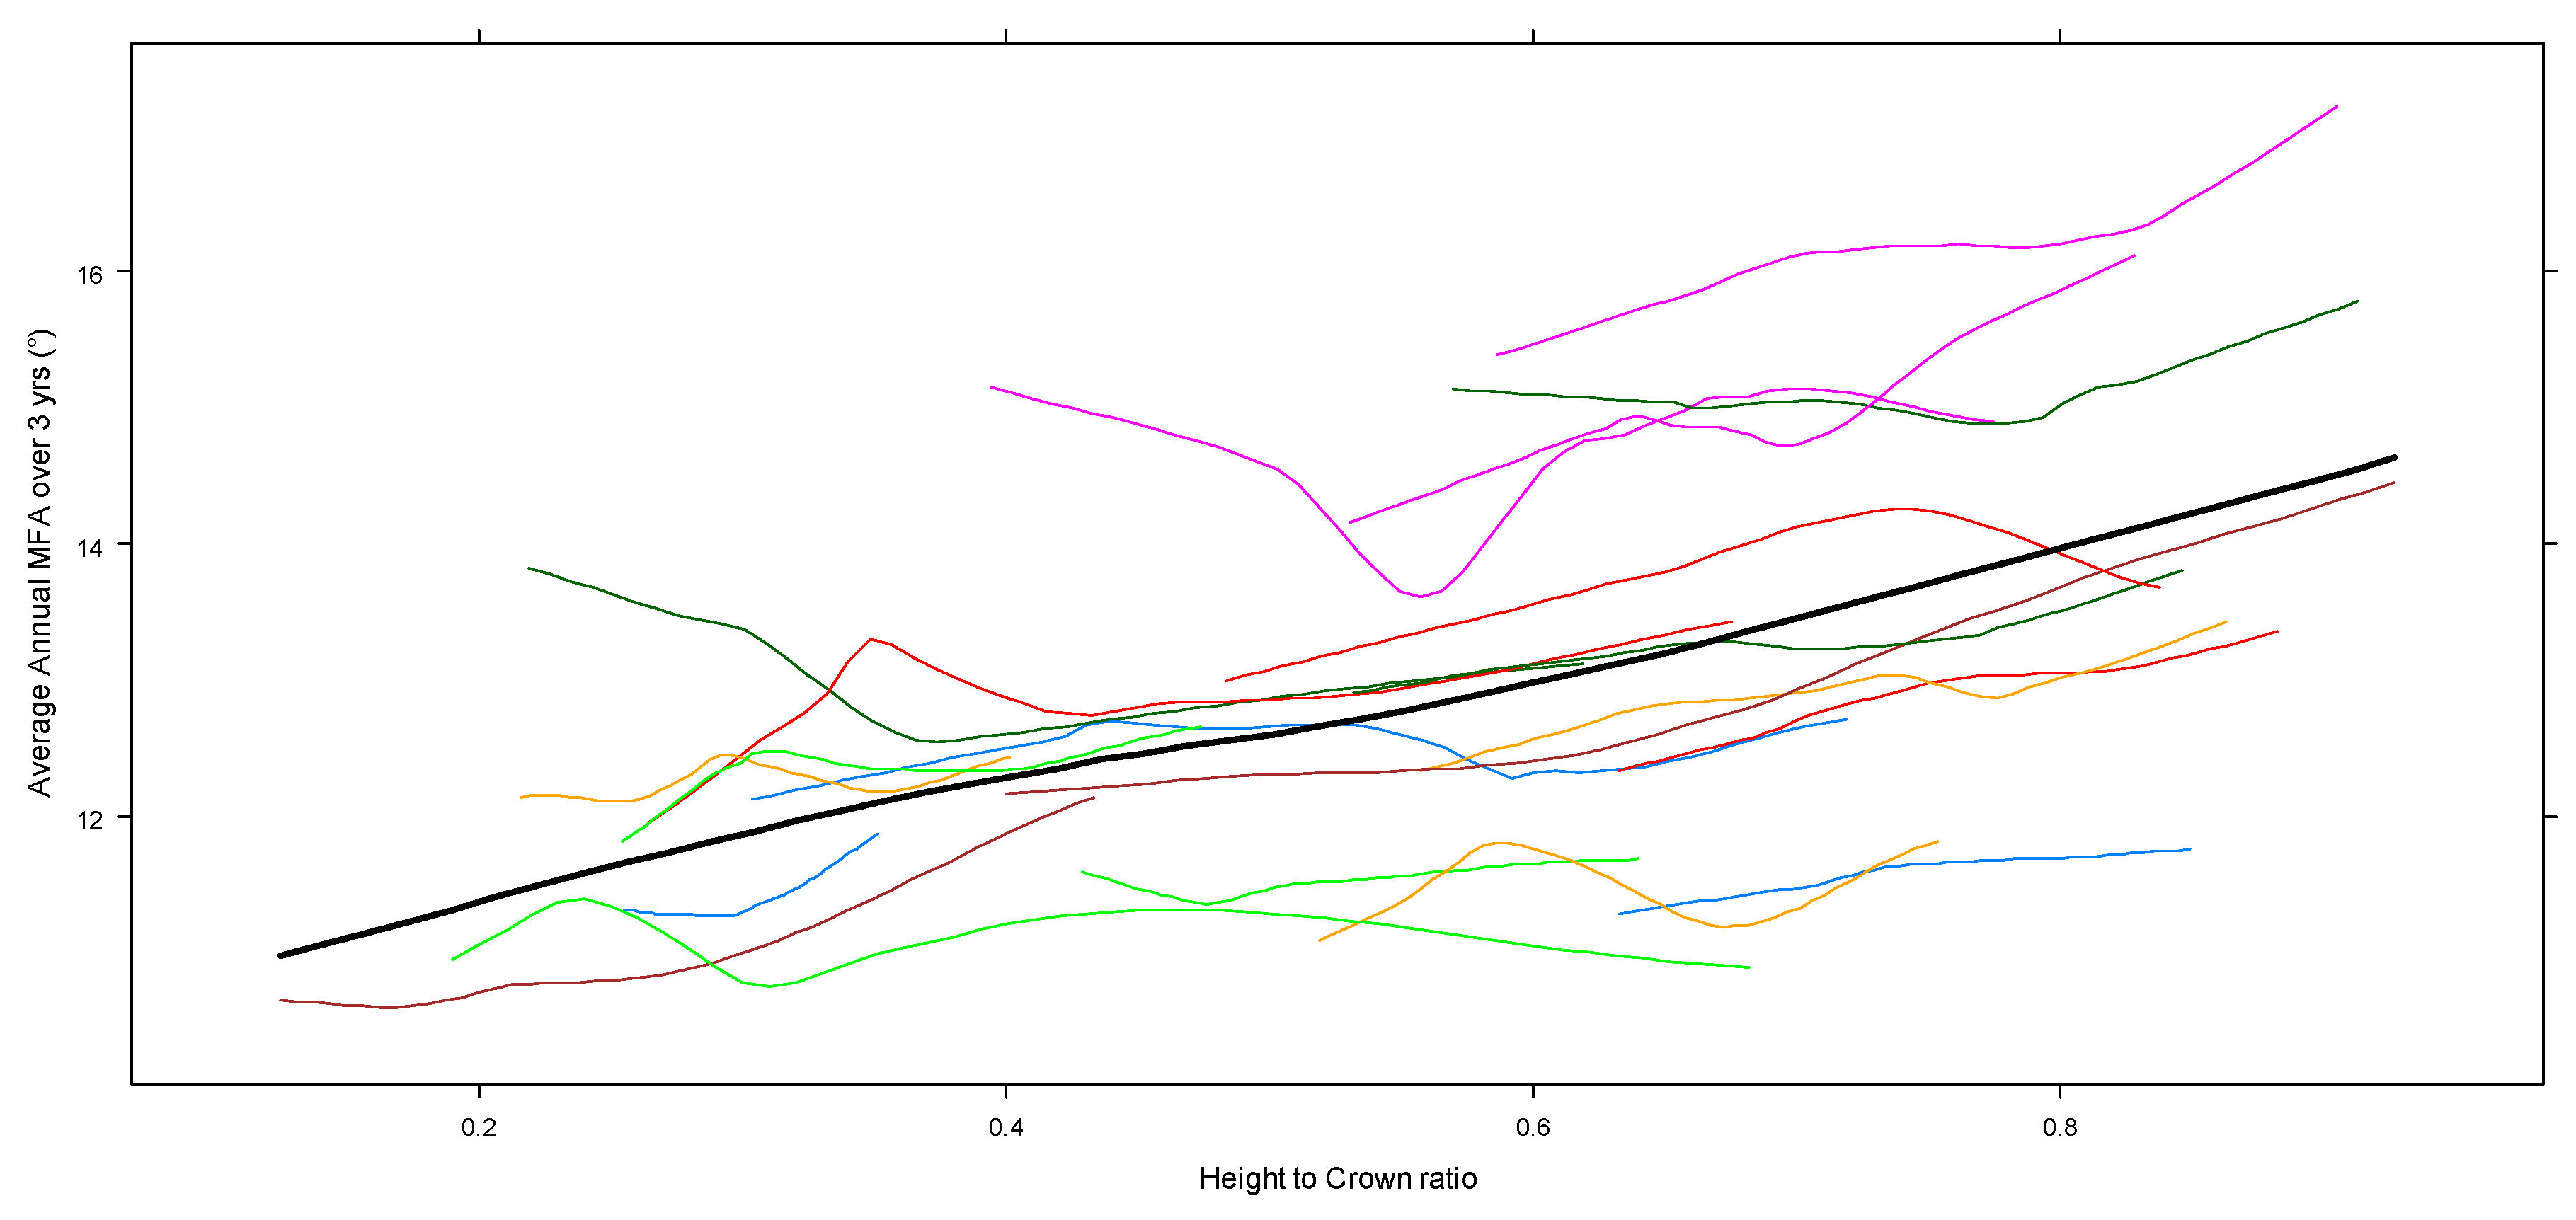
The adjusted R-square values of the final model were: 10% for the fixed effect model (i.e., au1 = 0), and 11% for the mixed effect model with treatment as the random effect (RMSE = 7.6%) (Table 7). The plots representing the goodness-of-fit suggested that the residuals for the base model of MFA are relatively skewed (Figure 6). The coefficient values of Equation (3) indicated that MFA increased as LCR (a1 = 3.925477) of the subject tree increased (Figure 7), decreased as the average height of the competitors increased (a2 = −0.004247), and decreased as the climate variable PAS (precipitation as snow) (a3 = −0.059424) increased (Table 7).
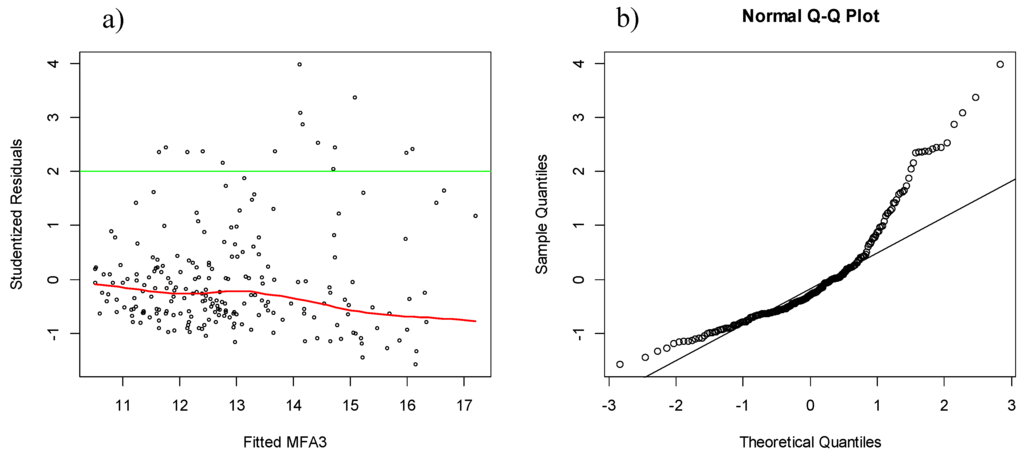
Figure 6.
Plots representing the goodness-of-fit for Equation (3): (a) scatter plots of studentized residuals against predicted together with the fitted Lowess line and (b) normal Q-Q plot.
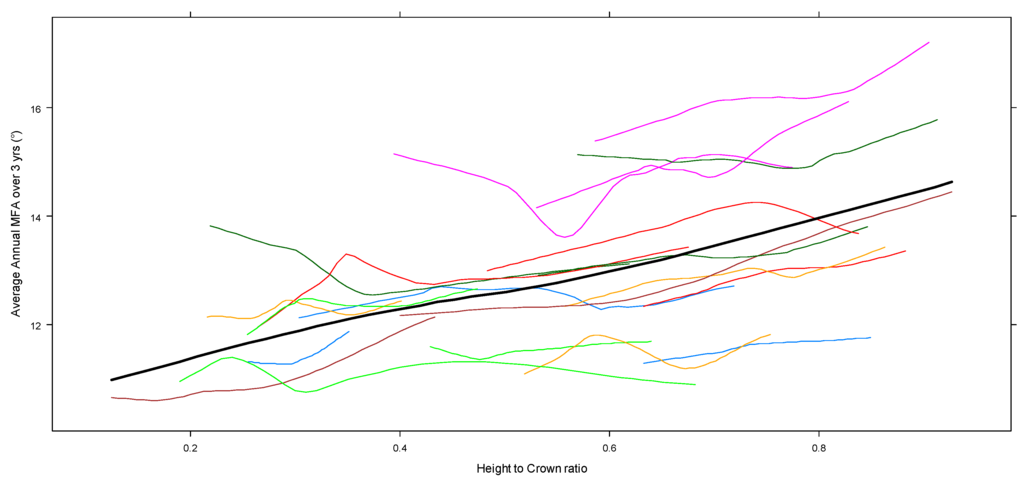
Figure 7.
Predicted values of average annual three-year MFA Equation (3) by treatment (thin lines) in relation to LCR of the subject tree. The thicker black line represents the fitted values at the study level (i.e., fixed effects).
The overall predictive ability of the model improved (i.e., lower AIC) as the annual average of MFA was calculated over increasingly longer periods of time (i.e., 5, 10, and 20 years) (Table 8). The adjusted R-square values for fixed and mixed effect models suggested that, for the time periods longer than three years, the random effect represented by treatment did not improve the overall predictive ability of the model. However, the predictive ability of the model decreased (i.e., higher AIC) when annual MFA over the 5–10 and 10–20 year periods (prior to sampling) were tested.
Table 8.
Average annual MFA, parameter estimates reported with standard error and goodness-of-fit for Equation (3) using time periods of three, five, ten and 20 years. AIC and the adjusted R-square values for the fixed effects and treatment-level mixed effects versions are included for comparison.
3.4. Modulus of Elasticity (MOE)
The results for average annual MOE over three years indicated that the model improved (lower AIC and higher adjusted R-square) when more variables were added to the model up to a total of four variables (Table 9). The final model Equation (4) included: live crown ratio; height to diameter ratio of the subject tree; average height of the competitors; and, the climate variable AHM.
where Yijz, average annual MOE over three years (GPa/year) of tree z, in treatment j; in site i, LCRjz, live crown ratio of the subject tree; HDjz, Height to Diameter ratio of the subject tree; HtCAvjz, average height of the competitors; AHMi, Annual Heat-Moisture index of each site; an (n = 0, 1, 2, 3, and 4) are the fixed effects parameters; au1 is the random effect (normally distributed with mean zero and an unknown variance component) relative to LCRjz for tree z, in treatment j; the εijz term represents the unexplained error.
Yijz = a0 + (a1 + au1) × LCRjz + a2 × HDjz + a3 × HtCAv2jz + a4 × AHMi + εijz,
Table 9.
Average annual modulus of elasticity (MOE) over three years: parameter estimates reported with standard error and goodness-of-fit for Equation (4). AIC and adjusted R-square values for the fixed effects and treatment-level mixed effects models are included for comparison.
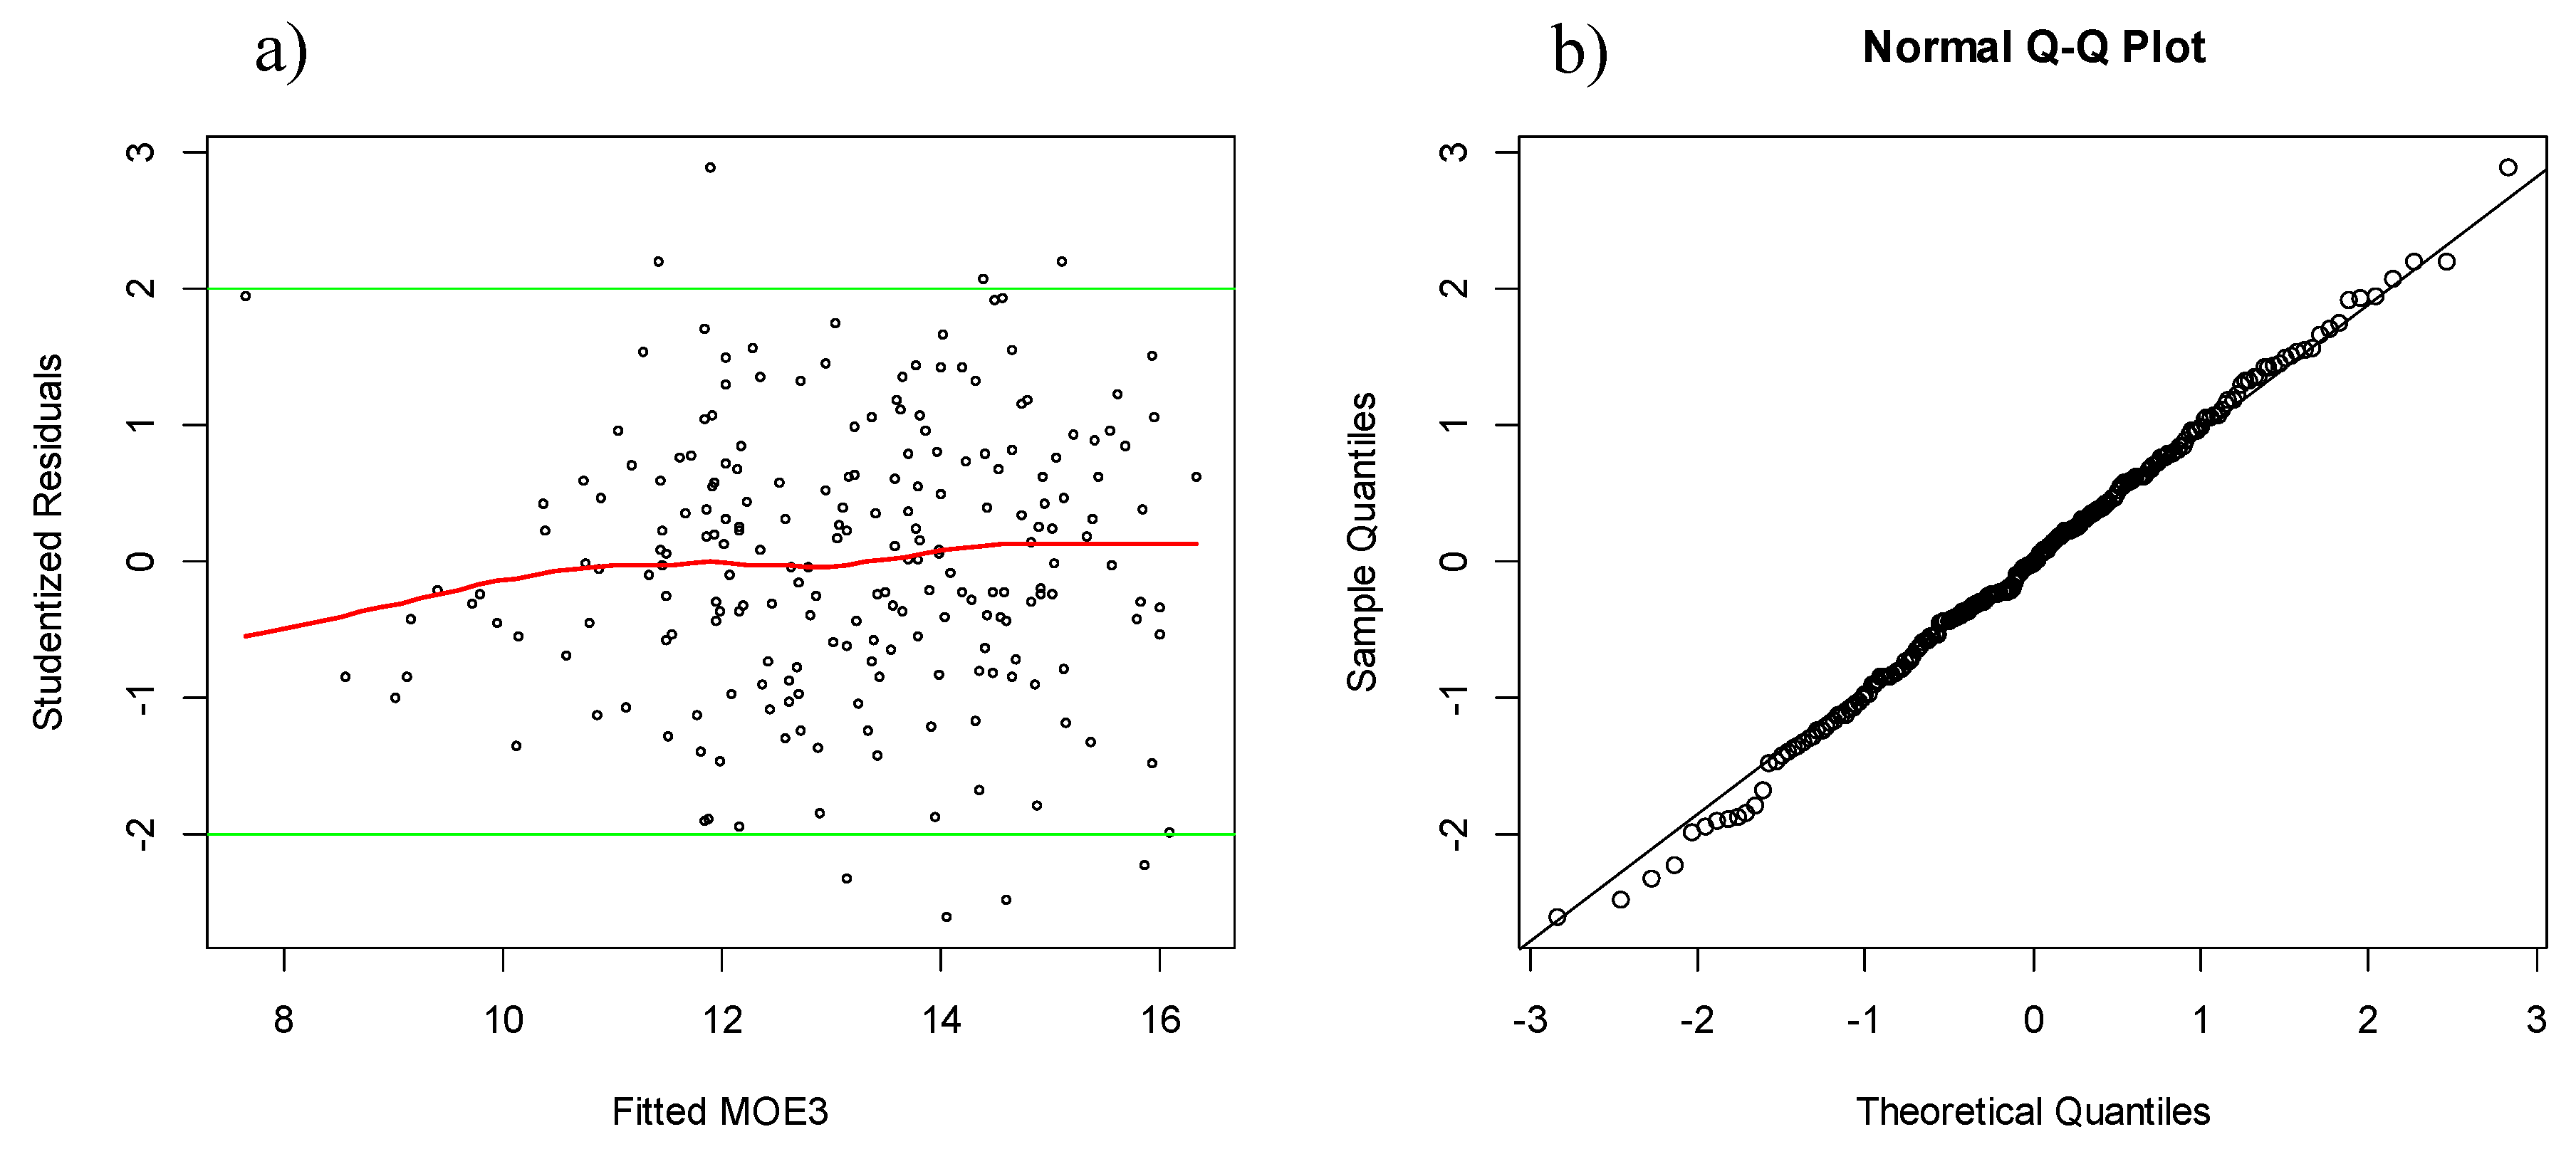
The adjusted R-square values of the final model were: 35% for the fixed effect model (i.e., au1 = 0), and 36% for the mixed effect model with treatment as the random effect (RMSE = 7.5%) (Table 9 and Figure 8). The coefficient values of Equation (4) indicated that three-year radial area increment: 1—decreased as LCR (a1 = −3.633662) (Figure 9) and HD (a2 = −3.162503) of the subject tree increased, 2—increased as the average height of the competitors increased (a3 = 0.003660), and 3—decreased as the climate variable AHM (Annual Heat-Moisture index) (a4 = −0.419140) increased (Table 9).
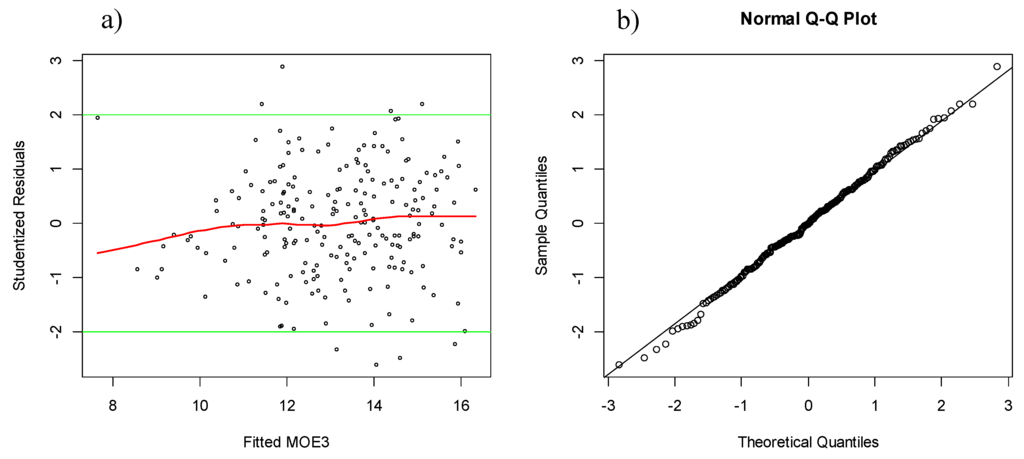
Figure 8.
Plots representing the goodness-of-fit for Equation (4) 1—scatter plots of studentized residuals against predicted together with the fitted Lowess line, and 2—Normal Q-Q plot.

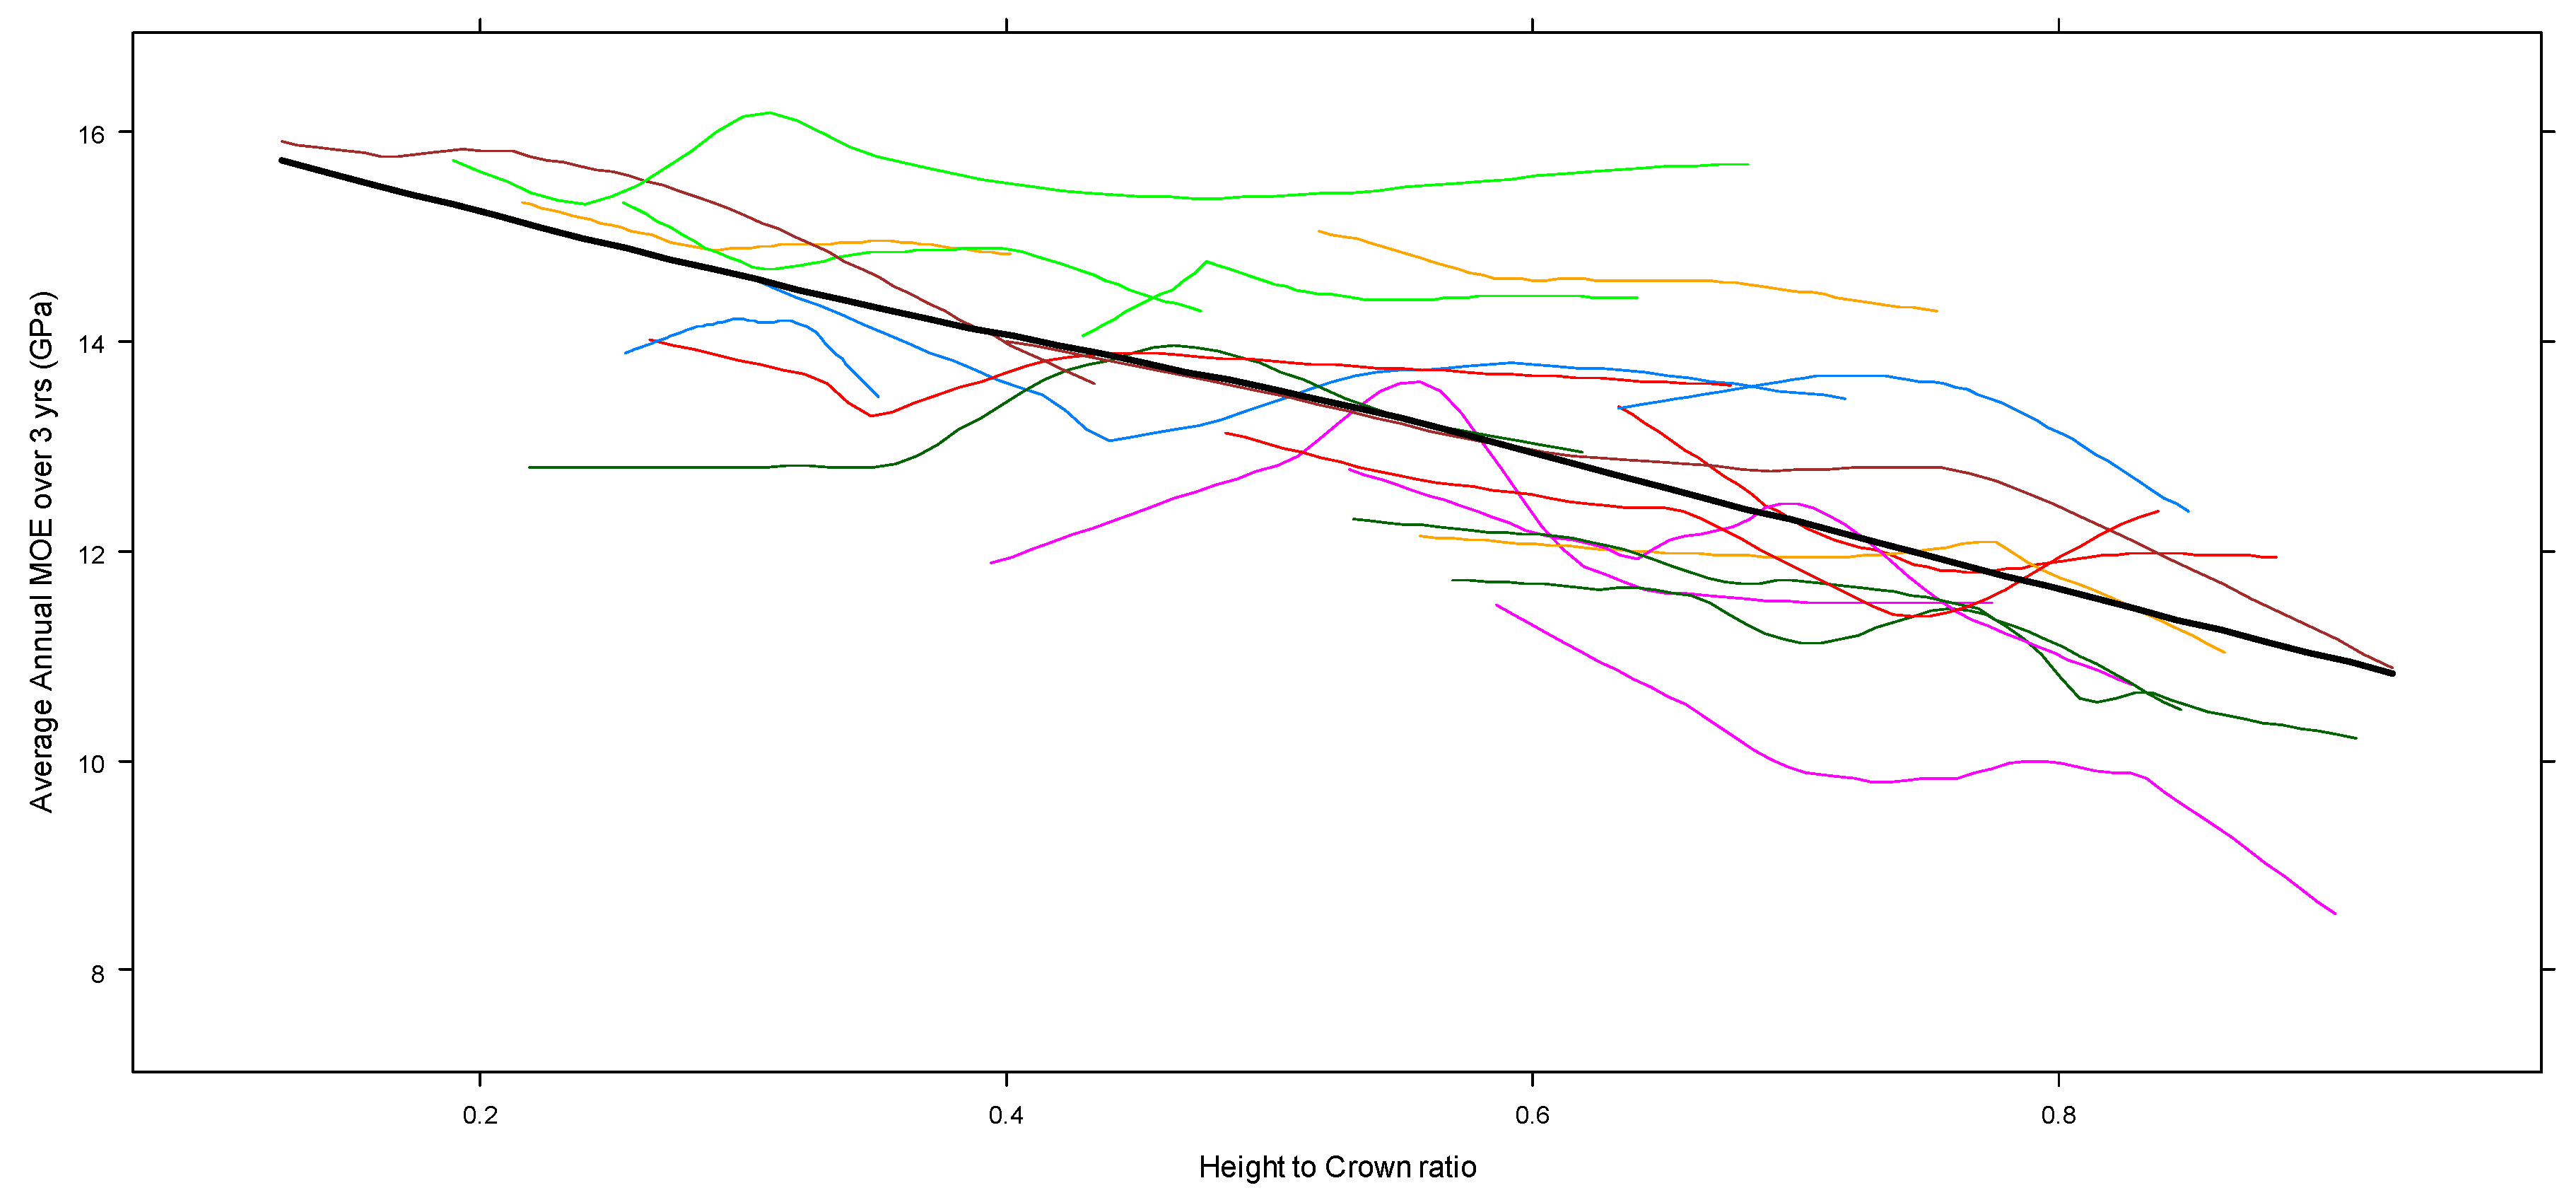
Figure 9.
Predicted values of average annual three-year MOE Equation (4) by treatment (thin lines) in relation to LCR of the subject tree. The thicker black line represents the fitted values at the study level (i.e., fixed effects).
The overall predictive ability of the model improved (i.e., lower AIC) as the annual average of MOE was calculated over increasingly longer periods of time (i.e., five, ten, and 20 years) (Table 10). The adjusted R-square values for fixed and mixed effect models suggests that for the five and ten-year time periods the random effect represented by treatment does not improve the overall predictive ability of the model. Moreover, the climate variable AHM was not significant for the MOE annual average over the ten-year period. However, the predictive ability of the model decreased (i.e., higher AIC) when annual MOE over the 5–10 and 10–20 year periods (prior to sampling) were tested.
Table 10.
Average annual MOE, parameter estimates reported with standard error and goodness-of-fit for Equation (4) using time periods of 3, 5, 10, and 20 years. AIC and the adjusted R-square values for the fixed effects and treatment-level mixed effects versions are included for comparison.
4. Discussion
This study indicated that live crown ratio (the ratio of crown length to tree height) was overall the best predictor of radial area growth and wood properties of white spruce. [14] also found a strong relationship between ring area and crown length when investigating Pressler’s law. Likewise, several recent studies have indicated that wood density and other wood properties are strongly related to crown architecture [6,18,19]. Reference [20] also found that wood density of Pinus resinosa decreased as the live crown ratio increased. This study confirms that the predictive ability of radial growth and wood and fibre attribute models greatly benefit when information on crown characteristics is taken into account [21,22].
This study also confirmed that, for the genus Picea, ring width is often negatively correlated with wood density [23], as indicated by the decrease in wood density as radial area increased for trees with proportionally longer crowns. Moreover, height to diameter ratio had a significant effect on wood density and MOE, as other recent studies suggest, with tree slenderness reflecting the mechanical stability requirement of the tree [24,25].
Competition (i.e., average height of the competitors within the plot) significantly affected radial annual increment (i.e., negative effect), MFA (i.e., negative effect) and MOE (i.e., positive effect). Many studies have indicated that white spruce growth is reduced by competition in mixed boreal forests [26], and wood characteristics are similarly affected by competition levels [27]. The annual heat-moisture index was the more reoccurring climate variable among the candidates selected, which confirmed that both temperature and precipitation play an important role in white spruce development [28,29,30]. The annual heat-moisture index had a positive effect on radial annual increment but a negative effect on MOE, which indicated that a warmer and relatively drier climate enhances growth but reduces wood stiffness.
The models consistently improved when using annual averages calculated over longer periods of time, which indicated that current tree and stand attributes could explain a significant portion of the variability related to past radial growth and wood properties up to 20 years prior to sampling. This outcome is likely related to the relatively low between-ring variability for the most current increments [31]. However, when the annual averages where calculated using time periods of 5–10 and 10–20 years prior to sampling the predictive ability of the models decreased, which indicated that the current tree and stand conditions (i.e., up to five years prior to sampling) were the best predictors of radial growth and wood properties, and should be preferred over longer period of times. Moreover, at five out of the eight study sites investigated the treatment was applied less than 20 years prior to sampling and, therefore, the current tree and stand conditions do not reflect pre-treatment conditions.
This study suggests that forest management treatments that aim at maximizing growth should allow for relatively longer crowns (e.g., thinning), while crown lift should be facilitated if higher wood quality is the only management goal (e.g., higher stand density, pruning). Crown length equal to 2/3 of the tree height might represent an optimal balance between radial growth and wood quality.
Acknowledgments
Special thanks go to Laura Chittick (Natural Resources Canada, Canadian Wood Fibre Centre) and to FPInnovations (Vancouver) for supplying the data. The map presented in this manuscript was created by Mr. Gurp Thandi (Natural Resources Canada, Canadian Forest Service). Funding of this research was provided by the Canadian Wood Fibre Centre (Natural Resources Canada).
Author Contributions
Francesco Cortini led the statistical analysis and drafted the manuscript. Dan MacIsaac and Philip Comeau provided substantial input planning the study and drafting the manuscript. Dan MacIsaac funded the tree analysis and provided supervision in providing the data.
Conflicts of Interest
The authors declare no conflict of interest.
References
- Cave, I.D.; Walker, J.C.F. Stiffness of wood in fast-grown plantation softwoods: The influence of microfibril angle. For Prod. J. 1994, 44, 43–48. [Google Scholar]
- Duchesne, I.; Wilhelmsson, L.; Spångberg, K. Effects of in-forest sorting of Norway spruce (Picea abies) and Scots pine (Pinus sylvestris) on wood and fibre properties. Can. J. For. Res. 1997, 27, 790–795. [Google Scholar] [CrossRef]
- Reiterer, A.; Lichtenegger, H.; Tschegg, S.E.; Fratzl, P. Experimental evidence for a mechanical function of the cellulose spiral angle in wood cell walls. Philos. Mag. A 1999, 79, 2173–2186. [Google Scholar] [CrossRef]
- Mackenzie, J.; Bruemmer, G. Enhancing Canada’s forest fibre. For. Chron. 2009, 85, 353–354. [Google Scholar] [CrossRef]
- Man, R.; Lieffers, V.J. Effects of shelterwood and site preparation on microclimate and establishment of white spruce seedlings in a boreal mixedwood forest. Can. J. For. Res. 1999, 75, 837–844. [Google Scholar] [CrossRef]
- Groot, A.; Cortini, F.; Wulder, M.A. Crown-fibre attribute relationships for enhanced forest inventory: Progress and prospects. For. Chron. 2015, 91, 266–279. [Google Scholar] [CrossRef]
- Pokharel, B.; Dech, J.P.; Groot, A.; Pitt, D. Ecosite-based predictive modeling of black spruce (Picea mariana) wood quality attributes in boreal Ontario. Can. J. For. Res. 2014, 44, 465–475. [Google Scholar] [CrossRef]
- Franceschini, T.; Longuetaud, F.; Bontemps, J.-D.; Bouriaud, O.; Caritey, B.-D.; Leban, J.-M. Effect of ring width, cambial age, and climatic variables on the within-ring wood density profile of Norway spruce Picea abies (L.) Karst. Trees 2013, 27, 913–925. [Google Scholar] [CrossRef]
- Raymond, C.A.; Joe, B. Patterns of basic density variation for Pinus radiata grown in South-west slopes region of New South Wales, Australia. N. Z. J. For. Sci. 2007, 37, 81–95. [Google Scholar]
- Filipescu, C.N.; Comeau, P.G. Aspen competition affects light and white spruce growth across several boreal sites in western Canada. Can. J. For. Res. 2007, 41, 1701–1713. [Google Scholar] [CrossRef]
- Cortini, F.; Comeau, P.G.; Boateng, J.O.; Bedford, L.; McClarnon, J.; Powelson, A. Effects of climate on growth of lodgepole pine and white spruce following site preparation and its implications in a changing climate. Can. J. For. Res. 2011, 41, 180–194. [Google Scholar] [CrossRef]
- Wang, T.; Hamann, A.; Spittlehouse, D.L.; Murdock, T.Q. ClimateWNA—High-resolution spatial climate data for western North America. J. Appl. Meteorol. Climatol. 2012, 51, 16–29. [Google Scholar] [CrossRef]
- Evans, R.; Stuart, S.A.; van der Touw, J. Microfibril angle scanning of increment cores by X-ray difractometry. Appita J. 1996, 49, 411–414. [Google Scholar]
- Cortini, F.; Groot, A.; Filipescu, C. Models of the longitudinal distribution of ring area as a function of tree and stand attributes for four major Canadian conifers. Ann. For. Sci. 2013, 70, 637–648. [Google Scholar] [CrossRef]
- Akaike, H. A new look at the statistical model identification. IEEE Trans. Autom. Control 1974, 19, 716–723. [Google Scholar] [CrossRef]
- Furnival, G.M.; Wilson, R.W. Regression by leaps and bounds. Technometrics 1974, 16, 499–511. [Google Scholar] [CrossRef]
- R Development Core Team. R: A Language and Environment for Statistical Computing. R Foundation for Statistical Computing: Vienna, Austria, 2010. Available online: http://www.R-project.org (accessed on 22 February 2016).
- Lei, Y.C.; Zhang, S.Y.; Jiang, Z. Models for predicting lumber bending MOR and MOE based on tree and stand characteristics in black spruce. Wood Sci. Technol. 2005, 39, 37–47. [Google Scholar] [CrossRef]
- Roth, B.E.; Li, X.; Huber, D.A.; Peter, G.F. Effects of management intensity, genetics and planting density on wood stiffness in a plantation of juvenile loblolly pine in the southeastern USA. For. Ecol. Manag. 2007, 246, 155–162. [Google Scholar] [CrossRef]
- Larocque, G.R.; Marshall, P.L. Wood relative density development in red pine (Pinus resionsa Ait.) as affected by different initial spacings. For. Sci. 1995, 41, 709–728. [Google Scholar]
- Lindström, H. Basic density in Norway spruce. Part I. A literature review. Wood Fiber Sci. 1996, 28, 15–27. [Google Scholar]
- Lindström, H. Basic density in Norway spruce. Part II. Predicted by stem taper, mean growth ring width, and factors related to crown development. Wood Fiber Sci. 1996, 28, 240–251. [Google Scholar]
- Saranpää, P. Wood density and growth. In Wood Quality and its Biological Basis; Barnett, J.R., Jeronimidis, G., Eds.; Blackwell Publishing & CRC Press: Boca Raton, FL, USA, 2003; pp. 87–117. [Google Scholar]
- Kijidani, Y.; Hamazuna, T.; Ito, S.; Kitahara, R.; Fukuchi, S.; Mizoue, N.; Yoshida, S. Effect of height-to-diameter ratio on stem stiffness of sugi (Cryptomeria japonica) cultivars. J Wood Sci. 2010, 56, 1–6. [Google Scholar] [CrossRef]
- Sattler, D.F.; Comeau, P.G.; Achim, A. Within-tree patterns of wood stiffness for white spruce (Picea glauca) and trembling aspen (Populus tremuloides). Can. J. For. Res. 2014, 44, 162–171. [Google Scholar] [CrossRef]
- Huang, J.-G.; Stadt, K.J.; Dawson, A.; Comeau, P.G. Modelling growth-competition relationships in trembling aspen and white spruce mixed boreal forests of western Canada. PLoS ONE 2013, 8, e77607. [Google Scholar]
- Warren, E.; Smith, R.G.B.; Apiolaza, L.A.; Walker, J.C.F. Effect of stocking on juvenile wood stiffness for three Eucalyptus species. New For. 2009, 37, 241–250. [Google Scholar] [CrossRef]
- Cherry, M.; Parker, W.H. Utilization of Genetically Improved Stock to Increase Carbon Sequestration; Ontario Forest Research Institute: Sault Ste. Marie, ON, Canada, 2003. [Google Scholar]
- Barber, V.A.; Juday, G.P.; Finner, B.P. Reduced growth of Alaskan white spruce in the twentieth century from temperature-induced drought stress. Nature 2000, 405, 668–673. [Google Scholar] [CrossRef] [PubMed]
- Thomson, A.M.; Crowne, K.A.; Parker, W.H. Optimal white spruce breeding zones for Ontario under current and future climates. Can. J. For. Res. 2010, 40, 1576–1587. [Google Scholar] [CrossRef]
- Cortini, F.; Groot, A.; Tong, Q.; Duchesne, I. Ring-level models for predicting wood and fibre properties of Abies balsamea. Wood Sci. Technol. 2014, 48, 1181–1196. [Google Scholar] [CrossRef]


© 2016 by the authors; licensee MDPI, Basel, Switzerland. This article is an open access article distributed under the terms and conditions of the Creative Commons by Attribution (CC-BY) license (http://creativecommons.org/licenses/by/4.0/).