Abstract
The shrubland ecosystems in arid areas are highly sensitive to global climate change and human activities. Accurate extraction of shrubs using computer vision techniques plays an essential role in monitoring ecological balance and desertification. However, shrub extraction from high-resolution GF-2 satellite images remains challenging due to their dense distribution and small size, along with complex background. Therefore, this study introduces a Feature Enhancement and Transformer Network (FETNet) by integrating the Feature Enhancement Module (FEM) and Transformer module (EdgeViT). Correspondently, they can strengthen both global and local features and enable accurate segmentation of small shrubs in complex backgrounds. The ablation experiments demonstrated that incorporation of FEM and EdgeViT can improve the overall segmentation accuracy, with 1.19% improvement of the Mean Intersection Over Union (MIOU). Comparison experiments show that FETNet outperforms the two leading models of FCN8s and SegNet, with the MIOU improvements of 7.2% and 0.96%, respectively. The spatial details of the extracted results indicated that FETNet is able to accurately extract dense, small shrubs while effectively suppressing interference from roads and building shadows in spatial details. The proposed FETNet enables precise shrub extraction in arid areas and can support ecological assessment and land management.
1. Introduction
Shrubs living in arid areas play a pivotal role in maintaining ecological balance and promoting ecosystem functioning []. As pioneer species in desertification control and ecological restoration, shrubs have significant links to water retention [], soil fertility [], and biodiversity []. It has been found that shrubs significantly reduce soil erosion and enhance water infiltration and retention through their root structure and canopy cover, thus improving soil quality. In addition, shrubs help mitigate the effects of extreme temperature changes on other plants and animals by moderating the local climate and providing shade []. However, climate fluctuations and frequent droughts have resulted in a decline in shrub cover in arid areas. This circumstance poses a significant risk to the health of arid region ecosystems and has detrimental effects on the diversity and survival of local species. In order to carry out desert and land desertification control projects better, necessary information extraction is required for desert areas or areas with more severe desertification []. Understanding the spatial distribution patterns of desert shrubs is essential for the scientific management of ecosystems in arid regions []. In particular, shrubland mapping provides valuable baseline data for tracking vegetation dynamics and detecting early signs of land degradation. This information is critical for monitoring the progression of desertification and for formulating adaptive land management and ecological protection strategies in arid and semi-arid regions.
Traditional arid region vegetation studies require regular and frequent ground surveys involving the collection of a large number of samples, which demand substantial resources []. Advancements in remote sensing technology have enabled various sensors to acquire a large volume of high-resolution multi-temporal image data []. In recent years, significant research efforts have been devoted to extracting vegetation information through remote sensing techniques. For example, satellites such as MODIS, Landsat 8, and Sentinel-2 are often used for large-scale ecological monitoring, land cover classification, and long-term monitoring of environmental changes [,,,]. However, due to constraints in spatial resolution, they still have some limitations in recognizing smaller and subtle vegetation features. In contrast, high-resolution satellites such as DigitalGlobe and the Gaofen series (GF) are able to provide more detailed surface information [], which allows even sparsely distributed and small vegetation features to be clearly recognized with high-resolution images [,]. The GF series satellites have sub-meter to meter spatial resolution, especially the GF-2 satellites, whose 0.8 m panchromatic resolution enables them to separate smaller shrubs and other vegetation features in complex backgrounds. Previous research has demonstrated that the GF-2 satellite is highly effective in extracting various types of vegetation [,]. Fine-scale vegetation extraction can be achieved across various scenarios based on GF-2 satellite images. For example, Wang et al. used GF-2 data for fine segmentation of urban vegetation []. Xue et al. estimated the vegetation cover in arid regions of northwest China to achieve precise monitoring of sparse vegetation in desert areas []. High-resolution satellites have opened new avenues for desert ecological research, allowing for the precise extraction of vegetation-related information in arid regions from remote sensing images.
At present, the approaches for extracting vegetation information in arid regions from images can be grouped by the spatial analysis unit into two categories: (1) pixel-based classification methods, which analyze individual pixels independently. These include threshold-based methods that use spectral indices such as the Normalized Difference Vegetation Index (NDVI) to distinguish vegetation [] as well as supervised classification methods employing machine learning algorithms or neural networks [,]. (2) Object-Based Image Analysis (OBIA) or neighborhood-based methods focus on image segments or regions and take into account spatial, shape, and contextual information []. Pixel-based techniques mainly classify each pixel in a remote sensing image by analyzing its spectral features to extract vegetation information [,,]. Complex backgrounds, such as bare ground and sand dunes, often result in disturbed and corrupted vegetation features in remote sensing images []. Pixel-based supervised learning methods are a class of techniques that extract features and perform classification using each pixel as the basic unit []. These methods are widely used in remote sensing images for land cover classification [], vegetation extraction [], and other tasks. However, a notable limitation of pixel-based approaches is their lack of spatial contextual awareness, which often leads to the so-called “salt and pepper phenomenon” []. Moreover, the pixel spatial resolution may not match the extent of the land cover feature of interest []. By comparison, the object-based image analysis approach utilizes more spatial, shape, and contextual information, thus improving classification accuracy []. However, models based on OBIA are not learnable models, meaning that OBIA cannot directly transfer or generalize the classification rules obtained from one image to another image []. In addition, this method is highly sensitive to image segmentation parameters (such as scale, shape factor, and compactness). Even slight changes in segmentation settings can lead to inaccurate object boundaries, which in turn affect classification performance and stability [].
In recent years, deep learning-based segmentation of remote sensing imagery has advanced significantly, driven by advancements in computer vision [,]. Deep learning has a powerful ability to automatically learn complex feature representations from massive datasets, including spectrum, texture, shape, and context []. It is currently being used to address a range of problems, such as image classification [] and semantic segmentation []. According to research, Fully Convolutional Networks (FCNs) improve target feature extraction accuracy with the aid of their strong end-to-end feature representation and pixel-level segmentation capabilities []. A variety of FCN-based models have been developed for semantic segmentation tasks, including SegNet [], DeepLabv3+ [], FCN16s [], and ESPNetv2 []. These models have demonstrated certain effectiveness in semantic segmentation tasks, such as urban green space extraction and desertification and semi-desertification tree extraction, which have been more researched [,,]. However, studies focused on the extraction of shrubs in arid areas are still relatively scarce. Unlike large and well-defined objects, shrubs in arid regions often appear as small, irregular, and low-contrast features in high-resolution remote sensing imagery, making them difficult to identify. According to the SPIE organization (International Society for Optics and Photonics), objects with a pixel-to-total-image-pixel ratio of less than 0.12% are typically classified as small objects. Additionally, small objects can be defined based on the aspect ratio of the object’s bounding box relative to the image’s width and height. Typically, objects with an aspect ratio of less than 0.1 are categorized as small objects []. The unique characteristics of small objects, such as low resolution, feature ambiguity, low contrast, and limited information, hinder the model’s capacity to learn sufficient contextual information for accurate segmentation, leading to a rapid decline in performance []. Shrub sizes in arid areas are frequently much smaller than the above standard in most cases, and their irregular shapes, low contrast, and similar spectral properties to the background pose significant challenges for accurate extraction.
Therefore, this paper focuses on small shrub targets in arid or semi-arid regions and constructs a shrub labeled dataset (Shrubland) based on high-resolution remote sensing imagery (GF-2). Building on this dataset, a deep learning method, the Feature Enhancement and Transformer Network (FETNet), is developed. This method captures the spatial distribution characteristics of shrubs at multiple scales, focusing on the dense areas of shrubs with more significant features while effectively improving the extraction accuracy of small target shrubs with dense and weak feature signals, thus realizing efficient information fusion and feature enhancement. This study aims to provide data and methodological support for quantitatively analyzing shrub vegetation in ecologically sensitive areas, such as arid or semi-arid regions, and offer a scientific basis for formulating effective ecological protection measures and sustainable development management strategies.
2. Study Area and Dataset Construction
2.1. Study Area
The area located in the south-eastern part of the Kyzylkum Desert, near the northwestern edge of Aydar Kul Lake (65°57′ E to 65°58′ E longitude and 41°3′ N to 41°5′ N) (Figure 1b), covering an area of about 8 km2, was selected as the main study area for model training and validation. In addition, an independent test area was selected outside the training zone to further evaluate the model’s generalization ability in unseen regions (66°3′ E to 66°7′ E; 41°8′ N to 41°12′ N) (Figure 1c). Aydar Kul Lake is one of the most well-known lakes in Uzbekistan, and it serves as a geographic reference for the region. The Kyzylkum Desert is one of the largest deserts in Central Asia, spanning across Uzbekistan, Kazakhstan, and parts of Turkmenistan. It is characterized by vast sandy plains and sparse vegetation [], with xerophytic shrubs, which are sparsely distributed and exhibit complex spectral signatures, serving as the dominant vegetation type []. Shrub vegetation is also widely distributed in other arid desert regions such as the Gobi Desert, the Karakum Desert, and parts of the Middle East. The Kyzylkum Desert exhibits typical arid environmental characteristics, including extremely low annual precipitation (approximately 100–200 mm), large diurnal and seasonal temperature fluctuations, intense solar radiation, and heterogeneous soil conditions []. Furthermore, the ecological and climatic conditions of the Kyzylkum Desert closely resemble those of other major arid regions such as the Gobi Desert, the Karakum Desert, and parts of the Middle East. These similarities in vegetation structure, soil composition, and climatic regime make the Kyzylkum Desert a representative and ideal testbed for advancing shrub extraction research in arid environments.
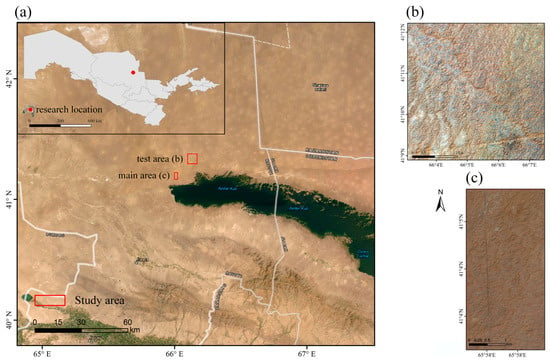
Figure 1.
Overview of the study area based on GF-2 satellite imagery. (a) Geographical location of the study region. (b) Independent test area. (c) Model training and validation area.
Shrubs in arid regions typically exhibit distinctive morphological characteristics and distribution patterns. They are small in size and sparsely distributed, but shrubs show denser distribution characteristics in certain areas, increasing the complexity of extraction and identification. Figure 2 shows a localized area from high-resolution remote sensing imagery (GF-2), clearly illustrating the morphology and distribution of these shrubs (online video: https://www.youtube.com/watch?v=Q7d5QL8xwOU&t=190s, accessed on 1 July 2024).
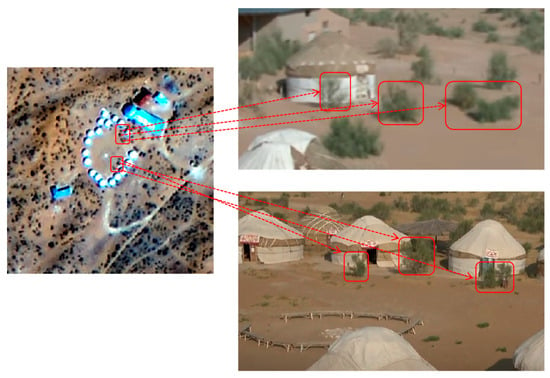
Figure 2.
Shrub characteristics.
2.2. Dataset Construction
High-resolution imagery (GF-2, 21 July 2022) served as the data source for extracting shrubs in this research. The data were obtained from the China Platform of Earth Observation System (https://www.cpeos.org.cn, accessed on 1 July 2024). The GF-2 PMS (Panchromatic Multispectral Sensor) provides a panchromatic band and four multispectral bands, including blue, green, red, and near-infrared, with spatial resolutions of 1 m and 4 m, respectively. The spatial resolution at the sub-satellite point reaches 0.8 m, with a revisit time of 5 days.
The imagery was preprocessed for atmospheric correction, ortho-rectification, image fusion, and cropping. Due to the open canopy structure of shrubs in arid regions and the high proportion of exposed bare soil and sand, near-infrared (NIR) reflectance is easily affected by background interference []. This weakens its ability to distinguish vegetation and may even introduce noise into the model []. Therefore, this study selected the red, green, and blue (RGB) bands as inputs for the shrub extraction task. After cropping the study area, manual labeling was performed at the pixel level and divided into two categories, as shown in Figure 3. The original and labeled images were segmented into 256 × 256 pixels using the image cropping technique to accommodate the limited computational resources, and datasets for training, validation, and testing were randomly divided in a 3:1:1 ratio, which ultimately resulted in the shrub image dataset Shrubland with the data type of TIFF file. No data augmentation was applied, and the final dataset consisted of 1709 training sets, 570 validation sets, and 570 test sets (https://doi.org/10.5281/zenodo.15767663, accessed on 29 June 2025).
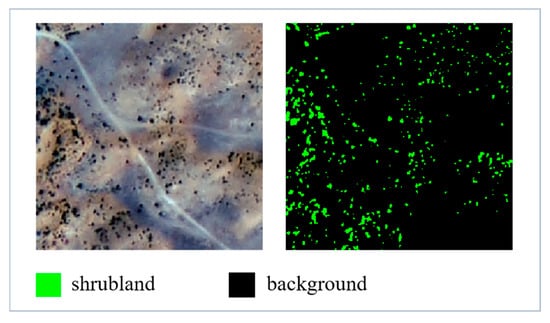
Figure 3.
Examples of Shrubland dataset.
3. Methodology
3.1. Network Infrastructure
Accurately capturing the detailed features in the image is essential in the task of semantic segmentation for shrub extraction. However, as the network depth increases, the loss of feature information becomes increasingly significant. Therefore, a Feature Enhancement and Transformer Network (FETNet) was proposed in this study, based on the encoder–decoder framework for extracting shrubs in arid areas. Figure 4 illustrates the overall structure of FETNet. The FETNet encoder component uses EfficientNet-B0 [] as the backbone and is trained from scratch to extract shrub features from shallow to deep layers. At the same time, the transformer (EdgeViT) is utilized to synthesize context information (Figure 5). In addition, the FEM module proposed in FFCA-YOLO captures diverse receptive fields to integrate local contextual information of small objects (Figure 6), which enhances the features of small-scale shrubs and helps preserve key information critical to accurate shrub segmentation in arid environments []. The model automatically scales and expands the network depth, width, and resolution without altering the predefined original architecture in the baseline network, resulting in better model performance.
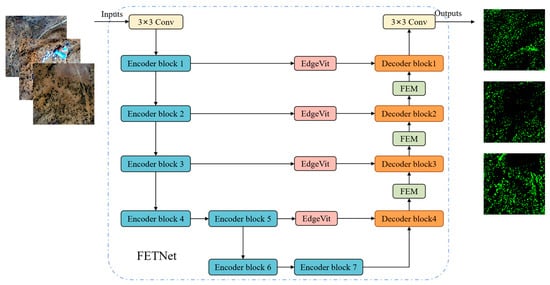
Figure 4.
Structure of feature enhancement and Transformer network (FETNet).
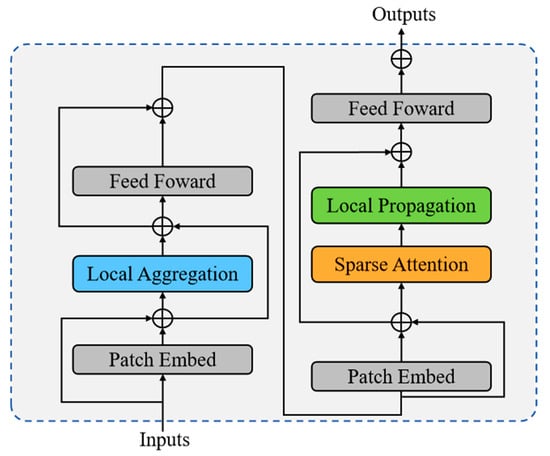
Figure 5.
EdgeViT module of the Transformer branch.
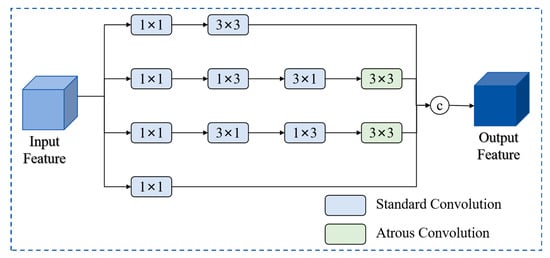
Figure 6.
FEM module structure.
EfficientNet was developed by a team of Google researchers using the Compound Scaling Method to optimize performance. The core module of EfficientNet-B0 is Mobile Inverted Bottleneck Convolution (MBConv) (Figure 7), which serves as the Encoder block. It includes Depthwise Separable Convolution (Depwise Conv), the Squeeze-and-Excitation (SE) module, and the Swish activation function. Each encoder block is composed of n MBConv modules. Firstly, the 1 × 1 convolution is used to increase the dimensionality, followed by a depthwise separable convolution operation with an attention mechanism (SENet) added. Finally, another 1 × 1 convolution operation is utilized to reduce the dimensionality, and the result output is merged with the input. The modular design and powerful expressive capabilities enable better capture and segmentation of details in complex scenes, enhancing feature reliance for small objects. To improve the efficiency of deep feature extraction from shrubs in arid regions and multi-scale contextual information extraction, a multi-scale feature encoder based on EfficientNet-B0 was constructed. The EdgeViT module was also introduced to strengthen the capability in capturing details and integrating multi-scale information, which helps the network to adapt more flexibly to the features of shrubs at different scales. The decoder component is employed to progressively restore the resolution of the image, combining shallow and deep features, and the integration of the FEM module ensures that the spatial detail information is preserved, resulting in the final segmentation outcomes generated being more accurate and detailed. In the overall design of FETNet, the interaction between modules is organized in a sequential and complementary manner. Specifically, intermediate features from the encoder are first passed into the EdgeViT modules to capture global contextual information. These globally enhanced features are then decoded by the corresponding decoder blocks. To further enhance spatial detail and improve the representation of small objects, a Feature Enhancement Module (FEM) is introduced after each decoder stage. This configuration allows EdgeViT to focus on global semantic modeling, while FEM integrates local contextual information of small objects to strengthen their feature representation. As a result, the decoder is able to effectively integrate global and local features at multiple levels. The overall architecture thus forms a progressive feature enhancement to support robust segmentation of shrubs in arid areas.

Figure 7.
Structure of mobile inverted bottleneck convolution (MBConv) in encoder block.
3.2. Transformer Module
The transformer technique has profoundly advanced the development of various computer vision methods. Taking into account the model’s computational complexity and parameter count, along with the feature and spatial distribution information of shrubs, this paper incorporated the EdgeViT module as a component of the Transformer attention branch []. The EdgeViT module realizes the local–global–local information exchange bottleneck through three key operations, as illustrated in Figure 5. Firstly, local aggregation integrates local feature information from neighboring tokens through deep convolution. Then, key information is shared globally through a sparse self-attention mechanism, which facilitates long-distance information sharing through self-attention mechanism. Finally, local propagation propagates the learned global context information from representative tokens to neighboring tokens utilizing transposed convolution. This design allows EdgeViT to preserve detailed information of small objects while ensuring global feature extraction.
A limited receptive field constrains the capacity to capture long-range contextual dependencies, thereby hindering the accurate extraction of shrub features in complex arid environments. To address this issue, this study integrated the EdgeViT module, which effectively extracts shrubs with small crowns while also identifying large areas of high-density shrub regions with obvious features. The self-focusing technique can effectively learn global information and long-range dependence, which helps to avoid the impact of terrain undulation, diverse imaging conditions, and similarity between shrubs and background features, thereby realizing efficient segmentation of shrubs in arid regions.
3.3. Feature Enhancement Module
Shrubs are densely distributed and individual targets are small in arid environments, posing significant challenges for shrub extraction from remote sensing images. For this purpose, this paper introduces the Feature Enhancement Module (FEM) [], which enhances the small object features from the perspective of feature richness and receptive field. To increase feature richness, FEM adopts a multi-branch convolutional structure to extract multiple discriminative semantic information, retaining the key feature information of shrubs in arid regions and further contextual information. For receptive field expansion, FEM introduces the atrous convolution to obtain richer local contextual information and enhance the capability for feature representation of small objects. The combination of multi-branch convolutional structure and atrous convolution not only enriches the feature expression but also expands the receptive field, so that the network has higher accuracy and robustness in extracting the shrubs. Figure 6 depicts the structure of FEM. Each branch begins with a 1 × 1 convolution applied to the input feature map, which serves to initially adjust channel number and lay the foundation for further processing. The first branch retains the key feature information for small objects by adopting the residual structure. The remaining three branches execute cascaded standard convolution operations with convolution kernel sizes of 1 × 3, 3 × 1, and 3 × 3, respectively. The middle two branches incorporate additional atrous convolution layers, enabling more contextual information to be retained in the extracted feature maps, thus further improving the small object detection accuracy. The FEM module can significantly enhance the performance of the shrub extraction network this way, especially in dealing with small objects and facing complex backgrounds.
4. Experiment
4.1. Experimental Environment and Evaluation Indicators
The experimental platform in this paper used PyTorch 1.7.1 and the training framework of CUDA 11.0, with hardware configurations of Intel I5-13600KF CPU (Intel Corp., Santa Clara, CA, USA) and NVIDIA GeForce RTX 4060Ti GPU (NVIDIA Corp., Santa Clara, CA, USA) with 16 GB of memory. The network optimization incorporated the SGD (Stochastic Gradient Descent) optimizer, employed the cosine annealing strategy, and utilized the Cross-Entropy Loss function, with a weight decay parameter set at 1 × 10⁻⁴. A baseline learning rate of 0.001 and a decay factor of 0.98 every 3 iterations were used to ensure gradual convergence, while the cosine annealing schedule further helped avoid local minima. In addition, a batch size of 2 was utilized during training, and the maximum iteration count was configured to 300. The small batch size was selected to accommodate high-resolution input images under GPU memory constraints, a common practice in remote sensing segmentation.
To evaluate the model’s robustness and effectiveness, five quantitative metrics were used: Pixel Accuracy (PA), Mean Pixel Accuracy (MPA), F1 score, Frequency Weighted Intersection Over Union (FWIOU), and Mean Intersection Over Union (MIOU). The formulas for these evaluation metrics are shown below, which are used to evaluate the performance of the model in practical applications.
where , , , and represent the corresponding true positives and false positives, false negatives and true negatives, respectively. PA denotes the ratio of the number of pixels of shrub correctly predicted by the model to the total number of pixels. The F1 score metric takes into account both the precision (P) and recall (R) of the classification model as the reconciled average of the precision and recall, so this paper used the F1 score as the reference metric. MPA denotes the average ratio between the correct prediction of pixels in both shrubs and background categories. The FWIOU metric takes into account the frequency of each category in the dataset and calculates a weighted score that reflects the overall segmentation performance across all classes. In addition, MIOU is employed to evaluate the degree of correspondence between actual shrub pixels and predicted shrub pixels. Higher MIOU values indicate stronger match.
4.2. Comparison Experiments
The method was evaluated and compared with other semantic segmentation networks on the Shrubland dataset to validate the effectiveness and suitability of FETNet for the shrub in arid regions segmentation task. These methods included HRRNet [], DFANet [], DeepLabv3+ [], HRNet [], FCN16s [], ESPNetv2 [], ExtremeC3Net [], FCN8s [], and SegNet []. The specific comparison experiment results are illustrated in Table 1. FETNet achieved the highest segmentation accuracy in the shrub segmentation task, outperforming all other networks across all metrics. FETNet achieved a high MIOU of 92.49%. The scores for the other four evaluation metrics were as follows: PA, 98.72%; MPA, 95.42%; F1, 94.46%; and FWIOU, 97.56%.

Table 1.
Comparative Experiments on the Shrubland.
In high-resolution remote sensing images, shrubs in arid regions exhibit diverse sizes and shapes and are predominantly dense and small targets, leading to differences in training and prediction outcomes among various deep learning models. To illustratively demonstrate the effectiveness of FETNet in shrub segmentation on high-resolution remote sensing images, several representative arid region shrub extraction results were selected from the experimental outcomes for analysis after testing (Figure 8). It is obvious from the figure that FETNet performed exceptionally well in the shrub segmentation task, especially outperforming other models in the detection and detail capture of shrubs with small-sized crowns (Figure 8k). In contrast, the classification results of DeepLabv3+ missed a large number of shrub targets with small-sized crowns, resulting in classification results being unsatisfactory (Figure 8d). ESPNetv2 and FCN16s performed moderately well in the capture of the overall distribution, but these two algorithms exhibited notable deficiencies in edge detail and dense shrub with small crowns processing (Figure 8e,f). The SegNet model had some similarity with FETNet in terms of segmentation results, and although it could recognize more small-canopy-width shrubs, it still exhibited notable shortcomings. SegNet was prone to mistakenly classify building shadows as shrubs and erroneously categorized some roads as shrub areas. The algorithm tended to miss detection in dense small-scale shrub areas (Figure 8j). In contrast, FETNet was able to capture the edges of shrubs more accurately and maintained high segmentation accuracy in dense shrub regions, making the segmentation results closer to the actual shrub distribution. The FETNet MIOU scores were 21.72%, 15.35%, 13.35%, and 0.96%, respectively, higher than those of DeepLabv3+, FCN16s, ESPNetv2, and SegNet. The experiments demonstrate that FETNet extracts details more accurately in the shrub segmentation task in arid regions and effectively excludes the influence of buildings, roads, and other background elements, thereby achieving higher accuracy and stability in general.
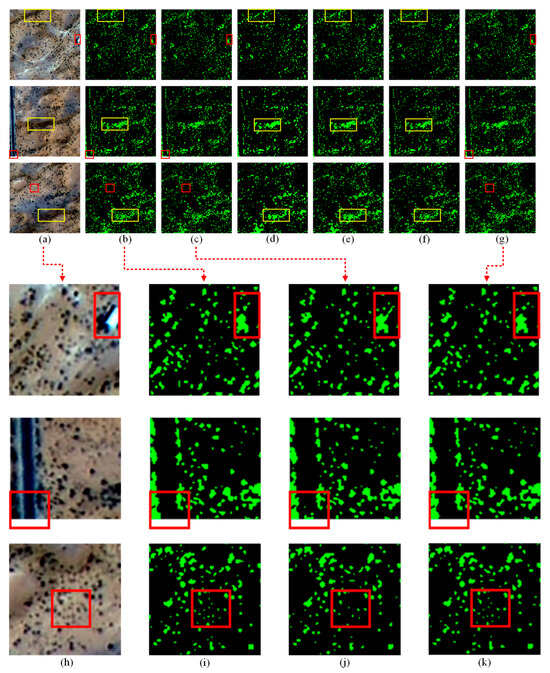
Figure 8.
Comparison of experimental visualization results of Shrubland. (a) Input image, (b) Label, (c) SegNet, (d) DeepLabv3+, (e) ESPNetv2, (f) FCN16s, (g) FETNet. The yellow boxes highlight regions with significant differences among the models and the red boxes emphasize subtle distinctions in segmentation results. (h–k) are the zoomed-in local images of (a–c,g), respectively.
4.3. Ablation Experiments
This study conducted multiple sets of ablation experiments on the Shrubland dataset to validate the effectiveness of the proposed improvement strategies while ensuring consistency in experimental equipment and parameters. The baseline model in this study was built upon a conventional encoder–decoder architecture. The encoder utilized EfficientNet-B0 to extract hierarchical features. The decoder consisted of a standard double convolution block for feature reconstruction. Notably, this baseline excluded both the EdgeViT module and the Feature Enhancement Module (FEM). It served as a reference framework to evaluate the individual and combined contributions of these two modules to overall segmentation performance. Table 2 summarizes the ablation experiment results on the Shrubland dataset, where distinct modules were incrementally added to evaluate their impact on model performance.

Table 2.
Ablation Experiments on the Shrubland.
The ability to capture global information was enhanced with the introduction of the EdgeViT module, which effectively suppressed the impact of building shadows compared to the baseline network (Figure 9c,d, yellow box). Although the PA and MIOU received an increase of 0.11% and 0.3%, the inclusion of EdgeViT severely affected the model’s ability (Baseline + EdgeViT) to extract shrubs around buildings, leading to extensive omission errors in those areas (Figure 9d). The FEM module was mainly utilized for feature enhancement, excelling particularly in feature extraction of dense small targets with insignificant feature information, such as small-scale shrubs. By incorporating the FEM, the network (Baseline + FEM) is able to better extract the details of shrubs with small crowns, avoiding target misdetections or loss of details due to insufficient feature information (Figure 9c,e). The PA and MIOU showed improvements of 0.17% and 0.82%, respectively. However, the local enhancement mechanism of FEM may also amplify high-frequency background noise, such as building shadows, resulting in some shadowed regions being falsely identified as shrubs (Figure 9e, yellow box). When both EdgeViT and FEM modules were integrated, the model segmentation performance was further improved (Figure 9c,f), with PA reaching 98.72% and MIOU increasing to 92.49%. Although most shadow-related misclassifications were alleviated, a few such errors still persisted, and the model still showed occasional omissions in areas with blurred shrub boundaries or irregular morphology (Figure 9f, yellow box). These revealed the limitations of the model under complex background conditions. Given that the final model remains lightweight (6.68 M parameters), the trade-off between performance and complexity is practical for remote sensing applications.
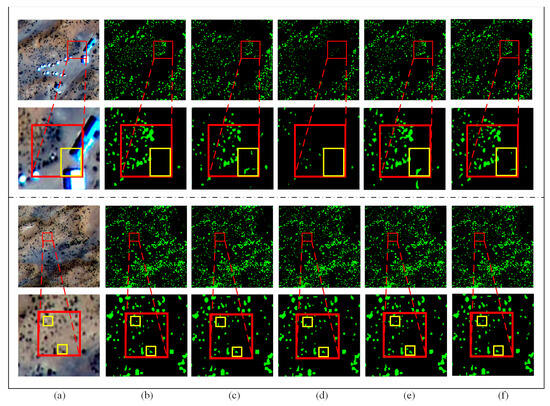
Figure 9.
Comparison experimental visualization results of Shrubland. (a) Input image, (b) Label, (c) Baseline, (d) Baseline + EdgeViT, (e) Baseline + FEM, (f) Baseline + EdgeViT + FEM. The yellow boxes highlight regions with significant differences among the models and the red boxes emphasize subtle distinctions in segmentation results.
4.4. Practical Application Scenarios
To further evaluate the adaptability and generalization capability of the proposed model in practical applications, an independent test area was selected that differed from the training set in both spatial and temporal dimensions. This area is located within a typical desert shrub distribution zone in arid regions, spanning from 66°3′ E to 66°7′ E and from 41°8′ N to 41°12′ N, with a total area of approximately 38 km2 (Figure 10A). The test imagery was acquired by the Gaofen-2 (GF-2) satellite on 1 July 2023. Considering the evident spatial imbalance between shrubs and sandy land within the region, a stratified random sampling strategy was employed to ensure the objectivity and representativeness of the accuracy assessment. Specifically, 300 sample points were randomly selected from shrub-covered areas and 300 from bare sand areas for evaluation.
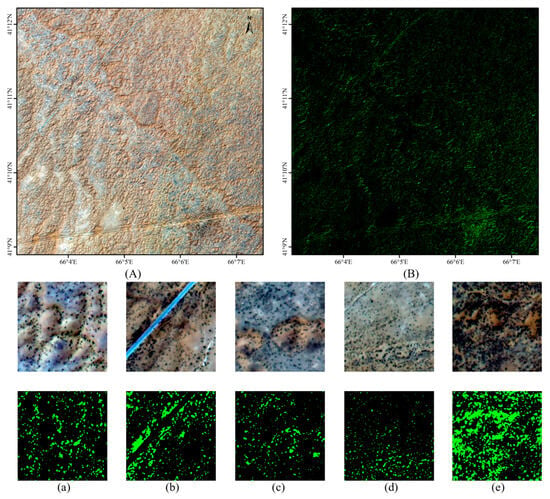
Figure 10.
Visualization results in the independent test area. (A) Prediction results (B) and visualization of local prediction regions (a–e).
The experimental results confirm that the model maintains high classification accuracy in regions not involved in training. The prediction results are shown in Figure 10B. The Pixel Accuracy (PA) reaches 92.5% and the F1 score achieves 92.2%, indicating strong generalization and robustness. In areas with dense shrub coverage (Figure 10b,e), the model accurately extracts shrub contours and edges. It preserves spatial structure and captures fine-scale details effectively. Overall, the model performs well in shrub extraction. It demonstrates stable prediction under varying conditions. However, limitations remain. In regions where shrub features are spectrally or texturally similar to the background (Figure 10c,d), the model shows partial omission and misclassification. These cases reflect challenges in low-contrast scenarios. Further improvement is needed to enhance discrimination in such environments.
5. Discussion
FETNet effectively improves the extraction of dense, small-scale shrubs while maintaining high computational efficiency by integrating the Feature Enhancement Module (FEM) and the multi-scale information fusion module EdgeViT. Accurate extraction of shrubs in remote sensing images remains challenging, primarily due to their extremely small pixel proportions, which classify them as small objects. Their irregular shapes, low contrast, and limited feature information severely hinder the model’s ability to learn sufficient contextual cues for accurate segmentation.
FETNet incorporated the FEM from FFCA-YOLO and EdgeViT module, fully leveraging local and global contextual information, as well as feature information from small targets, to enhance the extraction of shrubs in arid regions. In this study, ablation experiments were carried out on the Shrubland dataset, and the experimental modules were gradually added with EfficientNet-B0 as the baseline. The results confirmed the effectiveness of the referenced modules in FETNet (see Table 2). The EdgeViT module enhances the extraction accuracy of shrubs by capturing multi-scale features. Its local–global–local connection structure aids in capturing the detailed information of the target across multiple scales. This structure enables the detection of extensive areas of dense shrubs while effectively considering small targets with weak feature signals, such as sparse shrubs, thus improving overall segmentation. The design approach was validated in the field of remote sensing for multi-scale small object detection, similar to the FE-CenterNet proposed by Shi et al. []. The Feature Enhancement Module (FEM), comprising the Feature Aggregation Structure (FAS) and Attention Generation Structure (AGS), strengthens the multi-scale feature extraction capability for small object detection. With the multi-scale feature extraction and coordinate attention mechanism, this module can effectively suppress false alarms in complex scenes and enhance the feature perception of small objects, enabling the model to locate and detect small targets with greater accuracy []. FETNet’s ability to capture global information was enhanced by integrating the EdgeViT module, resulting in an improvement of 0.11% and 0.30% in PA and MIOU, respectively (see Table 2). Additionally, the FEM module excels in feature enhancement, especially in small object feature extraction, which offers our model greater robustness when dealing with complex arid backgrounds (see Table 2). This feature is similar to the application of the FFCA-YOLO model proposed by Zhang et al. for small object detection []. Zhang et al. significantly improved small object detection accuracy in remote sensing images through the introduction of the Feature Enhancement Module (FEM) into FFCA-YOLO [], further verifying the critical role of the Feature Enhancement Module in improving the performance of small object detection. The FEM module in this study enhances detailed information, enabling FETNet to further improve the segmentation accuracy of small-scale objects in the extraction task of shrubs in arid areas. FETNet can recognize these shrub targets more accurately, avoiding the common problem of missed detection (Figure 8). In comparison, SegNet exhibited a higher false detection rate when handling sparsely distributed shrubs and was prone to misclassifying a few numbers of building shadows as well as roads as shrubs. DeepLabv3+ primarily focuses on the large-scale shrub regions in segmenting shrubs in arid regions, leading to poor segmentation results. The accuracy of FCN16s and ESPNetv2 is considerably lower than FETNet, and they are prone to missed detections when dealing with shrubs with small crowns. Notably, FETNet maintains a low parameter count (Params), despite the measurable improvement in model performance after the integration of EdgeViT and FEM. The number of parameters increases to only 6.68 M, and the number of Flops is only at 2.93 G (Table 2), indicating that FETNet not only has a significant advantage in accuracy, but also performs well in terms of computational efficiency and resource utilization. The comparatively small parameter count and efficient computational performance render FETNet practical and scalable in complex arid environments, which is suitable for practical application scenarios with limited resources.
The FETNet model demonstrates strong performance in experimental evaluations. Although it was trained on manually annotated data, it achieved satisfactory segmentation results in completely independent arid environments, indicating strong generalization capability. This suggests its promising potential for future practical applications, such as monitoring shrubland dynamics for early desertification warning, supporting ecological zoning and sustainable land use planning in arid regions, and serving as a preprocessing tool in large-scale ecological remote sensing systems. In future work, unsupervised, semi-supervised, or weakly supervised learning approaches could be further explored to reduce dependence on labeled data and lower manual annotation costs. It should be noted that all the images used in this study were acquired from GF-2 satellite data. Further research can focus on exploring the model’s adaptability to diverse high-resolution remote sensing images to improve its flexibility and practical value. In addition, the images used in this study were selected from cloud-free, high-visibility summer satellite scenes, and the model’s robustness under other imaging conditions, such as thin clouds, haze, or seasonal vegetation phenology changes, has not yet been evaluated. Atmospheric factors under such conditions may obscure shrub features or introduce noise, thereby affecting segmentation accuracy. Future studies could incorporate multi-season and multi-weather condition experiments, along with data augmentation techniques, to enhance the model’s robustness in complex imaging scenarios and improve its dynamic vegetation monitoring capabilities. Furthermore, reinforcement learning may offer new perspectives for adaptive learning in challenging environments. By integrating multi-source information such as vegetation indices, these methods could further improve the model’s performance in shrub extraction tasks.
6. Conclusions
Accurate extraction of desert shrubs is essential for ecological conservation, climate change research, and biodiversity maintenance. To facilitate this, we constructed a shrub label dataset based on GF-2 data for ablation and comparison experiments. The FETNet model, designed for extracting desert shrubs from high-resolution remote sensing imagery, integrates a Feature Enhancement Module (FEM) and the EdgeViT Transformer. The EdgeViT module enhances global information capture, effectively addressing challenges like shadows and background similarities in shrub areas. Concurrently, the FEM module improves the capture of details in shrubs with small crowns, thereby enhancing segmentation accuracy in complex backgrounds. Experimental results indicate that FETNet outperforms all nine other deep learning models. This showcases its capability to effectively handle dense small targets and eliminate interferences such as roads and shadows. It shows the practical potential for desertification monitoring and ecological land management in arid regions. However, as FETNet relies on large manual-labeled data, advancements in unsupervised learning should be further constructed for its generalization and practicability.
Author Contributions
H.L.: Conceptualization, Methodology, Supervision, Writing—review and editing. W.Z.: Methodology, Funding acquisition, Writing—review and editing. Y.C.: Project administration, Methodology, Investigation. J.H.: Conceptualization, Methodology, Supervision, Investigation, Writing—review and editing. H.S.: Conceptualization, Methodology, Investigation, Writing—review and editing. S.B.: Data curation, Resources. W.W.: Data curation, Resources. D.Z.: Methodology, Writing—review and editing. F.Z.: Data curation, Resources. N.S.: Writing—review and editing. B.P.: Data curation, Resources. A.I.: Writing—review and editing, Investigation. All authors have read and agreed to the published version of the manuscript.
Funding
This work was supported in part by National Key R&D Program of China under Grant 2023YFE0208100 and the State Key Laboratory of Geo-Information Engineering under Grant SKLGIE2023-Z-4-1 and the National Natural Science Foundation of China under Grant 42201053.
Data Availability Statement
The dataset used to support the findings of this study was made publicly available online. The Shrubland dataset can be accessed at https://doi.org/10.5281/zenodo.15767663 (accessed on 29 June 2025) and the stratified sampling point data are available at https://doi.org/10.5281/zenodo.15767407 (accessed on 29 June 2025).
Acknowledgments
We thank the anonymous reviewers for their comments and suggestions that improved this paper.
Conflicts of Interest
The authors declare no conflicts of interest.
References
- Cao, H.; Tao, H.; Zhang, Z. Projected spatial distribution patterns of three dominant desert plants in Xinjiang of Northwest China. Forests 2025, 16, 1031. [Google Scholar] [CrossRef]
- Garcia-Estringana, P.; Alonso-Blázquez, N.; Alegre, J. Water storage capacity, stemflow and water funneling in Mediterranean shrubs. J. Hydrol. 2010, 389, 363–372. [Google Scholar] [CrossRef]
- Kooch, Y.; Zarei, F.D. Soil function indicators below shrublands with different species composition. Catena 2023, 227, 107111. [Google Scholar] [CrossRef]
- Liu, Z.; Shao, Y.; Cui, Q.; Ye, X.; Huang, Z. ‘Fertile island’ effects on the soil microbial community beneath the canopy of Tetraena mongolica, an endangered and dominant shrub in the West Ordos Desert, North China. BMC Plant Biol. 2024, 24, 178. [Google Scholar] [CrossRef]
- Zhang, G.; Zhao, L.; Yang, Q.; Zhao, W.; Wang, X. Effect of desert shrubs on fine-scale spatial patterns of understory vegetation in a dry-land. Plant Ecol. 2016, 217, 1141–1155. [Google Scholar] [CrossRef]
- Sun, J.; Zhong, C.; He, H.; Nureman, T.; Li, H. Continuous remote sensing monitoring and changes of land desertification in China from 2000 to 2015. J. Northeast For. Univ. 2021, 49, 87–92. [Google Scholar]
- Liu, Y.; Dong, L.; Wang, J.; Li, J.; Yi, L.; Li, H.; Chai, S.; Han, Z. Spatial heterogeneity affects the spatial distribution patterns of Caragana tibetica scrubs. Forests 2024, 15, 2072. [Google Scholar] [CrossRef]
- Cohen, W.B.; Maiersperger, T.K.; Gower, S.T.; Turner, D.P. An improved strategy for regression of biophysical variables and Landsat ETM+ data. Remote Sens. Environ. 2003, 84, 561–571. [Google Scholar] [CrossRef]
- Ni, Y.; Liu, J.; Cui, J.; Yang, Y.; Wang, X. Edge guidance network for semantic segmentation of high-resolution remote sensing images. IEEE J. Sel. Top. Appl. Earth Obs. Remote Sens. 2023, 16, 9382–9395. [Google Scholar] [CrossRef]
- Tang, C.; Jiang, X.; Li, G.; Lu, D. Developing a new method to rapidly map Eucalyptus distribution in subtropical regions using Sentinel-2 imagery. Forests 2024, 15, 1799. [Google Scholar] [CrossRef]
- Nasiri, V.; Deljouei, A.; Moradi, F.; Sadeghi, S.M.M.; Borz, S.A. Land use and land cover mapping using Sentinel-2, Landsat-8 satellite images, and Google Earth Engine: A comparison of two composition methods. Remote Sens. 2022, 14, 1977. [Google Scholar] [CrossRef]
- Fan, F.; Shi, Y.; Zhu, X.X. Land cover classification from Sentinel-2 images with quantum-classical convolutional neural networks. IEEE J. Sel. Top. Appl. Earth Obs. Remote Sens. 2024, 17, 12477–12489. [Google Scholar] [CrossRef]
- Chen, Y.; Zhou, J.; Ge, Y.; Dong, J. Uncovering the rapid expansion of photovoltaic power plants in China from 2010 to 2022 using satellite data and deep learning. Remote Sens. Environ. 2024, 305, 114100. [Google Scholar] [CrossRef]
- He, J.; Cheng, Y.; Wang, W.; Ren, Z.; Zhang, C.; Zhang, W. A lightweight building extraction approach for contour recovery in complex urban environments. Remote Sens. 2024, 16, 740. [Google Scholar] [CrossRef]
- Cheng, Y.; Wang, W.; Ren, Z.; Zhao, Y.; Liao, Y.; Ge, Y.; Wang, J.; He, J.; Gu, Y.; Wang, Y.; et al. Multi-scale feature fusion and Transformer network for urban green space segmentation from high-resolution remote sensing images. Int. J. Appl. Earth Obs. Geoinf. 2023, 124, 103514. [Google Scholar] [CrossRef]
- Brandt, M.; Tucker, C.J.; Kariryaa, A.; Rasmussen, K.; Abel, C.; Small, J.; Chave, J.; Rasmussen, L.V.; Hiernaux, P.; Diouf, A.A.; et al. An unexpectedly large count of trees in the West African Sahara and Sahel. Nature 2020, 587, 78–82. [Google Scholar] [CrossRef]
- Li, Z.; Zhang, Q.; Peng, D. Classification method of tree species based on GF-2 remote sensing images. Remote Sens. Technol. Appl. 2019, 34, 970–982. [Google Scholar]
- Zhang, C.; Liu, J.; Yu, F.; Wan, S.; Han, Y.; Wang, J.; Wang, G. Segmentation model based on convolutional neural networks for extracting vegetation from Gaofen-2 images. J. Appl. Remote Sens. 2018, 12, 042804. [Google Scholar] [CrossRef]
- Wang, W.; Cheng, Y.; Ren, Z.; He, J.; Zhao, Y.; Wang, J.; Zhang, W. A novel hybrid method for urban green space segmentation from high-resolution remote sensing images. Remote Sens. 2023, 15, 5472. [Google Scholar] [CrossRef]
- Xue, X.; Guo, X.; Xue, D.; Ma, Y.; Yang, F. Remote sensing estimation methods for determining FVC in northwest desert arid low disturbance areas based on GF-2 imagery. J. Resour. Ecol. 2023, 14, 833–846. [Google Scholar] [CrossRef]
- Gu, Y.; Hunt, E.; Wardlow, B.; Basara, J.B.; Brown, J.F.; Verdin, J.P. Evaluation of MODIS NDVI and NDWI for vegetation drought monitoring using Oklahoma Mesonet soil moisture data. Geophys. Res. Lett. 2008, 35, L22401. [Google Scholar] [CrossRef]
- Garajeh, M.K.; Feizizadeh, B.; Weng, Q.; Moghaddam, M.H.R.; Garajeh, A.K. Desert landform detection and mapping using a semi-automated object-based image analysis approach. J. Arid Environ. 2022, 199, 104721. [Google Scholar] [CrossRef]
- Meng, J.; Xiong, W.; Zhou, H.; Zhang, X.; Liu, T.; Gao, X. Research on neural network extraction methods for vegetation in the Mu Us Desert. Comput. Digit. Eng. 2024, 52, 206–212. [Google Scholar]
- Blaschke, T. Object based image analysis for remote sensing. ISPRS J. Photogramm. Remote Sens. 2010, 65, 2–16. [Google Scholar] [CrossRef]
- Al-Ali, Z.M.; Abdullah, M.M.; Asadalla, N.B.; Gholoum, M. A comparative study of remote sensing classification methods for monitoring and assessing desert vegetation using a UAV-based multispectral sensor. Environ. Monit. Assess. 2020, 192, 389. [Google Scholar] [CrossRef] [PubMed]
- Zhu, F.; Gao, J.; Yang, J.; Ye, N. Neighborhood linear discriminant analysis. Pattern Recognit. 2022, 123, 108422. [Google Scholar] [CrossRef]
- Zhu, F.; Zhang, W.; Chen, X.; Gao, X.; Ye, N. Large margin distribution multi-class supervised novelty detection. Expert Syst. Appl. 2023, 224, 119937. [Google Scholar] [CrossRef]
- Song, Z.; Lu, Y.; Ding, Z.; Sun, D.; Jia, Y.; Sun, W. A new remote sensing desert vegetation detection index. Remote Sens. 2023, 15, 5742. [Google Scholar] [CrossRef]
- Yue, J.; Mu, G.; Tang, Z.; Yang, X.; Lin, Y.; Xu, L. Empirical model study on remote sensing estimation of vegetation coverage in arid desert areas of Xinjiang based on NDVI. Arid Land Geogr. 2020, 43, 153–160. [Google Scholar]
- Tan, Y.C.; Duarte, L.; Teodoro, A.C. Comparative study of random forest and support vector machine for land cover classification and post-wildfire change detection. Land 2024, 13, 1878. [Google Scholar] [CrossRef]
- Hashim, H.; Abd Latif, Z.; Adnan, N.A.; Che Hashim, I.; Zahari, N.F. Vegetation extraction with pixel-based classification approach in urban park area. Plan. Malays. 2021, 19, 108–120. [Google Scholar] [CrossRef]
- Jawak, S.D.; Devliyal, P.; Luis, A.J. A comprehensive review on pixel-oriented and object-oriented methods for information extraction from remotely sensed satellite images with a special emphasis on cryospheric applications. Adv. Remote Sens. 2015, 4, 177–195. [Google Scholar] [CrossRef]
- Aplin, P.; Smith, G.M. Advances in object-based image classification. Int. Arch. Photogramm. Remote Sens. Spat. Inf. Sci. 2008, 37, 725–728. [Google Scholar]
- Chen, Z.; Ning, X.; Zhang, J. Urban land cover classification based on WorldView-2 image data. In Proceedings of the 2012 International Symposium on Geomatics for Integrated Water Resource Management, Wuhan, China, 19–21 October 2012; IEEE: Piscataway, NJ, USA, 2012; pp. 1–5. [Google Scholar]
- Guirado, E.; Tabik, S.; Alcaraz-Segura, D.; Cabello, J.; Herrera, F. Deep-learning versus OBIA for scattered shrub detection with Google Earth imagery: Ziziphus lotus as case study. Remote Sens. 2017, 9, 1220. [Google Scholar] [CrossRef]
- Hossain, M.D.; Chen, D. Segmentation for object-based image analysis (OBIA): A review of algorithms and challenges from remote sensing perspective. ISPRS J. Photogramm. Remote Sens. 2019, 150, 115–134. [Google Scholar] [CrossRef]
- Li, Y.; Li, X.; Zhang, Y.; Peng, D.; Bruzzone, L. Cost-efficient information extraction from massive remote sensing data: When weakly supervised deep learning meets remote sensing big data. Int. J. Appl. Earth Obs. Geoinf. 2023, 120, 103345. [Google Scholar] [CrossRef]
- Zheng, C.; Jiang, Y.; Lv, X.; Nie, J.; Liang, X.; Wei, Z. SSDT: Scale-separation semantic decoupled transformer for semantic segmentation of remote sensing images. IEEE J. Sel. Top. Appl. Earth Obs. Remote Sens. 2024, 17, 9037–9052. [Google Scholar] [CrossRef]
- Hinton, G.E.; Osindero, S.; Teh, Y.W. A fast learning algorithm for deep belief nets. Neural Comput. 2006, 18, 1527–1554. [Google Scholar] [CrossRef]
- Jiang, C.; Ren, H.; Ye, X.; Zhu, J.; Zeng, H.; Nan, Y.; Sun, M.; Ren, X.; Huo, H. Object detection from UAV thermal infrared images and videos using YOLO models. Int. J. Appl. Earth Obs. Geoinf. 2022, 112, 102912. [Google Scholar] [CrossRef]
- Chen, Z.; Wang, C.; Li, J.; Fan, W.; Du, J.; Zhong, B. Adaboost-like end-to-end multiple lightweight U-Nets for road extraction from optical remote sensing images. Int. J. Appl. Earth Obs. Geoinf. 2021, 100, 102341. [Google Scholar] [CrossRef]
- Long, J.; Shelhamer, E.; Darrell, T. Fully convolutional networks for semantic segmentation. In Proceedings of the IEEE Conference on Computer Vision and Pattern Recognition (CVPR), Boston, MA, USA, 7–12 June 2015; pp. 3431–3440. [Google Scholar]
- Badrinarayanan, V.; Kendall, A.; Cipolla, R. SegNet: A deep convolutional encoder-decoder architecture for image segmentation. IEEE Trans. Pattern Anal. Mach. Intell. 2017, 39, 2481–2495. [Google Scholar] [CrossRef] [PubMed]
- Chen, L.C.; Zhu, Y.; Papandreou, G.; Schroff, F.; Adam, H. Encoder-decoder with atrous separable convolution for semantic image segmentation. In Proceedings of the European Conference on Computer Vision (ECCV), Munich, Germany, 8–14 September 2018; pp. 801–818. [Google Scholar]
- Mehta, S.; Rastegari, M.; Shapiro, L.; Hajishirzi, H. ESPNetv2: A light-weight, power efficient, and general purpose convolutional neural network. In Proceedings of the IEEE/CVF Conference on Computer Vision and Pattern Recognition (CVPR), Long Beach, CA, USA, 16–20 June 2019; pp. 9190–9200. [Google Scholar]
- Lee, D.H.; Park, H.Y.; Lee, J. A review on recent deep learning-based semantic segmentation for urban greenness measurement. Sensors 2024, 24, 2245. [Google Scholar] [CrossRef]
- Ouyang, S.; Du, S.; Zhang, X.; Du, S.; Bai, L. MDFF: A method for fine-grained UFZ mapping with multimodal geographic data and deep network. IEEE J. Sel. Top. Appl. Earth Obs. Remote Sens. 2023, 16, 9951–9966. [Google Scholar] [CrossRef]
- Fassnacht, F.E.; Latifi, H.; Stereńczak, K.; Modzelewska, A.; Lefsky, M.; Waser, L.T.; Straub, C.; Ghosh, A. Review of studies on tree species classification from remotely sensed data. Remote Sens. Environ. 2016, 186, 64–87. [Google Scholar] [CrossRef]
- Li, S.; Wang, S.; Wang, P. A small object detection algorithm for traffic signs based on improved YOLOv7. Sensors 2023, 23, 7145. [Google Scholar] [CrossRef]
- Zhang, Y.; Ye, M.; Zhu, G.; Liu, Y.; Guo, P.; Yan, J. FFCA-YOLO for small object detection in remote sensing images. IEEE Trans. Geosci. Remote Sens. 2024, 62, 1–15. [Google Scholar] [CrossRef]
- Abdullayev, I.N. Flora and faunas of Uzbekistan. Mountain, lakes, rivers, deserts and steppes. The “Redbook” of Uzbekistan. Mod. Educ. Dev. 2024, 1, 353–360. [Google Scholar]
- Kapustina, L.A. Biodiversity, ecology, and microelement composition of Kyzylkum Desert shrubs (Uzbekistan). In Shrubland Ecosystem Genetics and Biodiversity: Proceedings of the Conference, Provo, UT, USA, 13–15 June 2000; McArthur, E.D., Fairbanks, D.J., Eds.; U.S. Department of Agriculture, Forest Service, Rocky Mountain Research Station: Ogden, UT, USA, 2001; pp. 98–103. [Google Scholar]
- Ortiqova, L. Diversity of ecological conditions of the Kyzylkum Desert with pasture phytomelioration. Arkhiv Nauchnykh Publikatsii JSPI 2020, 8, 34–41. [Google Scholar]
- Okin, G.S.; Roberts, D.A.; Murray, B.; Okin, W.J. Practical limits on hyperspectral vegetation discrimination in arid and semiarid environments. Remote Sens. Environ. 2001, 77, 212–225. [Google Scholar] [CrossRef]
- Tan, M.; Le, Q. EfficientNet: Rethinking model scaling for convolutional neural networks. In Proceedings of the International Conference on Machine Learning (ICML), Long Beach, CA, USA, 9–15 June 2019; PMLR: New York, NY, USA, 2019; pp. 6105–6114. [Google Scholar]
- Pan, J.; Bulat, A.; Tan, F.; Zhu, X.; Dudziak, L.; Li, H.; Tzimiropoulos, G.; Martinez, B. EdgeViTs: Competing light-weight CNNs on mobile devices with vision transformers. In Proceedings of the European Conference on Computer Vision (ECCV), Tel Aviv, Israel, 23–27 October 2022; Springer Nature: Cham, Switzerland, 2022; pp. 294–311. [Google Scholar]
- Cheng, S.; Li, B.; Sun, L.; Chen, Y. HRRNet: Hierarchical refinement residual network for semantic segmentation of remote sensing images. Remote Sens. 2023, 15, 1244. [Google Scholar] [CrossRef]
- Li, H.; Xiong, P.; Fan, H.; Sun, J. DFANet: Deep feature aggregation for real-time semantic segmentation. In Proceedings of the IEEE/CVF Conference on Computer Vision and Pattern Recognition (CVPR), Long Beach, CA, USA, 16–20 June 2019; pp. 9522–9531. [Google Scholar]
- Sun, K.; Xiao, B.; Liu, D.; Wang, J. Deep high-resolution representation learning for human pose estimation. In Proceedings of the IEEE/CVF Conference on Computer Vision and Pattern Recognition (CVPR), Long Beach, CA, USA, 16–20 June 2019; pp. 5693–5703. [Google Scholar]
- Park, H.; Sjösund, L.L.; Yoo, Y.; Bang, J.; Kwak, N. ExtremeC3Net: Extreme lightweight portrait segmentation networks using advanced C3-modules. arXiv 2019, arXiv:1908.03093. [Google Scholar]
- Shi, T.; Gong, J.; Hu, J.; Zhi, X.; Zhang, W.; Zhang, Y.; Zhang, P.; Bao, G. Feature-enhanced CenterNet for small object detection in remote sensing images. Remote Sens. 2022, 14, 5488. [Google Scholar] [CrossRef]
Disclaimer/Publisher’s Note: The statements, opinions and data contained in all publications are solely those of the individual author(s) and contributor(s) and not of MDPI and/or the editor(s). MDPI and/or the editor(s) disclaim responsibility for any injury to people or property resulting from any ideas, methods, instructions or products referred to in the content. |
© 2025 by the authors. Licensee MDPI, Basel, Switzerland. This article is an open access article distributed under the terms and conditions of the Creative Commons Attribution (CC BY) license (https://creativecommons.org/licenses/by/4.0/).