Abstract
Understanding species composition and forest dynamics is essential for predicting biomass productivity and informing conservation in tropical montane ecosystems. We evaluated floristic, demographic, and biomass changes in eighteen 0.1 ha permanent plots in the Colombian Sub-Andean forest, including both primary (ca. 60 y old) and secondary forests (ca. 30 years old). Two censuses of individuals (DBH ≥ 2.5 cm) were conducted over 7–13 years. We recorded 516 species across 202 genera and 89 families. Floristic composition differed significantly between forest types (PERMANOVA, p = 0.001), and black oak (Trigonobalanus excelsa Lozano, Hern. Cam. & Henao) forests formed distinct assemblages. Demographic rates were higher in secondary forests, with mortality (4.17% yr), recruitment (4.51% yr), and relative growth rate (0.02% yr) exceeding those of primary forests. The mean aboveground biomass accumulation and the rate of annual change were higher in primary forests (447.5 Mg ha−1 and 466.8 Mg ha−1 yr−1, respectively) than in secondary forests (217.2 Mg ha−1 and 217.2 Mg ha−1 yr−1, respectively). Notably, black oak forests showed the greatest biomass accumulation and rate of change in biomass. Annual net biomass production was higher in secondary forests (8.72 Mg ha−1 yr−1) than in primary forests (5.66 Mg ha−1 yr−1). These findings highlight the ecological distinctiveness and recovery potential of secondary Sub-Andean forests and underscore the value of multitemporal monitoring to understand forest resilience and assess vulnerability to environmental change.
1. Introduction
The tropical mountain ecosystems of the Andes are recognized as one of the world’s major centers of biodiversity, harboring about 45,000 plant species, 44.4% of which are endemic [1]. This exceptional biological richness has been shaped by the interaction between complex, dynamic topographic landscapes and marked by climatic heterogeneity [2,3], which promotes unique ecological processes even at small spatial scales [4,5]. Despite their importance, these ecosystems face increasing threats from anthropogenic pressures such as deforestation, fragmentation, selective timber extraction, and climate change [6,7]. These pressures have caused a loss of 2.5 million hectares of tropical montane forest between 2019 and 2021 [8]; 78.4% of the species present at least one threatened population, and 13.8% of them face extinction risk [9]. In addition, it restricts species distribution and drives range shifts to higher elevations, where Andean species—with narrow thermal ranges and limited physiological tolerances—are particularly vulnerable [3,9,10]. These changes also alter forest ecosystem services, including biodiversity and carbon sequestration [3].
Although some studies suggest that increased CO2 concentration could favor aboveground biomass (AGB) in tropical forests [11,12], there are no long-term monitoring studies, especially in montane forests, to assess this hypothesis [12]. For this reason, monitoring permanent plots became a key tool to understand the natural dynamics of tropical ecosystems and their role in the accumulation and distribution of carbon. In the Neotropics, up to 28% of the forest area may consist of secondary forests, which have the potential to sequester up to 31 Pg CO2, an amount equivalent to carbon emissions from fossil fuels and industrial activities in Latin America and the Caribbean between 1993 and 2014 [13]. In the tropical montane forests, where the anthropogenic pressure is high, it is important to understand how the processes of primary as well as secondary successions influence carbon sequestration and its potential role in mitigating climate change.
Secondary forests, under certain conditions—including proximity to old-growth forest, low-intensity past land use, high surrounding forest cover, and sufficient time since abandonment—can follow successional trajectories that, over several decades of natural regeneration, lead them to structurally and functionally resemble primary forests [13,14]. However, the trajectory and extent of this recovery depend on multiple factors, such as the intensity and type of disturbance, landscape context, connectivity with conserved forests, and edaphic and climatic conditions [15]. These factors influence key ecological functions, including forest structure, biomass, and floristic composition. For example, in Colombian Andean forests with 35 years of post-logging regeneration, a one-time assessment found significant differences in floristic composition between secondary and primary forests, with climate, topography, and edaphic conditions being the main explanatory variables [16].
Given that species exhibit different life-history strategies and respond differently to environmental conditions [11,17,18], it is expected that a change in floristic composition alters the demographic dynamics of trees at the community level. Shifts in species dominance and diversity during succession could drive forest resilience, productivity, and long-term carbon accumulation. Additionally, the inherent instability of steep mountainous terrain typical of Andean ecosystems creates a heterogeneous mosaic of forests with different levels of disturbance generated by the fall of large trees [11,19], which may increase due to extreme weather events associated with climate change [20]. Therefore, assessing how demographic processes and species composition change in regenerating forests of the Sub-Andean is crucial to understanding the potential for natural restoration and its contribution to ecosystem resilience in the face of global change.
Various studies have examined floristic composition, aboveground biomass (AGB) accumulation, and carbon stocks in Andean tropical montane forests. Notable examples include research conducted in Peru, where AGB was evaluated in primary and secondary forests along an altitudinal gradient [21]; in Colombia, where the relationship between AGB and wood density was analyzed across a successional gradient [22]; and in Panama, where AGB and soil carbon were assessed at different elevations [23]. However, most of these studies rely on single-time measurements, which limit our understanding of the dynamic processes that regulate forest structure and functioning. To date, only two studies in Colombia have incorporated repeated measurements over time to analyze forest dynamics and productivity in Sub-Andean forests, with temporal windows ranging from two to five years [24,25]. This limited empirical foundation highlights a significant knowledge gap regarding temporal patterns of biomass change and tree demography in tropical Sub-Andean forests. Therefore, long-term studies are needed to more robustly characterize vegetation dynamics and the processes associated with biomass productivity in these ecosystems, which are critical for conservation and carbon storage.
Evaluating the factors that influence species composition and demographic dynamics in tropical montane forests is essential to predict their future productivity and design effective conservation strategies. In this sense, we asked two main questions: (i) What is the species turnover of tropical montane forests in the Cueva de los Guácharos National Natural Park (CGNNP) at spatial and temporal levels? and (ii) Does secondary succession affect the demographic processes and the production of AGB in these forests? We hypothesize that primary and secondary forests differ in terms of species turnover, rate of population change, and AGB production. It is expected that in secondary forests, these processes will be more dynamic [13,14], with higher turnover and growth rates, and that the floristic composition will tend over time to resemble that of the primary forest [17,26].
2. Materials and Methods
2.1. Study Area
This study was carried out in the Cueva de los Guácharos National Natural Park (CGNNP), located in the Andean region in the southwest of Colombia (Figure 1), in the departments of Huila, Caquetá, and Cauca. It has an area of 7134 ha, an altitudinal range between 1600 and 2840 m asl, a mean annual temperature of 17 °C, a mean annual precipitation of 2000 mm, a long rainy season between February and October, and a dry season from November to January [27]. The park is classified as a tropical montane forest, and includes Sub-Andean forests, Andean forests, and sub-paramo vegetation of the Eastern Cordillera of the Andes [27]. In Sub-Andean forests, the canopy reaches heights of 45 m, within which there are stands dominated by black oak (Trigonobalanus excelsa Lozano, Hern. Cam. & Henao), most of which are found in the park’s buffer zones. These stands can represent up to 37% of the total stems [16], with an average density of 281 individuals per ha, with basal area values of 52 m2 ha−1 and a volume of 761 m3 ha−1 [28].
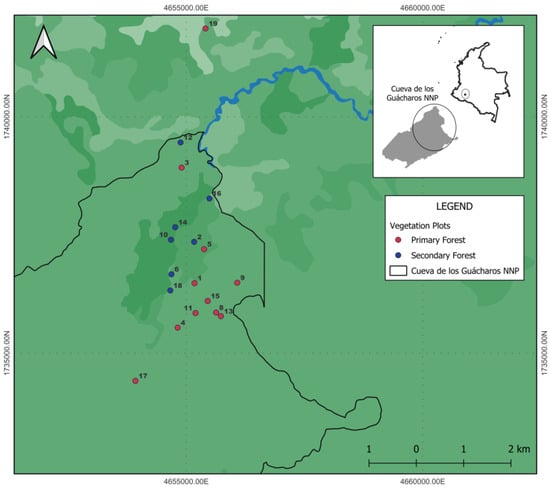
Figure 1.
Geographical location of eighteen 0.1-ha (20 m × 50 m) permanent plots in the Cueva de los Guacharos National Natural Park, Huila, Colombia. Numbers indicate unique plot identifiers used throughout the study.
The CGNNP includes two main forest types: primary and secondary forests. In this study, primary forests are defined as mature forests with more than 60 years without anthropogenic disturbance. Although some areas may have been subject to selective logging in the past, the forest canopy was never fully removed or replaced. During the study period, it had diameters of up to 163 cm and a canopy height of up to 45 m. In contrast, secondary forests correspond to areas that experienced intense anthropogenic disturbance, such as heavy timber extraction or conversion to agroecosystems. These areas began natural regeneration in 1975, following the removal of human pressures after the park’s designation as a protected area in 1960 [27]. As a result, these forests are currently in an advanced stage of secondary succession, accumulating for the first census 36 years of recovery, during which the forest structure recovered to a state similar to that of primary forests [16], with diameters of up to 130 cm and canopy heights of up to 42 m.
2.2. Field Work Setup
Eighteen 0.1-ha permanent plots were established in 2011, based on historical land-use maps; seven plots were established in secondary forests, and eleven in primary forests (Figure 1) in an elevational range from 1765 to 2600 m asl, with minimum horizontal distances of 200 m between plots, on hilly terrains with slopes exceeding 48 degrees. With the exception of plot 19 (oak forest), which is in the park’s buffer zone, all the others are located within the CGNNP. In the first census (2011), all individuals with a diameter at breast height (DBH) ≥ 2.5 cm—including trees, shrubs, palms, tree ferns, lianas, and bamboo culms—were tagged, measured for DBH, and identified to the lowest possible taxonomic level. In addition, topographic and edaphic variables were recorded, as detailed in [16]. A second census was conducted in different years between 2018 and 2024; DBH was remeasured, and new variables were added, including total height (H) and newly recruited individuals. For the purposes of analysis, we treat stems as distinct individuals. All data collection followed the standardized protocols for the establishment and monitoring of permanent vegetation plots in tropical forests [29,30].
2.3. Sampling Representativeness and Spatial Autocorrelation
To evaluate whether the sampling effort adequately captured the local species pool, we constructed a species accumulation curve using abundance data from both censuses and estimated species richness with the Chao1 index. To assess spatial autocorrelation in species composition among plots, we performed a Mantel test based on Bray–Curtis dissimilarity (computed from second-census data) and pairwise geographic distances between plots.
2.4. Demographic Rates
For each plot, we measured mortality (m), recruitment (r), change (γ), and relative annual growth (RGR) rates at the community level with exponential growth over continuous time [31] from Equations (1)–(4) in percent by year (% yr). Continuous exponential models allow for comparisons across census intervals of differing durations. Where N0 and Nt are the population size at time 0 and time t, respectively, in years; Dt is the number of dead trees at time t, and DBH at time t0 and at time t1. Additionally, the RGR was also calculated by species at the population level with more than three individuals.
To assess the potential influence of unequal census intervals, we conducted Pearson correlation tests between the number of years between censuses and demographic rates (m, r, γ, and RGR) in the 18 forest plots, along with a graphical sensitivity analysis with linear regression and 95% confidence bands (Figure S1).
2.5. Aboveground Biomass Estimation
For each individual, the total aboveground biomass (AGB) was estimated and then calculated at the plot level at t0 and t1 times. AGB was calculated using different allometric equations developed in tropical forests and then reported in Mg ha−1. For trees (Equation (5)) [32], which represented 81.4% of the stems, palms (Equation (6)) [33] accounted for 12.7% of the stems, lianas (Equation (7)) [34] for 5.8% of the stems, and bamboo (Equation (8)) [35] for 0.1% of the stems. It is worth mentioning that these allometric equations were developed for stems with DBH ≥ 10 cm, so they tend to underestimate biomass in stems of smaller diameter [32]. Therefore, to evaluate the potential bias in biomass estimation due to stem size, we calculated aboveground biomass (AGB) using two approaches: including all stems with DBH ≥ 2.5 cm and including only stems with DBH ≥ 10 cm. The results of both approaches are presented, since most individuals are in a DBH range between 2.5 and 10 cm (Figure S2).
These calculations were conducted to reduce uncertainty in other parameters necessary for calculating the AGB, such as wood density (ρ) and tree height (H). Wood density was calculated for 142 species (Table S1) representing 65.3% of the stems; for species without wood density data, we used the literature data [32,36] using the R biomass package (version 4.3.2) [37], filtering to South American species. If a species lacks wood density data in the literature, the average at the genus (20% of the stems) or family (11.5% of the stems) levels was used, and for species without taxonomic identification or without information at the family level, the average of the data set (2.6% of the stems) was used. It should be noted that of the allometric equations used, only the one for trees requires wood density.
For the second census, the height (H) of all individuals (except lianas) was measured using a hypsometer. Since height data were not available for the first census, we used the measurements from the second census to establish Pearson correlation analysis (r = 0.783) and a linear regression model between height and DBH for all tree species (y = 5.278 + 0.417x; R2 = 0.613; p = <2.2 × 10⁻¹⁶, Figure A1). This model was applied to estimate the height of all tree species in the first census. While we did not use species-specific height models due to limitations in the sample size for disaggregated modeling, several studies have shown that local models provide more accurate height predictions and reduce uncertainty in AGB estimates compared to pantropical models [38,39]. Notably, in the allometric equations used for palms and lianas, height was not a necessary input.
2.6. Productivity Estimation
Moreover, productivity (P), loss (L), and change rate (Bw) in biomass were calculated for each plot from an annualized discrete-time model [40] in Mg ha−1 year−1, so that they were comparable between plots, given that the measurement intervals are different. The equations used were Equations (9)–(11), where B0 is the initial biomass; Bt is the final biomass, and Bs is survivor biomass. To quantify the uncertainty in productivity calculations, we made separate Bw, P, and L estimates for all stems and for stems with DBH ≥ 10 cm.
2.7. Statistical Analysis
To visualize change in species composition between forest types, we performed a non-metric multidimensional scaling (NMDS) based on Bray–Curtis dissimilarity and species abundances. Additionally, a Permutational multivariate analysis of variance (PERMANOVA) was used to evaluate the statistical significance of the differences in floristic composition between forests. All statistical analyses were conducted using the R Core Team software environment (version 4.3.2) [41]; for this section, we used the vegan package [42].
For the statistical analysis of demographic rates, aboveground biomass, and productivity, non-parametric Mann–Whitney U tests were performed using the R package stats [41], to evaluate the differences between forest types in terms of mortality, recruitment, population change, annual relative growth, AGB, change rate, production, and loss of biomass.
3. Results
3.1. Species Turnover
A total of 516 species were recorded, grouped into 202 genera and 89 families. The species accumulation curve indicates that the current sampling design captures most of the floristic diversity present in the study area (Figure S3A). While the curve has not completely reached an asymptote, the deceleration in species accumulation and the narrow confidence intervals suggest a representative sampling effort. This is further supported by the Chao1 estimator, which predicts a total richness of 562 species (Figure S3A). Therefore, the observed richness (516 species) represents approximately 92% of the estimated total diversity, indicating that the sampling adequately captures the majority of species. Mantel test revealed a significant positive correlation between geographic distance and floristic dissimilarity among plots (r = 0.439, p = 0.001), suggesting that floristic dissimilarity increases with geographic distance (Figure S3B).
Regarding the spatiotemporal variation in species composition, NMDS showed plots grouped together by forest type (Figure 2), indicating significant dissimilarity between primary and secondary forests (PERMANOVA: p = 0.001), which explains 22% of the change in species composition. We found that plots 19 and 3 were dominated by black oak in primary forests, which diverged from the rest in terms of floristic composition (Figure 2). Additionally, there were no differences between censuses (Figure 2), indicating that species composition remained relatively stable over the 7–13-year interval in this study.
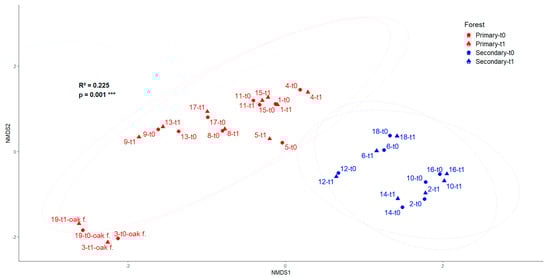
Figure 2.
NMDS (Bray–Curtis distances) ordination of the floristic composition of eighteen plots located in Huila, Colombia. oak f. (black oak plots). *** Statistical significance level p ≤ 0.001.
3.2. Forest Dynamics
In the second census, we measured a total of 6963 stems, where 1691 were new recruits and 1653 were trees that had died. We found that, in general, annual rates in terms of vegetation dynamics were higher in the secondary forest compared to the primary forest, with statistically significant differences in m, r, and relative growth rate (RGR) (Figure 3).
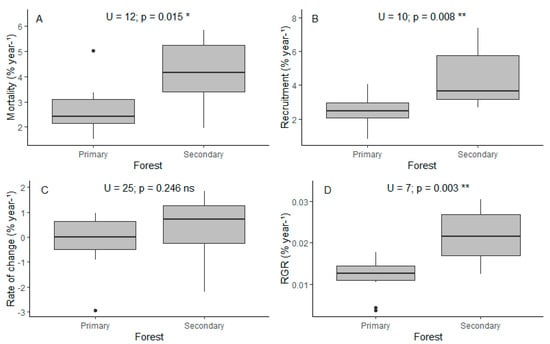
Figure 3.
(A) Mortality, (B) recruitment, (C) rate of change, and (D) relative annual growth rate in terms of percent by year for each forest type. U (Mann–Whitney U test), p (p-value). * Statistical significance level p ≤ 0.05. ** Statistical significance level p ≤ 0.01. ns Not significant.
Mortality was 4.17% and 2.68% for secondary and primary forests, respectively. Alfaroa williamsii Ant. Molina, Wettinia kalbreyeri (Burret) R.Bernal, and Miconia cremophylla Naudin are the species that die the most in primary forests, while Chamaedorea linearis (Ruiz & Pav.) Mart., Palicourea calophlebia Standl., and Saurauia brachybotrys Turcz. are the species that die the most in secondary forests (Figure S4A). Black oak forests had the lowest mortality rates (Table 1, Figure A2A). As reported in numerous studies [24], mortality was higher in stems with lower DBH (Figure S4B).

Table 1.
Demographic rates and biomass changes in Sub-Andean forest of the CGNNP, Huila, Colombia. Time interval between censuses (t), mortality (m), recruitment (r), rate of change (γ), relative annual growth rate (RGR), total aboveground biomass (AGBt1), biomass change rate (Bw), biomass production (P), and biomass loss (L). For individuals with DBH ≥ 2.5 cm and individuals with DBH ≥ 10 cm.
In terms of recruitment, we found that secondary forests had a 4.51% while primary forests had 2.51%. The most recruited species were A. williamsii and W. kalbreyeri in primary forests, and P. calophlebia, Acalypha macrostachya Jacq., Nectandra acutifolia (Ruiz & Pav.) Mez and Nectandra coeloclada Rohwer in secondary forests.
We found that the proportional rate of change was positive in secondary forest (0.34%) while being negative in primary forests (−0.17%). However, these differences are not significant (Figure 3C). We found that the total population size is decreasing at a fast rate in two plots (13 and 6, Table 1, Figure A2C), resulting from the simultaneous combination of high mortality and low recruitment.
Relative growth rate in terms of tree population was 0.022% for secondary and 0.012% for primary forests. It is worth mentioning that the results of the Pearson correlation tests between the number of years between censuses and demographic rates in 18 forest plots showed no significant correlation (mortality: r = −0.11, p = 0.66, recruitment: r = 0.12, p = 0.62, rate of change: r = 0.29, p = 0.25 and RGR: r = −0.12, p = 0.63), which indicates that the duration of the census interval did not systematically influence the demographic rates (Figure S1).
3.3. Aboveground Biomass Stocks
We found that under the full-stem approach (DBH ≥ 2.5 cm, Figure 4A,B), the total aboveground biomass (AGB) in the re-census (t1: 2018–2024) was higher in the primary forest with a mean of 447.5 ± 361 Mg ha−1 compared to the secondary forest plots with a mean of 217.2 ± 60.1 Mg ha−1, with statistically significant differences (Figure 4A). When considering only stems with DBH ≥ 10 cm (Figure 4C,D), AGB values decreased very little, although they corresponded to only 12–27.7% of the total stems measured across plots. Therefore, the AGB showed a similar pattern. Primary forests averaged 428.5 ± 360 Mg ha−1, while secondary forests averaged 199.6 ± 60.1 Mg ha−1, also differing significantly (Figure 4C). A higher AGB in primary forests was driven by black oak forests (P3 and P19), which showed high values (Table 1, Figure 4B,D), indicating greater biomass accumulation, because the dominant species Trigonobalanus excelsa Lozano, Hern. Cam. & Henao (Figure S5) is a tree with high wood density (0.753 g cm3, Table S1).
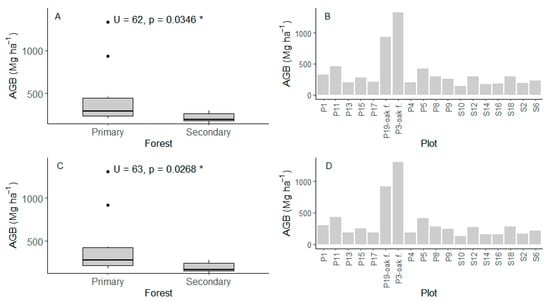
Figure 4.
Total aboveground biomass in the re-census for the forests. (A,B) individuals with DBH ≥ 2.5 cm (12–27.7% of the total stems measured). (C,D) individuals with DBH ≥ 10 cm. U (Mann–Whitney U test), p (p-value), P (primary forest), S (secondary forest), oak f. (black oak plots). * Statistical significance level p ≤ 0.05.
3.4. Productivity, Loss, and Rate of Change in Biomass
We found that under the full-stem approach (DBH ≥ 2.5 cm), the biomass change rate (Bw) was significantly higher in primary forests, with a mean of 466.8 ± 381 Mg ha−1 year−1 compared to 217.2 ± 43.3 Mg ha−1 year−1 in secondary forests (Figure 5A). When only individuals with DBH ≥ 10 cm were considered, biomass change values decreased very little, and the trend remained: primary forests averaged 444.8 ± 376 Mg ha−1 year−1, while secondary forests averaged 199.9 ± 41.8 Mg ha−1 year−1, with a statistically significant difference (Figure 5D). This difference was largely driven by black oak forests (plots 3 and 19), which showed the highest Bw values (Table 1, Figure A3A,D), representing 16.7% and 20.6%, respectively, of the total biomass change across all plots and the sampling interval.
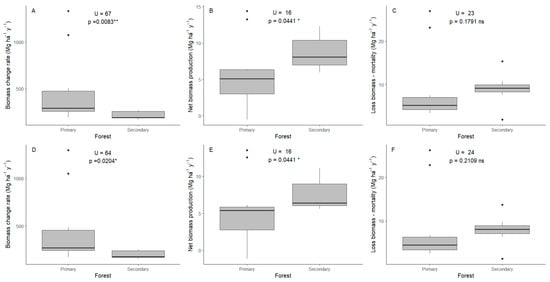
Figure 5.
Biomass change rate, biomass production, biomass loss for primary and secondary forests. (A–C) individuals with DBH ≥ 2.5 cm. (D–F) individuals with DBH ≥ 10 cm. (A,D) biomass change rates. (B,E) net biomass production. (C,F) loss of biomass–mortality. U (Mann–Whitney U test), p (p-value). * Statistical significance level p ≤ 0.05. ** Statistical significance level p ≤ 0.01. ns Not significant.
In terms of biomass production (P), under the full-stem approach, secondary forests exhibited a higher average net gain of 8.72 ± 2.53 Mg ha−1 yr−1, while primary forests had a mean of 5.66 ± 4.59 Mg ha−1 yr−1, with a statistically significant difference (Figure 5B). When the analysis was restricted to stems with DBH ≥ 10 cm, the pattern persisted: secondary forests averaged 7.60 ± 2.37 Mg ha−1 yr−1, whereas primary forests averaged 5.40 ± 4.36 Mg ha−1 yr−1, again with a significant difference (Figure 5E). Among secondary forests, plots S2 and S12 showed the highest productivity, although overall variation among these plots was low (Table 1). In contrast, productivity in primary forest plots was more variable. For example, plots P1 and P5 exhibited the highest p-values throughout the sampling period (Figure A3A,B,E), while plot P4 showed a decline of −1.14 Mg ha−1 yr−1, and plots P19 (oak forest) and P17 presented low productivity.
Biomass loss due to mortality (L) was slightly higher in secondary forests under both approaches. For DBH ≥ 2.5 cm, loss averaged 8.96 ± 4 Mg ha−1 year−1 in secondary forests and 8.64 ± 8.25 Mg ha−1 year−1 in primary forests, with no statistically significant difference (Figure 5C). For DBH ≥ 10 cm, the loss was similar between the two forest types (mean secondary forests = 7.91 ± 3.72 Mg ha−1 year−1, mean primary forests = 7.94 ± 8.33 Mg ha−1 year−1); therefore, it was not significantly different (Figure 5F). For two plots in primary forest (5 and 19-black oak, Table 1, Figure A3C,F), there were large values of biomass loss due to mortality of large individuals (DBH ≥ 100) and with high wood density, such as Quercus humboldtii Bonpl. and T. excelsa, meaning a fast loss in biomass.
3.5. Relative Growth Rate
Annual relative growth rate (RGR) is reported for 169 species (Table S1), including black oak T. excelsa (0.007%), copper Magnolia colombiana (Little) Govaerts (0.017%), black cedar Juglans neotropica Diels (0.007%), Laurel comino Aniba perutilis Hemsl. (0.008%), and white oak Quercus humboldtii (0.021%), species of conservation values (VOC) of Cueva de los Guácharos National Natural Park [27]. The species with the highest RGR were Miconia punctata (Desr.) D.Don ex DC. (0.063%), Nectandra obtusata Rohwer and Casearia combaymensis Tul. (0.053% each), Inga sapindoides Willd. (0.052%) and Ocotea puberula (Rich.) Nees (0.051%), while the species with the lowest RGR were Ormosia tovarensis Pittier (0.003%), Gordonia fruticosa (Schrad.) H.Keng and Aiphanes simplex Burret (0.004% each), Chamaedorea linearis, Ardisia cogolloi Pipoly, and Faramea flavicans (Humb. & Bonpl. ex Roem. & Schult.) Standl. (0.005% each) (Table S1).
4. Discussion
4.1. Species Turnover in Primary and Secondary Forests
Despite 53 years of natural regeneration in the Cueva de los Guácharos National Natural Park (CGNNP) in the Colombian Andes, significant differences in floristic composition (Figure 2) suggest that secondary forest tree communities have yet to converge with those of the original, primary ecosystem. This suggests that the process of floristic convergence to primary forest stages may be slower than expected, or that certain successional trajectories maintain a distinct identity due to factors such as disturbance type, land-use history, and topographic conditions [17,26]. These issues have been found in other studies, where recovery of biodiversity in Neotropical secondary forests is a prolonged process, in which the floristic composition lags behind the structural and functional recovery [13]. Given the low colonization and growth rates in tropical montane forests, recovery after disturbance is extremely slow, even when a nearby source of propagules is present, re-establishing a canopy dominated by shade-tolerant tree species may take several hundred years [43]. Although other studies suggest that some sites can reach levels of structural complexity comparable to old-growth forests within approximately 40 years after land-use abandonment, they also report that growth potential tends to decline after that period [44]. These temporal differences in the recovery of secondary forests may be related to physiological traits, as tropical trees adjust their nutrient acquisition strategies in response to changing conditions throughout succession [45]. In the case of the black oak (Trigonobalanus excelsa Lozano, Hern. Cam. & Henao) stands, their distinctive floristic composition supports the notion that dominant species can play key roles in shaping community structure, thereby contributing to the development of distinct plant assemblages [18].
4.2. Dynamics in Primary and Secondary Forests
We found that secondary forests presented higher mortality, recruitment, and annual relative growth rates than primary forests, and that the rates of change were similar (Figure 3). Previous studies have documented higher dynamics in intermediate stages—approximately 20 to 30 years—of secondary succession in tropical rainforests [46,47]. These results reflect a higher turnover of individuals in secondary forests, suggesting a phase of structural and compositional rearrangement during which intense processes of competition, self-induced mortality, and opportunistic recruitment are still occurring. In contrast, primary forests, especially black oak forests, showed lower dynamics, possibly reflecting more stable states dominated by slow-growing, long-lived species typical of mature forests [31,48].
We found that the average annual rates of dynamics in the CGNNP forests (Table 1), mortality (2.7% in primary forests and 4.1% in secondary forests), and recruitment (2.5% in primary forests and 4.5% in secondary forests) have similar values reported in a Colombian Sub-Andean old forest for individuals with DBH ≥ 1 cm with rates of mortality (3.65%) and recruitment (3.52%) [24]. On the other hand, when a higher diameter threshold (DBH ≥ 10 cm) was used for another Colombian Sub-Andean forest study, they reported considerably lower mortality (0.88%), recruitment (1.16%), and population growth (0.28%) [25]. These differences highlight the greater dynamics of smaller individuals and underscore the importance of the minimum size criterion used for inclusion in demographic analyses.
Negative or zero rates of change observed in eight plots, including two in secondary forest (Table 1), may indicate a stabilization or climax phase of the communities or potentially ongoing processes of local population decline. In several cases, these low dynamics coincide with additional red flags such as (i) high mortality relative to recruitment and (ii) negative productivity values. Likewise, species of high conservation value—Aniba perutilis, T. excelsa, Juglans neotropica Diels, and Magnolia colombiana (Little) Govaerts —display low annual relative growth rates (Table S1). The convergence of slow growth, high mortality, and negative biomass balance suggests heightened sensitivity to environmental change, underscoring the need for long-term demographic monitoring to anticipate potential population declines and the associated impacts on ecosystem stability and carbon storage.
4.3. AGB, Biomass Change Rate, and Productivity
Our results reveal consistent patterns in aboveground biomass (AGB) and biomass change rates (Bw) between primary and secondary forests in the CGNNP, with small differences in magnitude depending on the diameter threshold used. Under both approaches (DBH ≥ 2.5 cm and DBH ≥ 10 cm), total AGB was significantly higher (average of 447.5 Mg ha−1) in primary forests (Figure 4A,C), mainly due to the contribution of Trigonobalanus excelsa in black oak forests (P3: 1331.7 Mg ha−1 and P19: 936.9 Mg ha−1). This species has high wood density and dominates due to the large size of the trees. These results are consistent with similar studies. For example, in the Peruvian Andes, higher AGB values were reported in primary forests than in secondary forests, with a maximum of 358.3 Mg ha−1 [21]. Another study in Colombian Andean forests also reported higher AGB in mature forests (166.32 Mg ha−1) compared to secondary forests (56.74 Mg ha−1) [22]. And a recent study in montane forests in Panama reported AGB values of up to 574.3 Mg ha−1, which were attributed to the presence of Quercus species [23].
Biomass change rate (Bw), which integrates both production and mortality, was significantly higher in primary forests under both approaches (Figure 5A,D). This was largely due to exceptionally high values in plots (P3 and P19, Table 1, Figure A3A,D), driven by the dominance of black oak (T. excelsa), which contributes substantially to standing biomass and turnover.
In contrast, net biomass production (P) was higher in secondary forests below both diameter thresholds, with statistically significant differences (Figure 5B,E). Therefore, secondary forests gained more biomass than primary forests. This aligns with successional theory, which predicts peak biomass accumulation in intermediate stages, followed by stabilization or decline in old-growth systems. This is consistent with the widely described pattern of a unimodal curve in productivity during succession, where maximum production occurs at intermediate stages [14,49]. As has been reported for other Andean forests, where secondary stands reach AGB increments of up to 10 Mg ha−1 year−1 within the first decade of regeneration, and productivity gradually declines after 15 years to approximately 1 Mg ha−1 year−1 [50]. Our data supports these trends, which are also shaped by fast-growing pioneer species such as Nectandra obtusata Rohwer, Heliocarpus americanus L., Acalypha macrostachya Jacq., Urera caracasana (Jacq.) Gaudich. ex Griseb., Tovomitopsis myrcioides (Planch. & Triana) D’Arcy, Saurauia pulchra Sprague, Nectandra lineata (Kunth) Rohwer, Nectandra acutifolia (Ruiz & Pav.) Mez, Palicourea calophlebia Standl., and Paratrophis insignis (Bureau) E.M.Gardner (Table S1), which dominate the structure and dynamics of secondary plots.
Annual biomass increments reported in other Colombian Andean secondary forests range between 1.82 Mg ha−1 [24] and 2.9 Mg ha−1 [25]. In contrast, we found higher values, reaching on average 8.72 Mg ha−1 y−1, including individuals with DBH ≥ 2.5 cm and 7.6 Mg ha−1 y−1 when including only individuals with DBH ≥ 10 cm. It is important to note that we are aware that small plots like the ones in this study carry greater uncertainty when extrapolating AGB, as they can inflate biomass estimates—particularly due to the disproportionate influence of large trees [51]. Additionally, we found that the low biomass production in primary forests, reaching even negative values (–0.54 Mg ha−1 y−1 with DBH ≥ 2.5 cm and –1.14 Mg ha−1 y−1 with DBH ≥ 10 cm) suggest that mature ecosystems in PNNCG may be close to equilibrium or even entering phases of net carbon loss, as reported by other studies in old-growth tropical forests [52].
In terms of biomass loss due to mortality (L), differences between forest types were not statistically significant under either approach (Figure 5C,F), and the higher mortality loss on plots P5 and P19 (oak forest) likely reflects the death of large, high-wood-density individuals, with Quercus humboldtii and T. excelsa. These large individuals have a disproportionate effect on total biomass loss, suggesting that small sample mortality events can significantly influence carbon dynamics in mature forests.
Together, these findings underscore that while primary forests maintain higher total biomass stocks, their productivity is relatively low or even negative, likely reflecting an aging forest structure approaching a dynamic equilibrium or even carbon loss. Secondary forests, in contrast, act as important carbon sinks during early and intermediate successional stages, with elevated biomass production supported by rapid growth and high turnover of pioneer species. The consistency in patterns between both DBH approaches supports the robustness of the differences observed between forest types, while also highlighting the risk of underestimating biomass dynamics by excluding small stems (Figure S6), particularly in structurally diverse montane forests where a large portion of recruitment and mortality occurs among smaller size classes. Furthermore, our results on AGB values, compared with the results of the other studies mentioned [21,22,23], highlight significant regional uncertainty in biomass estimates in tropical montane forests.
4.4. Black Oak Forests Future
Floristic uniqueness of black oak (T. excelsa) forests underscores their ecological distinctiveness and high conservation value. As endemic and vulnerable ecosystems, these stands may harbor distinctive species assemblages, where the dominance of these taxa may play a key role in shaping community composition. Such strong dominance may restrict species turnover by excluding non-adapted species, potentially slowing successional processes and promoting the persistence of narrowly adapted taxa [18]. This distinct composition highlights the need for targeted conservation strategies that recognize their irreplaceable biodiversity and ecological value.
Black oak-dominated forests are particularly interesting in this study because they attains an exceptionally high AGB and biomass change rate, in part, due to its notably high wood density (0.75 g cm3) being higher than that reported for the white oak Q. humboldtii (0.64 g cm3) [32] and also the formation of dense, monodominant stands [28]. T. excelsa is an endangered, endemic tree species restricted to the Colombian Andes, with only five known locations reported across the country, and showing a decline in both its range and the number of mature individuals [53]. It has few relatives in the Neotropics; its closest taxa occur in Northern Thailand, China, and Malaysia, where species of this genus are well known for their ability to form high-biomass forests. High wood density is a key trait influencing biomass storage, as shown in tropical Upper-Andean forests where denser species contribute disproportionately to carbon stocks [22]. Together, these factors—monodominant structure, high-density wood, and phylogenetic affinity to high-biomass Asian oaks—support the exceptional biomass accumulation observed in T. excelsa woodlands and underscore their critical role in regional carbon sequestration.
On the other hand, our results show that these black oak forests show low biomass production rates compared to the other plots (Table 1, Figure A3), mainly the P19 parcel located in the park’s buffer zone (Figure 1). This suggests limited recruitment relative to mortality and senescence among dominant individuals. Although forests dominated by this species store large amounts of carbon, it is possible that low productivity in these forests is also related to wood density, since in African secondary tropical forests, high wood density was found to increase biomass stocks but reduce productivity [54], given that growth rates (RGR) are very low (Table S1). On the other hand, low productivity is likely due to adverse environmental conditions in soils with low soil fertility [27]. Due to its high economic value, T. excelsa is selectively logged in the park buffer zone, typically without the implementation of formal technical guidance [28], increasing its mortality risk relative to other coexisting species. This raises concerns about the long-term capacity of these ecosystems to function as effective carbon sinks. Our findings underscore the importance of integrating forest history, structure, and dynamics into the design of strategies for conservation and management of ecosystem services, particularly carbon capture and storage. Preserving black oak forests is essential not only for safeguarding their unique biodiversity but also for maintaining their role in carbon sequestration and climate regulation in tropical montane landscapes.
4.5. Caveats
Although our study area includes nearby plots belonging to different forest types, the Mantel test revealed a significant positive correlation between geographic distance and floristic dissimilarity among plots (Figure S3B), a common pattern described in previous studies [55]. However, in our study, geographic distance appears to have a limited effect on floristic turnover in this region, explaining only 1.4% of the variation in floristic composition [16]. Therefore, we believe that spatial autocorrelation may have minor effects on the demographic parameters found.
Despite the relatively small area sampled (1.8 ha), the network of 18 plots successfully captures meaningful gradients in species composition and spatial heterogeneity across the landscape. This provides strong evidence that secondary and primary forests in the CGNNP continue to follow distinct floristic trajectories shaped by both ecological and spatial processes.
Despite the valuable insights provided, our study is not without limitations. Biomass estimates relied on general allometric equations—particularly for palms—which may not fully capture local variation. Moreover, these equations were developed using a 10 cm DBH threshold, excluding smaller stems that, due to their high frequency, can be important for biomass recovery and forest regeneration dynamics. Additionally, a portion of the wood density values was obtained from South American databases and approximated at the genus, family, and dataset level when species-level data were unavailable, introducing uncertainty into the estimates. Our height-diameter model, based on data from the first census, also adds to this uncertainty due to temporal variation.
Future studies should prioritize expanding wood density databases through direct field sampling, incorporating smaller diameter classes, evaluating the temporal stability of height–diameter relationships, and developing more site- and taxon-specific allometric models to improve biomass estimates and provide a more comprehensive understanding of carbon dynamics across successional stages.
5. Conclusions
Results of this study provide evidence on the changes in composition, dynamics, biomass accumulation, and biomass productivity between primary and secondary Sub-Andean forests in the Cueva de los Guácharos National Natural Park (CGNNP). These findings are key to understanding how secondary succession processes progress and how forest communities reorganize after disturbances, even decades after natural regeneration. Furthermore, they show that, although secondary forests progress toward more complex states, they maintain distinct functional and compositional characteristics, even after five decades of regeneration. This type of forest, therefore, contributes not only to biodiversity conservation but also to the maintenance of key ecosystem functions such as carbon sequestration, which reinforces its value in ecological restoration strategies [56]. This study highlights the ecological importance of black oak forests (Trigonobalanus excelsa Lozano, Hern. Cam. & Henao), both for their floristic uniqueness and their substantial carbon stocks—assets that are difficult to restore if lost, due to the species’ low growth rates.
Supplementary Materials
The following supporting information can be downloaded at https://www.mdpi.com/article/10.3390/f16081256/s1, Figure S1: Sensitivity of demographic rates to census duration for 18 plots in forests of the CGNNP, Huila, Colombia. Scatterplots with linear regression and 95% confidence bands, r and p values obtained using Pearson correlation tests. Figure S2: Diameter (DBH) distribution for 18 plots in forests of the CGNNP, Huila, Colombia. Table S1: Relative growth rates (RGR for species with more than three stems evaluated) and wood density of Sub-Andean forest species in CGNNP, Huila, Colombia. Figure S3. Sampling representativeness and spatial autocorrelation in 18 plots of 0.1 ha. (A) Species accumulation curve with data from two censuses. (B) Spatial autocorrelation of community composition based on Bray–Curtis dissimilarity and geographic distance using a Mantel test (999 permutations). A LOESS curve with 95% confidence interval is fitted to visualize the trend. Figure S4: Species-specific and size-related patterns of stem mortality in tropical montane forests of the CGNNP. (A) top twenty species with the highest number of dead individuals between censuses. (B) size distribution (DBH at t0) of dead individuals. Figure S5: Species with the greatest contribution to biomass in the re-census for the forests. (A) individuals with DBH ≥ 2.5 cm. (B) individuals with DBH ≥ 10 cm. Figure S6. Relationship between diameter at breast height (DBH) and aboveground biomass (AGB). (A) data from the first census; (B) data from the second census. The dashed line shows a LOESS smoothing fit. Correlation coefficients Pearson (r) with 95% confidence interval, p < 2.2 × 10⁻¹⁶.
Author Contributions
Conceptualization, L.I.R. and P.R.S.; methodology, L.I.R.; software, L.I.R.; validation, L.I.R., C.M.P. and P.R.S.; formal analysis, L.I.R.; investigation, L.I.R.; resources, L.I.R., C.M.P. and P.R.S.; data curation, L.I.R.; writing—original draft preparation, L.I.R.; writing—review and editing, L.I.R.; visualization, L.I.R.; supervision, P.R.S. and C.M.P.; project administration, P.R.S.; funding acquisition, P.R.S., L.I.R. and C.M.P. All authors have read and agreed to the published version of the manuscript.
Funding
This research was funded by the Facultad de Ciencias of the Universidad de Los Andes, grant numbers “INV-2023-174-2935, INV-2023-176-2947 and INV-2024-188-3048”, and the APC was partially funded by Fondo Ignacio Gómez Montes, SELVA, Investigación para la conservación en el Neotrópico, grant numbers “CPS-584-BIG-2025”.
Data Availability Statement
The raw data supporting the conclusions of this article will be made available by the authors on request.
Acknowledgments
This work would not have been possible without the collaboration of CGNNP staff: Deiver Imbachi, Brayan Camilo González, Yeferson Jimenez, and Nancy Pacheco. Several field assistants, volunteers, and local guides who helped with data collection: Tomás Pinzón, Daniela Tamayo, Felipe Aramburo, Luisa Fernanda Millan, Carolina Paris, Verónica Estrada, Sergio Galvis, Joaquin Ruiz, Luz Ney Castaño, and Alejadro Fonseca.
Conflicts of Interest
The authors declare no conflicts of interest. The funders had no role in the design of this study, in the collection, analysis, or interpretation of data, or in the writing of this manuscript.
Appendix A

Figure A1.
Relationship between DBH and total height of trees with diameter ≥ 2.5 cm in the re-census. Pearson correlation coefficient = 0.783. *** Statistical significance level p ≤ 0.001.

Figure A2.
(A) Mortality, (B) recruitment, (C) rate of change, and (D) relative annual growth (RGR) per plot in primary and secondary forests.

Figure A3.
(A,D) Biomass change rate, (B,E) biomass production, and (C,F) biomass loss of the plots. (A–C) individuals with DBH ≥ 2.5 cm. (D–F) individuals with DBH ≥ 10 cm.
References
- Myers, N.; Mittermeier, R.A.; Mittermeier, C.G.; Da Fonseca, G.A.B.; Kent, J. Biodiversity hotspots for conservation priorities. Nature 2000, 403, 853–858. [Google Scholar] [CrossRef] [PubMed]
- Rahbek, C.; Borregaard, M.K.; Antonelli, A.; Colwell, R.K.; Holt, B.G.; Nogues-Bravo, D.; Ø Rasmussen, C.M.; Richardson, K.; Rosing, M.T.; Whittaker, R.J.; et al. Building Mountain biodiversity: Geological and evolutionary processes. Science 2019, 365, 1114–1119. [Google Scholar] [CrossRef] [PubMed]
- Rahbek, C.; Borregaard, M.K.; Colwell, R.K.; Dalsgaard, B.; Holt, B.G.; Morueta-Holme, N.; Nogues-Bravo, D.; Whittaker, R.J.; Fjeldså, J. Humboldt’s enigma: What causes global patterns of mountain biodiversity? Science 2019, 365, 1108–1113. [Google Scholar] [CrossRef] [PubMed]
- Homeier, J.; Breckle, S.W.; Günter, S.; Rollenbeck, R.T.; Leuschner, C. Tree diversity, forest structure and productivity along altitudinal and topographical gradients in a species-rich Ecuadorian montane rain forest. Biotropica 2010, 42, 140–148. [Google Scholar] [CrossRef]
- López, W.; Duque, Á. Patrones de diversidad alfa en tres fragmentos de bosques montanos en la región norte de los Andes, Colombia. Rev. Biol. Trop. 2010, 58, 483–498. [Google Scholar] [CrossRef] [PubMed][Green Version]
- Colwell, R.K.; Brehm, G.; Cardelus, C.L.; Gilman, A.C.; Longino, J.T. Global Warming, Elevational Range Shifts, and Lowland Biotic Attrition in the Wet Tropics. Science 2008, 322, 258–261. [Google Scholar] [CrossRef] [PubMed]
- Jarvis, A.; Touval, J.L.; Schmitz, M.C.; Sotomayor, L.; Hyman, G.G. Assessment of threats to ecosystems in South America. J. Nat. Conserv. 2010, 18, 180–188. [Google Scholar] [CrossRef]
- He, X.; Spracklen, D.V.; Holden, J.; Zeng, Z. Tropical montane forest loss dominated by increased 1–10 hectare-sized patches. Environ. Res. Lett. 2025, 20, 024039. [Google Scholar] [CrossRef]
- Duque, A.; Stevenson, P.R.; Feeley, K.J. Thermophilization of adult and juvenile tree communities in the northern tropical Andes. Proc. Natl. Acad. Sci. USA 2015, 112, 10744–10749. [Google Scholar] [CrossRef] [PubMed]
- Enquist, C.A.F. Predicted regional impacts of climate change on the geographical distribution and diversity of tropical forests in Costa Rica. J. Biogeogr. 2002, 29, 519–534. [Google Scholar] [CrossRef]
- Chave, J.; Condit, R.; Muller-Landau, H.C.; Thomas, S.C.; Ashton, P.S.; Bunyavejchewin, S.; Co, L.L.; Dattaraja, H.S.; Davies, S.J.; Esufali, S.; et al. Assessing evidence for a pervasive alteration in tropical tree communities. PLoS Biol. 2008, 6, 455–462. [Google Scholar] [CrossRef] [PubMed]
- Terrer, C.; Jackson, R.B.; Prentice, I.C.; Keenan, T.F.; Kaiser, C.; Vicca, S.; Fisher, J.B.; Reich, P.B.; Stocker, B.D.; Hungate, B.A.; et al. Nitrogen and phosphorus constrain the CO2 fertilization of global plant biomass. Nat. Clim. Chang. 2019, 9, 684–689. [Google Scholar] [CrossRef]
- Rozendaal, D.M.A.; Bongers, F.; Aide, T.M.; Alvarez-Dávila, E.; Ascarrunz, N.; Balvanera, P.; Becknell, J.M.; Bentos, T.V.; Brancalion, P.H.S.; Cabral, G.A.L.; et al. Biodiversity recovery of Neotropical secondary forests. Sci. Adv. 2019, 5, eaau3114. [Google Scholar] [CrossRef] [PubMed]
- Poorter, L.; Bongers, F.; Aide, T.M.; Almeyda Zambrano, A.M.; Balvanera, P.; Becknell, J.M.; Boukili, V.; Brancalion, P.H.S.; Broadbent, E.N.; Chazdon, R.L.; et al. Biomass resilience of Neotropical secondary forests. Nature 2016, 530, 211–214. [Google Scholar] [CrossRef] [PubMed]
- Mariscal, A.; Thomas, D.C.; Haffenden, A.; Manobanda, R.; Defas, W.; Chinchero, M.A.; Larco, J.D.S.; Jaramillo, E.; Roy, B.A.; Peck, M. Evidence for Alternate Stable States in an Ecuadorian Andean Cloud Forest. Forests 2022, 13, 875. [Google Scholar] [CrossRef]
- Prada, C.M.; Stevenson, P.R. Plant composition associated with environmental gradients in tropical montane forests (Cueva de Los Guacharos National Park, Huila, Colombia). Biotropica 2016, 48, 568–576. [Google Scholar] [CrossRef]
- Norden, N.; Chazdon, R.L.; Chao, A.; Jiang, Y.H.; Vílchez-Alvarado, B. Resilience of tropical rain forests: Tree community reassembly in secondary forests. Ecol. Lett. 2009, 12, 385–394. [Google Scholar] [CrossRef] [PubMed]
- Swenson, N.G.; Enquist, B.J.; Pither, J.; Kerkhoff, A.J.; Boyle, B.; Weiser, M.D.; Elser, J.J.; Fagan, W.F.; Forero-Montaña, J.; Fyllas, N.; et al. The biogeography and filtering of woody plant functional diversity in North and South America. Glob. Ecol. Biogeogr. 2012, 21, 798–808. [Google Scholar] [CrossRef]
- Myster, R.W. Disturbance and Response in the Andean Cloud Forest: A Conceptual Review. Bot. Rev. 2020, 86, 119–135. [Google Scholar] [CrossRef]
- Freud, C.A.; Silman, M.R. Developing a More Complete Understanding of Tropical Montane Forest Disturbance Ecology through Landslide Research. Front. For. Glob. Change 2023, 6, 1091387. [Google Scholar] [CrossRef]
- Miyamoto, K.; Sato, T.; Arana Olivos, E.A.; Clostre Orellana, G.; Stornaiuolo, C.M.R. Variation in Tree Community Composition and Carbon Stock under Natural and Human Disturbances in Andean Forests, Peru. Forests 2018, 9, 390. [Google Scholar] [CrossRef]
- Castillo-Figueroa, D.; Gonzalez-Melo, A.; Posada, J.M. Wood Density Is Related to Aboveground Biomass and Productivity along a Successional Gradient in Upper Andean Tropical Forests. Front. Plant Sci. 2023, 14, 1276424. [Google Scholar] [CrossRef] [PubMed]
- Prada, C.M.; Heineman, K.D.; Pardo, M.J.; Piponiot, C.; Dalling, J.W. Soil and Biomass Carbon Storage Is Much Higher in Central American than Andean Montane Forests. EGUsphere, 2024; preprint. [Google Scholar] [CrossRef]
- Samper, C.K.; Vallejo, M.I. Estructura y dinámica de poblaciones de plantas en un bosque andino. Rev. Acad. Colomb. Cienc. 2007, 31, 57–68. [Google Scholar] [CrossRef]
- Velásquez, R.J.O.; Maniguaje, N.L.; Duque, Á.J. Diversidad y dinámica de un bosque subandino de altitud en la región norte de los Andes colombianos. Rev. Biol. Trop. 2012, 60, 943–952. [Google Scholar] [CrossRef][Green Version]
- Chazdon, R.L. Chance and determinism in tropical forest succession. In Tropical Forest Community Ecology; Carson, W.P., Schnitzer, S.A., Eds.; Wiley-Blackwell: Oxford, UK, 2008; pp. 384–408. [Google Scholar]
- Rodriguez, Í.; Velásquez, H.; Herrera, G.; Trujillo, F. Plan de Manejo Parque Nacional Natural Cueva de los Guácharos 2022–2027 Colombia. 2021. Available online: https://www.parquesnacionales.gov.co/wp-content/uploads/2022/09/plan-de-manejo-pnn-cueva-de-los-guacharos_adop-res-142_2022.pdf (accessed on 2 June 2025).
- Dávila, D.E.; Alvis, J.F.; Ospina, R. Distribución espacial, estructura y volumen de los bosques de Roble negro (Colombobalanus excelsa (Lozano, Hern. Cam. & Henao, J.E.) Nixon & Crepet) en el Parque Nacional Natural Cueva de los Guácharos. Colomb. For. 2012, 15, 207. [Google Scholar] [CrossRef][Green Version]
- Phillips, O.L.; Baker, T.R.; Feldpausch, T.R.; Brienen, R.J.W. RAINFOR Field Manual for Plot Establishment and Remeasurement. 2021. Available online: https://forestplots.net/upload/manualsenglish/rainfor_field_manual_en.pdf (accessed on 2 June 2025).
- Vallejo, M.; Londoño, A.; López, R.; Galeano, G.; Álvarez, E.; Devia, W. Establecimiento de Parcelas Permanentes en Bosques de Colombia: Volumen I; Instituto de Investigación de Recursos Biológicos Alexander von Humboldt: Bogotá, Colombia, 2005; Available online: https://www.researchgate.net/publication/326882544_ESTABLECIMIENTO_DE_PARCELAS_PERMANENTES_EN_BOSQUES_DE_COLOMBIA (accessed on 2 June 2025).
- Sheil, D.; Burslem, D.F.; Alder, D. The interpretation and misinterpretation of mortality rate measures. J. Ecol. 1995, 83, 331–333. [Google Scholar] [CrossRef]
- Álvarez, E.; Duque, A.; Saldarriaga, J.; Cabrera, K.; de las Salas, G.; del Valle, I.; Lema, A.; Moreno, F.; Orrego, S.; Rodríguez, L. Tree above-ground biomass allometries for carbon stocks estimation in the natural forests of Colombia. For. Ecol. Manag. 2012, 267, 297–308. [Google Scholar] [CrossRef]
- Goodman, R.C.; Phillips, O.L.; Del Castillo Torres, D.; Freitas, L.; Cortese, S.T.; Monteagudo, A.; Baker, T.R. Amazon palm biomass and allometry. For. Ecol. Manag. 2013, 310, 994–1004. [Google Scholar] [CrossRef]
- Schnitzer, S.A.; DeWalt, S.J.; Chave, J. Censusing and measuring lianas: A quantitative comparison of the common methods. Biotropica 2006, 38, 581–591. [Google Scholar] [CrossRef]
- Camargo, G.J.C.; Arango, A.A.M.; Trinh, L. The potential of bamboo forests as a carbon sink and allometric equations for estimating their aboveground biomass. Environ. Dev. Sustain. 2023, 26, 20159–20187. [Google Scholar] [CrossRef]
- Zanne, A.E.; Lopez-Gonzalez, G.; Coomes, D.A.; Ilic, J.; Jansen, S.; Lewis, S.L.; Miller, R.B.; Swenson, N.G.; Wiemann, M.C.; Chave, J. Global Wood Density Database. 2009. Available online: https://datadryad.org/stash/dataset/doi:10.5061/dryad.234 (accessed on 2 June 2025).
- Réjou-Méchain, M.; Tanguy, A.; Piponiot, C.; Chave, J.; Hérault, B. biomass: An r package for estimating above-ground biomass and its uncertainty in tropical forests. Methods Ecol. Evol. 2017, 8, 1163–1167. [Google Scholar] [CrossRef]
- Baia, A.L.P.; Nascimento, H.E.M.; Guedes, M.; Hilário, R.; Toledo, J.J. Tree Height-Diameter Allometry and Implications for Biomass Estimates in Northeastern Amazonian Forests. PeerJ 2025, 13, e18974. [Google Scholar] [CrossRef] [PubMed]
- Feldpausch, T.R.; Banin, L.; Phillips, O.L.; Baker, T.R.; Lewis, S.L.; Quesada, C.A.; Affum-Baffoe, K.; Arets, E.J.M.M.; Berry, N.J.; Bird, M.; et al. Height-Diameter Allometry of Tropical Forest Trees. Biogeosciences 2011, 8, 1081–1106. [Google Scholar] [CrossRef]
- Kohyama, T.S.; Kohyama, T.I.; Sheil, D. Estimating net biomass production and loss from repeated measurements of trees in forests and woodlands: Formulae, biases and recommendations. For. Ecol. Manag. 2019, 433, 729–740. [Google Scholar] [CrossRef]
- R Core Team. R: A Language and Environment for Statistical Computing; R Foundation for Statistical Computing: Vienna, Austria, 2024; Available online: https://www.R-project.org/ (accessed on 2 June 2025).
- Oksanen, J.; Simpson, G.; Blanchet, F.G.; Kindt, R.; Legendre, P.; Minchin, P.R.; O’Hara, R.B.; Solymos, P.; Stevens, M.H.H.; Szoecs, E.; et al. Vegan: Community Ecology Package. R Package Version 2.6-8. 2024. Available online: https://CRAN.R-project.org/package=vegan (accessed on 2 June 2025).
- Golicher, D.; Newton, A.C. Applying succession models to the conservation of tropical montane forest. In Biodiversity Loss and Conservation in Fragmented Forest Landscapes: The Forests of Montane Mexico and Temperate South America; Newton, A.C., Ed.; CABI Publishing: Wallingford, UK, 2007; pp. 200–222. [Google Scholar] [CrossRef]
- Ehbrecht, M.; Lehmann, T.; Escobar, S.; Donoso, D.; Endara, M.J.; Guevara-Andino, J.E.; Blüthgen, N. Recovery of Forest Structural Complexity during Secondary Succession in the Tropics. EcoEvoRxiv 2024, preprint. [CrossRef]
- Wong, M.Y.; Wurzburger, N.; Hall, J.S.; Wright, S.J.; Tang, W.; Hedin, L.O.; Saltonstall, K.; van Breugel, M.; Batterman, S.A. Trees adjust nutrient acquisition strategies across tropical forest secondary succession. New Phytol. 2024, 243, 132–144. [Google Scholar] [CrossRef] [PubMed]
- Finegan, B. Pattern and process in neotropical secondary rain forests: The first 100 years of succession. Trends Ecol. Evol. 1996, 11, 119–124. [Google Scholar] [CrossRef] [PubMed]
- Letcher, S.G.; Chazdon, R.L. Rapid recovery of biomass, species richness, and species composition in a forest chronosequence in northeastern Costa Rica. Biotropica 2009, 41, 608–617. [Google Scholar] [CrossRef]
- Phillips, O.L.; Hall, P.; Gentry, A.H.; Sawyer, S.A.; Vásquez, R. Dynamics and species richness of tropical rain forests. Proc. Natl. Acad. Sci. USA 1994, 91, 2805–2809. [Google Scholar] [CrossRef] [PubMed]
- Peña-Claros, M.; Fredericksen, T.S.; Alarcón, A.; Blate, G.M.; Choque, U.; Leaño, C.; Licona, J.C.; Mostacedo, B.; Pariona, W.; Villegas, Z.; et al. Beyond reduced-impact logging: Silvicultural treatments to increase growth rates of tropical trees. For. Ecol. Manag. 2012, 256, 1458–1467. [Google Scholar] [CrossRef]
- Spracklen, D.V.; Righelato, R. Carbon storage and sequestration of re-growing montane forests in southern Ecuador. For. Ecol. Manag. 2016, 364, 139–144. [Google Scholar] [CrossRef]
- Chave, J.; Condit, R.; Aguilar, S.; Hernandez, A.; Lao, S.; Perez, R. Error Propagation and Scaling for Tropical Forest Biomass Estimates. Philos. Trans. R. Soc. Lond. B Biol. Sci. 2004, 359, 409–420. [Google Scholar] [CrossRef] [PubMed]
- Brienen, R.J.W.; Phillips, O.L.; Feldpausch, T.R.; Gloor, E.; Baker, T.R.; Lloyd, J.; Lopez-Gonzalez, G.; Monteagudo-Mendoza, A.; Malhi, Y.; Lewis, S.L.; et al. Long-term decline of the Amazon carbon sink. Nature 2015, 519, 344–348. [Google Scholar] [CrossRef] [PubMed]
- Aguirre-Acosta, N.; Parra Aldana, C.A.; Botero, J.E. Trigonobalanus excelsa. The IUCN Red List of Threatened Species 2020: e.T32076A137102918. Available online: https://www.iucnredlist.org/species/32076/137102918 (accessed on 30 May 2025).
- Matsuo, T.; Poorter, L.; van der Sande, M.T.; Abdul, S.M.; Koyiba, D.W.; Opoku, J.; de Wit, B.; Kuzee, T.; Amissah, L. Drivers of Biomass Stocks and Productivity of Tropical Secondary Forests. Ecology 2024, 105, e4488. [Google Scholar] [CrossRef] [PubMed]
- Tuomisto, H.; Ruokolainen, K.; Yli-Halla, M. Dispersal, environment, and floristic variation of western Amazonian forests. Science 2003, 299, 241–244. [Google Scholar] [CrossRef] [PubMed]
- Chazdon, R.L.; Peres, C.A.; Dent, D.; Sheil, D.; Lugo, A.E.; Lamb, D.; Stork, N.E.; Miller, S.E. The potential for species conservation in tropical secondary forests. Conserv. Biol. 2009, 23, 1406–1417. [Google Scholar] [CrossRef] [PubMed]
Disclaimer/Publisher’s Note: The statements, opinions and data contained in all publications are solely those of the individual author(s) and contributor(s) and not of MDPI and/or the editor(s). MDPI and/or the editor(s) disclaim responsibility for any injury to people or property resulting from any ideas, methods, instructions or products referred to in the content. |
© 2025 by the authors. Licensee MDPI, Basel, Switzerland. This article is an open access article distributed under the terms and conditions of the Creative Commons Attribution (CC BY) license (https://creativecommons.org/licenses/by/4.0/).