Abstract
Regeneration of Pinus brutia (Turkish red pine) after clear-cutting is showing failures in some low-elevation Mediterranean stands, raising questions about long-used silvicultural prescriptions. Because site limitations arise from the combined effects of climate, terrain, and surface thermal conditions that vary over short distances, diagnosing where problems may occur is challenging at operational scales. In this study, we first evaluate the study area (Antalya, Türkiye, 0–400 m elevation band) using open, long-term climatic indicators, along with terrain and surface thermal remote sensing variables, to describe recent environmental conditions relevant to germination and early seedling survival. We then build a transparent environmental-analog screening product that summarizes the degraded reference site as an environmental signature and computes pixel-wise similarity across the landscape at 100 m resolution. The resulting map reports three actionable tiers (≥95th, 90–95th, 85–90th percentiles), delineating compact clusters of very-high analogs surrounded by broader high/elevated belts. Interpreted strictly as a screening layer (not a predictive model), it supports compartment-scale triage: ≥95th areas are first candidates for field checks and adjusted prescriptions, while lower tiers guide targeted site preparation and monitoring. The novelty and importance are practical: widely available Earth observation data are converted into a reproducible, auditable tool that reduces dependence on complex predictive models and large calibration samples, while still requiring careful local interpretation and ground-truthing to inform P. brutia regeneration planning.
1. Introduction
Climate change and increasing disturbance are reshaping forest ecosystems worldwide, threatening their structure, function, and regenerative capacity [1,2,3]. Due to their long generation times, forest trees adapt slowly to rapid climatic shifts, often resulting in regeneration failure, altered species distributions, and increased mortality under drought and heat stress [4]. In Mediterranean-type ecosystems, where water scarcity already limits productivity, rising temperature and atmospheric dryness intensify soil moisture deficits and constrain seedling establishment [5,6]. Practical, early-warning tools are therefore needed to help managers identify locations where standard prescriptions are unlikely to succeed and where adaptive measures should be prioritized.
Forests across Europe, particularly temperate and Mediterranean forests, are experiencing rapid shifts in structure and composition due to climate change. Species such as Fagus sylvatica (European beech) have shown increasing crown dieback and mortality in response to repeated droughts and warming in regions like Switzerland and southern Germany [7]. Similarly, Mediterranean pines—including Pinus halepensis (Aleppo pine)—are exhibiting growth declines and reduced regeneration as heat and drought stress intensify [8]. These trends reflect a broader pattern of species’ climatic niches shifting upward in elevation or northward in latitude under warming scenarios [9,10]. This growing instability underscores the need for applied, decision-support products, not only post hoc assessments but also screening maps that triage sites before regeneration investments are made.
Pinus brutia Ten. (Turkish red pine) is the widely distributed and ecologically significant conifer species in Türkiye, dominating large portions of the Aegean and Mediterranean regions. Traditionally, Pinus brutia regenerates naturally after clear-cutting or wildfire through abundant seed production and rapid early growth [11]. This silvicultural system has been preferred for decades due to its imitation of the Turkish red pine’s strategy of germinating and rapidly growing in open areas and under light, similar to post-fire conditions. The clear-cut method has long been considered one of the most effective silvicultural strategies for this species, ensuring dense regeneration under favorable climatic and edaphic conditions. In Turkish red pine regeneration practice, success is evaluated not only by the mere emergence of seedlings in the field, but also by their homogeneous spatial distribution, healthy development, and completion of at least two vegetation periods. In Turkish forestry applications, the commonly accepted lower threshold of 60% regeneration success means that at least 60% of the systematic sampling points in a regeneration area must contain one or more healthy seedlings within a 2 m frame; this threshold is a critical management criterion that accounts for the species’ early-stage mortality, competitive dynamics, and environmental variability across the site. Success assessment is based on seedling counts conducted with a 2 m frame at systematic sampling points arranged parallel to contour lines, with separate tally sheets for each species, providing a quantitative, spatially robust picture of regeneration across the stand [11]. However, in recent years, reports of regeneration failure have increased, even in areas historically known for successful recovery [12,13,14]. These failures are thought to be linked to warming trends, prolonged dry seasons, and increased vapor pressure deficit (VPD), which shortens the spring moisture window crucial for germination and early seedling survival. For managers, these observations raise a concrete question: where are current site conditions already drifting outside the envelope that previously supported reliable Pinus brutia regeneration?
The resilience of Mediterranean pine forests depends strongly on local soil characteristics, topographic position, and microclimatic gradients [15]. Shallow or rocky soils, typical of Pinus brutia stands, offer limited water retention, leaving seedlings vulnerable to heat and drought extremes during establishment. Accordingly, operational guidance benefits from jointly considering terrain (e.g., slope, heat load), climatic water balance, and surface thermal conditions when prioritizing stands for intervention (e.g., shading/mulch, microsite selection, assisted planting, or altered timing). Thus, understanding the interaction between terrain, climate, and regeneration success is essential for designing adaptive management strategies under climate change.
Remote sensing provides a vital framework for such assessments. Since the 1970s, satellite-based Earth Observation has enabled consistent monitoring of forest cover, biomass, and ecosystem dynamics worldwide [16]. Remote sensing has also been extensively used to analyze forest regeneration and post-disturbance recovery, particularly following wildfire or clear-cut events [17,18]. For example, Landsat and Sentinel time series have been employed to monitor burn severity and subsequent regrowth in Pinus brutia and other Mediterranean conifers [19]. Vegetation indices such as the Normalized Difference Vegetation Index (NDVI) and Enhanced Vegetation Index (EVI) remain key indicators of canopy recovery and productivity trends, increasingly accessible through cloud-based platforms such as Google Earth Engine (GEE) [20,21,22]. Yet for regeneration failure, managers often need a simple, map-based signal of “environmental mismatch”, not an elaborate algorithmic advance. In a screening context, these capabilities can be redirected from “what happened” to “where similar conditions are emerging”.
At the same time, remote sensing has become central to monitoring climate change impacts on forests, allowing the integration of spectral, thermal, and bioclimatic indicators [23]. Long-term datasets such as MODIS, Landsat, and Sentinel-2 have enabled detection of shifts in greenness (NDVI, EVI), leaf area index (LAI), and solar-induced chlorophyll fluorescence (SIF), linking these directly to climatic anomalies and water stress [24,25,26,27]. Moreover, high-resolution climatic datasets such as TerraClimate [26] and WorldClim v2 [28] provide critical variables, precipitation, temperature, potential evapotranspiration, and VPD, that underpin the analysis of drought and moisture stress affecting regeneration success. These datasets enable an environmental analog approach that is transparent, reproducible, and directly interpretable by practitioners.
Integrating remote sensing with climatic and terrain metrics has become increasingly common for diagnosing environmental constraints on forest regeneration and stress. For instance, Zhao et al. (2023) utilized multi-sensor satellite datasets and VPD anomalies to link physiological stress with canopy decline across global forest biomes [29], while Anderegg et al. (2020) combined satellite observations with climatic water balance metrics to quantify the risk of drought-induced forest mortality [30]. Similar hybrid approaches have been applied to model post-fire regeneration dynamics in Mediterranean conifers by merging Landsat time-series NDVI, terrain variables, and climate data such as precipitation and temperature anomalies [18,31]. These studies demonstrate the value of coupling Earth Observation with high-resolution gridded climate products, such as TerraClimate and WorldClim, to detect and predict vegetation recovery or failure across heterogeneous landscapes. However, most prior work emphasizes monitoring or forecasting. Here, we focus on management-oriented screening. We apply a data-driven environmental similarity framework to identify geographic “analogs” of a known regeneration failure site. By combining terrain, climatic, and surface thermal variables in a standardized multivariate space, we highlight regions that share the same limiting conditions—i.e., “analog degradation zones” where regeneration of Pinus brutia is least likely under current climate conditions.
Thus, the main goal of this research is to identify and characterize the environmental factors underlying the recent failure of Pinus brutia regeneration following clear-cutting in a region where the species has historically regenerated successfully. Using remote sensing and climatic datasets, the study aims to (i) determine whether the observed regeneration failure is linked to changing environmental conditions and (ii) map operationally relevant areas that share similar environmental characteristics. The intent in this research is not to predict outcomes with certainty but to provide a triage layer that guides field checks and adaptive prescriptions. We provide open, reproducible workflows (GEE code and variables) and note limits, a few calibration sites, and unsupervised thresholds—to aid local interpretation. By identifying these “analog degradation zones”, the research provides an early-warning framework for forestry management, enabling decision-makers to identify sites at higher risk of unsuccessful regeneration before replanting or clear-cut operations are carried out.
2. Materials and Methods
2.1. Study Area
Our study uses a cluster of naturally regenerated Pinus brutia compartments within their native range, on the 0–400 elevation band in Mediterranean region, located around 30.86–30.94° E and 37.11–37.18° N (Figure 1). The region has a typical Mediterranean climate, with hot, dry summers and mild, wet winters. Mean annual temperatures are around 18–20 °C, summer maximum temperatures frequently exceed 30 °C, and annual precipitation is concentrated in the cool season, generally 700–1000 mm, with pronounced summer drought. Soils in the study area are shallow to moderately deep, often stony, and developed over limestone and marl, conditions that make successful natural regeneration sensitive to both moisture availability and seedbed quality.
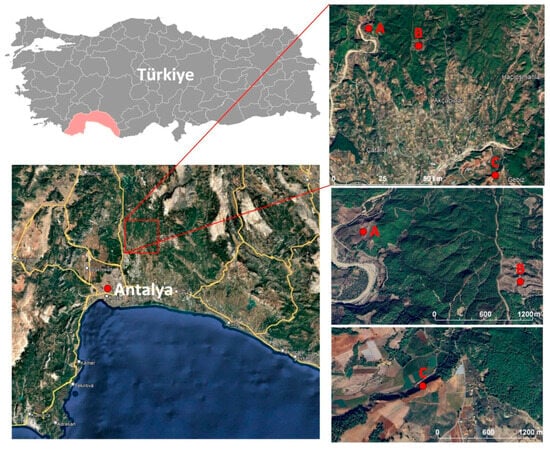
Figure 1.
Study areas over Landsat RGB image (with pink, Antalya administrative borders).
Pinus brutia is the dominant conifer in low-elevation Mediterranean forests of Türkiye and forms extensive even-aged stands in Antalya due to clear-cut–coppice conversion histories, repeated regeneration cuts, and post-fire management. In this region, natural regeneration after clearcutting or fire is usually considered reliable when seed years, seedbed preparation, and browsing pressure are favorable, but failures do occur on particularly dry, shallow, or compacted sites. The regeneration practices applied in our study areas (clearcutting, repeated seeding, and, where necessary, hand-terrace planting) are standard for Pinus brutia management in coastal Mediterranean districts. Therefore, although the specific results are grounded in Antalya’s climate and soils, the patterns we observe are likely relevant for other low-elevation Pinus brutia forests and comparable dry Mediterranean conifer systems that experience similar summer drought and site constraints.
The focal “failure” areas have been noticed over several sites, including Study Area A (30.86581°, 37.17904°), where clearcutting was carried out in 2021, seeding was attempted both before and after harvest, and regeneration failed across the whole block (Figure 2); Study Area B, where harvest was initiated late 2022 and completed January 2023, where natural regeneration with repeated seeding in 2022 and 2023 failed over ~20 ha.; and Study Area C, where clear-cutting was done in 2023, and natural regeneration failed. Thus, in Study Area C, hand-terrace planting has been implemented because of regeneration failure in 2024, and now, it is under monitoring, with a success assessment planned for autumn 2025 (Figure 3). To assess site conditions, on 9 October 2025, we visited the study sites, collected photographs (Figure 2 and Figure 3), and noted ground evidence consistent with the records above, which we used to connect with and interpret the remote sensing analysis. While study area A has been used for training the model, study areas B and C have been used for model validation.
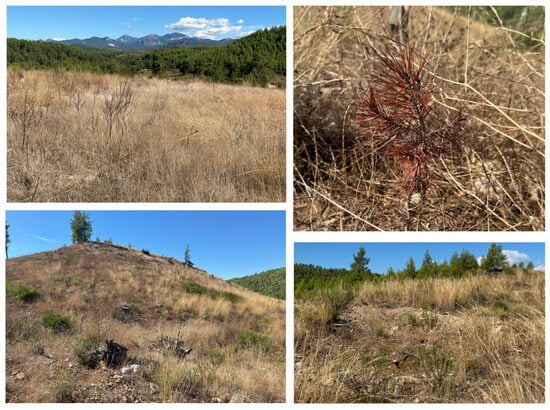
Figure 2.
Photographs collected on site on 9 October 2025, study area A (Images taken by Alper Ahmet Özbey).
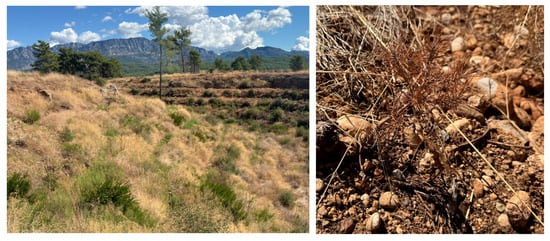
Figure 3.
Photographs collected on site on 9 October 2025, study area C (Images taken by Alper Ahmet Özbey).
2.2. Data
The datasets used in this study were processed and analyzed within the GEE cloud-based platform, which enables large-scale geospatial computation using multi-source satellite and climate archives. All data layers were harmonized to a 100 m spatial resolution using bilinear resampling to ensure spatial consistency across products originating from different sources and resolutions. Temporal data (e.g., TerraClimate) were aggregated to seasonal or annual averages, and environmental layers were spatially aligned and clipped to the study area. The workflow integrated open-access datasets from the National Aeronautics and Space Administration (NASA), the European Space Agency (ESA), and other scientific data repositories to provide a unified framework for climatic and environmental assessment. This spatial/temporal harmonization supports a management-relevant screening map that can be interpreted at stand/compartment scales. All GEE scripts and parameter files are openly available (repository link in Supplementary Materials) to facilitate reproducibility.
2.2.1. Climatic Data
To assess the climatic drivers influencing Pinus brutia regeneration and to perform temporal diagnostics of environmental change, we used long-term climate data from the TerraClimate dataset [32]. TerraClimate provides monthly climate and climatic water balance variables at a ~4 km spatial resolution from 1958 to the present, downscaled using the WorldClim climatology [28]. From this dataset, four key variables were selected: precipitation (PR), potential evapotranspiration (PET), VPD, and mean air temperature (Tmean). These variables jointly represent the major components of the regional hydroclimatic regime influencing forest regeneration potential. Their selection is physiologically motivated: spring moisture supply (PR), atmospheric demand (PET, VPD), and temperature (Tmean) directly constrain germination and early seedling survival in Mediterranean systems.
For each variable, both annual and spring (March–June) aggregates were computed to capture conditions relevant to seed germination and early seedling establishment.
To emphasize long-term rather than inter-annual variability, all climatic variables were further smoothed using a five-year rolling mean, calculated by averaging each year with the two preceding and two following years. This approach, commonly applied in climate and ecological analyses [33,34], reduces short-term noise and highlights persistent climatic trends that are more relevant to ecosystem responses such as regeneration failure or vegetation stress. By applying this temporal smoothing, we identified gradual yet consistent increases in temperature and atmospheric dryness that would not be apparent in single-year anomalies.
The analysis covered the period 1985–2024, providing a 40-year record that encompasses multiple drought and recovery cycles. These processed variables are summarized in Table 1.

Table 1.
Climatic variables used in this study; diagnostics over the reference area.
To quantify these long-term patterns, we regressed the 5-year rolling means of annual mean temperature, annual VPD, and annual water deficit on year and reported the derived slopes (per decade), coefficients of determination (R2), and p-values. In addition, we applied non-parametric Mann–Kendall trend tests to the same smoothed series to assess the robustness of the monotonic trends.
2.2.2. Terrain and Environmental Variables
To complement the climatic datasets, we used topographic and environmental layers that influence microclimate and soil–water interactions. Elevation, slope, and aspect were derived from the Shuttle Radar Topography Mission (SRTM) Digital Elevation Model at 30 m resolution [35]. From these, northness and eastness were computed as the cosine and sine of the aspect (in radians), providing continuous indices of exposure to solar radiation and prevailing winds. A Heat Load Index (HLI) was then calculated following the formulation of McCune & Keon [36] to approximate potential solar radiation on sloped surfaces, which is known to affect surface temperature and evapotranspiration rates. For surface energy conditions, Land Surface Temperature (LST) was derived from Landsat 8 and 9 Collection 2 Level-2 data for the period 2019–2024, using the calibrated thermal band (ST_B10). Temperatures were converted from radiance to °C using the standard scaling coefficients provided by the USGS [37]. To characterize vegetation structure, the NDVI was computed from Sentinel-2 Surface Reflectance imagery for 2019–2024 using the Near InfraRed (B8) and Red (B4) bands. Cloudy pixels were removed using the scene-level cloud probability filter (<20%). Additionally, long-term bioclimatic gradients were incorporated from the WorldClim v1 Bioclimatic dataset [38], specifically BIO1 (annual mean temperature), BIO12 (annual precipitation), BIO4 (temperature seasonality), and BIO15 (precipitation seasonality). All raster layers were harmonized to a 100 m target grid using bilinear resampling before being integrated into the site similarity analysis (Table 2).
Table 2.
Terrain and environmental variables used for the 100 m similarity and site description.
2.3. Methods
The workflow integrates a long-term climatic assessment with a spatial similarity analysis to (i) identify multi-year climatic stress periods for Pinus brutia and (ii) map environmentally analogous areas at 100 m resolution. All processing was done in GEE; layers from Section 3 were harmonized to a common grid, aligned, and analyzed at scale.
2.3.1. Climatic and Environmental Situation Assessment
Monthly TerraClimate variables (PR, PET, VPD, Tmean) were aggregated to annual and spring (March–June) summaries for 1985–2024. PET and VPD were converted to physical units using dataset scale factors (×0.1 → mm for PET; ×0.01 → kPa for VPD). The water deficit was computed as PET − PR. To highlight persistent trends relevant for regeneration responses, we applied a five-year rolling mean (centered; Y − 2…Y + 2) to each series, a standard approach to suppress inter-annual noise and emphasize decadal signals. Plots were used to identify periods when (i) temperature and VPD rose above baseline and (ii) water deficit remained elevated, indicating compound heat–dryness stress during the germination/establishment window.
2.3.2. Similarity Mapping
Building on the climatic assessment, a spatial similarity analysis was conducted to identify areas sharing comparable environmental characteristics with the degraded Pinus brutia site (Study Area A—Figure 1), where regeneration failure is currently observed. The objective was to locate analog environments likely to experience similar climatic and topographic constraints, providing a spatial framework for understanding where regeneration success is least probable under present conditions.
All environmental variables were first harmonized to a 100 m spatial resolution and projected to a common coordinate system using bilinear resampling in GEE [39]. To ensure comparability among variables with differing units and ranges, each layer was standardized using a robust z-score transformation based on the median and interquartile range [40]. This method minimizes the effect of outliers and allows diverse datasets—such as terrain, temperature, and precipitation—to be compared within a unified multidimensional space.
We derived a reference environmental signature by averaging the standardized values of all variables within a 100 m buffer around the degraded site. Environmental similarity for all other pixels was then quantified as the Euclidean distance between each pixel’s standardized values and the reference vector in feature space [41]. The resulting distance image was normalized to the 2nd–98th percentile range to reduce the influence of extreme values, then inverted to yield a similarity index (1 − normalized distance). Pixels with higher similarity values indicate areas with environmental conditions closely resembling those in which regeneration has failed, suggesting they may be similarly constrained.
The final similarity surface integrates topographic (elevation, slope, aspect-derived northness and eastness, heat load index), bioclimatic (annual mean temperature, precipitation, and their seasonal variability), and surface thermal (LST) parameters. Water bodies, agricultural areas and urban areas, and negative elevations were masked to exclude non-terrestrial areas. Areas within the top 10%–15% of similarity were interpreted as environmentally analogous to the degraded reference zone, providing a spatial reference for prioritizing adaptive management and climate-resilient afforestation planning [42,43]. This makes it particularly suitable for understanding the mechanisms of regeneration failure in semi-arid Mediterranean ecosystems, where climatic stress outweighs management variability [44,45]. Consistent with the screening intent, we do not claim causal inference; instead, the maps flag “analog degradation zones” where standard regeneration prescriptions may warrant adjustment (e.g., microsite selection, shading/mulch, assisted planting, altered sowing windows). All GEE code, parameters, and masks used to generate the similarity layers are provided in a public repository (link in Supplementary Materials) to facilitate reuse by practitioners.
3. Results
3.1. Climatic and Environmental Situation Assessment
The climatic analysis revealed a clear and accelerating trend of warming and drying in the study area over the past four decades (1985–2024), directly influencing the regeneration dynamics of Pinus brutia. The five-year rolling averages of key climatic indicators highlight the magnitude and consistency of this shift. Annual mean temperature has increased steadily from approximately 16.5 °C in the late 1980s to about 19 °C in recent years, indicating a regional warming of nearly 2.5 °C (Figure 4A).
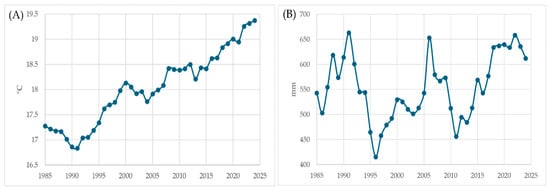
Figure 4.
(A) 5-yr Rolling Mean: Annual Mean Temp (°C); (B) 5-yr Rolling Mean: Annual Water Deficit (mm).
The 5-year rolling mean of annual temperature shows a strong warming trend over 1985–2024, increasing by 0.59 °C per decade (R2 = 0.92, p < 0.001; Mann–Kendall τ = 0.83, p < 0.001). Annual VPD likewise increases by 0.056 kPa per decade (R2 = 0.87, p < 0.001; τ = 0.82, p < 0.001), indicating a marked rise in atmospheric evaporative demand. Water deficit tends to increase by 16.7 mm per decade, but with a weaker trend (R2 = 0.09, p = 0.058; τ = 0.21, p = 0.053), suggesting a shift towards drier conditions that is consistent with, but less statistically robust than, the temperature and VPD trends. These results support the visual interpretation of Figure 2 that the study area has experienced a clear long-term shift toward warmer, more evaporative conditions, with indications of increasing water deficit.
This progressive thermal rise enhances potential evapotranspiration, accelerates soil moisture depletion, and shortens the duration of favorable conditions for germination and seedling establishment. In particular, the extension of warm periods into late spring and early autumn lengthens the physiological stress window for young seedlings, which are highly sensitive to temperature and moisture fluctuations during their first growth phase.
At the same time, the annual water deficit (potential evapotranspiration minus precipitation) has remained persistently high, ranging between 400 mm and 700 mm (Figure 4B). Such values indicate a chronic imbalance between atmospheric demand and available soil water, even in years with near-normal rainfall totals. This hydrological stress is further amplified on south-facing slopes and shallow soils, where rapid surface evaporation and limited infiltration prevent seedlings from accessing sufficient moisture. Consequently, although cone production and germination may occur, seedling survival beyond the first summer remains extremely low.
Parallel to these patterns, VPD has shown a gradual yet significant increase, rising from ~0.9 kPa in the mid-1980s to ~1.2 kPa after 2020 (Figure 5A). Higher VPD levels indicate drier air and greater evaporative demand, intensifying transpirational water loss in needles and young shoots. Under such conditions, stomatal regulation tightens and transpirational demand outpaces shallow root access, increasing the likelihood of early-season mortality.
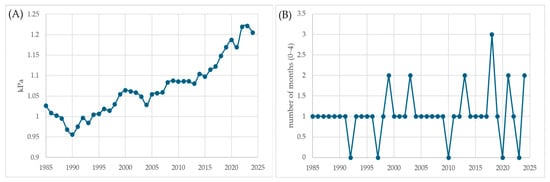
Figure 5.
(A) 5-yr Rolling Mean: Annual VPD (kPa); (B) Number of spring months (March–June) with VPD > 1.2 kPa.
Furthermore, the number of spring months (March–June) with VPD > 1.2 kPa has notably increased during the past decade (Figure 5B). This means that the traditional germination period now frequently overlaps with episodes of atmospheric drought, drastically reducing establishment success. These findings indicate that regeneration failure is not driven by a single anomalous year but by the cumulative effect of repeated unfavorable springs and persistently high annual stress levels.
To identify the years when Pinus brutia regeneration was most likely to fail, the temporal behavior of three key climatic stressors was analyzed: annual water deficit (PET–PR), annual VPD, and spring VPD frequency (number of March–June months with VPD > 1.2 kPa). Each variable was examined through its 5-year rolling mean to emphasize multi-year drought sequences rather than short-term fluctuations.
Years were considered critical when multiple indicators simultaneously exceeded their long-term means—specifically, when (1) water deficit surpassed 550 mm, (2) annual VPD exceeded 1.1 kPa, and (3) at least two spring months had VPD values above 1.2 kPa. The graphical trends (Figure 4 and Figure 5) indicate that these conditions were most prominent during the periods of 2007–2008, 2016–2018, and 2020–2022. The absolute thresholds of 550 mm and 1.1 kPa were chosen empirically from the long-term series. In our record, annual water deficits above ~550 mm and annual VPD above ~1.1 kPa are observed in only a minority of years and mark the upper tail of the distribution (Figure 4 and Figure 5), where conditions clearly depart from typical interannual variability. We therefore interpret these cut-offs as capturing years with pronounced soil and atmospheric drought stress, rather than merely “dry” years, and use them as a conservative criterion to flag compound hot-drought conditions.
These periods combine persistent soil moisture shortages, high atmospheric dryness, and record-high temperatures, forming a compound stress regime that severely limits seedling establishment. Consequently, Pinus brutia regeneration failure in the study area is most plausibly linked to these years of concurrent heat and drought stress, during which both soil and air moisture deficits exceeded the species’ physiological tolerance.
3.2. Environmental-Analog Screening Map (Similarity Mapping)
The regeneration failure reference lies on low-relief coastal foothill terrain within the 0–400 m band. Within the 100 m buffer, elevation centers at 139 m with a narrow interquartile range of [133–145 m], and slopes are gentle to moderate at 7° [6–7°], consistent with short ridges and spurs rather than deeply dissected hillslopes. Aspect-derived indices reveal a clear exposure tendency toward the southwest: northness has a median of −0.703 [−0.722 to −0.274] and eastness a median of −0.670 [−0.944 to −0.660], indicating facets that face away from the north and east. These exposures typically receive greater insolation in spring and early summer than neighboring north- or east-facing facets.
Surface and background climate summaries indicate a warm, relatively homogeneous microsite. Spring LST aggregates at 20.880 °C [20.879–20.881 °C], with a very small spread across pixels in the buffer, suggesting locally consistent surface-energy conditions at this scale. The long-term backdrop from TerraClimate shows annual mean air temperature of 17.88 °C [17.87–17.90 °C] and annual precipitation of 882.6 mm [882.1–883.4 mm]. Seasonality metrics provide regional context: temperature seasonality (BIO4) centers near 6378 [6374.7–6378.8] and precipitation seasonality (BIO15) near 88.60 [88.55–88.66] (unit conventions per dataset metadata). Together, these values describe a low-elevation, south- to south-west-facing, warm microsite typical of coastal foothills in Antalya.
The similarity analysis yields a screening map of environmental analogs to the degraded Pinus brutia site. First, we present a general similarity map of the study area (Figure 6), and afterward, we display three percentiles of the similarity index to aid decision-making: ≥95th (very-high analog; red), 90–95th (high; orange), and 85–90th (elevated; yellow) (Figure 5). Values closer to 1 indicate environments more like failure reference.
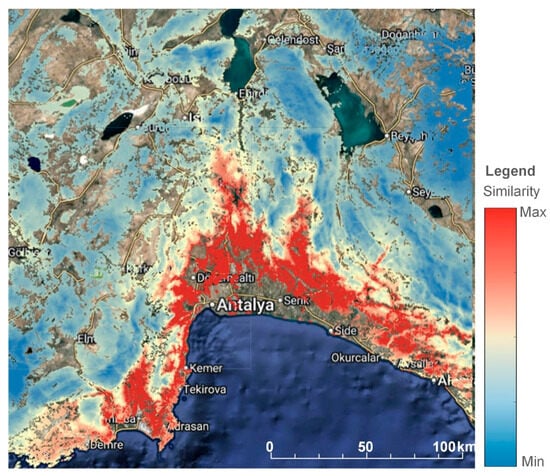
Figure 6.
General overview of the similarity map of the study area.
The spatial patterns reveal that within the 0–400 m elevation band, the environmental-analog index identifies compact clusters of very high similarity (≥95th percentile) along the coastal foothills of the Antalya region, with continuity on low-relief ridges and short spurs extending toward valley mouths. The 90–95th percentile class forms broader belts that surround or connect these red clusters, and the 85–90th percentile class extends into adjacent terrain as thinner, discontinuous patches. As expected from the percentile definition, the ≥95th class is a subset of the 90–95th class, which in turn is contained within the 85–90th class (Figure 7).
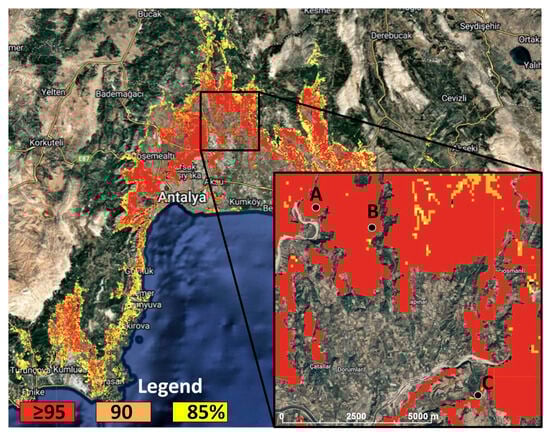
Figure 7.
Management screening map of analog degradation zones: ≥95/90/85th percentiles, sites A–B–C.
The results serve as a screening product rather than a predictive model. Areas at or above the 95th percentile represent the closest environmental matches to the failure reference and are therefore the most suitable candidates for field verification before applying standard regeneration prescriptions. Zones in the 90–95th percentile provide the next tier for inspection and targeted site preparation, and the 85–90th percentile indicates elevated similarity where local soil information and stand history should guide decisions. The intent is to prioritize compartments for on-the-ground checks and, where necessary, to adjust operational choice. The map ranks environments solely by similarity and does not attribute mechanisms or outcomes. As seen from Figure 7, Study Areas B and C fall within the “very high risk” category (≥95th percentile), where current regeneration failure is observed.
4. Discussion
Most Earth Observation studies in Mediterranean forests document what happened (disturbance, recovery, species mapping) or aim to predict outcomes, often at the cost of interpretability or portability. We instead deliver a pre-emptive screening layer: a transparent, variable-defined map that flags “analog degradation zones”—places whose multivariate environment already resembles a known failure site. This directly supports on-the-ground triage and resource allocation, which current restoration guidance identifies as a practical gap addressed by tools that aid implementation and prioritization under uncertainty [46]. In parallel, our workflow leverages the mainstream operational tool chain (GEE + Remote Sensing), increasingly used for day-to-day decision support in forestry, thereby strengthening practical uptake [47].
The results of this study should state that high similarity indicates that the environmental envelope (terrain, bioclimate, surface thermal) matches the degraded reference, not a failure diagnosis. It should be treated as a priority index for reconnaissance and tailored prescriptions. This risk-first interpretation aligns with restoration practice emphasizing practical, context-aware tools rather than deterministic claims, especially where site conditions and stakeholder realities vary widely [46].
We did not directly map soils/seedbed condition, browsing/competition, or post-harvest microsite variability. The literature is unequivocal that these factors strongly modulate Mediterranean pine regeneration: soil water retention (e.g., sandy/rocky soils) elevates seedling mortality; uncontrolled grazing depresses recruitment; and woody competitors and fern cover can suppress establishment, though shrubs may also facilitate survival by buffering heat and radiation [48]. These context-specific drivers are precisely why a screening layer is valuable: it narrows the search space, enabling field teams to target the unmodeled local filters that determine success or failure.
Large-scale syntheses in Mediterranean pines show that regeneration outcomes emerge from interactions among aridity, competition/facilitation, and structure—often with non-linear responses along stress gradients [49]. Our maps elevate the climatic–topographic backdrop within which those local filters operate, consistent with reports that failures have risen regionally where drought, seedbed limits, and biotic pressures coincide [48]. In restoration practice, barriers such as competing vegetation, browsing, and harsh site conditions repeatedly limit passive recovery—our screening helps anticipate such hotspots for earlier, more efficient intervention [46].
Three sources of uncertainty are worth noting:
- i
- The distance metric is descriptive: it ranks how closely environments resemble the degraded reference but does not prove the same processes are operating. Treat high similarity as risk prioritization, not a failure verdict.
- ii
- The environmental signature comes from one degraded area. Thresholds are therefore conservative and intended for triage; transfer to dissimilar settings should be cautious until additional success/failure sites allow calibrated cutoffs.
- iii
- Key drivers—soils/seedbed, browsing/competition, post-harvest microsites—are not mapped, and harmonizing inputs to 100 m introduces resampling and scale mismatches. Percentile normalization yields a relative index, not probabilities.
In practice, the map should be used to prioritize field checks, focus verification on unmodeled filters (e.g., soil depth/rockiness, seedbed moisture, competing cover, browsing), and to consider simple sensitivity tests (e.g., alternate buffers/predictors) to gauge robustness. In polygons labeled “very high risk” (≥95th percentile), standard clear-cut and natural regeneration prescriptions can be deferred or replaced with lower-impact approaches; openings should be downsized from the typical ≤25-ha clear-cuts to smaller patches to maintain microclimate continuity; retention-based systems such as shelterwood or group selection can be preferred to preserve shade and near-surface moisture; and, where slope permits, mechanical site preparation (e.g., ripping/scarification) should be required to ensure seed-to-mineral-soil contact and improve early water infiltration. Each operational decision should be paired with targeted field verification of the above filters and documented with a brief sensitivity check before finalizing prescriptions.
The workflow itself—robust standardization, reference-based similarity, and explicit masks—transfers to other low-elevation Pinus brutia zones under comparable climate regimes. What must be re-derived locally is the reference signature (i.e., the degraded site used to define the environmental envelope) and any land-use/soils masks reflecting local realities. Caution is warranted where edaphic conditions, disturbance histories, or management regimes (e.g., sustained heavy grazing) diverge markedly from the reference context; in such cases, the index should be read as a hypothesis generator requiring targeted ground checks. On the Earth Observation side, the inputs (multi-temporal optical signals and simple topography) align with established operational practice and can be extended with higher-detail sources where available.
For future work, three developments would increase field value and analytical confidence. First, incorporate soil and seedbed proxies to downscale uncertainty and explain outliers. Second, build a small library of reference sites that includes both failures and successes to calibrate similarity thresholds, enable cross-region transfer tests, and formalize “inspect vs. intervene” tiers. Third, package the product as decision support: a short field form focusing on the unmapped filters (soil, seedbed, competition, browsing), plus routine sensitivity checks (alternate buffers, predictor subsets, resampling schemes) to report the stability of top-tier analogs. Together, these steps keep the tool squarely in its intended role—prioritizing where to look and what to test next—while making its limits and strengths transparent to managers.
5. Conclusions
We present a preemptive, reference-driven screening map that highlights “analog degradation zones” where the environmental envelope already matches that of a known regeneration failure site for Pinus brutia. The index is descriptive, not causal: high similarity prioritizes field checks and tailored prescriptions rather than declaring failure. Used this way, it helps managers focus on the unmapped filters that matter on the ground—soils/seedbed, competition, and browsing—and adjust silviculture (microsite selection, shading/mulch, protection, assisted planting, timing). The workflow is transparent and transferable to other low-elevation Pinus brutia regions after re-deriving a local reference signature and can be adapted to other species. Future work will incorporate soil/seedbed and browsing proxies and expand the library of reference sites (successes and failures) to calibrate thresholds and test regional transferability. Overall, the product supports risk-aware, cost-effective regeneration planning under a warming, drying climate.
Supplementary Materials
The following supporting information can be downloaded at: https://code.earthengine.google.com/c9dda8a49b22572fd4fa04656b5812a9 (accessed on 2 December 2025).
Author Contributions
Conceptualization, A.A.Ö. and G.K.; methodology, A.A.Ö. and G.K.; software, G.K.; validation, A.A.Ö.; formal analysis, G.K.; investigation, A.A.Ö. and G.K.; data curation, A.A.Ö.; writing—original draft preparation, G.K.; writing—review and editing, A.A.Ö.; visualization, G.K.; supervision, A.A.Ö. All authors have read and agreed to the published version of the manuscript.
Funding
This research received no external funding.
Data Availability Statement
All the data used in this paper are open source. The full working GEE pipeline is given in the Supplementary Materials.
Acknowledgments
The authors have reviewed and edited the output and take full responsibility for the content of this publication. This article is based on work from COST Action CA22136 “Pan-European Network of Green Deal Agriculture and Forestry Earth Observation Science” (PANGEOS), supported by COST (European Cooperation in Science and Technology).
Conflicts of Interest
The authors declare no conflicts of interest.
Abbreviations
The following abbreviations are used in this manuscript:
| VPD | Vapor Pressure Deficit (kPa) |
| NDVI | Normalized Difference Vegetation Index |
| EVI | Enhanced Vegetation Index |
| GEE | Google Earth Engine |
| HLI | Heat Load Index |
| LAI | Leaf Area Index |
| LST | Land Surface Temperature |
| MODIS | Moderate Resolution Imaging Spectroradiometer |
| PET | Potential Evapotranspiration (mm) |
| PR | Precipitation (mm) |
| SIF | Solar-Induced chlorophyll Fluorescence |
| SRTM | Shuttle Radar Topography Mission |
| Tmean | Mean Air Temperature (°C) |
References
- Allen, C.D.; Breshears, D.D.; McDowell, N.G. On underestimation of global vulnerability to tree mortality and forest die-off from hotter drought in the Anthropocene. Ecosphere 2015, 6, 1–55. [Google Scholar] [CrossRef]
- Senf, C.; Seidl, R. Mapping the forest disturbance regimes of Europe. Nat. Sustain. 2021, 4, 63–70. [Google Scholar] [CrossRef]
- Zhao, J.; Wang, H.; Shilong, Z.; Xiaowei, C.; Yang, Y. Reframing Adaptive Forest Management to Sustain Ecosystem Services Under Climate Change. Forests 2025, 16, 1377. [Google Scholar] [CrossRef]
- Aitken, S.N.; Bemmels, J.B. Time to get moving: Assisted gene flow of forest trees. Evol. Appl. 2016, 9, 271–290. [Google Scholar] [CrossRef]
- Vicente-Serrano, S.M.; Gouveia, C.; Camarero, J.J.; Beguería, S.; Trigo, R.; López-Moreno, J.I.; Azorín-Molina, C. Response of vegetation to drought time-scales across global land biomes. Proc. Natl. Acad. Sci. USA 2013, 110, 52–57. [Google Scholar] [CrossRef]
- Yuan, W.; Zheng, Y.; Piao, S.; Ciais, P.; Lombardozzi, D.; Wang, Y.; Ryu, Y. Increased atmospheric vapor pressure deficit reduces global vegetation growth. Sci. Adv. 2019, 5, eaax1396. [Google Scholar] [CrossRef]
- Frei, E.R.; Gossner, M.M.; Vitasse, Y.; Queloz, V.; Dubach, V.; Gessler, A.; Ginzler, C.; Hagedorn, F.; Meusburger, K.; Moor, M.; et al. European beech dieback after premature leaf senescence during the 2018 drought in northern Switzerland. Plant Biol. 2022, 24, 1132–1145. [Google Scholar] [CrossRef]
- Valeriano, C.; Gazol, A.; Colangelo, M.; Camarero, J.J. Drought drives growth and mortality rates in three pine species under Mediterranean conditions. Forests 2021, 12, 1700. [Google Scholar] [CrossRef]
- Hanewinkel, M.; Cullmann, D.A.; Schelhaas, M.J.; Nabuurs, G.J.; Zimmermann, N.E. Climate change may cause severe loss in the economic value of European forest land. Nat. Clim. Change 2013, 3, 203–207. [Google Scholar] [CrossRef]
- Pretzsch, H.; Del Río, M.; Grote, R.; Klemmt, H.-J.; Ordóñez, C.; Bravo Oviedo, F. Tracing drought effects from the tree to the stand growth in temperate and Mediterranean forests. Eur. J. For. Res. 2022, 141, 727–751. [Google Scholar] [CrossRef]
- Melih, B.; Dirik, H.; Çalikoğlu, M. Kızılçamın (Pinus brutia Ten.) Biyolojisi ve Silvikültürü; Ankara Ogem-Vak: Ankara, Türkiye, 2006. [Google Scholar]
- Baykara, M.; Eşen, D. Post-fire natural regeneration and early growth of Turkish red pine (Pinus brutia) seedlings in western Türkiye. Forestist 2024, 20, 1–6. [Google Scholar] [CrossRef]
- Stevens-Rumann, C.S.; Prichard, S.J.; Whitman, E.; Parisien, M.-A.; Meddens, A.J. Considering regeneration failure in the context of changing climate and disturbance regimes in western North America. Can. J. For. Res. 2022, 52, 1281–1302. [Google Scholar] [CrossRef]
- Petrie, M.D.; Hubbard, R.M.; Bradford, J.B.; Kolb, T.E.; Noel, A.; Schlaepfer, D.R.; Bowen, M.A.; Fuller, L.R.; Moser, W.K. Widespread regeneration failure in ponderosa pine forests of the southwestern United States. For. Ecol. Manag. 2023, 545, 121208. [Google Scholar] [CrossRef]
- Ganatsas, P.; Giannakaki, M.; Gouvas, A.; Tsakaldimi, M. Is the Reproduction Capacity of Pinus brutia Stands 20 Years after Wildfire Efficient to Secure Forest Restoration in the Case of a Fire Re-Occurrence? Forests 2021, 12, 991. [Google Scholar] [CrossRef]
- Labrière, N.; Davies, S.J.; Disney, M.I.; Duncanson, L.I.; Herold, M.; Lewis, S.L.; Phillips, O.L.; Quegan, S.; Saatchi, S.S.; Schepaschenko, D.G.; et al. Toward a forest biomass reference measurement system for remote sensing applications. Glob. Change Biol. 2023, 29, 827–840. [Google Scholar] [CrossRef]
- Martín-Alcón, S.; Coll, L.; de Cáceres, M. Combining aerial LiDAR and multispectral imagery to assess postfire regeneration types in a Mediterranean forest. Can. J. For. Res. 2015, 45, 856–866. [Google Scholar] [CrossRef]
- Fernández-Manso, A.; Quintano, C.; Fernández-Manso, O. Assessing post-fire vegetation recovery using Landsat-8 time-series in Mediterranean pine forests. Int. J. Appl. Earth Obs. Geoinf. 2021, 99, 102342. [Google Scholar]
- Kavgacı, A.; Örtel, E.; Torres, I.; Safford, H. Early postfire vegetation recovery of Pinus brutia forests: Effects of fire severity, prefire stand age, and aspect. Turk. J. Agric. For. 2016, 40, 723–736. [Google Scholar] [CrossRef]
- Güzel, A.; Bıçaklı, K.; Bıçaklı, F.; Kaplan, G. Monitoring the regeneration process of areas destroyed by forest fires aided by Google Earth Engine. Kastamonu Univ. J. For. Fac. 2021, 21, 122–130. [Google Scholar] [CrossRef]
- Gibson, R.K.; White, L.A.; Hislop, S.; Nolan, R.H.; Dorrough, J. The post-fire stability index: A new approach to monitoring post-fire recovery by satellite imagery. Remote Sens. Environ. 2022, 280, 113151. [Google Scholar] [CrossRef]
- Söderberg, D.N.; Das, A.J.; Stephenson, N.L.; Meyer, M.D.; Brigham, C.A.; Flickinger, J. Assessing giant sequoia mortality and regeneration following high-severity wildfire. Ecosphere 2024, 15, e4789. [Google Scholar] [CrossRef]
- Murcia-García, U.G.; Sterling, A.; Rodríguez-Espinoza, J.; Carrero-Rincón, J.A.; Acosta-Salinas, M.I.; Rodríguez-León, C.H. Climate-Change Impacts on Distribution of Amazonian Woody Plant Species Key to Conservation, Restoration and Sustainable Use in the Colombian Amazon. Forests 2025, 16, 1640. [Google Scholar] [CrossRef]
- Frankenberg, C.; O’Dell, C.; Berry, J.; Guanter, L.; Joiner, J.; Köhler, P.; Pollock, R.; Taylor, T.E. Prospects for chlorophyll fluorescence remote sensing from OCO-2. Remote Sens. Environ. 2014, 147, 1–12. [Google Scholar] [CrossRef]
- Zhu, Z.; Piao, S.; Myneni, R.B.; Huang, M.; Zeng, Z.; Canadell, J.G.; Ciais, P.; Sitch, S.; Friedlingstein, P.; Arneth, A.; et al. Greening of the Earth and its drivers. Nat. Clim. Change 2016, 6, 791–795. [Google Scholar] [CrossRef]
- Forkel, M.; Dorigo, W.; Lasslop, G.; Chuvieco, E.; Hantson, S.; Heil, A.; Teubner, I.; Thonicke, K.; Harrison, S.P. Recent global and regional trends in burned area and their compensating environmental controls. Environ. Res. Commun. 2019, 1, 051005. [Google Scholar] [CrossRef]
- Seddon, A.W.R.; Macias-Fauria, M.; Long, P.R.; Benz, D.; Willis, K.J. Sensitivity of global terrestrial ecosystems to climate variability. Nature 2016, 531, 229–232. [Google Scholar] [CrossRef] [PubMed]
- Fick, S.E.; Hijmans, R.J. WorldClim 2: New 1-km climate surfaces. Int. J. Climatol. 2017, 37, 4302–4315. [Google Scholar] [CrossRef]
- Zhao, D.; Zhang, Z.; Zhang, Y. Soil moisture dominates the forest productivity decline during the 2022 China compound drought-heatwave event. Geophys. Res. Lett. 2023, 50, e2023GL104539. [Google Scholar] [CrossRef]
- Anderegg, W.R.L.; Wolf, A.; Arango-Velez, A.; Choat, B.; Chmura, D.J.; Jansen, S.; Martínez-Vilalta, J. Plant water potential improves prediction of empirical drought mortality thresholds across trees. Proc. Natl. Acad. Sci. USA 2020, 117, 7542–7548. [Google Scholar]
- Ziegler, J.P.; Hoffman, C.M.; Fornwalt, P.J.; Sieg, C.H.; Battaglia, M.A.; Chambers, M.E.; Iniguez, J.M. Tree re-generation spatial patterns in ponderosa pine forests following stand-replacing fire. Forests 2017, 8, 391. [Google Scholar] [CrossRef]
- Abatzoglou, J.T.; Dobrowski, S.Z.; Parks, S.A.; Hegewisch, K.C. TerraClimate, a high-resolution global dataset of monthly climate and climatic water balance from 1958–2015. Sci. Data 2018, 5, 170191. [Google Scholar] [CrossRef] [PubMed]
- Zhao, J.; Gan, T.Y.; Zhang, G.; Zhang, S. Projected changes of precipitation extremes in North America using CMIP6 multi-climate model ensembles. J. Hydrol. 2023, 621, 129598. [Google Scholar] [CrossRef]
- Li, D.; Vose, R.S.; Wu, Z. Changes in U.S. surface temperature variability across climate regions. J. Clim. 2020, 33, 3345–3360. [Google Scholar]
- Farr, T.G.; Rosen, P.A.; Caro, E.; Crippen, R.; Duren, R.; Hensley, S.; Kobrick, M.; Paller, M.; Rodriguez, E.; Roth, L. The Shuttle Radar Topography Mission. Rev. Geophys. 2007, 45, RG2004. [Google Scholar] [CrossRef]
- McCune, B.; Keon, D. Equations for potential annual direct incident radiation and heat load. J. Veg. Sci. 2002, 13, 603–606. [Google Scholar] [CrossRef]
- Chander, G.; Markham, B.L.; Helder, D.L. Summary of current radiometric calibration coefficients for Landsat MSS, TM, ETM+, and EO-1 ALI sensors. Remote Sens. Environ. 2009, 113, 893–903. [Google Scholar] [CrossRef]
- Hijmans, R.J.; Cameron, S.E.; Parra, J.L.; Jones, P.G.; Jarvis, A. Very high resolution interpolated climate surfaces for global land areas. Int. J. Climatol. 2005, 25, 1965–1978. [Google Scholar] [CrossRef]
- Gorelick, N.; Hancher, M.; Dixon, M.; Ilyushchenko, S.; Thau, D.; Moore, R. Google Earth Engine: Planetary-scale geospatial analysis for everyone. Remote Sens. Environ. 2017, 202, 18–27. [Google Scholar] [CrossRef]
- Rousseeuw, P.J.; Leroy, A.M. Robust Regression and Outlier Detection; John Wiley & Sons: New York, NY, USA, 1987. [Google Scholar]
- Wilson, J.P.; Gallant, J.C. Terrain Analysis: Principles and Applications; Wiley: New York, NY, USA, 2000. [Google Scholar]
- Dobrowski, S.Z. A climatic basis for microrefugia: The influence of terrain on climate. Glob. Change Biol. 2011, 17, 1022–1035. [Google Scholar] [CrossRef]
- Serra-Diaz, J.M.; Franklin, J.; Ninyerola, M.; Davis, F.W.; Syphard, A.D.; Regan, H.M.; Ikegami, M. Bioclimatic velocity: The pace of species exposure to climate change. Divers. Distrib. 2013, 20, 169–180. [Google Scholar] [CrossRef]
- Quézel, P.; Médail, F. Ecology and Biogeography of Mediterranean Basin Forests; Springer: Berlin/Heidelberg, Germany, 2003. [Google Scholar]
- Çolak, A.H.; Rotherham, I.D.; Çelik, D. Introduction of Pinus brutia Ten. into degraded forests of Turkey: Ecology, silviculture and management implications. Forestry 2009, 82, 555–568. [Google Scholar]
- Höhl, M.; Ahimbisibwe, V.; Stanturf, J.A.; Elsasser, P.; Kleine, M.; Bolte, A. Forest landscape restoration—What generates failure and success? Forests 2020, 11, 938. [Google Scholar] [CrossRef]
- Wang, Z.; Chen, X.; Zou, S. Optimal Phenology Windows for Discriminating Populus euphratica and Tamarix chinensis in the Tarim River Desert Riparian Forests with PlanetScope Data. Forests 2025, 16, 1560. [Google Scholar] [CrossRef]
- Ribeiro, S.; Cerveira, A.; Soares, P.; Fonseca, T. Natural regeneration of maritime pine: A review of the influencing factors and proposals for management. Forests 2022, 13, 386. [Google Scholar] [CrossRef]
- Tíscar, P.A.; Linares, J.C. Large-scale regeneration patterns of Pinus nigra subsp. salzmannii: Poor evidence of increasing facilitation across a drought gradient. Forests 2014, 5, 1–20. [Google Scholar] [CrossRef]
Disclaimer/Publisher’s Note: The statements, opinions and data contained in all publications are solely those of the individual author(s) and contributor(s) and not of MDPI and/or the editor(s). MDPI and/or the editor(s) disclaim responsibility for any injury to people or property resulting from any ideas, methods, instructions or products referred to in the content. |
© 2025 by the authors. Licensee MDPI, Basel, Switzerland. This article is an open access article distributed under the terms and conditions of the Creative Commons Attribution (CC BY) license (https://creativecommons.org/licenses/by/4.0/).