Figure Legend
In the original publication [1], there was a mistake in the legend for “Figure 3b”. “Sample plots F2 and F3 are duplicated in the map and need to be filled in with the correct F3 sample plot”. The correct legend appears below. The authors state that the scientific conclusions are unaffected. This correction was approved by the Academic Editor. The original publication has also been updated.
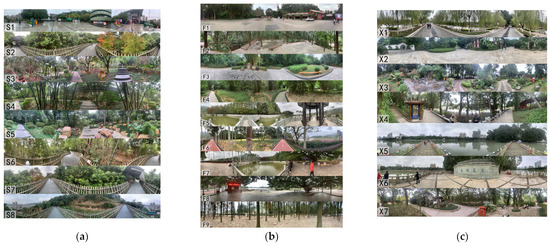
Figure 3.
(a) Plots of Jinniushan Sports Park; (b) plots of Fuzhou National Forest Park; (c) plots of Xihu Park.
Reference
- Lan, Y.; Tang, Y.; Liu, Z.; Yao, X.; Zhu, Z.; Liu, F.; Li, J.; Dong, J.; Chen, Y. Combined Effects of the Visual–Acoustic Environment on Public Response in Urban Forests. Forests 2024, 15, 858. [Google Scholar] [CrossRef]
Disclaimer/Publisher’s Note: The statements, opinions and data contained in all publications are solely those of the individual author(s) and contributor(s) and not of MDPI and/or the editor(s). MDPI and/or the editor(s) disclaim responsibility for any injury to people or property resulting from any ideas, methods, instructions or products referred to in the content. |
© 2024 by the authors. Licensee MDPI, Basel, Switzerland. This article is an open access article distributed under the terms and conditions of the Creative Commons Attribution (CC BY) license (https://creativecommons.org/licenses/by/4.0/).