Forest Aboveground Biomass Estimation and Inventory: Evaluating Remote Sensing-Based Approaches


Abstract
1. Introduction
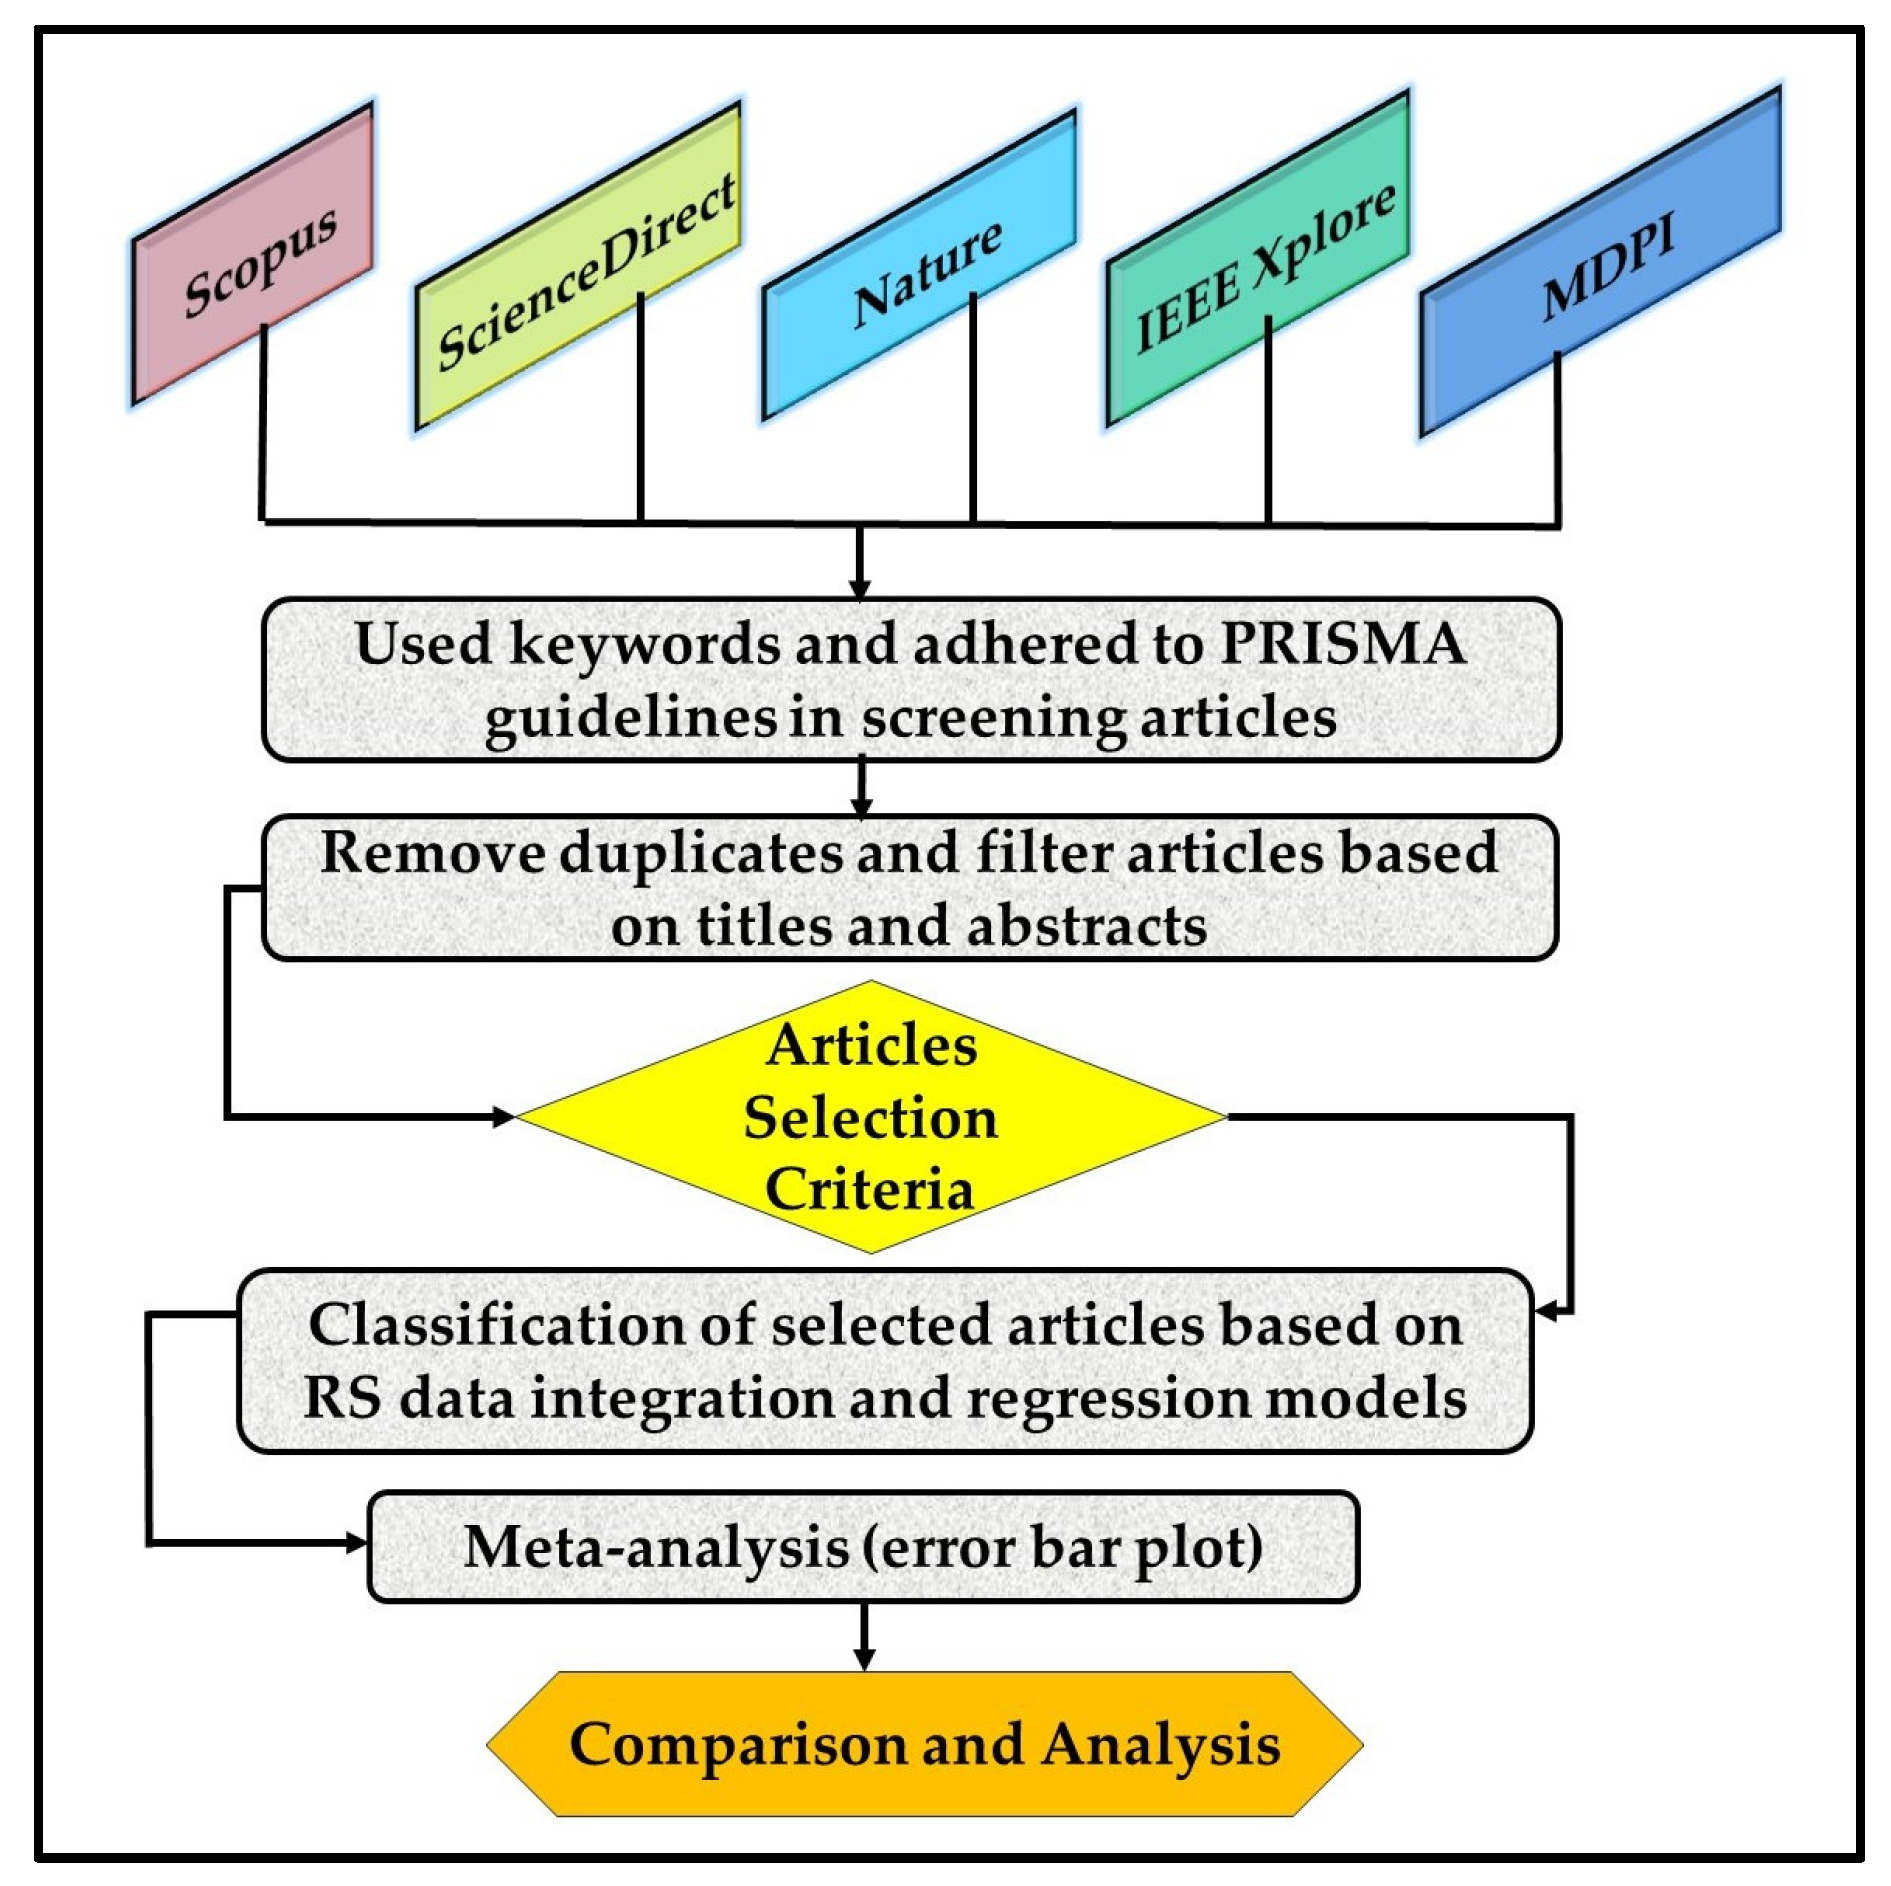
2. Materials and Methods
2.1. Search Approach and Terms
2.2. Timeline and Sources of Data
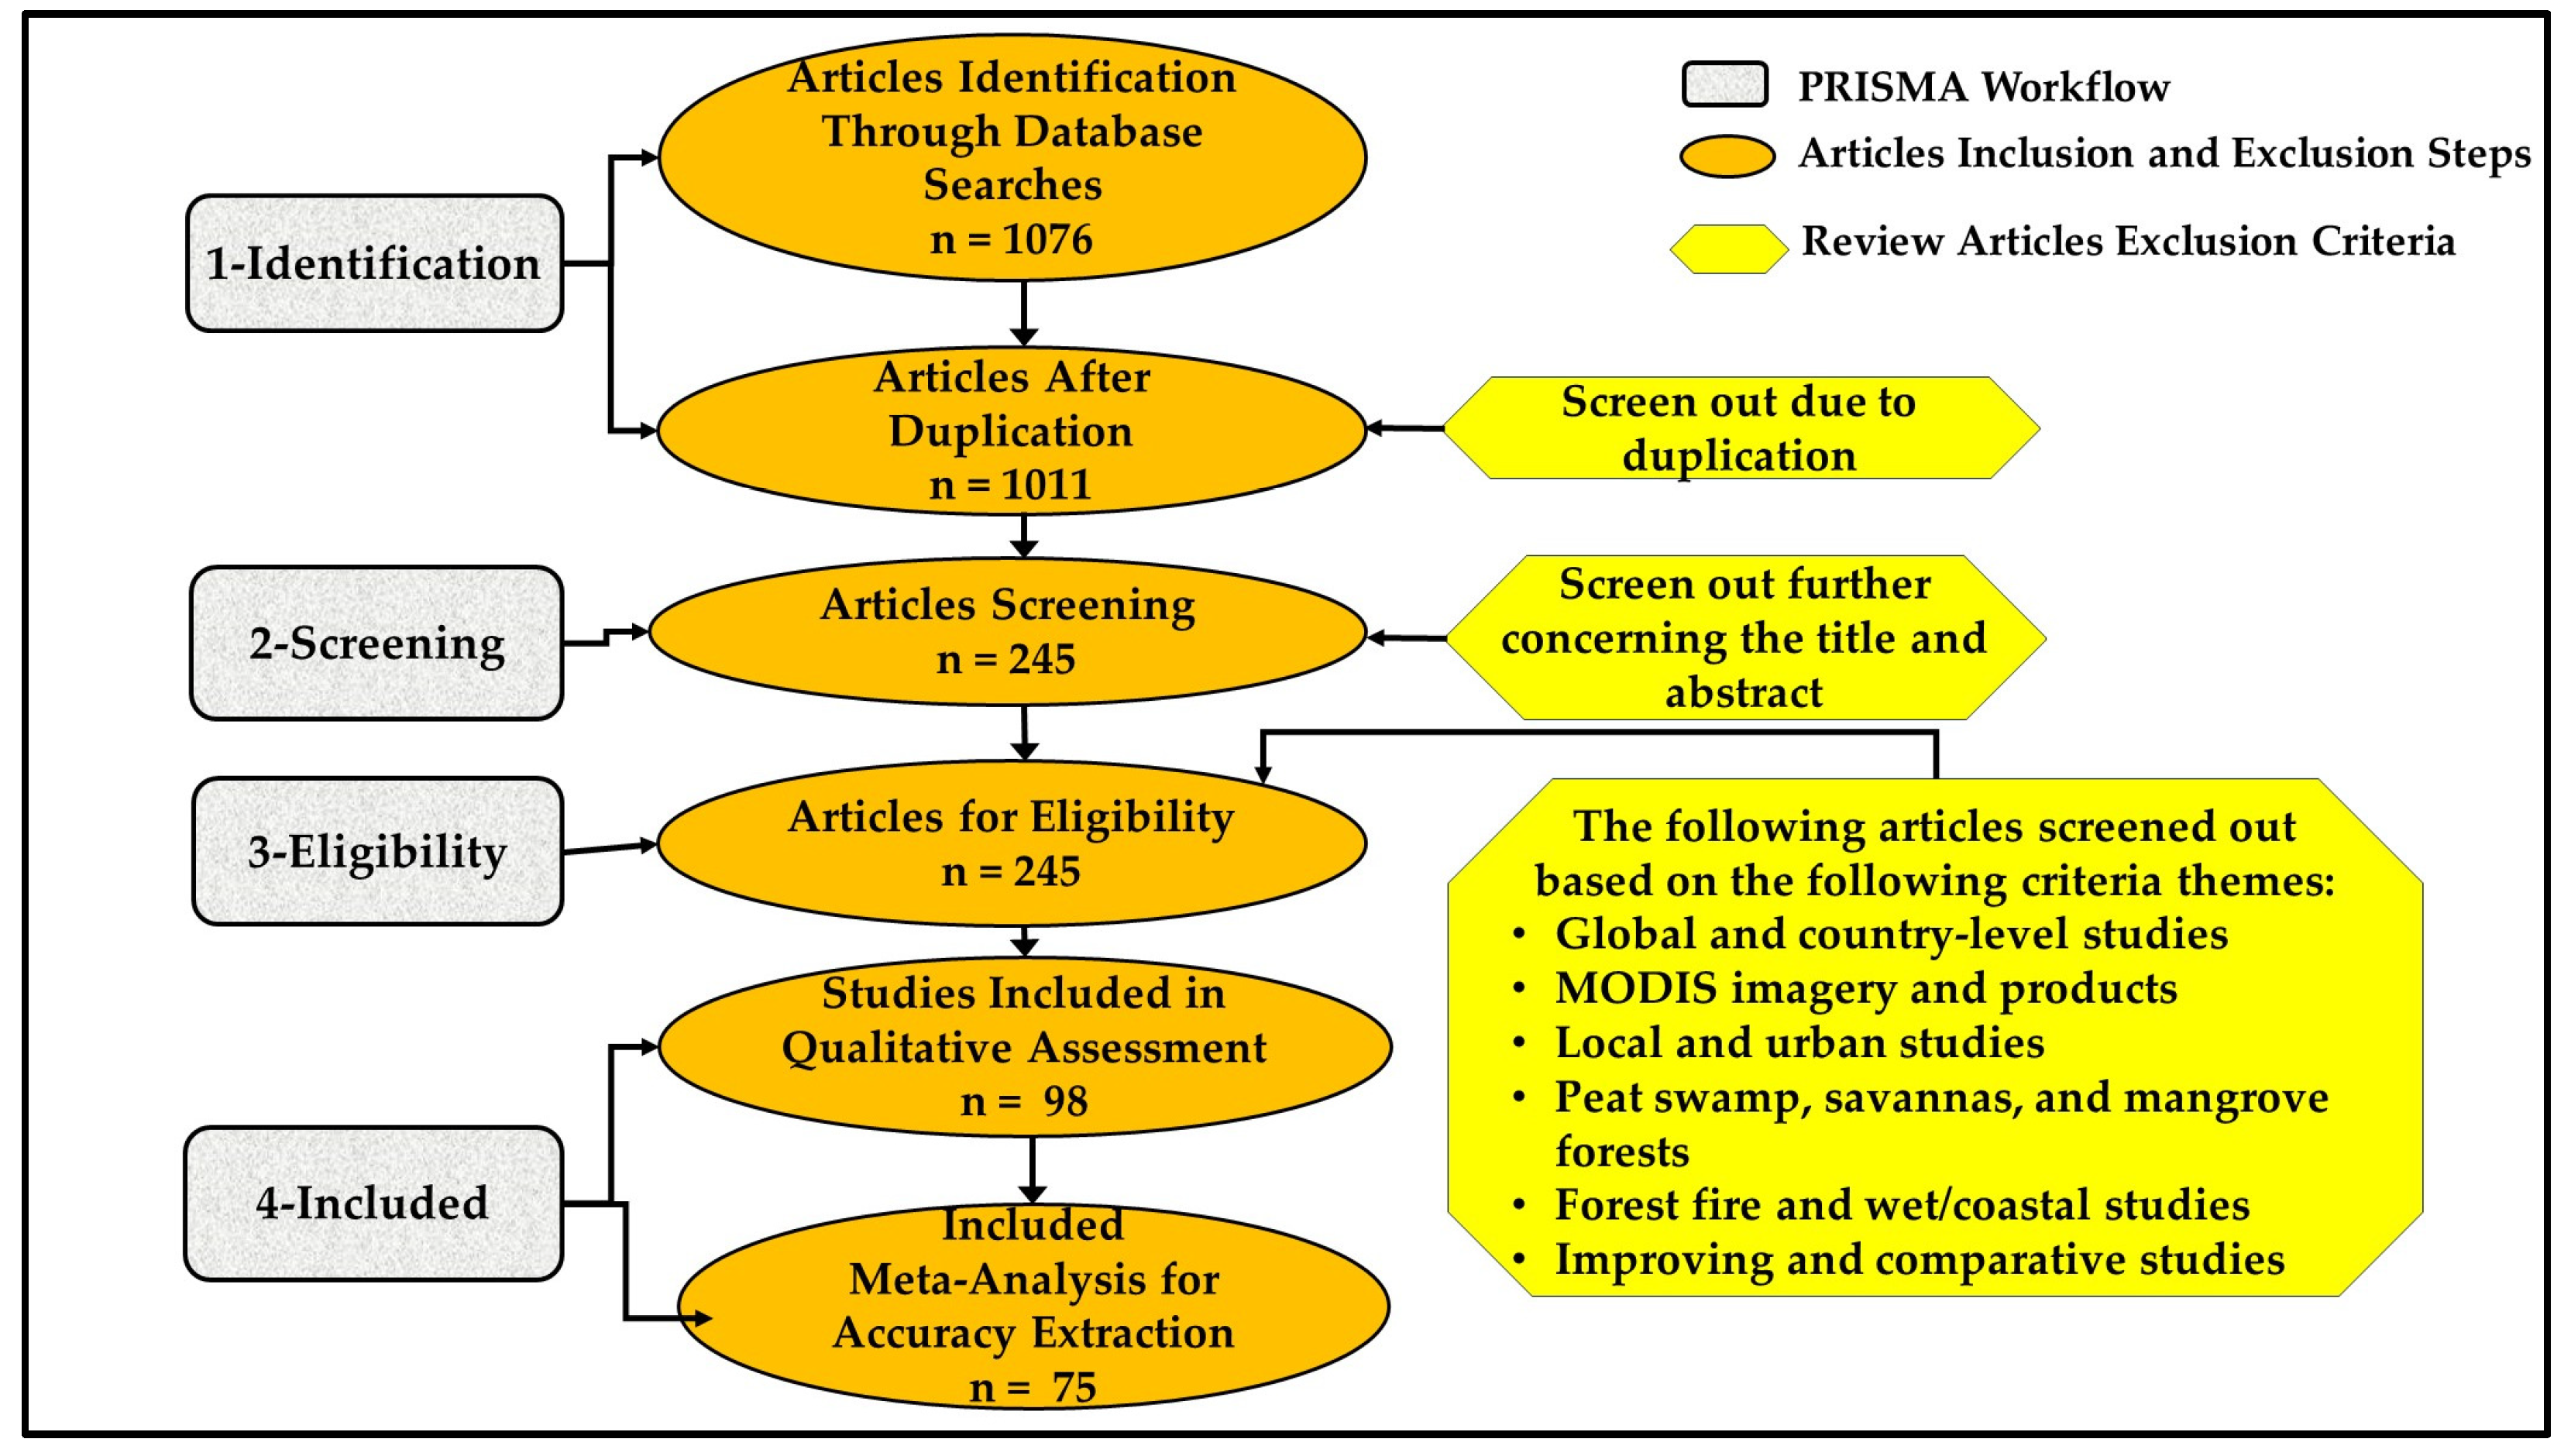
2.3. Selection Process
2.4. Inclusion and Exclusion Criteria
2.5. Quality Assessment Criteria
2.6. Segregation and Analytics
2.7. Scientometric Analysis
3. Results
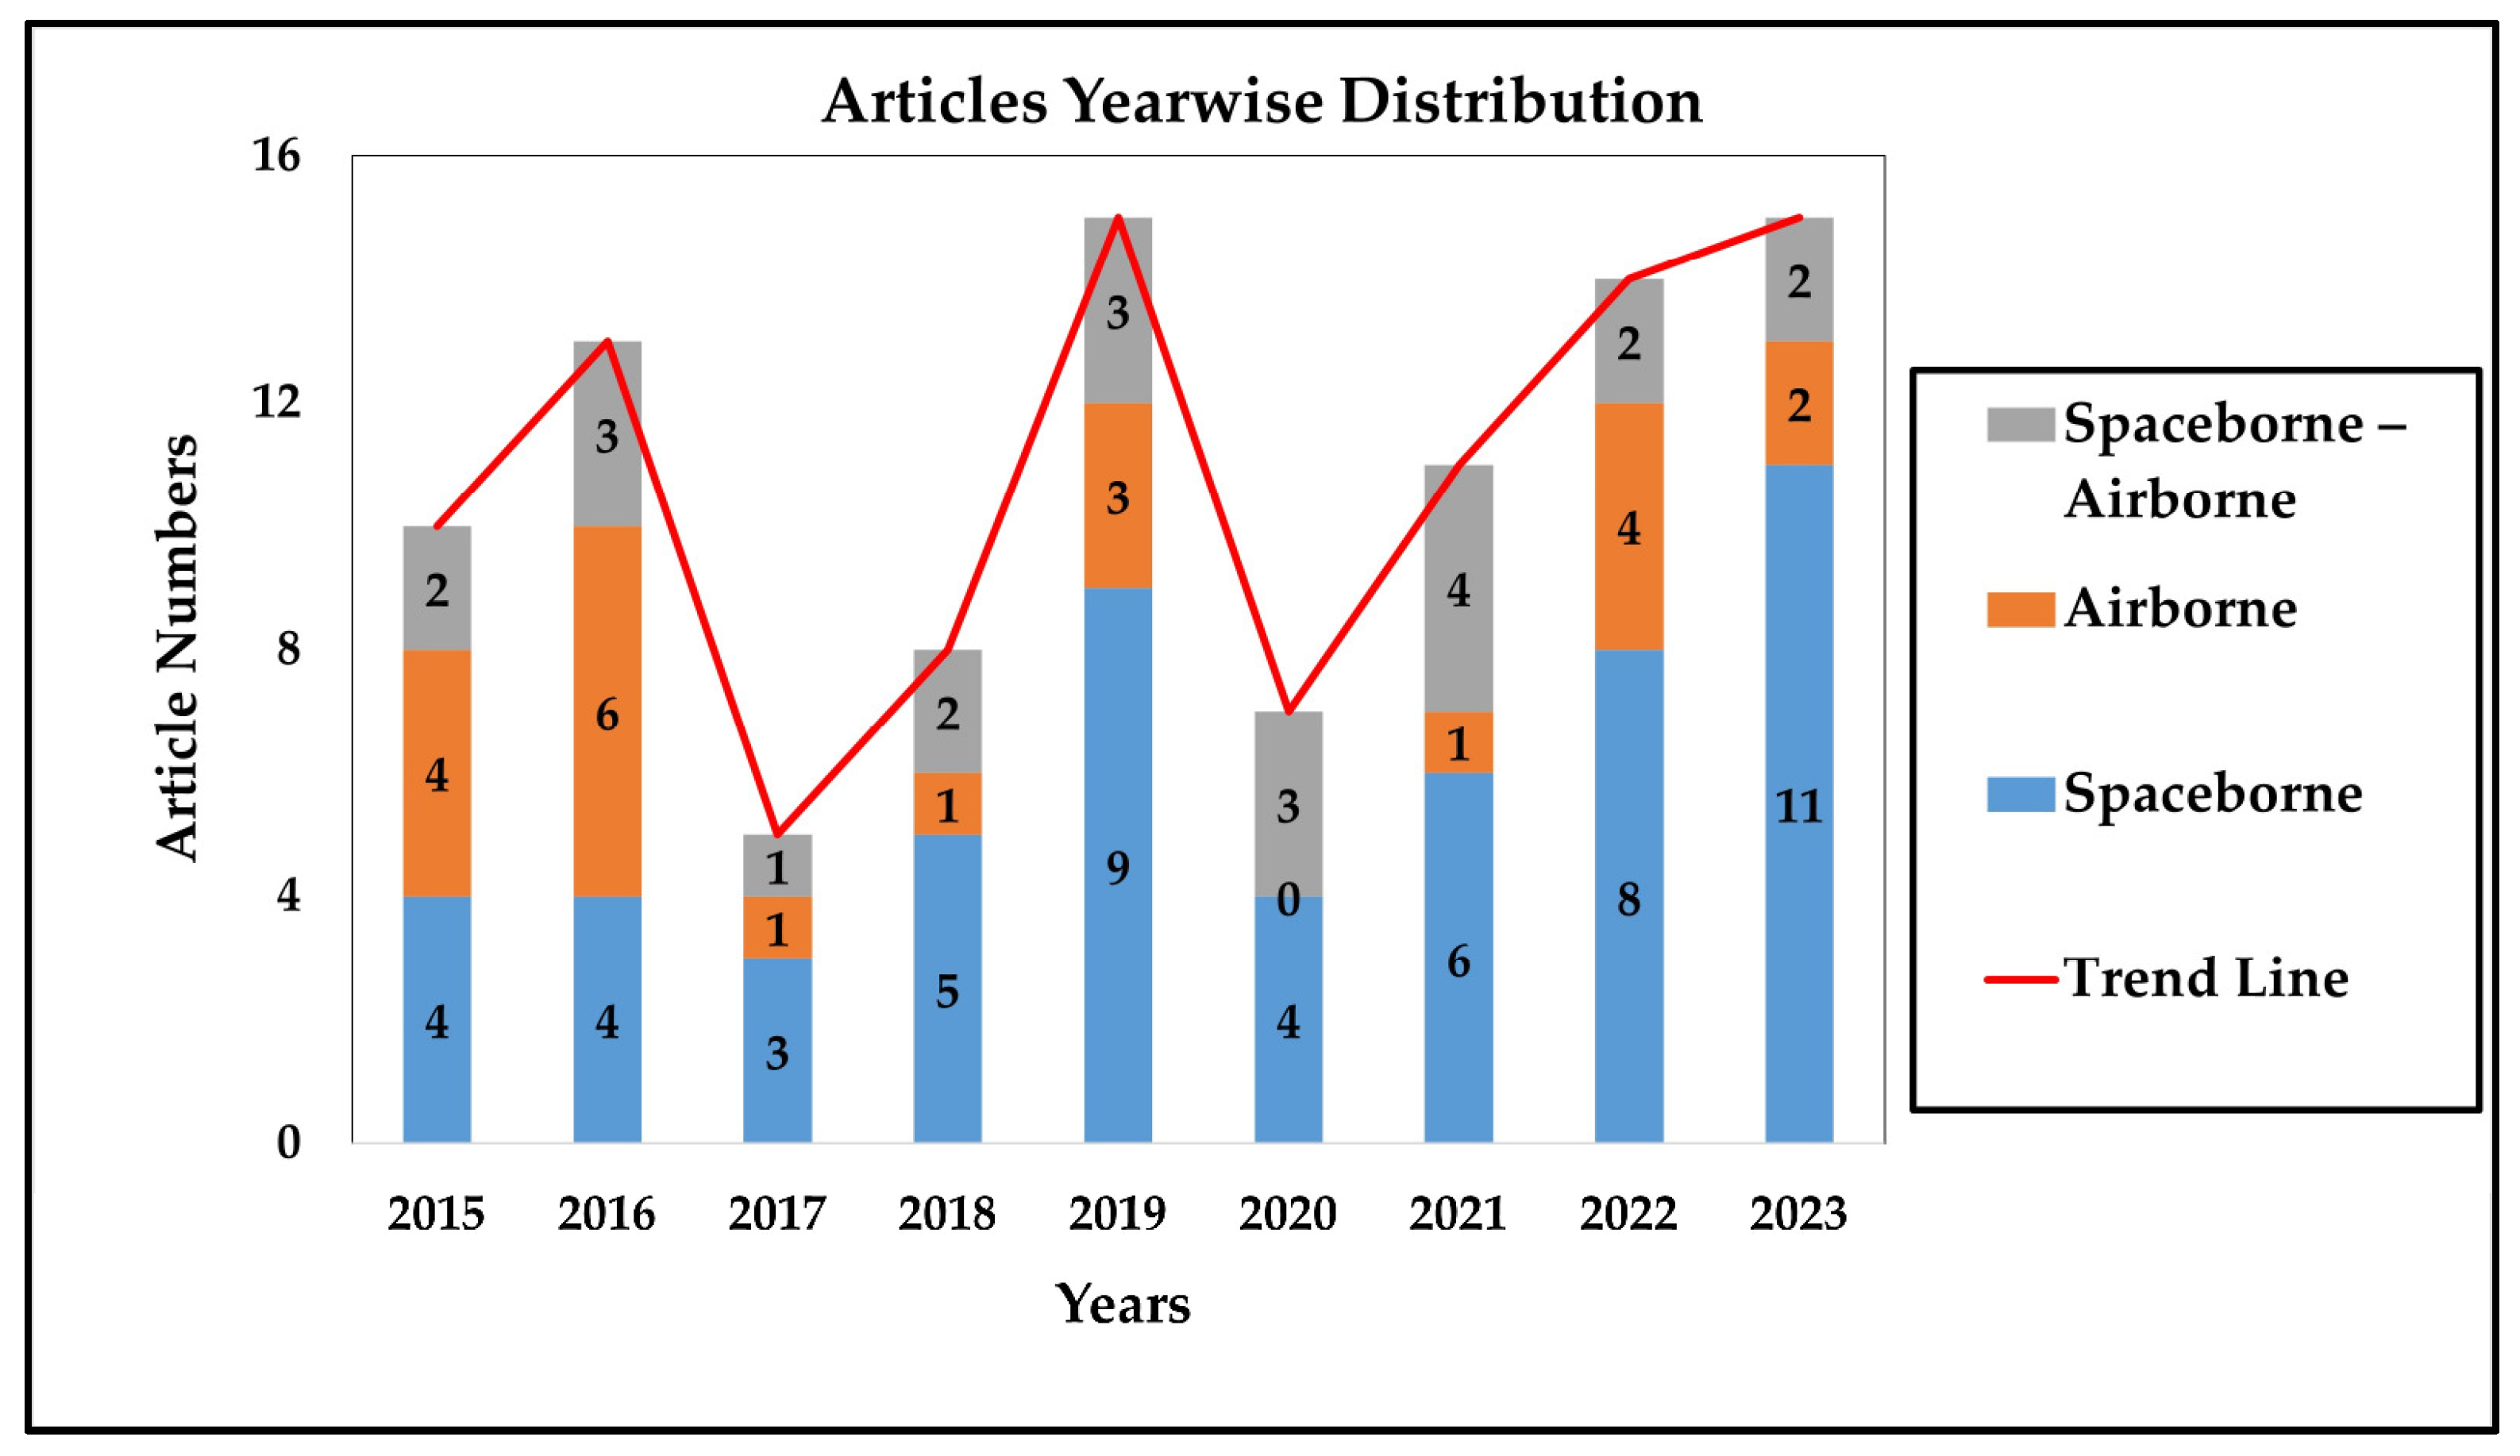
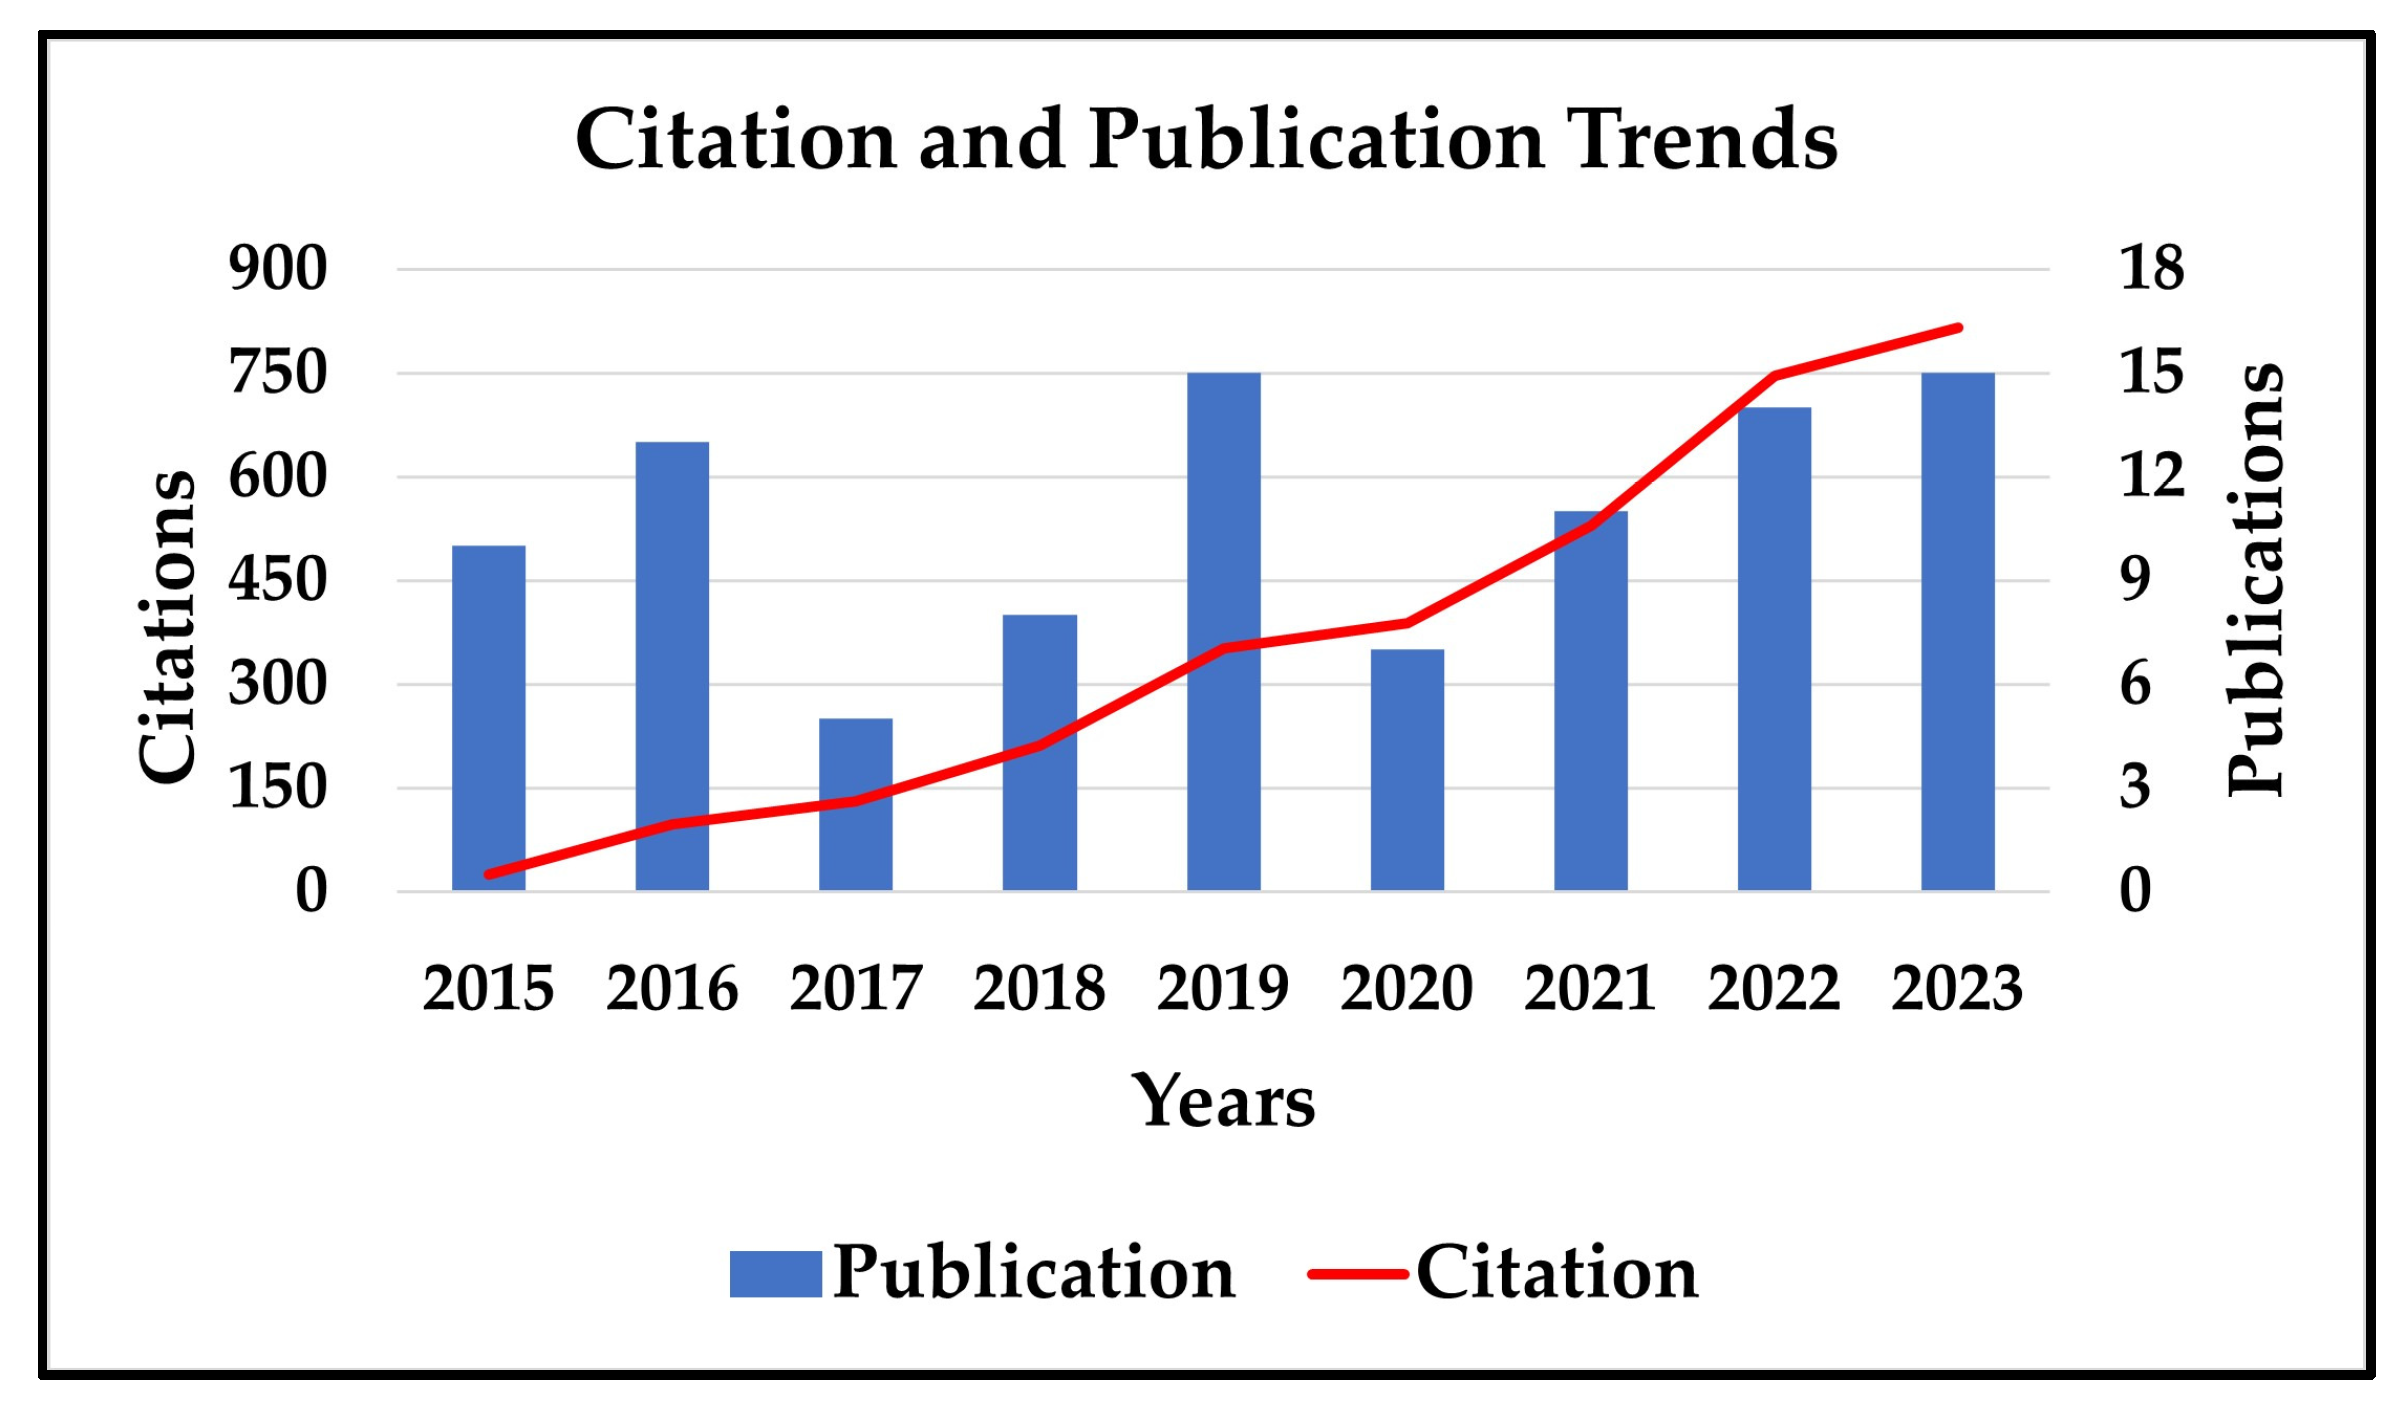
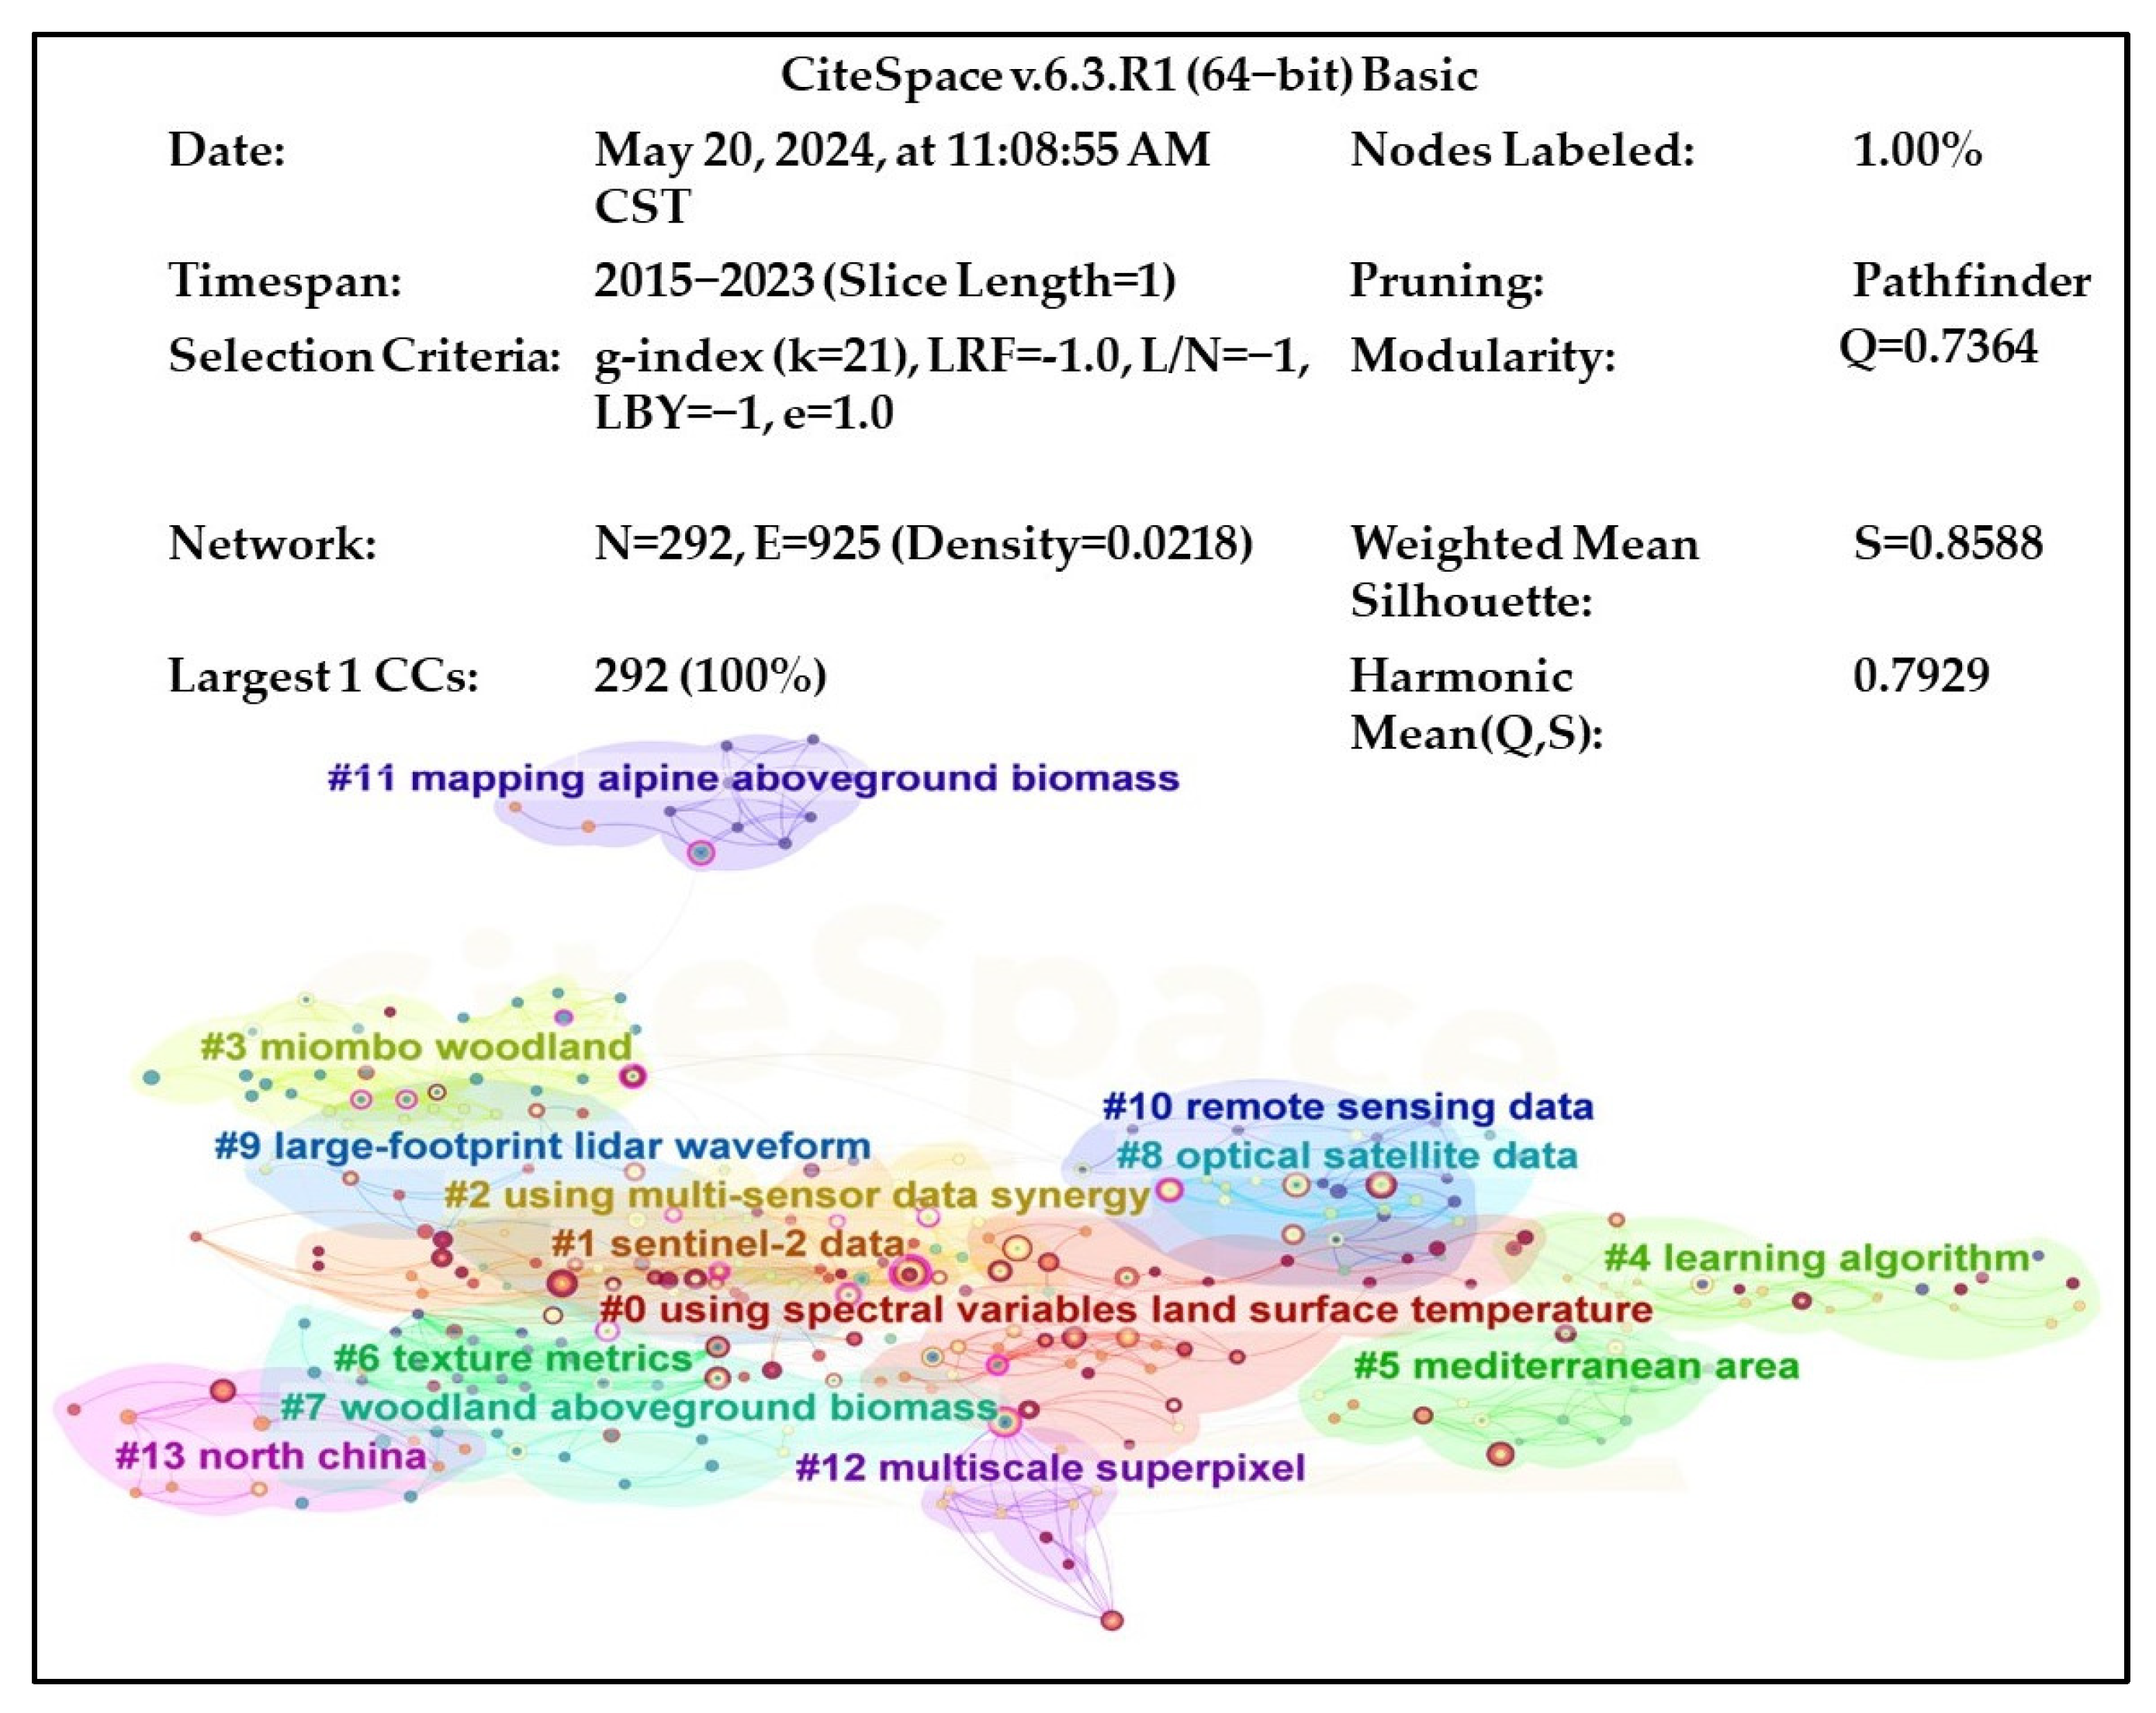
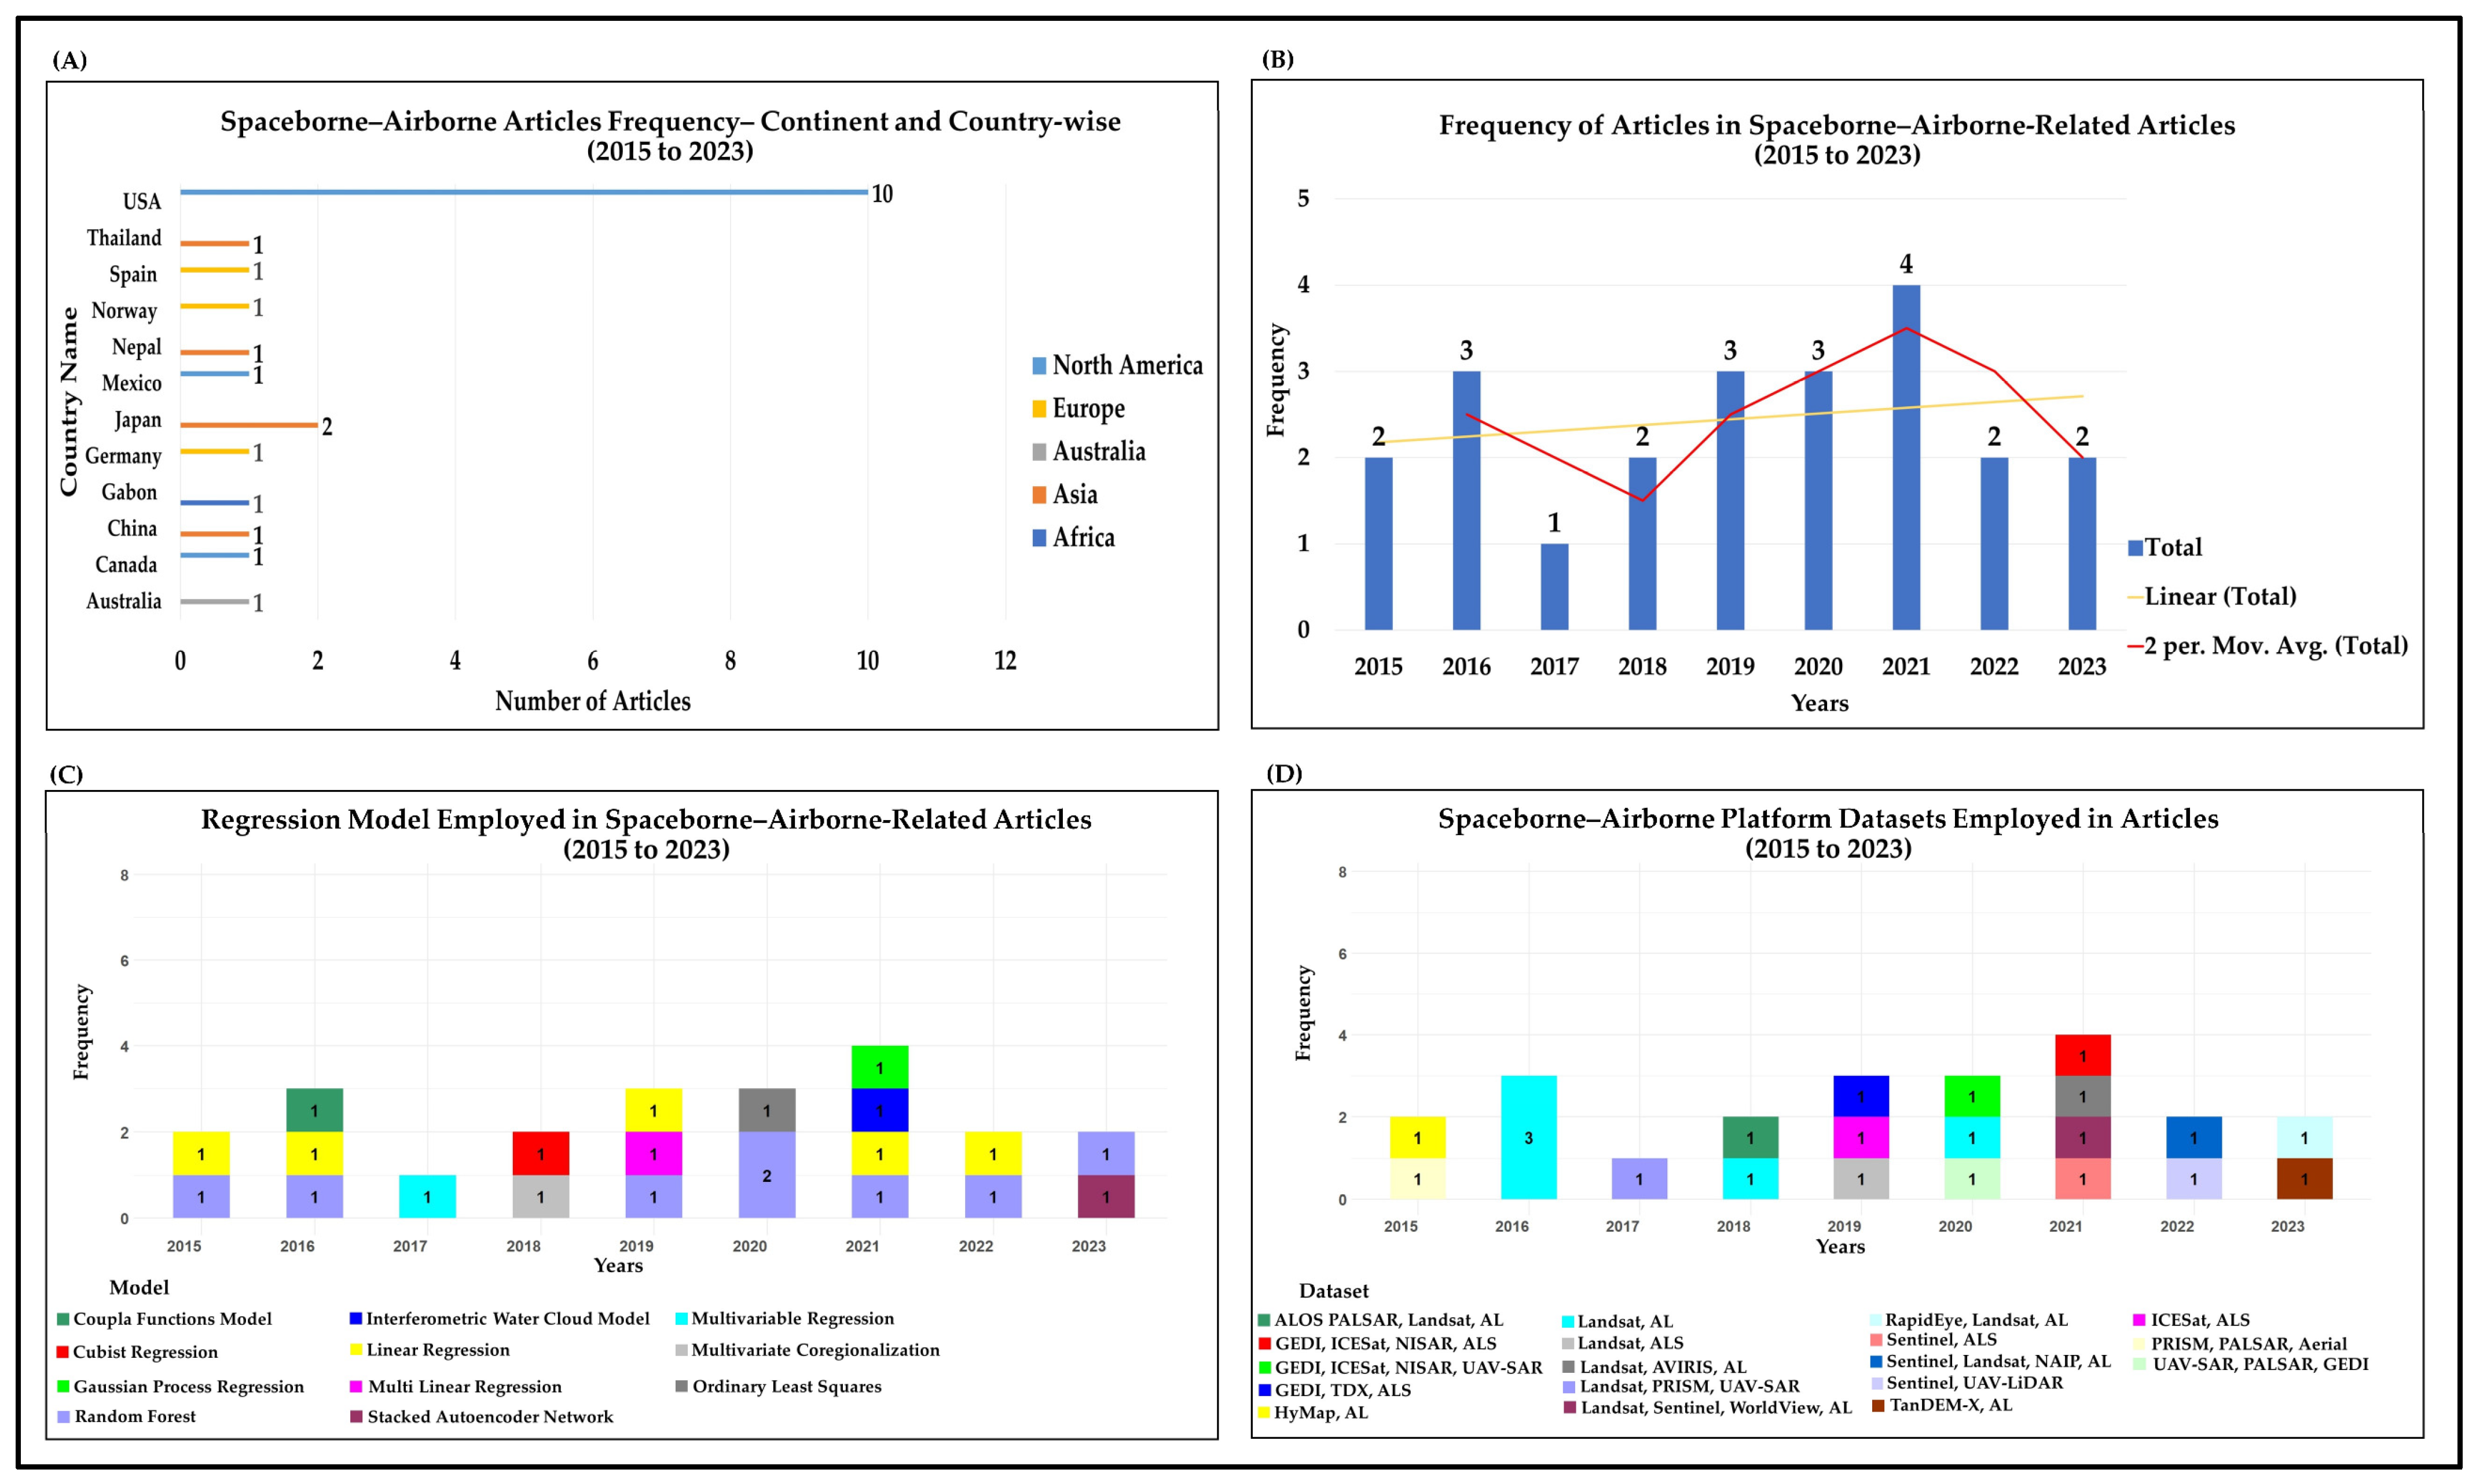
3.1. Scientometric Analysis
3.2. Forest Aboveground Biomass Estimation
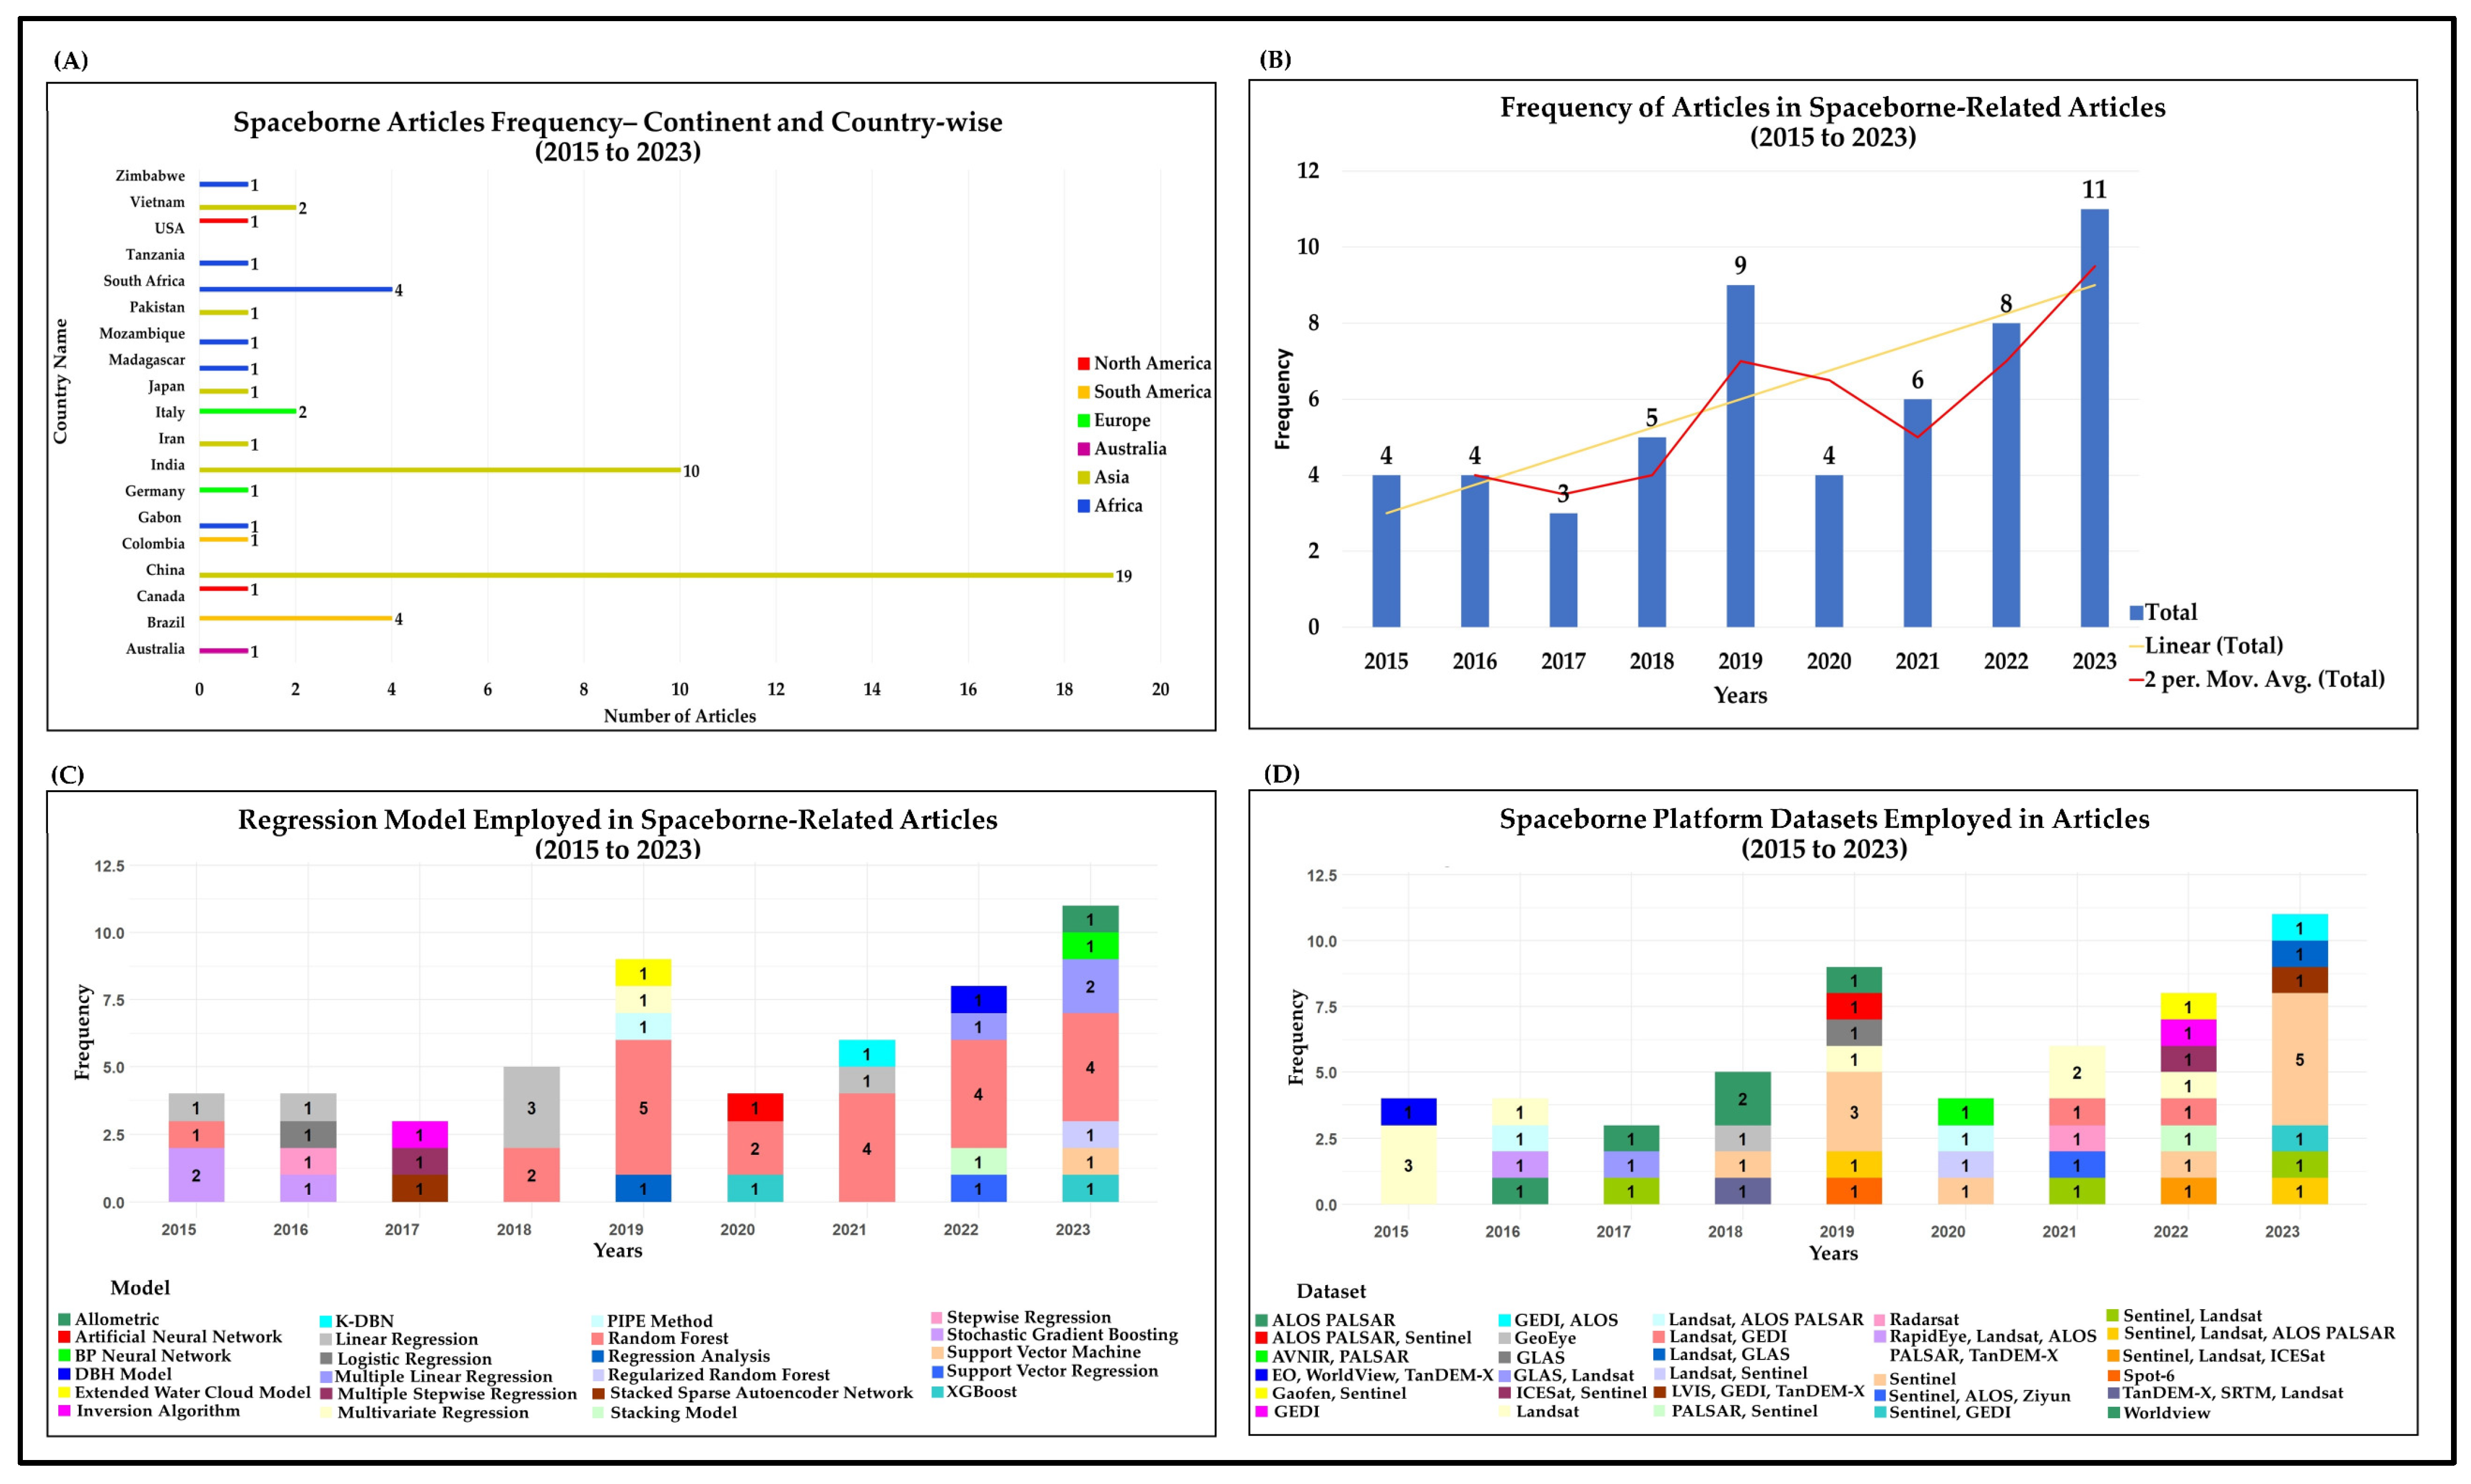
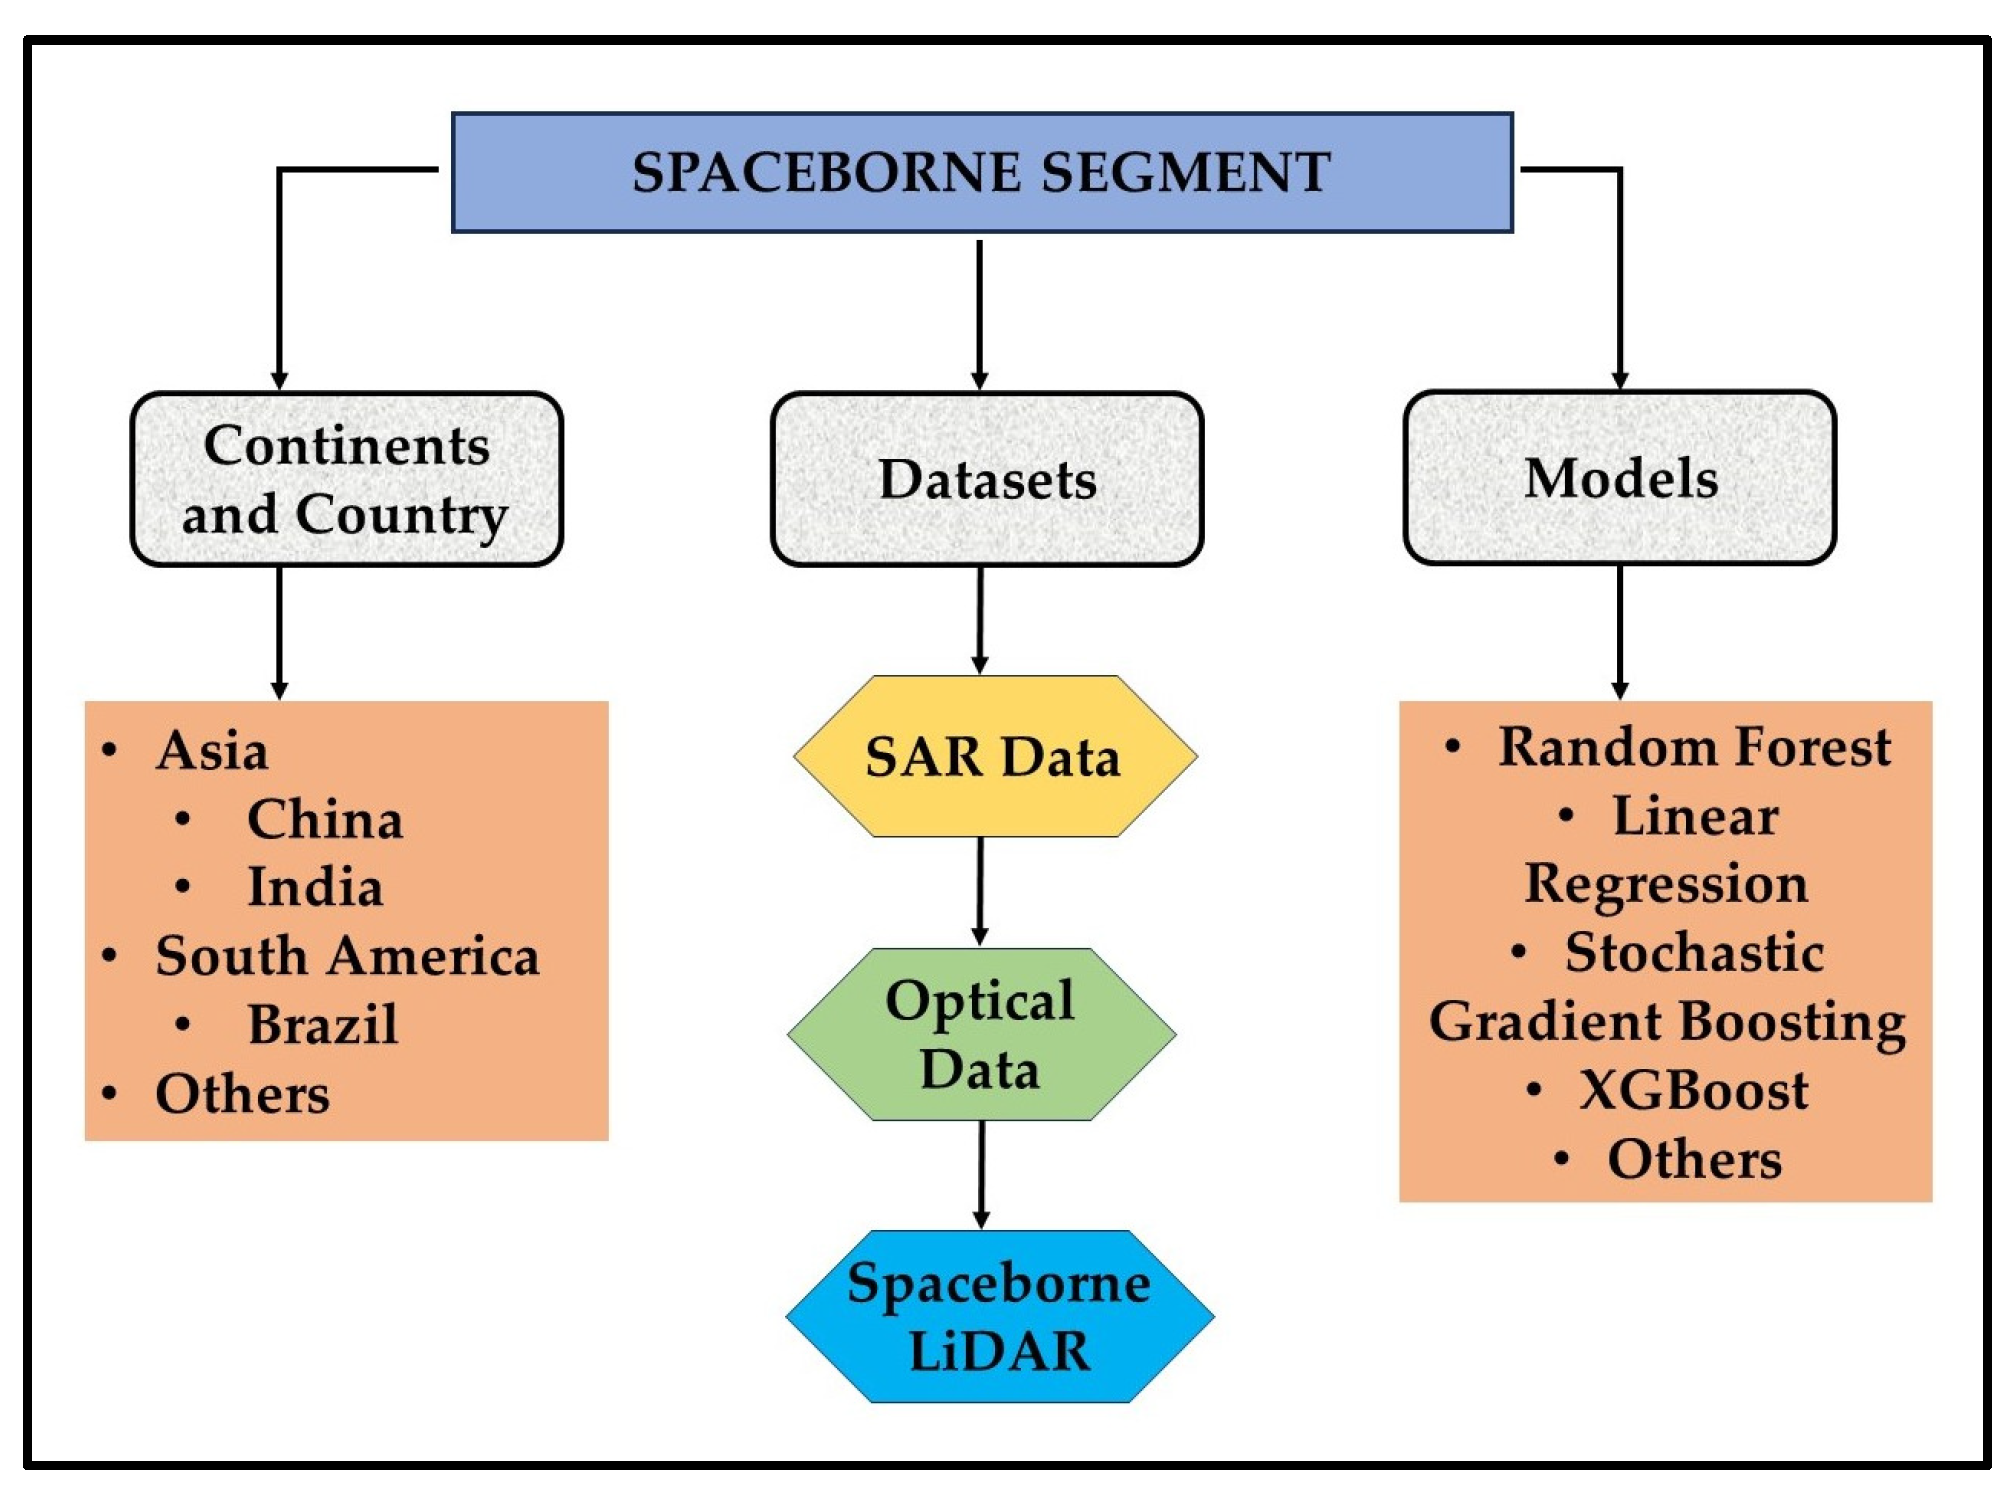
3.2.1. Spaceborne Datasets
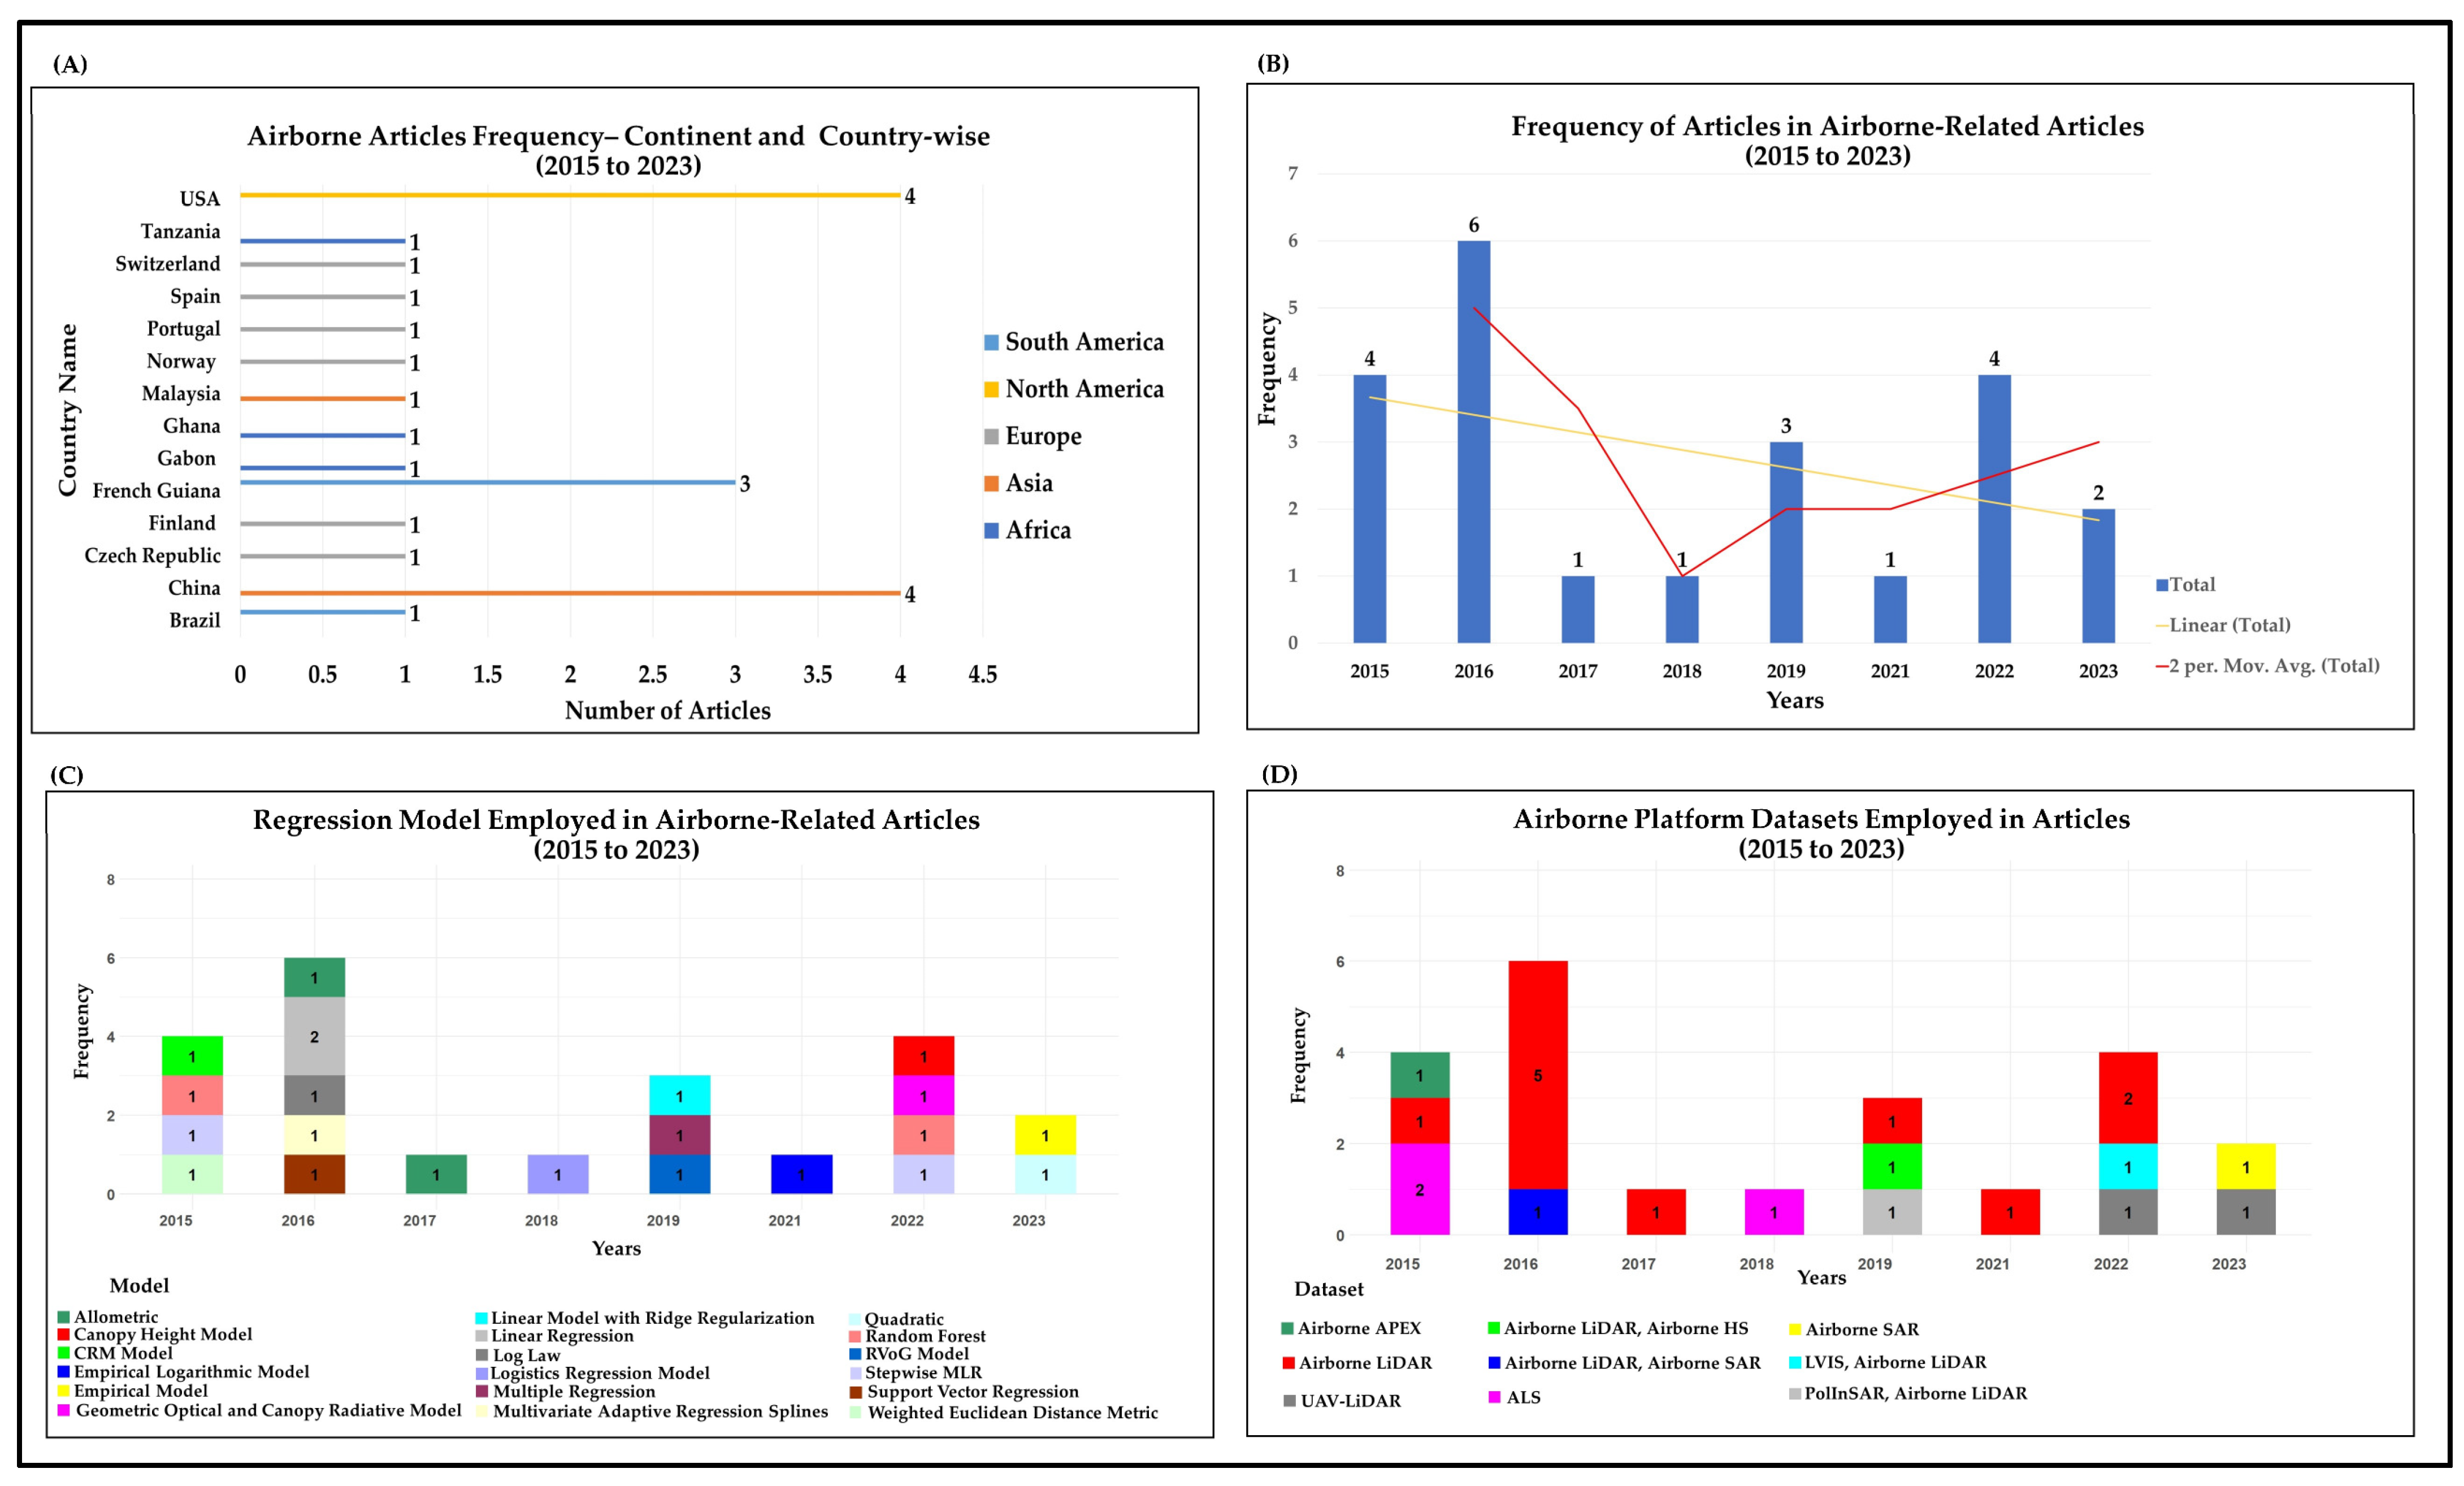
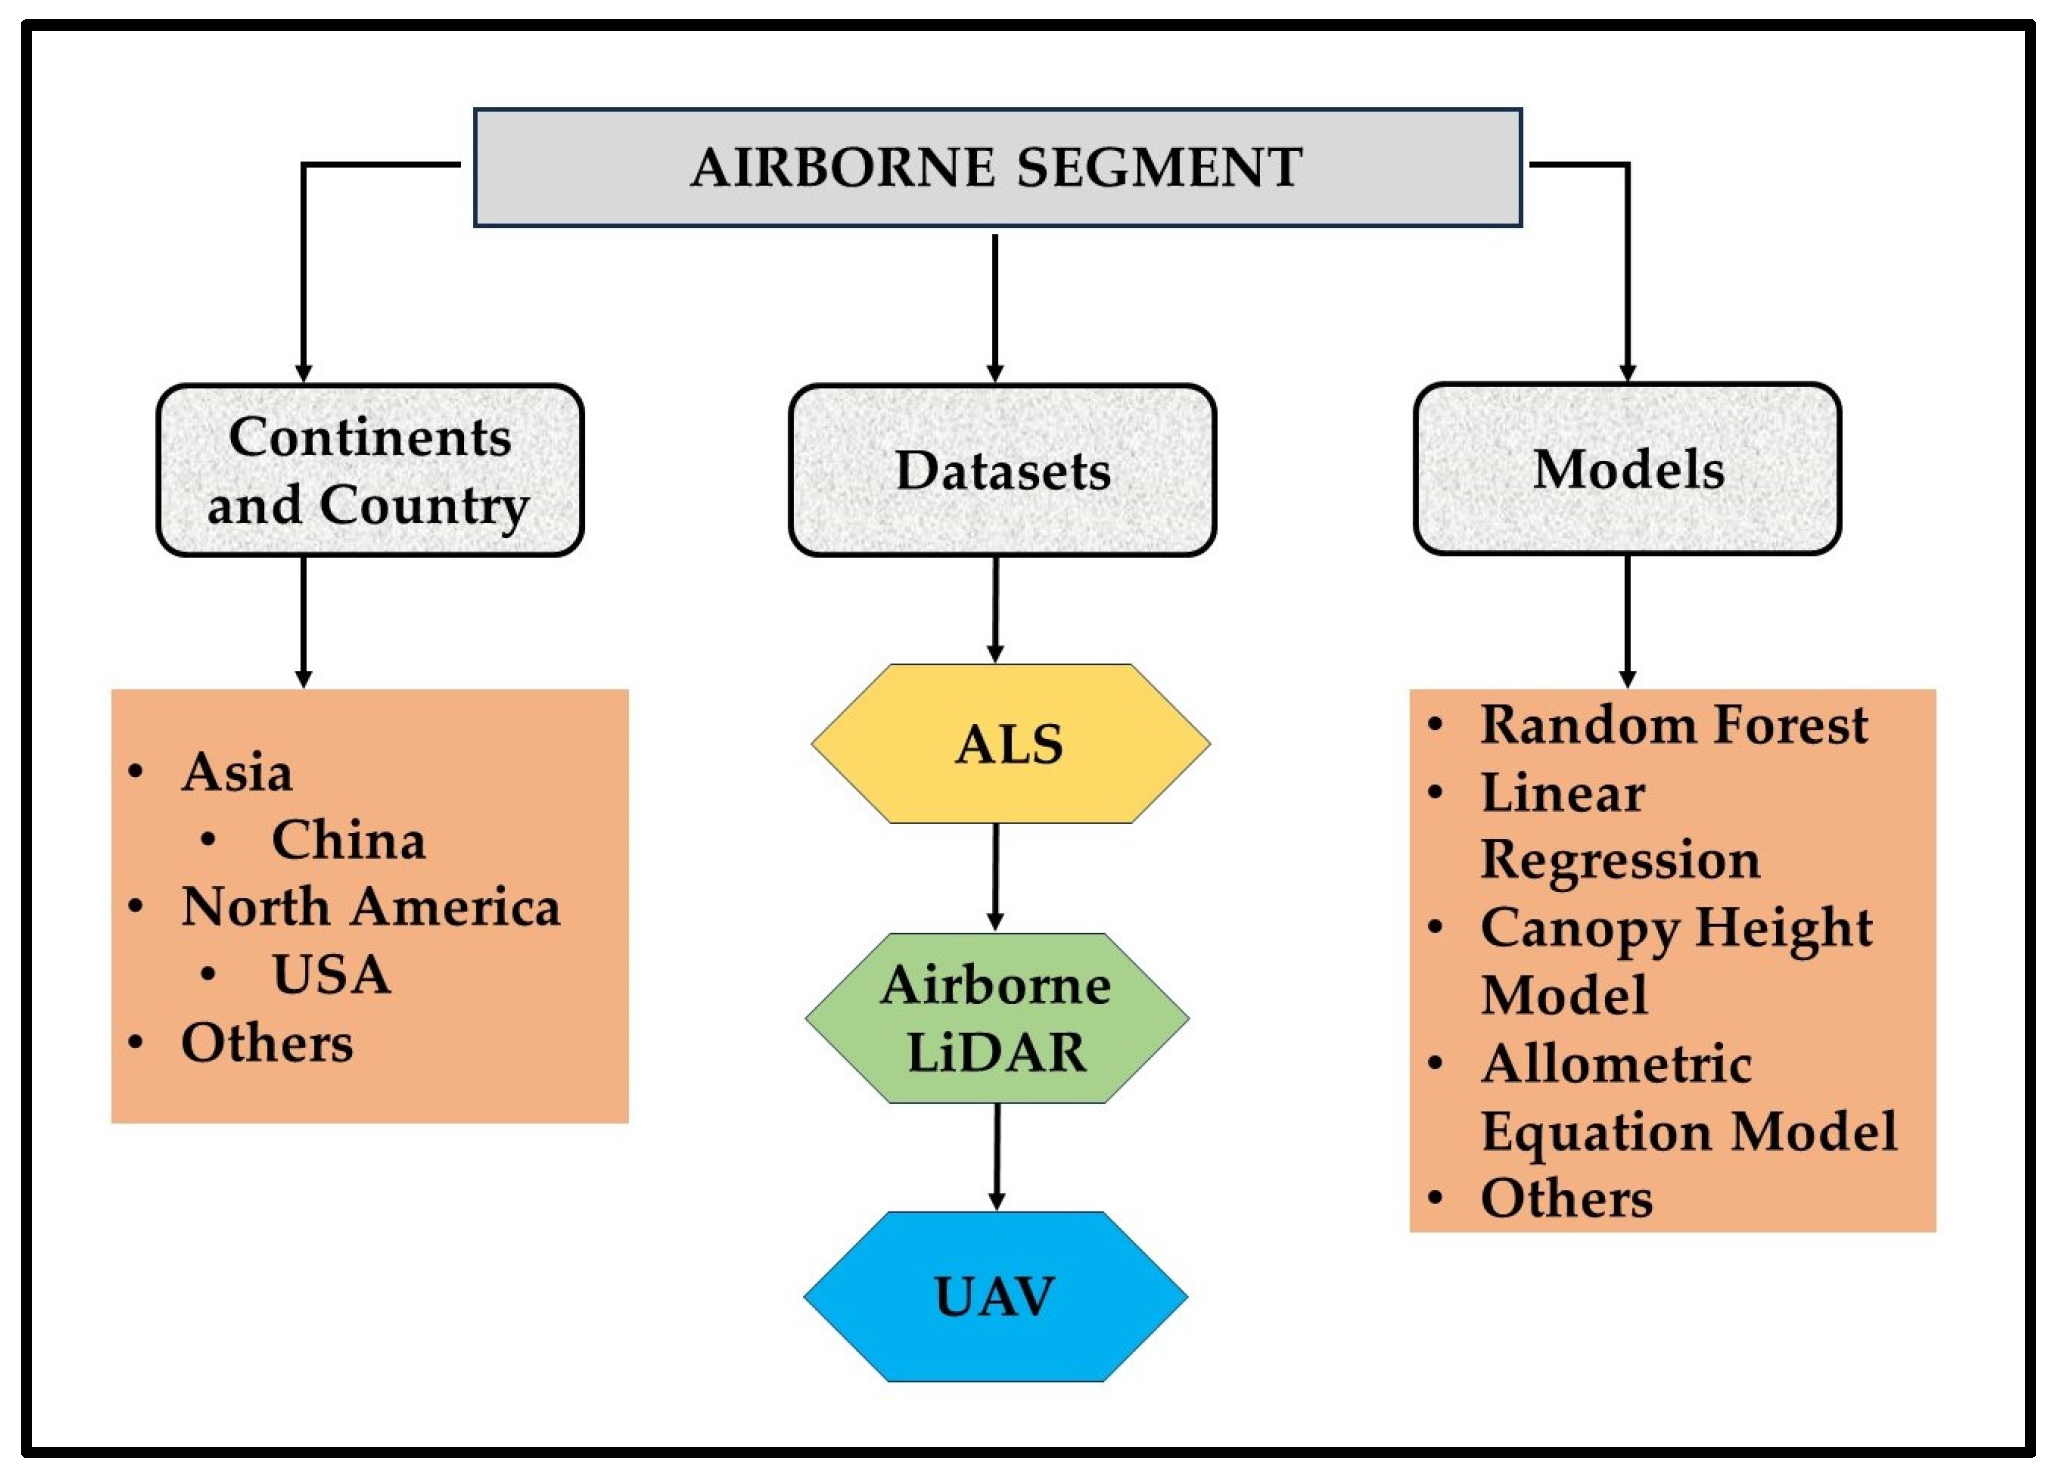
3.2.2. Airborne Datasets
3.2.3. Space- and Airborne Datasets
3.3. Accuracy Assessment Analytics
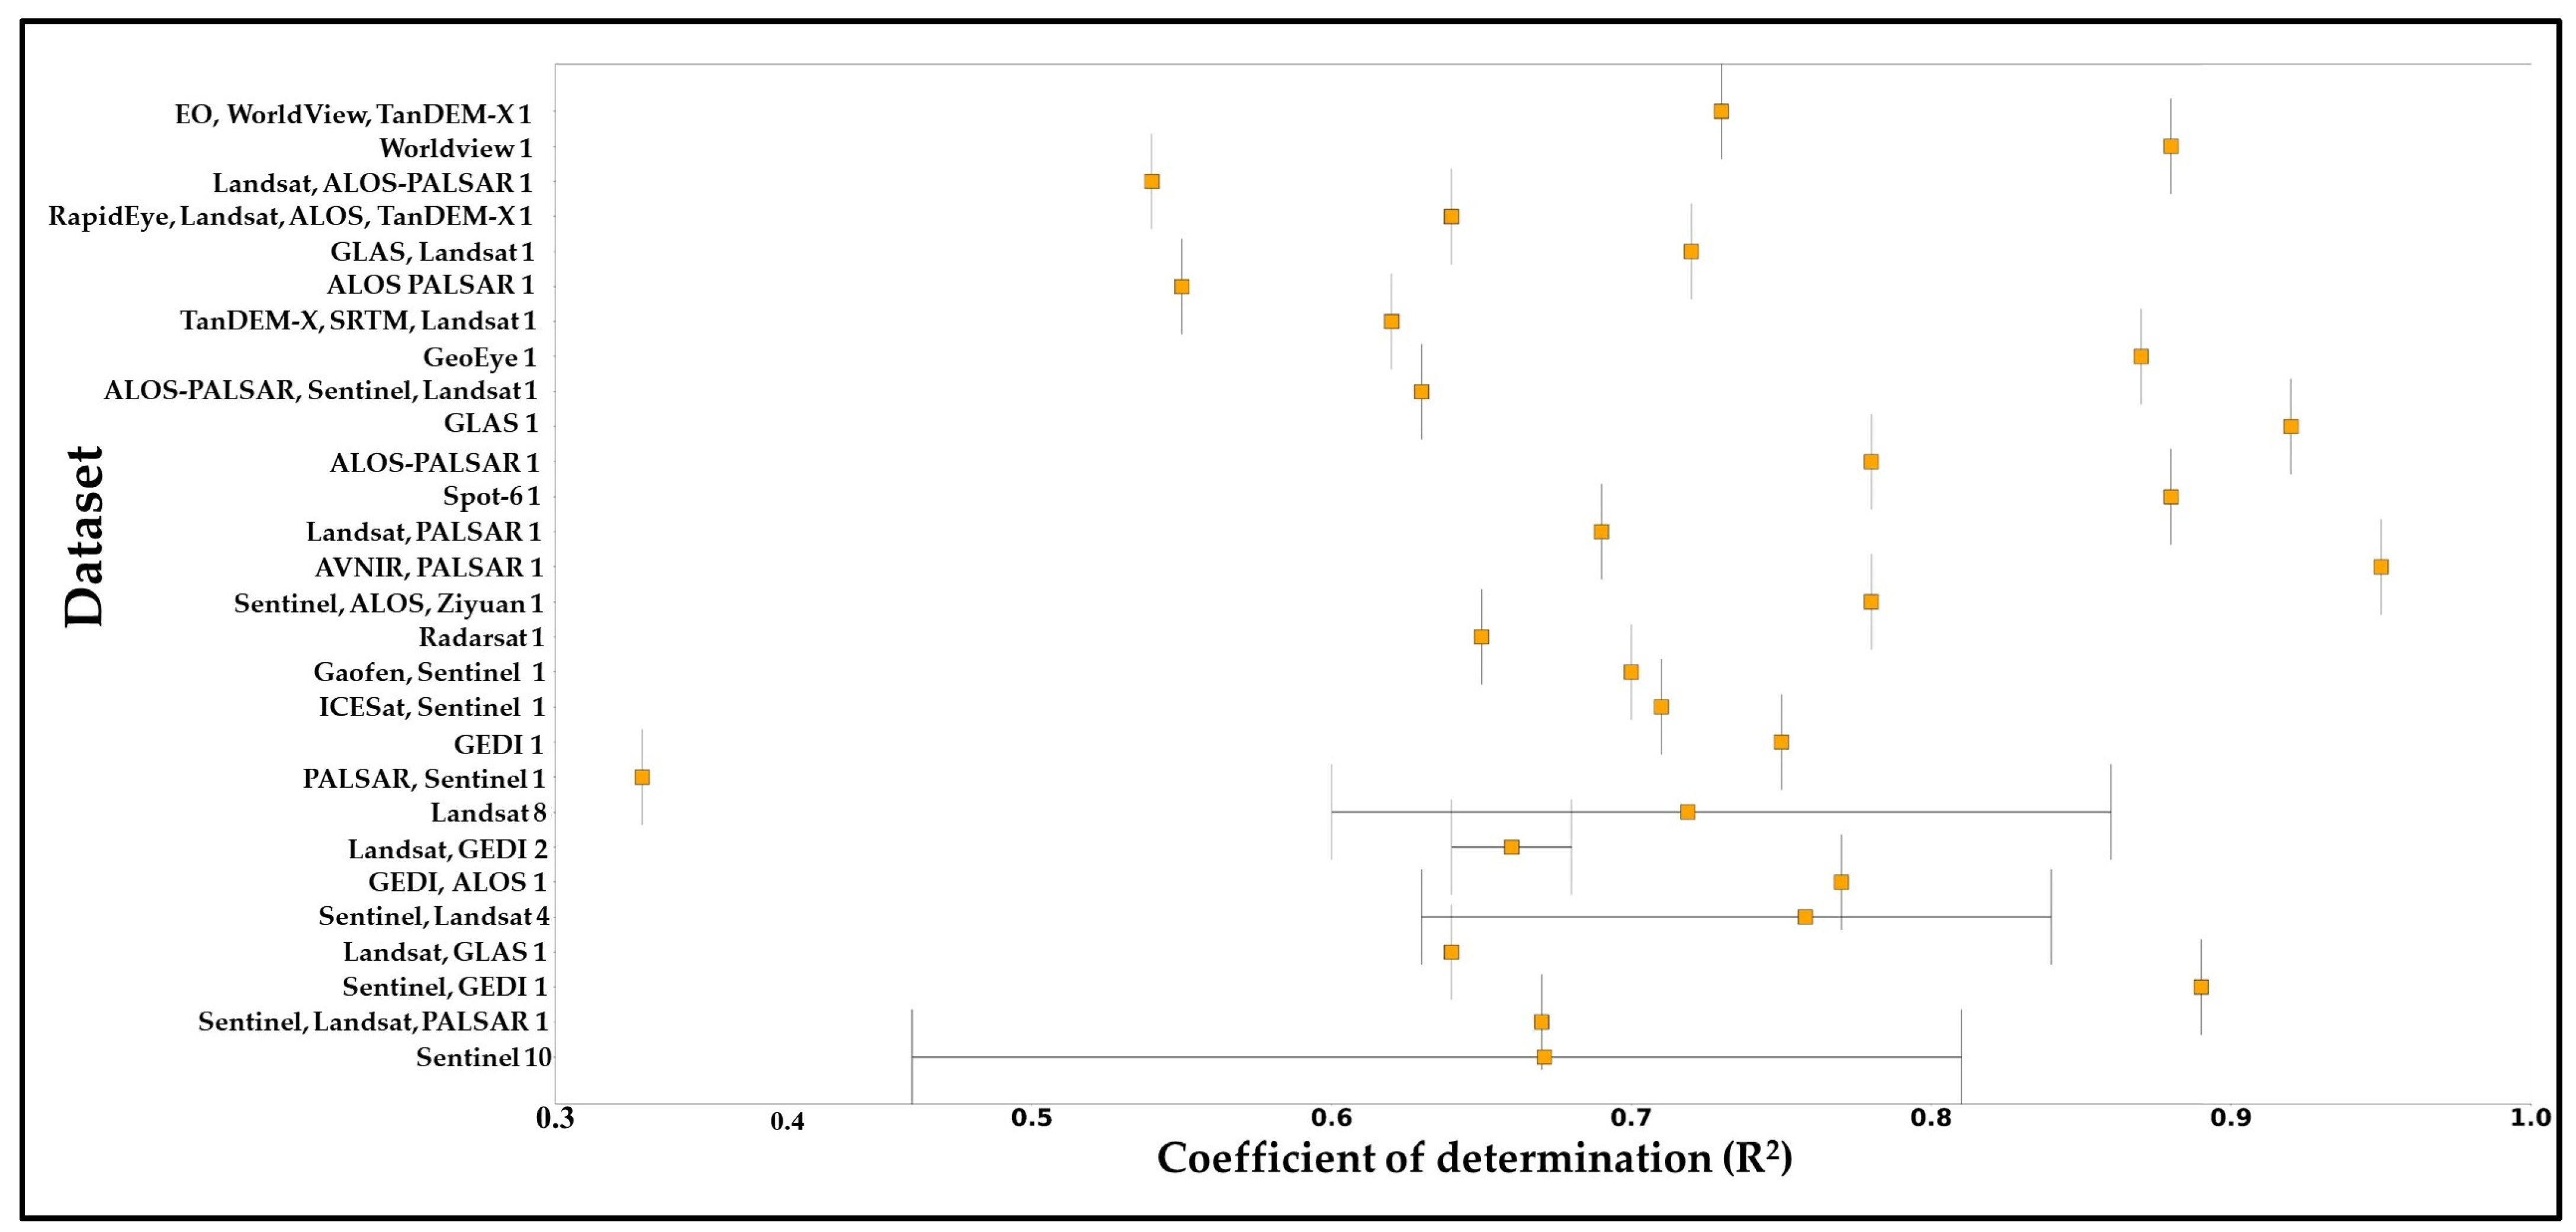
3.3.1. Spaceborne Analysis
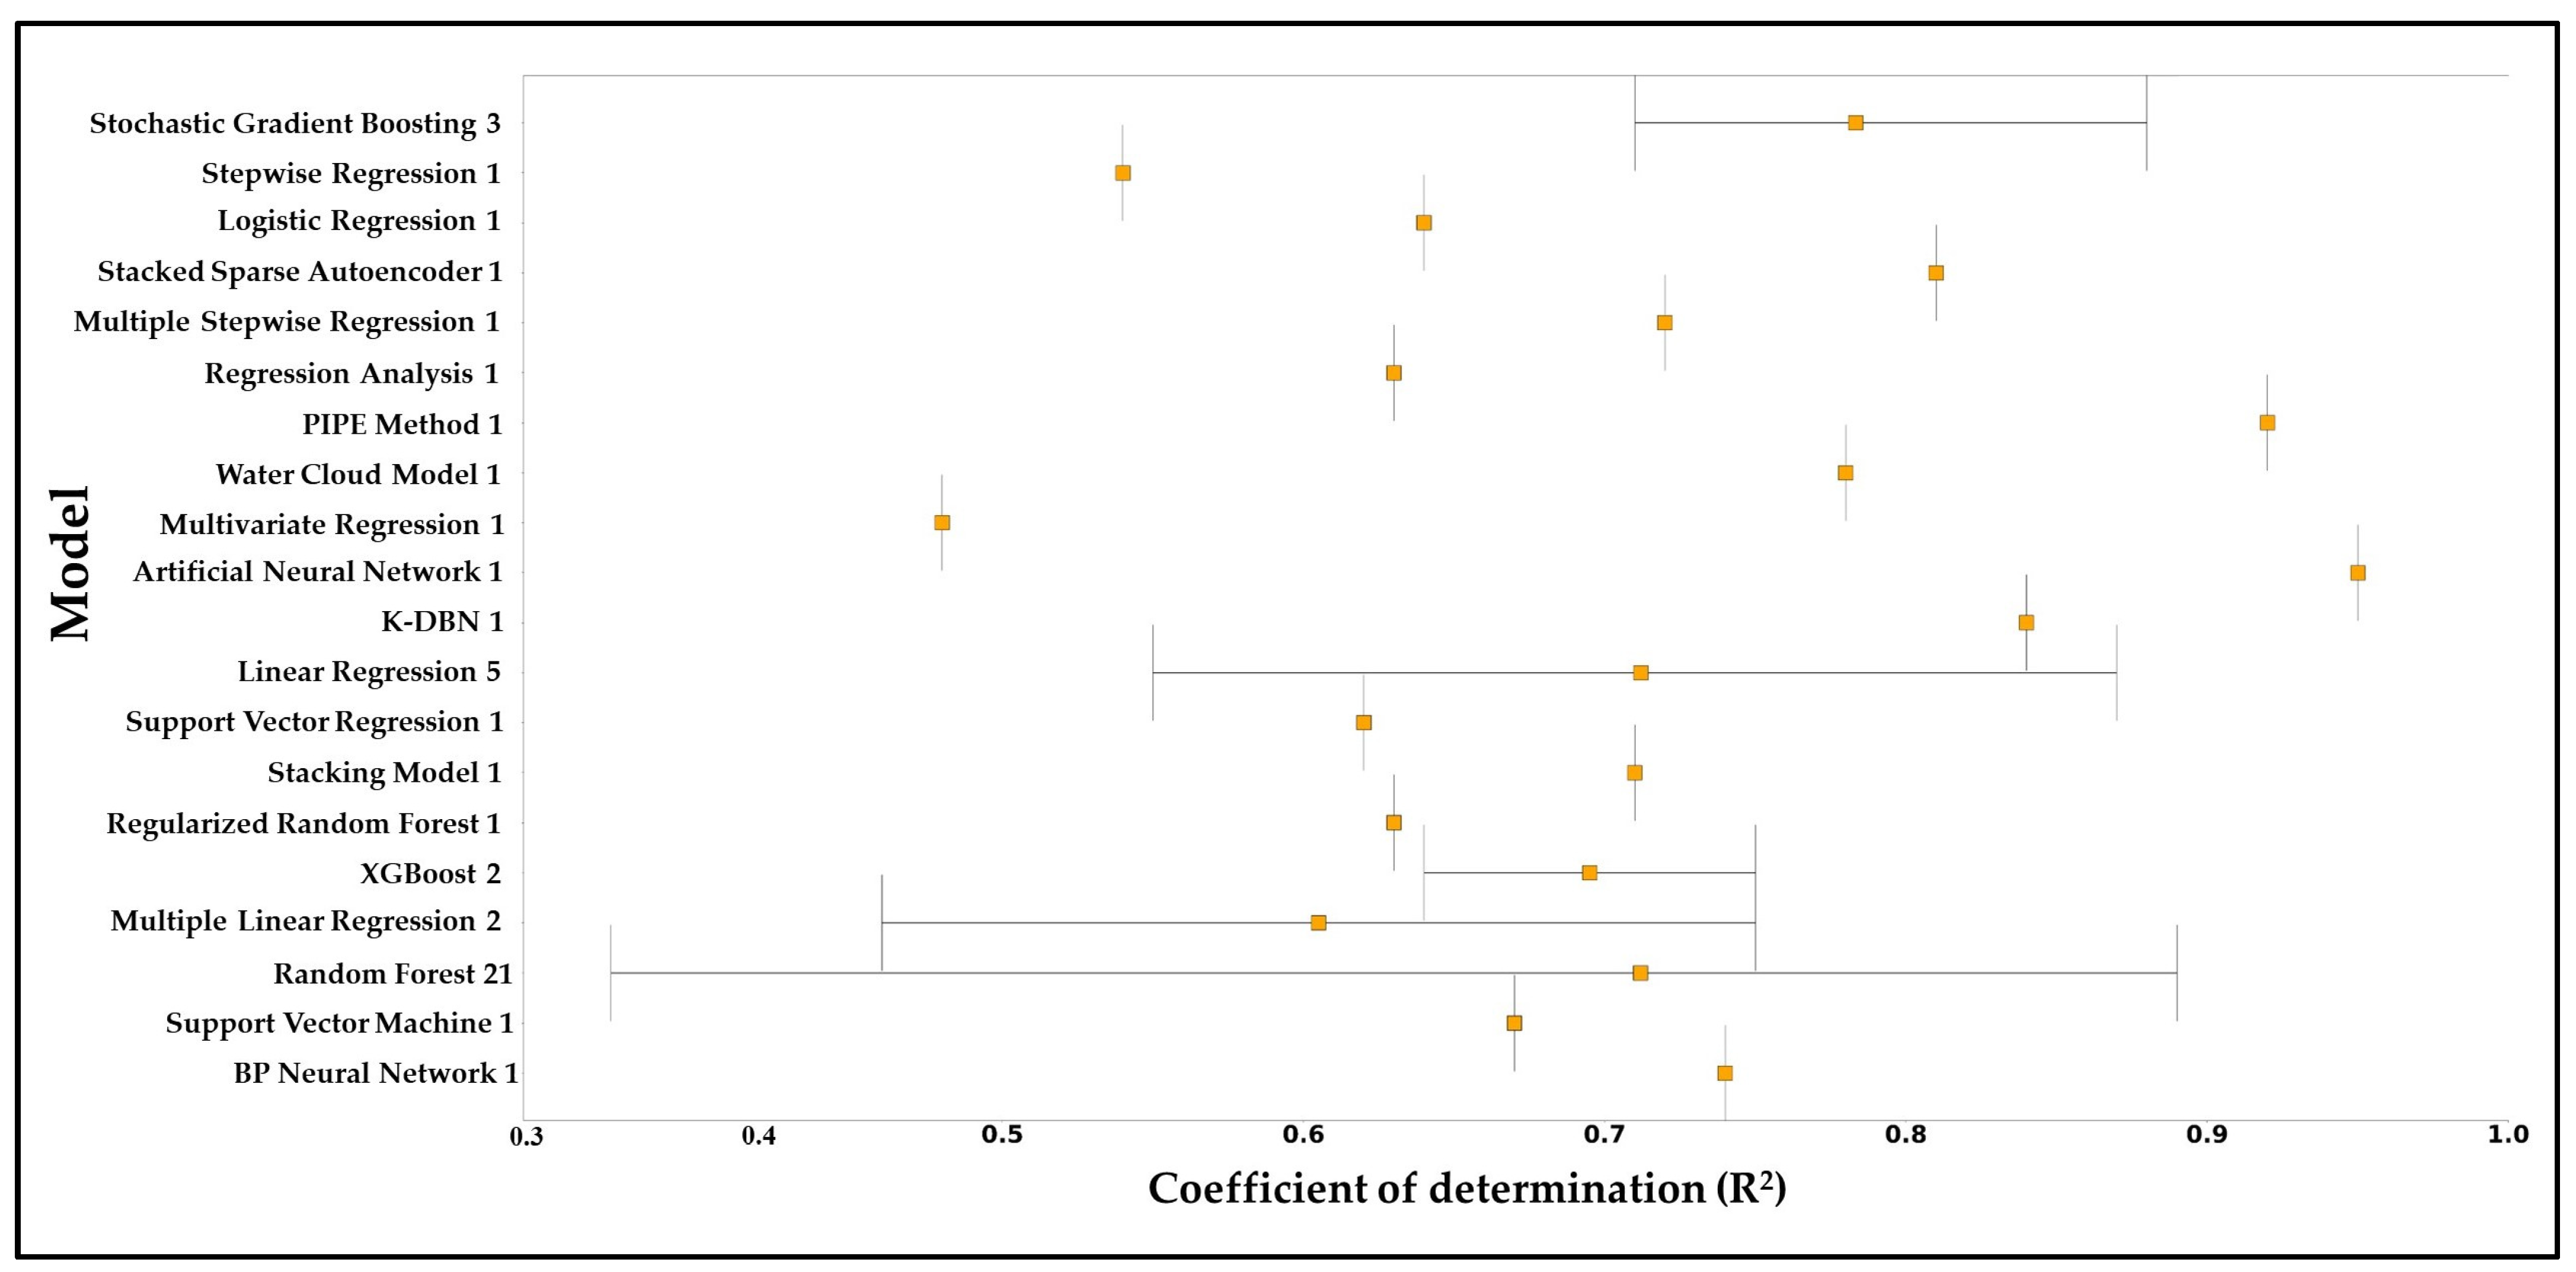
3.3.2. Airborne Analysis
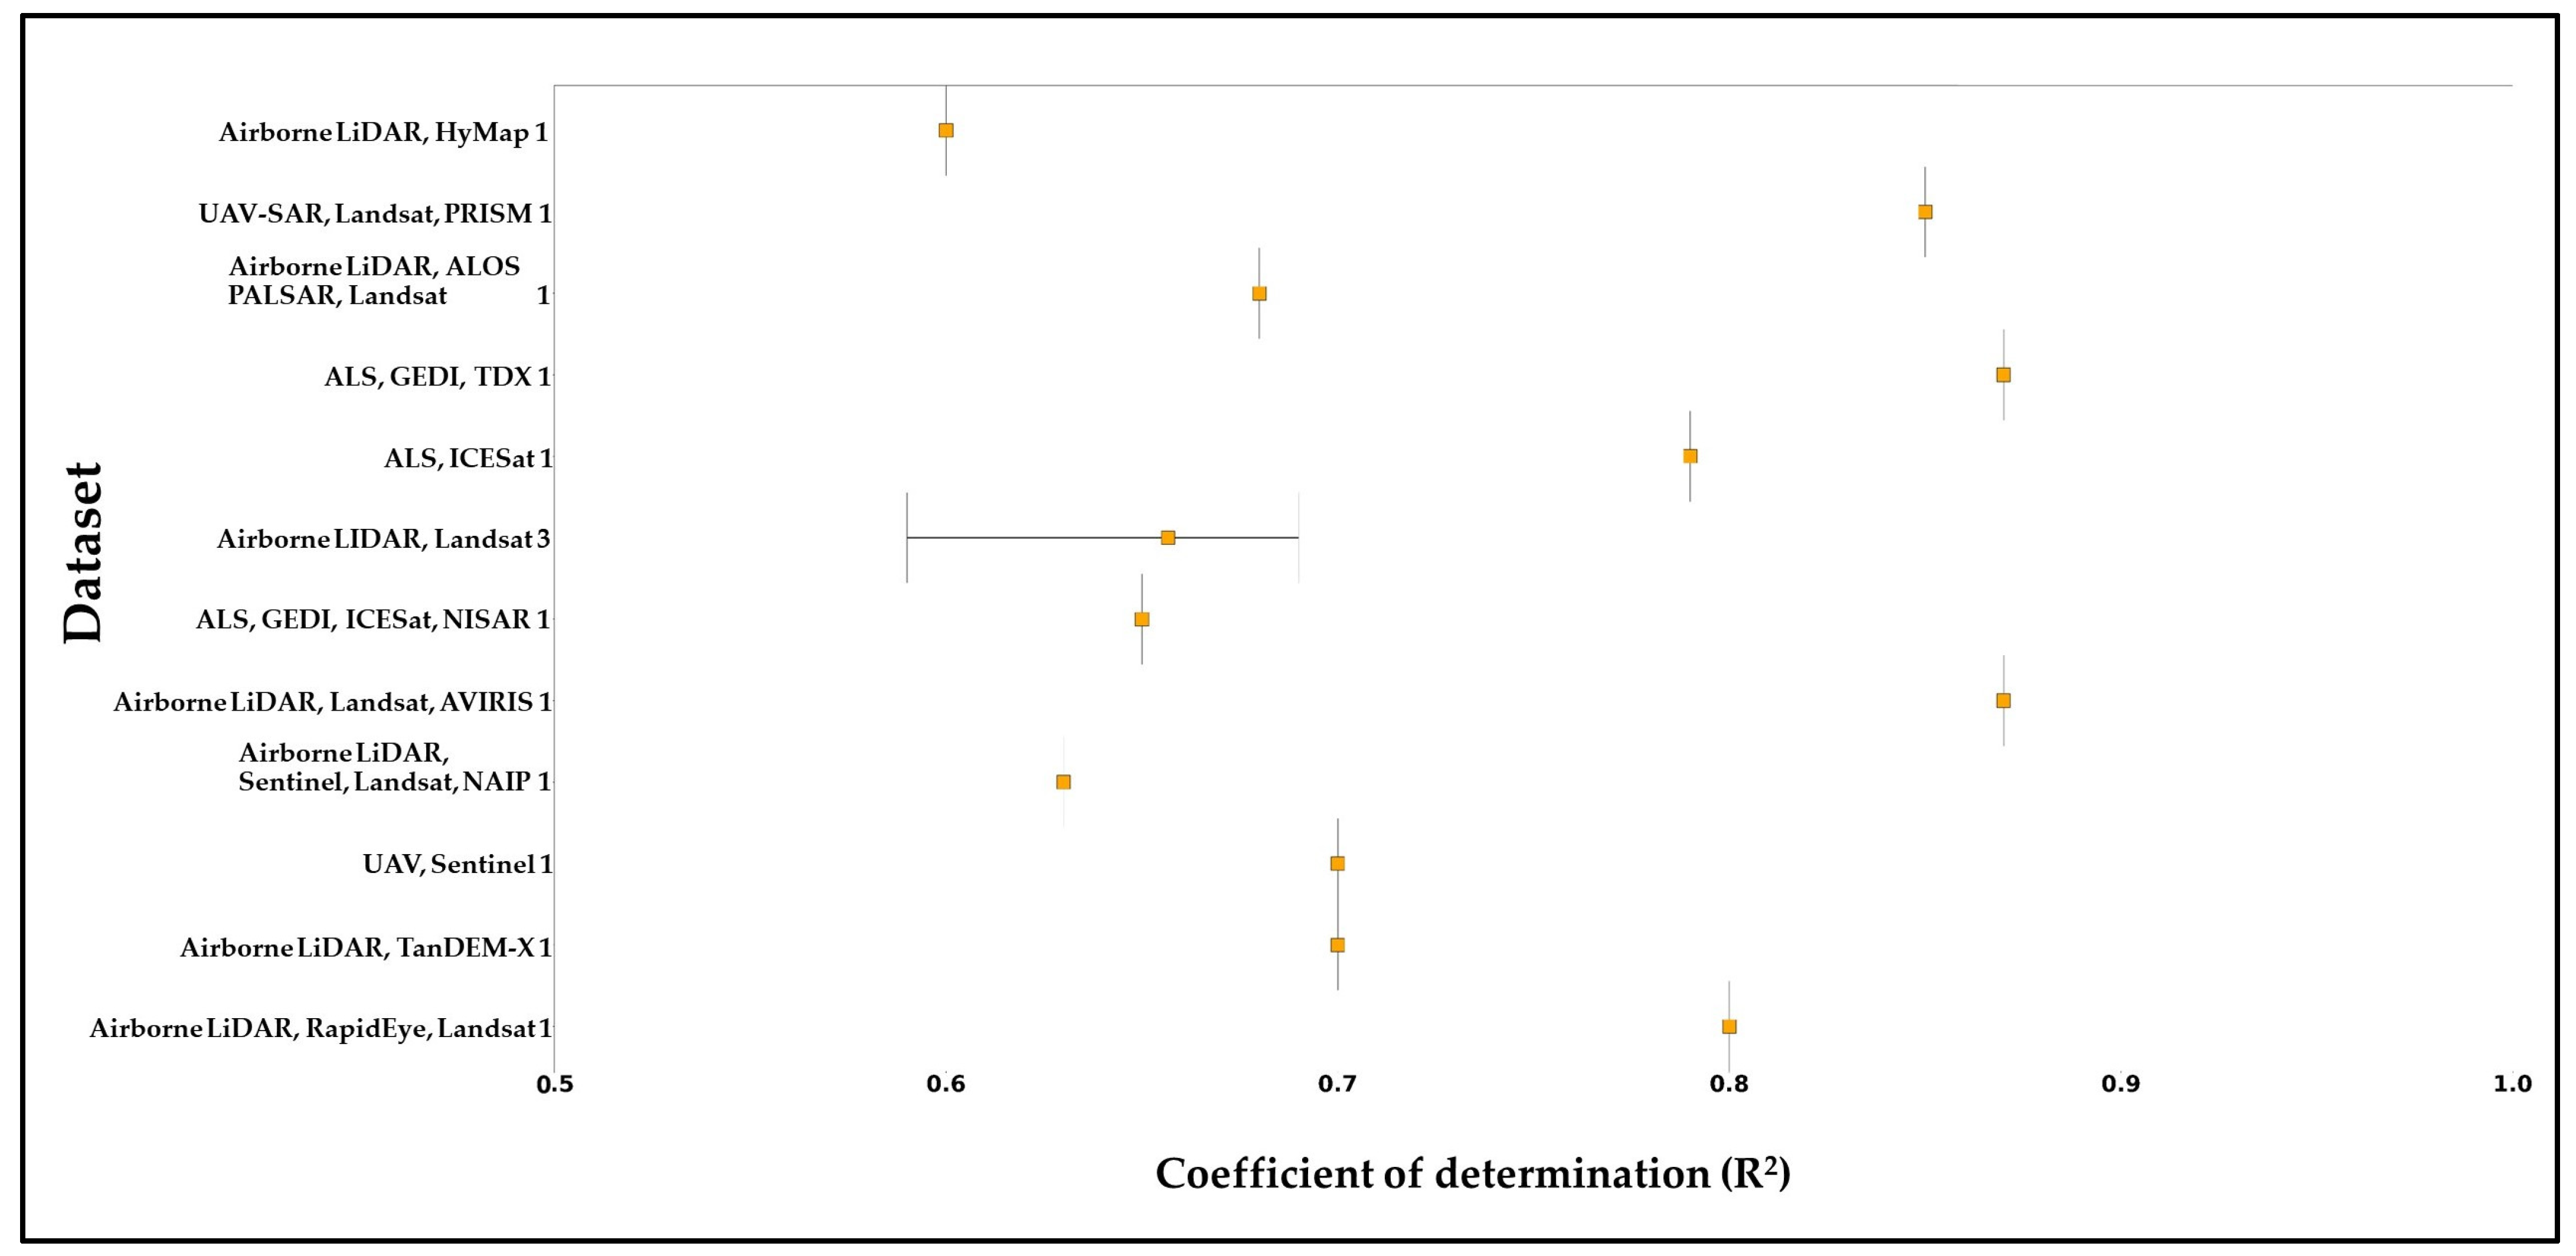
3.3.3. Space- and Airborne Analysis
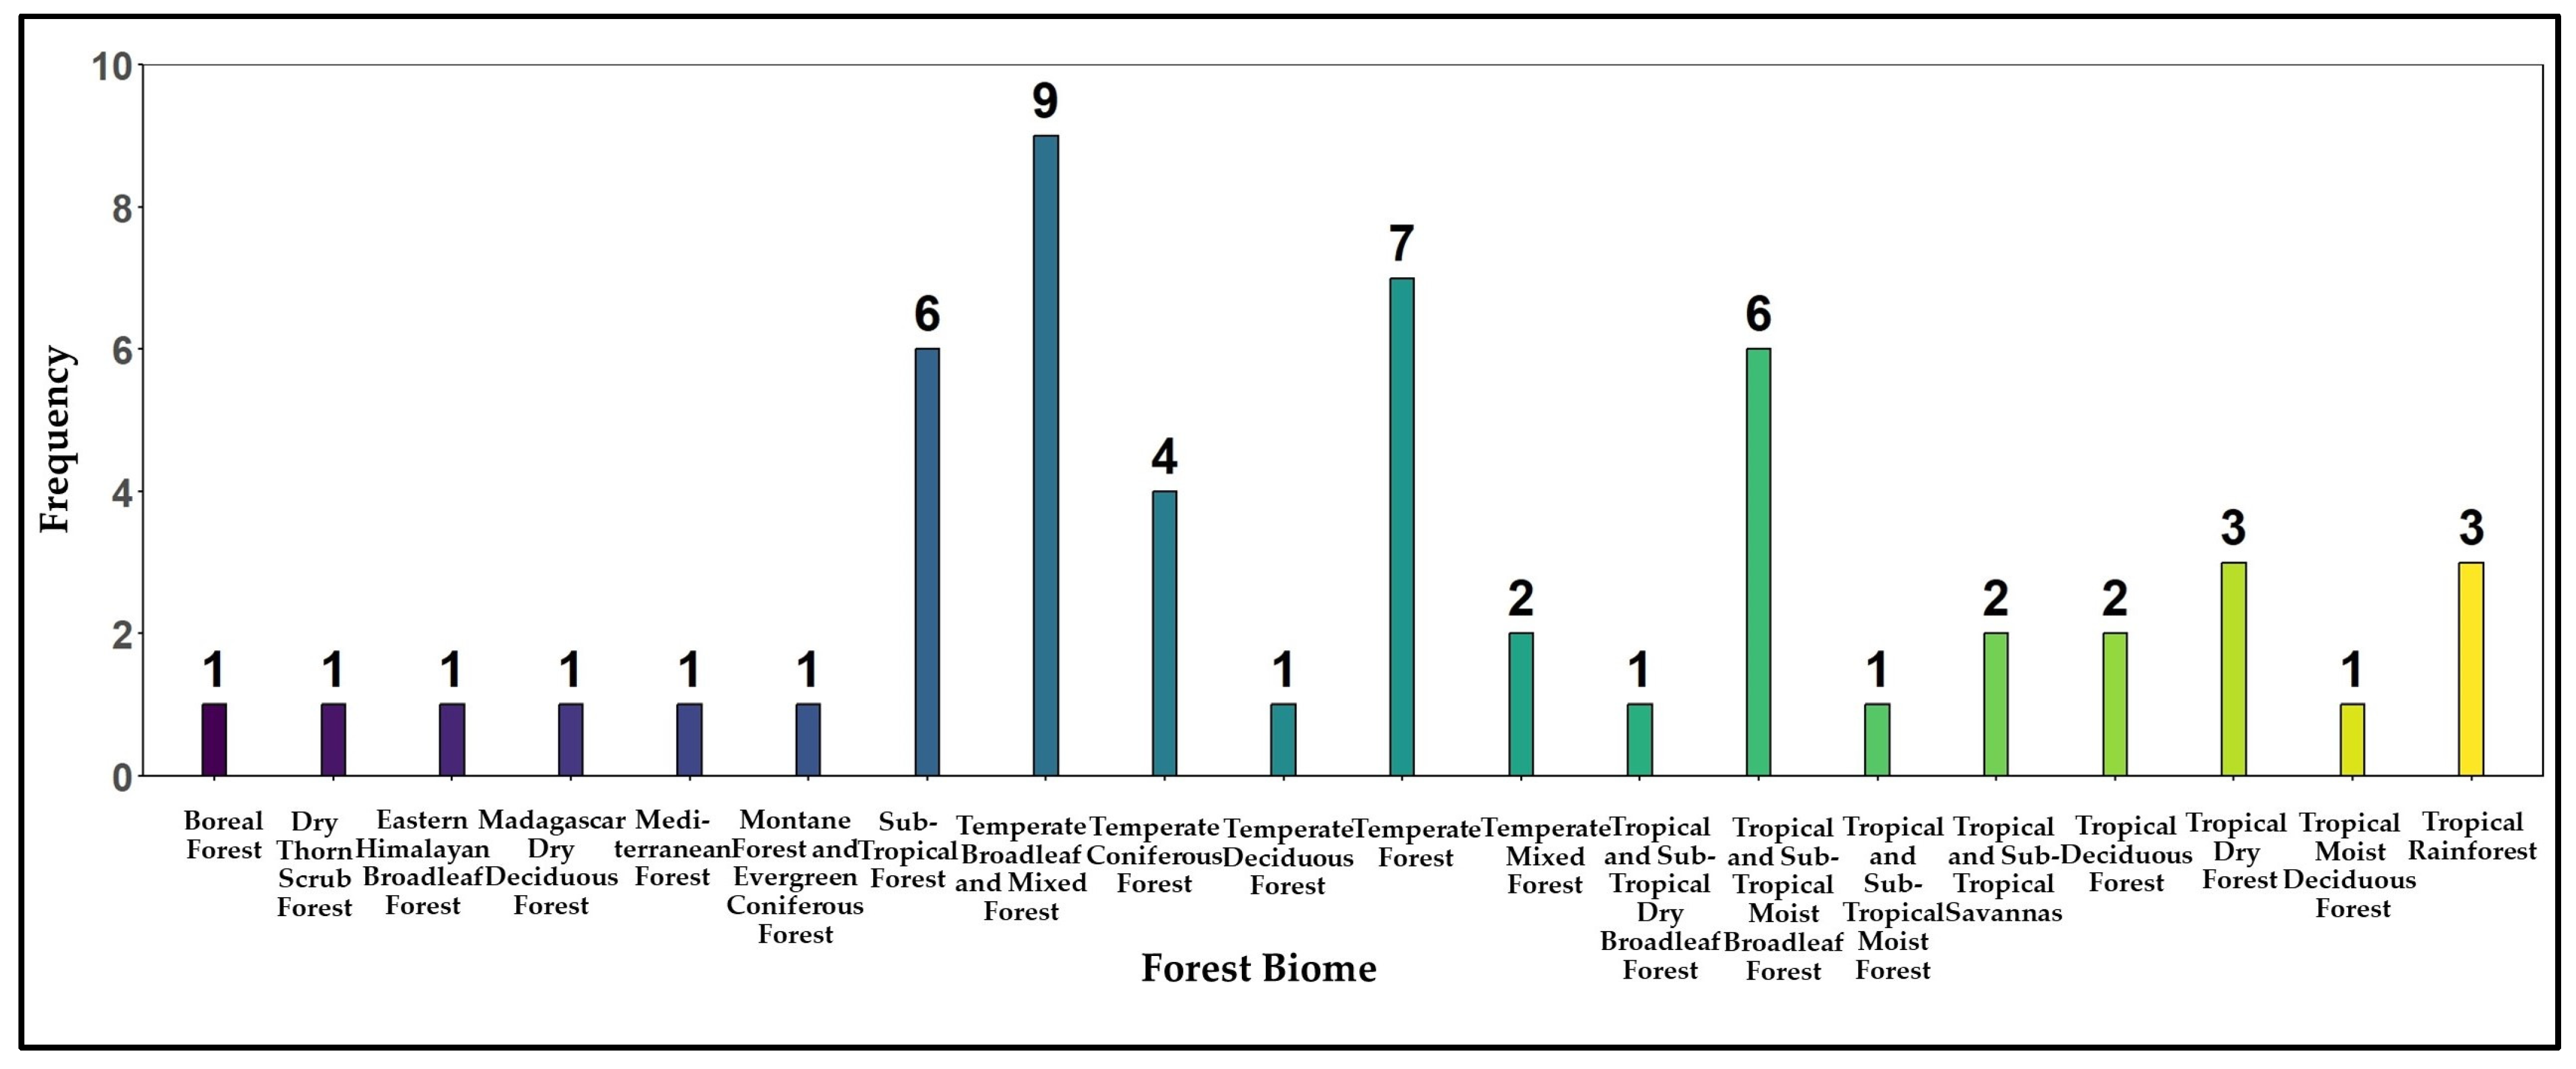
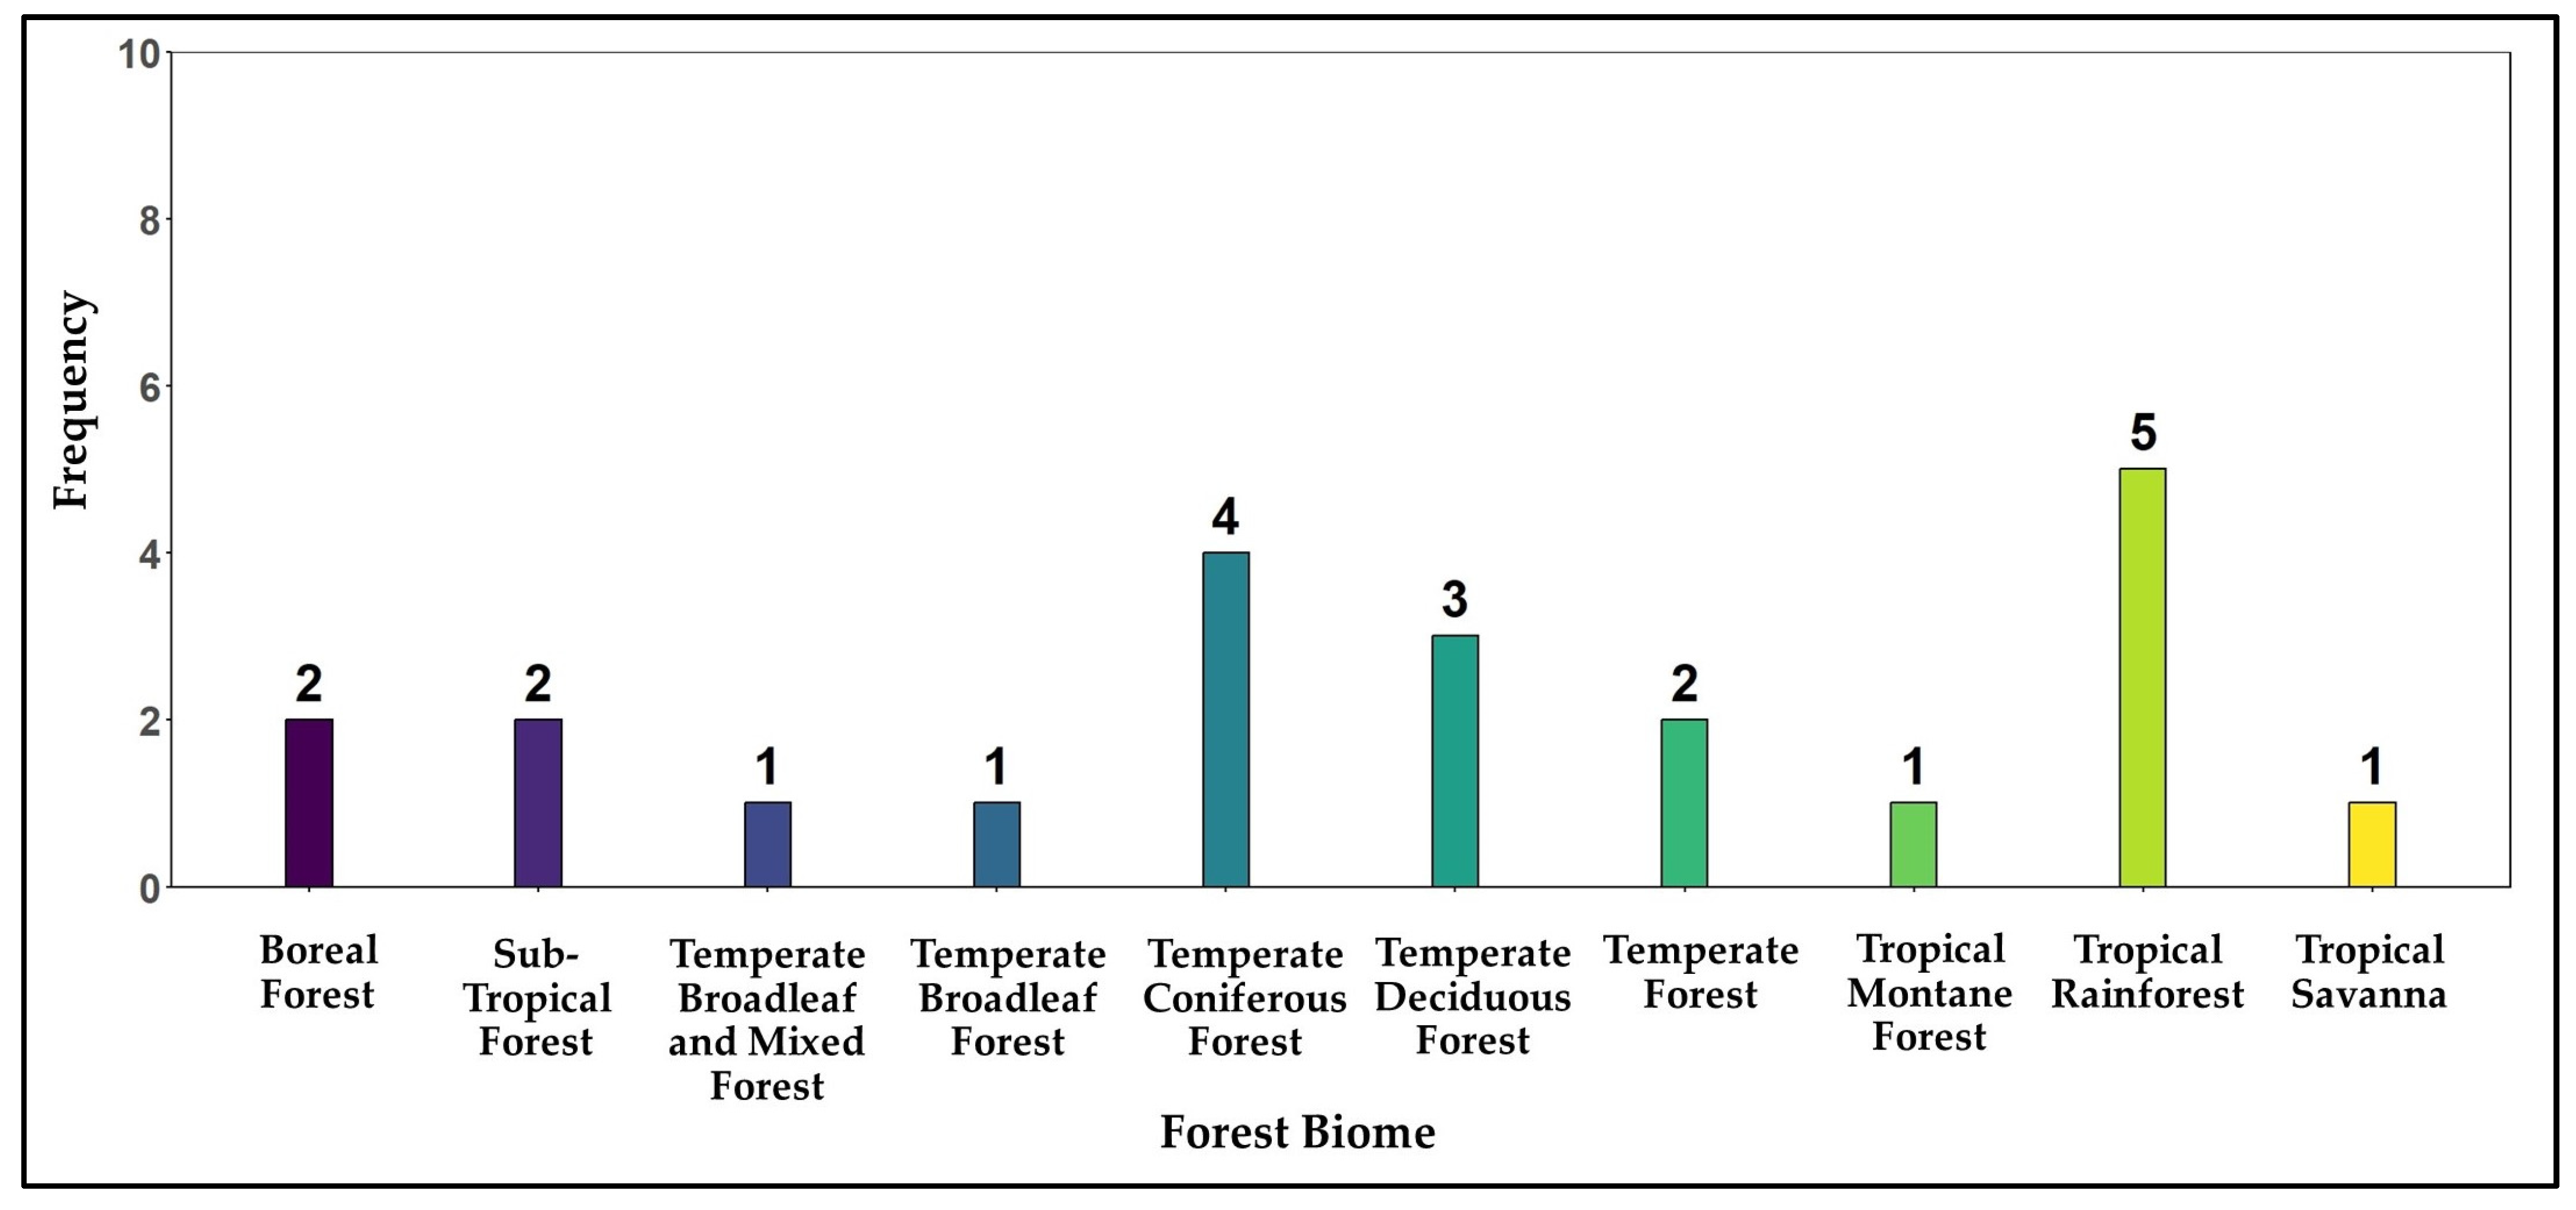
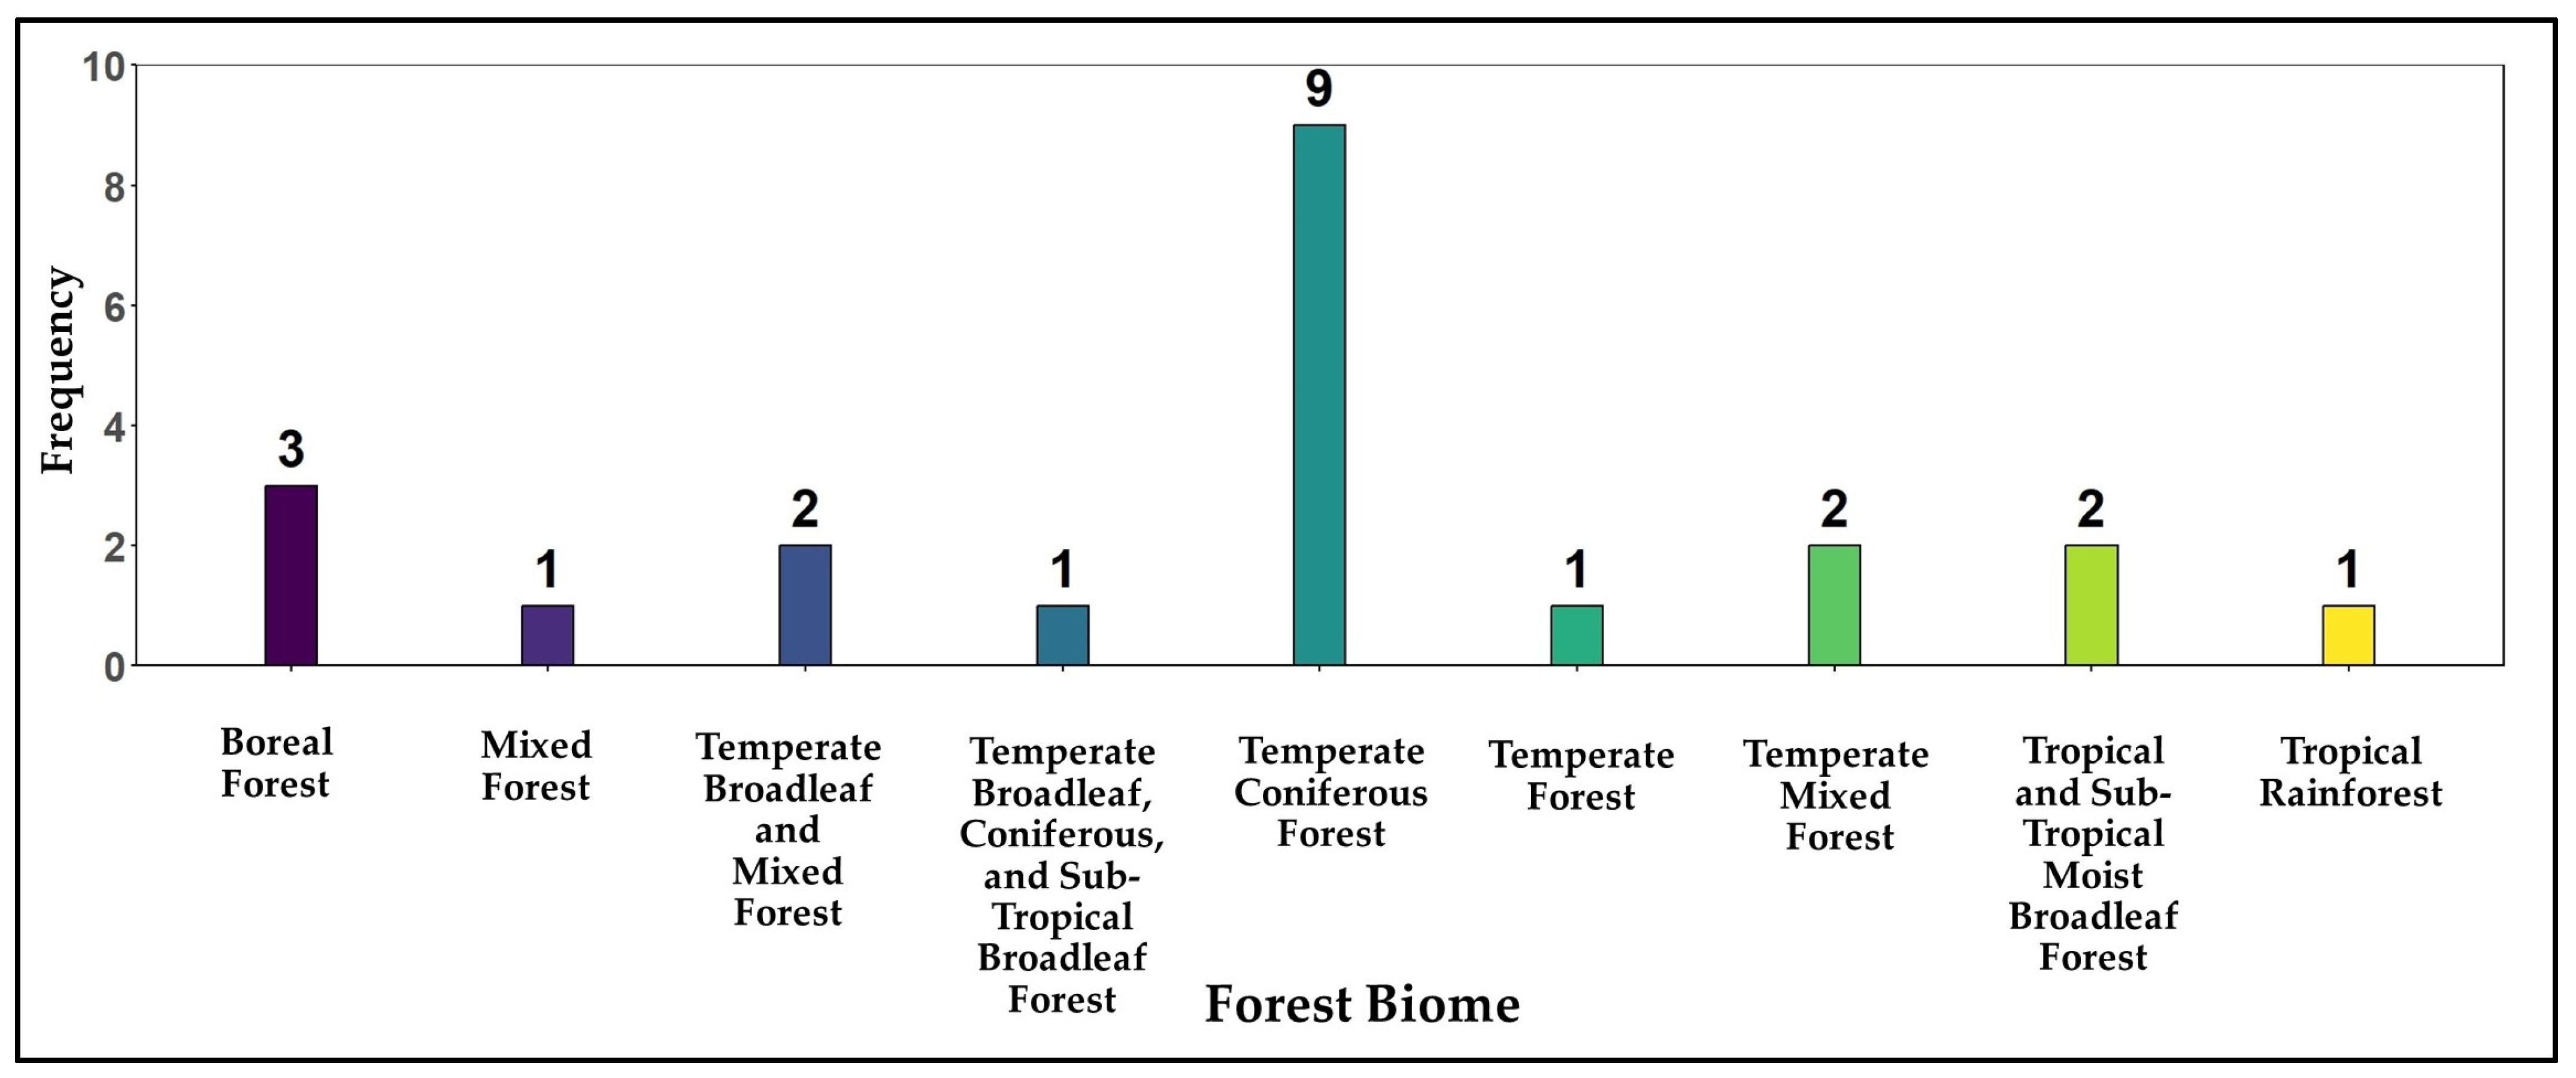
3.4. Remote Sensing Platform Datasets in Forest Biome
4. Discussion
4.1. Discussion
4.2. Uncertainty in Forest AGB Estimation
4.3. Limitations
4.4. Future Research Scope and Recommendations
5. Conclusions
Author Contributions
Funding
Data Availability Statement
Acknowledgments
Conflicts of Interest
Abbreviations
| Sr # | Abb | Word/Phrase |
| 1 | AGB | Aboveground Biomass |
| 2 | SLR | Systematic Literature Review |
| 3 | PRISMA | Preferred Reporting Items for Systematic Reviews and Meta-Analysis |
| 4 | WoS | Web of Science |
| 5 | nRMSE | Normalized Root Mean Square Error |
| 6 | R2 | Coefficient of Determination |
| 7 | GLAS | Geoscience Laser Altimeter System |
| 8 | GEDI | Global Ecosystem Dynamics Investigation |
| 9 | LiDAR | Light Detection and Ranging |
| 10 | UAV | Uncrewed Aerial Vehicle |
| 11 | RVoG | Randomly Orientated Volume Layer Over the Ground Surface |
| 12 | FVC | Fraction of Vegetation Cover |
| 13 | FAPAR | Fraction of Absorbed Photosynthetically Active Radiation |
| 14 | CAB | Chlorophyll Content in the Leaf |
| 15 | CWC | Canopy Water Content |
| 16 | SR | Simple Ratio Vegetation Index |
| 17 | NDVI | Normalized-Difference Vegetation Index |
| 18 | NDVI.RE | Transformed Normalized-Difference Vegetation Index |
| 19 | EVI | Enhanced Vegetation Index |
| 20 | TVI.RE | Renormalized Transformed Vegetation Index |
| 21 | IPVI.RE | Renormalized Infrared Percentage Vegetation Index |
| 22 | RDVI.RE | Renormalized Difference Vegetation Index |
| 23 | NDVIc | Corrected Normalized-Difference Vegetation Index |
| 24 | NDWI | Normalized Difference Water Index |
Appendix A

| Spaceborne Dataset Articles | |||||
|---|---|---|---|---|---|
| Reference | Study Area | Data Source | Survey Data | Forest Type | Forest Biome |
| [64] | Caninde de Sao Francisco, Brazil | Sentinel-2 | 40 Plots (30 m × 30 m) | Dry Forest | Dry Thorn Scrub Forest |
| [71] | Shanxia Forest, Jiangxi Province, China | Sentinel-2, Sentinel-1 | 50 Plots (30 m × 30 m) | Sub-Tropical Forest | Sub-Tropical Forest |
| [72] | Dali City, Yunnan Province, China | Sentinel-2, Landsat-5-7-8, PALSAR | 2000 Plots (01–0.2 ha) in 2007 and 2016, 78 Plots (28.5 × 28.5 m) 2011 | Evergreen Coniferous Forests | Montane Forest and Evergreen Coniferous Forests |
| [40] | Zhangwu, Liaoning Province, China | Sentinel-1 and 2, GEDI-L2A | 48 Circular Plots (diameter of 30 m) | Temperate Planted Forest | Temperate Forest |
| [65] | Abbottabad, Pakistan | Sentinel-2 | 60 Plots of Circular Shape (area of 0.1 ha and 17.84 m radius) | Moist Temperate Forests | Temperate Forest |
| [10] | Amazon, Brazil | Landsat, GLAS | GLAS footprints in 283 standardized plots (40 × 40 m) | Tropical Rainforest | Tropical Rainforest |
| [43] | Raghavendra Nagar, Sileru Region, Northern Andhra Pradesh, India | Sentinel-2 | 60 Plots with 0.1 ha (31.63 m × 31.63 m) | Semi-Evergreen, Moist, and Dry Deciduous Forest | Tropical Deciduous Forest |
| [74] | Yunnan, China | Sentinel-2, Landsat-8 | FIA Plots 1776 (25.8 m × 25.8 m) | Sub-Tropical Evergreen Broadleaf and Temperate Coniferous Forests | Sub-Tropical Forest |
| [48] | Magdalena River Valley, Tolima, Colombia | Sentinel-2, Sentinel-1 | 4 Plots (100 m × 100 m with 25 subplots of 20 m × 20 m) | Dry Tropical Forest | Tropical Dry Forest |
| [77] | Lopé National Park, Gabon | LVIS, GEDI-L4A and L2A, TanDEM-X | LVIS Height as a Reference | Tropical Moist Deciduous Forest | Tropical Rainforest |
| [54] | Terai Central Forest Division (TCFD) in Nainital, India | GEDI-L2A, ALOS-2 | 25 Plots | Deciduous Forest | Tropical Deciduous Forest |
| [16] | Mabalane, Mozambique | Landsat-5 and 8, GEDI-L4A | Canopy Structure Extracted from GEDI Data | Tropical Dry Forest | Tropical Dry Forest |
| [17] | Southern Western Australia, Australia | Landsat-5, 7, and 8 | 10,304 Plots | Broadleaf Evergreen Forests | Mediterranean Forest |
| [44] | Ibraki, Japan | PALSAR, Sentinel-2 | 40 Plots (0.04 ha) (for ground-based calibration of the airborne LiDAR data) | Cypress and Cedar Forest | Temperate Broadleaf and Mixed Forest |
| [66] | The Terai Central Forest Division, Uttarakhand, India | GEDI-L2A | 92 Plots (31.6 m × 31.6 m (0.1 hectares)) | Shisham, Acacia, and Kadukkai Forest | Tropical Dry Forest |
| [80] | Saihanba Mechanical Forest, China | ICESat-2, Sentinel-2 | 5396 Plots of Forest Management Inventory (FMI) | Larch, Pine, and Birch Forest | Temperate Coniferous Forest |
| [81] | Shangri-La, Yunnan Province, China | Sentinel-1 and 2, Landsat-8, ICESat-2 | 1193 Trees Measured, with 2015 Forest Survey Data | Pinus, Picea, and Quercus Forest | Temperate Broadleaf and Mixed Forest |
| [84] | Jiayi, Pingjiang County, Yueyang City, Hunan Province, China | Sentinel-2 | 1236 Plots (20 m × 20 m) | Evergreen Broadleaf Forest | Sub-Tropical Forest |
| [41] | Dabie Mountains, China | Gaofen-1, Sentinel-1 | 326 Plots (16 m × 16 m) | Coniferous and Broadleaf Forest | Temperate Mixed Forest |
| [58] | Dabie Mountains, China | Landsat-8 | 681 Plots (0.067 ha in size) | Coniferous and Broadleaf Forest | Temperate Mixed Forest |
| [45] | Malhan Forest Range, Dehradun, India | Radarsat-2 | 38 Plots (0.1 ha) | Mixed Deciduous Forest | Tropical and Sub-Tropical Moist Broadleaf Forest |
| [42] | Wangyedian Forest Farm, China | Landsat-8 | 81 Plots (25 m × 25 m) | Coniferous, Pine, and Larch Forest | Temperate Coniferous Forest |
| [76] | Guizhou Province, China | Sentinel-2, Landsat-8 | 1992 Plots (0.067 ha) | Sub-Tropical Evergreen Broadleaf Forest | Sub-Tropical Forest |
| [47] | Wangyedian Forest Farm, China | Sentinel-2, ALOS, Ziyuan-3 | 67 Plots (25 m × 25 m) | Coniferous, Pine, and Larch Forest | Temperate Coniferous Forest |
| [56] | Bears Ears National Monument (BENM), Utah, USA | Landsat-8; GEDI-L1A, 2A, and 2B | 65 Circular Plots (59 plots with 15 m radii and 6 plots with 18 m radii) | Pine and Juniper Forest | Temperate Coniferous Forest |
| [73] | Minas Gerais State, Brazil | AVNIR-2, PALSAR | 206 Plots (341 m2) | Eucalyptus Forest | Temperate Broadleaf and Mixed Forest |
| [70] | Chenzhou City, Hunnan, China | Landsat-8, Sentinel-1 | 367 Plots (25.82 m × 25.82 m) (0.0667 ha) | Sub-Tropical Evergreen Forest | Sub-Tropical Forest |
| [50] | Kermanshah, Iran | Sentinel-1, Sentinal-2 | 124 Plots (30 m × 30 m) | Oak Forest | Temperate Deciduous Forest |
| [57] | Tuscany, Italy | Landsat-5, PALSAR | 1350 Plots | Broadleaf Forest | Temperate Broadleaf and Mixed Forest |
| [26] | Changbai Mountains, Jilin Province, China | ALOS PALSAR-2, Sentinel-2, Sentinel-1 | 1167 Plots (10 m × 10 m) | Deciduous Broadleaf Forest | Temperate Broadleaf and Mixed Forest |
| [52] | KwaZulu-Natal, South Africa | Spot-6 | 90 Plots (35 m × 35 m) | Tropical Dry Forest | Tropical and Sub-Tropical Dry Broadleaf Forest |
| [46] | Yichun, China | Sentinel-2, Sentinel-1 | 44 Plots (20 m × 20 m) | Coniferous and Broadleaf Forest | Temperate Mixed Forest |
| [49] | Yok Don National Park, Vietnam | Sentinel-2 | 58 Plots (25 m × 25 m for deciduous broadleaf forest and 33.3 m × 30 m for evergreen broadleaf forest) | Evergreen and Deciduous Broadleaf Forest | Tropical and Sub-Tropical Moist Broadleaf Forest |
| [79] | Thuan Chau, Son La Province, Vietnam | Sentinel-2 | 240 Plots (30 m × 33.3 m) (0.1 ha) | Evergreen Broadleaf and Limestone Forest | Tropical and Sub-Tropical Moist Broadleaf Forest |
| [55] | Minas Gerais State, Brazil | Landsat-5 | 188 Plots (10 m × 100 m) | Semi-Deciduous Forest | Tropical and Sub-Tropical Moist Forest |
| [83] | Dudhwa National Park, India | ALOS-PALSAR | 170 Plots (0.1 ha size) | Semi-Evergreen and Moist Deciduous Forest | Tropical and Sub-Tropical Moist Broadleaf Forest |
| [85] | Xishuangbanna, Yunnan, China | GLAS | 26 Plots (radius of 7.5 m, or 15 m radius plot if slope > 15°) | Tropical Mountain Rainforest | Tropical Rainforest |
| [88] | West Kameng and Tawang Districts of Arunachal Prades, India | ALOS-PALSAR, Sentinel-1, Landsat-TM | 57 Different Belt Transects (size of transects 500 × 10 m (0.5 ha), quadrat size (10 m × 10 m)) | Eastern Himalayan Forests | Eastern Himalayan Broadleaf Forest |
| [39] | Katerniaghat Wildlife Sanctuary, India | Sentinel-2, Sentinel-1 | 70 Plots (20 m × 20 m) (0.04 ha area) | S. Robusta Forest | Tropical Moist Deciduous Forest |
| [59] | Mukuvisi Woodland, Harare, Zimbabwe | GeoEye-1 | 41 Tree Canopy Information | Deciduous Dry Miombo Forest | Tropical and Sub-Tropical Savannas |
| [51] | Quebec City, Canada | TanDEM-X, SRTM, Landsat-8 | 200 Circular Plots (radius of 11.28 m) | Boreal Forest | Boreal Forest |
| [62] | Cape St. Mary, Madagascar | ALOS PALSAR | 572 Plots (30 m radius with size of 0.28 ha in moist forest and 20 m radius with 0.13 ha size in dry or spiny forest) | Dry, Spiny, and Moist Forest | Madagascar Dry Deciduous Forest |
| [63] | Himalayan Belt of Uttar Pradesh, India | ALOS PALSAR | 41 Plots (20 m × 20 m) | Tropical Deciduous Mixed Forest | Tropical and Sub-Tropical Moist Broadleaf Forest |
| [75] | Changbai Mountain, China | GLAS, Landsat-5 | 58 Plots (7.5 m radius central plot located at the center of a GLAS footprint) | Evergreen Deciduous and Coniferous Forest | Temperate Broadleaf and Mixed Forest |
| [86] | Northeast Conghua, Guangdong, China | Landsat-8, Sentinel-1 | 60 Plots (30 m × 30 m) | Coniferous and Broadleaf Mixed Forest | Temperate Mixed Forest |
| [87] | San Rossore, Italy | ALOS-PALSAR | 60 Circular Plots (13 m radius plot, all trees with DBH of at least 9.5 cm) | Conifers and Deciduous Broadleaf Forest | Temperate Broadleaf and Mixed Forest |
| [82] | Liwale District, Tanzania | RapidEye, Landsat-8, ALOS-PALSAR, TanDEM-X | 88 Circular Plots (15 m radius) | Miombo Forest | Tropical and Sub-Tropical Savannas |
| [78] | Zhejiang Province, China | Landsat-5 TM, ALOS-PALSAR | 802 Plots (20 m × 20 m) | Sub-Tropical Evergreen Broadleaf Forest | Sub-Tropical Forest |
| [78] | Pune, Raigarh, India | Landsat-5 | 162 Plots (31.5 m × 31.5 m) | Moist Deciduous Forest | Tropical and Sub-Tropical Moist Broadleaf Forest |
| [69] | Sappi Clan Forests, KwaZulu Natal, South Africa | Worldview-2 | 181 Plots (radius 10 m) | Eucalyptus and Pine Forest | Temperate Forest |
| [60] | Kashmir Himalayas, India | Landsat-5 | 45 Plots (0.1 ha) | Himalayan Temperate Deciduous and Fir Forest | Temperate Broadleaf and Mixed Forest |
| [67] | KwaZulu Natal Province, South Africa | Landsat-7 and 8 | 181 Plots (400 m radius circular plots, distributed systematically (100 m) within the stand) | Eucalyptus and Pine Forest | Temperate Forest |
| [68] | KwaZulu Natal Province, South Africa | Landsat-8 | 181 Plots (10 m radius circular plots, distributed systematically (100 m) within the stand) | Eucalyptus and Pine Forest | Temperate Forest |
| [53] | Karlsruhe, Germany | EO-1, WorldView-2, TanDEM-X | 303 Circular Plots (2 m, 3 m, 6 m, and 12 m radius) | European Temperate Forest | Temperate Broadleaf and Mixed Forest |
Appendix B
| Airborne Dataset Articles | |||||
|---|---|---|---|---|---|
| Reference | Study Area | Data Source | Survey Data | Forest Type | Forest Biome |
| [104] | Jiangxi Nanfengmian National Reserve, China | UAV-LiDAR | 40 × 40 m Sample Plot | Sub-Tropical Evergreen Broadleaf Forest | Sub-Tropical Forest |
| [105] | Paracou, French Guiana | Airborne LiDAR, Airborne SAR | 16 Plots (twelve 9 ha plots (300 m × 300 m) in 1984, three 9 ha plots (300 m × 300 m) in 1992, one 25 ha (500 m × 500 m) in 1992) | Moist Tropical Forest | Temperate Coniferous Forest |
| [91] | Orozko, Spain | Airborne LiDAR | 55 Plots (area 0.2 ha) | Pine Forest | Temperate Forest |
| [97] | Sierra Nevada, CA, USA | LVIS, Airborne LiDAR | 73 Plots (30–50 m, 25 m, 20 m) | Temperate Deciduous and Conifer Forest | Tropical Montane Forest |
| [98] | Ulu Padas, Malaysia | Airborne LiDAR | 76 Plots in 2012 (30 × 30 m, except for logged forest plots (2 plots of 20 m × 20 m) and high AGB plot (1 plot of 50 m × 50 m)); 56 Plots in 2017 (30 × 30 m). | Tropical Montane Forest | Temperate Broadleaf and Mixed Forest |
| [100] | Baima Snow Mountain National Nature Reserve, China | UAV RGB Imagery, UAV LiDAR | 34 Plots (30 × 30 m) | Conifer and Broadleaf Forest | Tropical Rainforest |
| [107] | Gabon Lopé National Park, Gabon | Airborne SAR, Airborne LiDAR | 14 Plots (plot area 12.5 ha) | Tropical Forest | Temperate Deciduous Forests |
| [95] | Paracou, Sinnamary, French Guiana | PolInSAR, Airborne LiDAR | 19 Plots of 6.25 ha (250 × 250 m2) | Tropical Rainforest | Temperate Deciduous Forests |
| [99] | Jiangsu Province, China | Airborne LiDAR | 32 Circular Plots (20 × 20 m2) | Moso Bamboo Sub-Tropical Forest | Sub-Tropical Forest |
| [96] | Amazon, Brazil | Airborne LiDAR, Airborne Hyper Spectral | FIA 132 Plots (116 plots of 0.25 ha and 16 plots of 0.16 ha) | Tropical Forest | Tropical Forest |
| [101] | Tanana Inventory Unit, Alaska, USA | ALS | A—FIA data (94 field clusters included 366 (7.32 m radius) plots). B—The Department of Defense field dataset consisted of 160 FIA clusters incorporating 603 permanent plots of a 7.32 m radius. C—The BCEF included 59 clusters (226 plots), and the CPCRW dataset included 38 clusters (146 plots). | Boreal Forest | Temperate Deciduous Forest |
| [93] | Moravian-Silesian Beskydy Mountains, Czech Republic | ALS-HS Data, Airborne LiDAR | 93 Plots in Circular Shape with an Area of 500 m2 (radius of 12.62 m) | Spruce, Beech, and Broadleaf Forest | Tropical Rainforest |
| [94] | BCA (Bia), Dadieso Forest Reserve, Ghana | Airborne LiDAR | 40 plots (40 × 40 m) | Moist Evergreen and Semi-Deciduous Forest | Tropical Rainforest |
| [89] | Águeda, Portugal | Airborne LiDAR | 40 Plots (400 m2) | Eucalyptus Forest | Temperate Broadleaf Forest |
| [24] | Minnesota, USA | Airborne LiDAR | NFI 598 Plots (7.32 m radius circular subplots) | Fir and Spruce Forest | Tropical Savanna |
| [90] | Liwale, Tanzania | Airborne LiDAR | 513 Plots (the distance between plot centers within a cluster was 250 m) | Miombo Forest | Tropical Rainforest |
| [108] | Nouragues Ecological Research Station, French Guiana | Airborne LiDAR, Airborne SAR | A—2 plots at the Nouragues site (1000 × 100 m2, (400 × 300 m2). The 2 were subdivided into 100 × 100 m2 subplots, resulting in 22 study plots of 1 ha. Five additional plots were included, three of 1 ha (100 × 100 m2) and two 0.25 ha plots (50 × 50 m2). B—16 plots at the Sinnamary: 15 plots of (250 × 250 m2) (6.25 ha) and one plot of (500 × 500 m2) (25 ha). Subdivided large plots into 100 × 100 m2. This resulted in 85 field plot units for the Paracou site. | Moist Tropical Forest | Temperate Forest |
| [102] | Liangshui National Reserve, Heilongjiang, China | Airborne LiDAR, Aerial Imagery | 74 Circular Plots (with a radius of 13.8 m) and 600 m2 Area | Broadleaf and Conifer Forest | Boreal Forest |
| [109] | Stor-Elvdal in Hedmark County, Norway | ALS | NFI 145 Circular Plots 250 m2 Area | Spruce and Pine Forest | Boreal Forest |
| [92] | Evo, Finland | ALS | 368 Circular Plots of Radius 9.77 m (300 m2). | Spruce and Pine Forest | Temperate Coniferous Forest |
| [106] | USDA-FS Sagehen Creek Experimental Forest, California, USA | Airborne LiDAR | 80 Circular Plots of 12.6 m Radius (0.05 ha) | Conifer Forest | Temperate Coniferous Forest |
| [103] | Swiss National Park, Switzerland | Airborne APEX | 35 Plots (30 × 30 m) | Pine and Larch Forest | Temperate Coniferous Forest |
Appendix C
| Spaceborne—Airborne Dataset Articles | |||||
|---|---|---|---|---|---|
| Reference | Study Area | Data Source | Survey Data | Forest Type | Forest Biome |
| [127] | Terai Arc Landscape, Nepal | Airborne LiDAR, RapidEye, Landsat-5 | 632 Plots (radius 12.5 m) | Continuous Dense Forest (Sal, Chir Pine, Karmal, Marking Nut) | Tropical and Sub-Tropical Moist Broadleaf Forest |
| [113] | Teshio Experimental Forest, Hokkaido, Japan | Airborne LiDAR, TanDEM-X | LiDAR-derived AGB as Reference AGB Data | Deciduous Broadleaf and Coniferous Forest | Temperate Broadleaf and Mixed Forest |
| [118] | China | UAV-LiDAR, Sentinel-2 | 1370 Plots (20 m × 20 m, except forty circular plots with a radius of 15 m and thirty 30 m × 30 m square plots in Site 3) | Temperate Needleleaf–Broadleaf, Temperate Coniferous, and Sub-Tropical Evergreen Broadleaf Forest | Temperate Broadleaf, Coniferous, and Sub-Tropical Broadleaf Forest |
| [112] | North Carolina, USA | Airborne LiDAR, Sentinel-1, Landsat-8, NAIP | FIA 227 Plots (each plot consisted of four 7.3 m radius subplots) | Coniferous Forest | Temperate Coniferous Forest |
| [130] | Sierra National Forest, CA, USA | ALS, Sentinel-1 | Plot Inventory Data (10.1109/JSTARS.2018.2851606) | Ponderosa Pine and Incense Cedar Forest | Temperate Coniferous Forest |
| [125] | Sonoma County, California, USA | Airborne LiDAR, Landsat-7, AVIRIS | 166 Plots | Conifer and Deciduous Forest | Temperate Mixed Forest |
| [121] | Sonoma County, California, USA | ALS, GEDI, ICESat-2, NISAR | ALS Reference Map | Conifers, Deciduous, and Mixed Forests | Temperate Mixed Forest |
| [117] | Khao Yai National Park, Thailand | Airborne LiDAR, Landsat-8, Sentinel-2, WorldView-3 | 70 Field Plots (0.5 ha) | Semi-Evergreen and Deciduous Forests | Temperate Coniferous Forest |
| [123] | Sonoma County, California, USA | ALS, GEDI-L4A, ICESat-2, NISAR, UAV-SAR | ALS Reference Map | Conifer Forest | Temperate Coniferous Forest |
| [114] | Victoria, Australia | Airborne LiDAR, Landsat | FIA 633 Circular Plots (0.4 ha) | Sclerophyll Forests | Temperate Forest |
| [115] | Mondah, Gabon | UAV-SAR, PALSAR-2, GEDI | LVIS-derived AGB Reference Map | Tropical Forest | Tropical Rainforest |
| [120] | Walker County, Texas, USA | ALS, ICESat-2 | Ground-measured tree heights and crown diameters from a total of 705 pine trees and 603 deciduous trees from field inventories were used to obtain TreeVaW coefficients. | Pine Forest | Temperate Coniferous Forest |
| [110] | LaRioja, Spain | ALS, Landsat | 150 SNFI Plots (25 m radius plot) | Scots Pine Forest | Temperate Coniferous Forest |
| [128] | White Mountain National Forest in New Hampshire, USA | ALS, InSAR, GEDI, TDX | 16 Plots (25 m × 25 m), 12 Plots (1 ha) | Mixed Temperate Forest | Temperate Broadleaf and Mixed Forest |
| [126] | Yucatan Peninsula, Mexico | Airborne LiDAR, ALOS PALSAR, Landsat-5 and 7 | 312 Plots (1 ha) | Deciduous and Conifer Forest | Tropical and Sub-Tropical Moist Broadleaf Forest |
| [129] | The Tanana Valley State Forest, USA | Airborne LiDAR, Landsat-8 | FIA Plots 827 (7.3 m radius) | Boreal Forest | Boreal Forest |
| [124] | Howland, USA | UAV-SAR, Landsat-5, PRISM | A—24 plots (50 m × 200 m per plot, each plot being divided into sixteen 25 m × 25 m subplots) in 2009. B—10 plots (50 m × 100 m) and 1 plot (50 m × 50 m) in 2010 | Boreal and Temperate Forest | Mixed Forest |
| [111] | Saskatchewan, Canada | Airborne LIDAR, Landsat-5 | 4340 LiDAR Plots | Spruce and Pine Forest | Boreal Forest |
| [131] | Hedmark County, Norway | Airborne LiDAR, Landsat-5 | 662 Plots (circular plots of 250 m2) | Spruce and Pine Forest | Boreal Forest |
| [119] | San Carlos Apache Reservation, Arizona, USA | Airborne LiDAR, Landsat-8 | 39 Plots (30 m × 30 m) | Pine and Juniper Forest | Temperate Coniferous Forest |
| [116] | Karlsruhe, Germany | Airborne LiDAR, HyMap | 297 Plots (2, 3, 6, and 12 m radii in 200 × 100 m grid) | Pine and Coniferous Forest | Temperate Coniferous Forest |
| [122] | Hokkaido University, Japan | Aerial Photos, PRISM, PALSAR | 28 Forest Stands Ranging from 0.25 ha (50 m × 50 m) to 3 ha (200 m × 150 m) | Evergreen Needleleaf and Deciduous Broadleaf Forest | Temperate Coniferous Forest |
References
- Abbas, S.; Wong, M.S.; Wu, J.; Shahzad, N.; Muhammad Irteza, S. Approaches of Satellite Remote Sensing for the Assessment of Above-Ground Biomass across Tropical Forests: Pan-Tropical to National Scales. Remote Sens. 2020, 12, 3351. [Google Scholar] [CrossRef]
- Bordoloi, R.; Das, B.; Tripathi, O.P.; Sahoo, U.K.; Nath, A.J.; Deb, S.; Das, D.J.; Gupta, A.; Devi, N.B.; Charturvedi, S.S.; et al. Satellite Based Integrated Approaches to Modelling Spatial Carbon Stock and Carbon Sequestration Potential of Different Land Uses of Northeast India. Environ. Sustain. Indic. 2022, 13, 100166. [Google Scholar] [CrossRef]
- Sedano, F.; Lisboa, S.; Duncanson, L.; Ribeiro, N.; Sitoe, A.; Sahajpal, R.; Hurtt, G.; Tucker, C. Monitoring Intra and Inter Annual Dynamics of Forest Degradation from Charcoal Production in Southern Africa with Sentinel—2 Imagery. Int. J. Appl. Earth Obs. Geoinf. 2020, 92, 102184. [Google Scholar] [CrossRef]
- Xu, L.; Saatchi, S.S.; Yang, Y.; Yu, Y.; Pongratz, J.; Anthony Bloom, A.; Bowman, K.; Worden, J.; Liu, J.; Yin, Y.; et al. Changes in Global Terrestrial Live Biomass over the 21st Century. Sci. Adv. 2021, 7, eabe9829. [Google Scholar] [CrossRef] [PubMed]
- Feng, Y.; Zeng, Z.; Searchinger, T.D.; Ziegler, A.D.; Wu, J.; Wang, D.; He, X.; Elsen, P.R.; Ciais, P.; Xu, R.; et al. Doubling of Annual Forest Carbon Loss over the Tropics during the Early Twenty-First Century. Nat. Sustain. 2022, 5, 444–451. [Google Scholar] [CrossRef]
- Guo, Y.; Zhu, M.; Wu, Y.; Ni, J.; Liu, L.; Xu, Y. Estimating Forest Aboveground Biomass Combining Pléiades Satellite Imagery and Field Inventory Data in the Peak–Cluster Karst Region of Southwestern China. Forests 2023, 14, 1760. [Google Scholar] [CrossRef]
- Cai, Y.; Shi, Q.; Xu, X.; Liu, X. A Novel Approach towards Continuous Monitoring of Forest Change Dynamics in Fragmented Landscapes Using Time Series Landsat Imagery. Int. J. Appl. Earth Obs. Geoinf. 2023, 118, 103226. [Google Scholar] [CrossRef]
- Gyamfi-Ampadu, E.; Gebreslasie, M. Two Decades Progress on the Application of Remote Sensing for Monitoring Tropical and Sub-Tropical Natural Forests: A Review. Forests 2021, 12, 739. [Google Scholar] [CrossRef]
- Khan, M.R.; Khan, I.A.; Baig, M.H.A.; Liu, Z.-J.; Ashraf, M.I. Exploring the Potential of Sentinel-2A Satellite Data for Aboveground Biomass Estimation in Fragmented Himalayan Subtropical Pine Forest. J. Mt. Sci. 2020, 17, 2880–2896. [Google Scholar] [CrossRef]
- Arévalo, P.; Baccini, A.; Woodcock, C.E.; Olofsson, P.; Walker, W.S. Continuous Mapping of Aboveground Biomass Using Landsat Time Series. Remote Sens. Environ. 2023, 288, 113483. [Google Scholar] [CrossRef]
- Chen, H.; Qin, Z.; Zhai, D.-L.; Ou, G.; Li, X.; Zhao, G.; Fan, J.; Zhao, C.; Xu, H. Mapping Forest Aboveground Biomass with MODIS and Fengyun-3C VIRR Imageries in Yunnan Province, Southwest China Using Linear Regression, K-Nearest Neighbor and Random Forest. Remote Sens. 2022, 14, 5456. [Google Scholar] [CrossRef]
- Santoro, M.; Cartus, O.; Carvalhais, N.; Rozendaal, D.M.A.; Avitabile, V.; Araza, A.; De Bruin, S.; Herold, M.; Quegan, S.; Rodríguez-Veiga, P.; et al. The Global Forest Above-Ground Biomass Pool for 2010 Estimated from High-Resolution Satellite Observations. Earth Syst. Sci. Data 2021, 13, 3927–3950. [Google Scholar] [CrossRef]
- Schepaschenko, D.; Moltchanova, E.; Fedorov, S.; Karminov, V.; Ontikov, P.; Santoro, M.; See, L.; Kositsyn, V.; Shvidenko, A.; Romanovskaya, A.; et al. Russian Forest Sequesters Substantially More Carbon than Previously Reported. Sci. Rep. 2021, 11, 12825. [Google Scholar] [CrossRef] [PubMed]
- Ahmad, A.; Gilani, H.; Ahmad, S.R. Forest Aboveground Biomass Estimation and Mapping through High-Resolution Optical Satellite Imagery—A Literature Review. Forests 2021, 12, 914. [Google Scholar] [CrossRef]
- Shendryk, Y. Fusing GEDI with Earth Observation Data for Large Area Aboveground Biomass Mapping. Int. J. Appl. Earth Obs. Geoinf. 2022, 115, 103108. [Google Scholar] [CrossRef]
- Liang, M.; Duncanson, L.; Silva, J.A.; Sedano, F. Quantifying Aboveground Biomass Dynamics from Charcoal Degradation in Mozambique Using GEDI Lidar and Landsat. Remote Sens. Environ. 2023, 284, 113367. [Google Scholar] [CrossRef]
- Liao, Z.; Liu, X.; van Dijk, A.; Yue, C.; He, B. Continuous Woody Vegetation Biomass Estimation Based on Temporal Modeling of Landsat Data. Int. J. Appl. Earth Obs. Geoinf. 2022, 110, 102811. [Google Scholar] [CrossRef]
- D’Oliveira, M.V.N.; Figueiredo, E.O.; de Almeida, D.R.A.; Oliveira, L.C.; Silva, C.A.; Nelson, B.W.; da Cunha, R.M.; de Almeida Papa, D.; Stark, S.C.; Valbuena, R. Impacts of Selective Logging on Amazon Forest Canopy Structure and Biomass with a LiDAR and Photogrammetric Survey Sequence. For. Ecol. Manag. 2021, 500, 119648. [Google Scholar] [CrossRef]
- May, P.; McConville, K.S.; Moisen, G.G.; Bruening, J.; Dubayah, R. A Spatially Varying Model for Small Area Estimates of Biomass Density across the Contiguous United States. Remote Sens. Environ. 2023, 286, 113420. [Google Scholar] [CrossRef]
- Chen, L.; Ren, C.; Zhang, B.; Wang, Z.; Liu, M.; Man, W.; Liu, J. Improved Estimation of Forest Stand Volume by the Integration of GEDI LiDAR Data and Multi-Sensor Imagery in the Changbai Mountains Mixed Forests Ecoregion (CMMFE), Northeast China. Int. J. Appl. Earth Obs. Geoinf. 2021, 100, 102326. [Google Scholar] [CrossRef]
- Hoffr, R.; Teresa, M.; De, J.; Domingo, D.; Luis, A.; García-martín, A.; Revilla, S. Assessing GEDI-NASA System for Forest Fuels Classification Using Machine Learning Techniques. Int. J. Appl. Earth Obs. Geoinf. 2023, 116, 103175. [Google Scholar] [CrossRef]
- Duncanson, L.; Kellner, J.R.; Armston, J.; Dubayah, R.; Minor, D.M.; Hancock, S.; Healey, S.P.; Patterson, P.L.; Saarela, S.; Marselis, S.; et al. Aboveground Biomass Density Models for NASA’s Global Ecosystem Dynamics Investigation (GEDI) Lidar Mission. Remote Sens. Environ. 2022, 270, 112845. [Google Scholar] [CrossRef]
- Ochiai, O.; Poulter, B.; Seifert, F.M.; Ward, S.; Jarvis, I.; Whitcraft, A.; Sahajpal, R.; Gilliams, S.; Herold, M.; Carter, S.; et al. Toward a Roadmap for Space-Based Observations of the Land Sector for the UNFCCC Global Stocktake. iScience 2023, 26, 106489. [Google Scholar] [CrossRef] [PubMed]
- Chen, Q.; McRoberts, R.E.; Wang, C.; Radtke, P.J. Forest Aboveground Biomass Mapping and Estimation across Multiple Spatial Scales Using Model-Based Inference. Remote Sens. Environ. 2016, 184, 350–360. [Google Scholar] [CrossRef]
- Bilous, A.; Myroniuk, V.; Holiaka, D.; Bilous, S.; See, L.; Schepaschenko, D. Mapping Growing Stock Volume and Forest Live Biomass: A Case Study of the Polissya Region of Ukraine. Environ. Res. Lett. 2017, 12, 105001. [Google Scholar] [CrossRef]
- Chen, L.; Wang, Y.; Ren, C.; Zhang, B.; Wang, Z. Assessment of Multi-Wavelength SAR and Multispectral Instrument Data for Forest Aboveground Biomass Mapping Using Random Forest Kriging. For. Ecol. Manag. 2019, 447, 12–25. [Google Scholar] [CrossRef]
- Yang, H.; Ciais, P.; Wigneron, J.P.; Chave, J.; Cartus, O.; Chen, X.; Fan, L.; Green, J.K.; Huang, Y.; Joetzjer, E.; et al. Climatic and Biotic Factors Influencing Regional Declines and Recovery of Tropical Forest Biomass from the 2015/16 El Ni~no. Proc. Natl. Acad. Sci. USA 2022, 119, e2101388119. [Google Scholar] [CrossRef] [PubMed]
- Nguyen, T.H.; Jones, S.; Soto-Berelov, M.; Haywood, A.; Hislop, S. A Comparison of Imputation Approaches for Estimating Forest Biomass Using Landsat Time-Series and Inventory Data. Remote Sens. 2018, 10, 1825. [Google Scholar] [CrossRef]
- Rees, W.G.; Tomaney, J.; Tutubalina, O.; Zharko, V.; Bartalev, S. Estimation of Boreal Forest Growing Stock Volume in Russia from Sentinel-2 Msi and Land Cover Classification. Remote Sens. 2021, 13, 4483. [Google Scholar] [CrossRef]
- Turton, A.E.; Augustin, N.H.; Mitchard, E.T.A. Improving Estimates and Change Detection of Forest Above-Ground Biomass Using Statistical Methods. Remote Sens. 2022, 14, 4911. [Google Scholar] [CrossRef]
- Mutanga, O.; Masenyama, A.; Sibanda, M. Spectral Saturation in the Remote Sensing of High-Density Vegetation Traits: A Systematic Review of Progress, Challenges, and Prospects. ISPRS J. Photogramm. Remote Sens. 2023, 198, 297–309. [Google Scholar] [CrossRef]
- Iskandar; Patak, A.A. Exploring the Research Situation of Carbon Finance: A Scientometric Analysis on Web of Science Database. Int. J. Humanit. Innov. (IJHI) 2019, 2, 108–114. [Google Scholar] [CrossRef]
- Yue, J.; Feng, H.; Jin, X.; Yuan, H.; Li, Z.; Zhou, C.; Yang, G.; Tian, Q. A Comparison of Crop Parameters Estimation Using Images from UAV-Mounted Snapshot Hyperspectral Sensor and High-Definition Digital Camera. Remote Sens. 2018, 10, 1138. [Google Scholar] [CrossRef]
- Xu, X.; Nie, C.; Jin, X.; Li, Z.; Zhu, H.; Xu, H.; Wang, J.; Zhao, Y.; Feng, H. A Comprehensive Yield Evaluation Indicator Based on an Improved Fuzzy Comprehensive Evaluation Method and Hyperspectral Data. Field Crop. Res. 2021, 270, 108204. [Google Scholar] [CrossRef]
- Jones, M.O.; Robinson, N.P.; Naugle, D.E.; Maestas, J.D.; Reeves, M.C.; Lankston, R.W.; Allred, B.W. Annual and 16-Day Rangeland Production Estimates for the Western United States. Rangel. Ecol. Manag. 2021, 77, 112–117. [Google Scholar] [CrossRef]
- Zhao, R.; Zhang, W.; Duan, Z.; Chen, S.; Shi, Z. An Improved Estimate of Soil Carbon Pool and Carbon Fluxes in the Qinghai-Tibetan Grasslands Using Data Assimilation with an Ecosystem Biogeochemical Model. Geoderma 2023, 430, 116283. [Google Scholar] [CrossRef]
- Li, X.; Wigneron, J.P.; Fan, L.; Frappart, F.; Yueh, S.H.; Colliander, A.; Ebtehaj, A.; Gao, L.; Fernandez-Moran, R.; Liu, X.; et al. A New SMAP Soil Moisture and Vegetation Optical Depth Product (SMAP-IB): Algorithm, Assessment and Inter-Comparison. Remote Sens. Environ. 2022, 271, 112921. [Google Scholar] [CrossRef]
- Iskandar, I.; Patak, A.A. The significance of Mendeley usage on the accuracy of citation and references. Int. J. Humanit. Innov. (IJHI) 2019, 2, 108–114. [Google Scholar] [CrossRef]
- Ghosh, S.M.; Behera, M.D. Aboveground Biomass Estimation Using Multi-Sensor Data Synergy and Machine Learning Algorithms in a Dense Tropical Forest. Appl. Geogr. 2018, 96, 29–40. [Google Scholar] [CrossRef]
- Guo, Q.; Du, S.; Jiang, J.; Guo, W.; Zhao, H.; Yan, X.; Zhao, Y.; Xiao, W. Combining GEDI and Sentinel Data to Estimate Forest Canopy Mean Height and Aboveground Biomass. Ecol. Inform. 2023, 78, 102348. [Google Scholar] [CrossRef]
- Han, H.; Wan, R.; Li, B. Estimating Forest Aboveground Biomass Using Gaofen-1 Images, Sentinel-1 Images, and Machine Learning Algorithms: A Case Study of the Dabie Mountain Region, China. Remote Sens. 2022, 14, 176. [Google Scholar] [CrossRef]
- Jiang, F.; Kutia, M.; Ma, K.; Chen, S.; Long, J.; Sun, H. Estimating the Aboveground Biomass of Coniferous Forest in Northeast China Using Spectral Variables, Land Surface Temperature and Soil Moisture. Sci. Total Environ. 2021, 785, 147335. [Google Scholar] [CrossRef] [PubMed]
- Behera, D.; Kumar, V.A.; Rao, J.P.; Padal, S.B.; Ayyappan, N.; Reddy, C.S. Estimating Aboveground Biomass of a Regional Forest Landscape by Integrating Textural and Spectral Variables of Sentinel-2 Along with Ancillary Data. J. Indian Soc. Remote Sens. 2023, 52, 917–929. [Google Scholar] [CrossRef]
- Li, H.; Kato, T.; Hayashi, M.; Wu, L. Estimation of Forest Aboveground Biomass of Two Major Conifers in Ibaraki Prefecture, Japan, from PALSAR-2 and Sentinel-2 Data. Remote Sens. 2022, 14, 468. [Google Scholar] [CrossRef]
- Mukhopadhyay, R.; Kumar, S.; Aghababae, H.; Kulshrestha, A. Estimation of Aboveground Biomass from PolSAR and PolInSAR Using Regression-Based Modelling Techniques. Geocarto Int. 2022, 37, 4181–4207. [Google Scholar] [CrossRef]
- Liu, Y.; Gong, W.; Xing, Y.; Hu, X.; Gong, J. Estimation of the Forest Stand Mean Height and Aboveground Biomass in Northeast China Using SAR Sentinel-1B, Multispectral Sentinel-2A, and DEM Imagery. ISPRS J. Photogramm. Remote Sens. 2019, 151, 277–289. [Google Scholar] [CrossRef]
- Wang, Y.; Zhang, X.; Guo, Z. Estimation of Tree Height and Aboveground Biomass of Coniferous Forests in North China Using Stereo ZY-3, Multispectral Sentinel-2, and DEM Data. Ecol. Indic. 2021, 126, 107645. [Google Scholar] [CrossRef]
- Salazar Villegas, M.H.; Qasim, M.; Csaplovics, E.; González-Martinez, R.; Rodriguez-Buritica, S.; Ramos Abril, L.N.; Salazar Villegas, B. Examining the Potential of Sentinel Imagery and Ensemble Algorithms for Estimating Aboveground Biomass in a Tropical Dry Forest. Remote Sens. 2023, 15, 5086. [Google Scholar] [CrossRef]
- Thi, A.; Dang, N.; Nandy, S.; Srinet, R.; Viet, N.; Ghosh, S. Ecological Informatics Forest Aboveground Biomass Estimation Using Machine Learning Regression Algorithm in Yok Don National Park, Vietnam. Ecol. Inform. 2019, 50, 24–32. [Google Scholar] [CrossRef]
- Safari, A.; Sohrabi, H. Integration of Synthetic Aperture Radar and Multispectral Data for Aboveground Biomass Retrieval in Zagros Oak Forests, Iran: An Attempt on Sentinel Imagery. Int. J. Remote Sens. 2020, 41, 8069–8095. [Google Scholar] [CrossRef]
- Sadeghi, Y.; St-Onge, B.; Leblon, B.; Prieur, J.F.; Simard, M. Mapping Boreal Forest Biomass from a SRTM and TanDEM-X Based on Canopy Height Model and Landsat Spectral Indices. Int. J. Appl. Earth Obs. Geoinf. 2018, 68, 202–213. [Google Scholar] [CrossRef]
- Hlatshwayo, S.T.; Mutanga, O.; Lottering, R.T.; Kiala, Z.; Ismail, R. Mapping Forest Aboveground Biomass in the Reforested Buffelsdraai Landfill Site Using Texture Combinations Computed from SPOT-6 Pan-Sharpened Imagery. Int. J. Appl. Earth Obs. Geoinf. 2019, 74, 65–77. [Google Scholar] [CrossRef]
- Kattenborn, T.; Maack, J.; Faßnacht, F.; Enßle, F.; Ermert, J.; Koch, B. Mapping Forest Biomass from Space—Fusion of Hyperspectral EO1-Hyperion Data and Tandem-X and WorldView-2 Canopy Height Models. Int. J. Appl. Earth Obs. Geoinf. 2015, 35, 359–367. [Google Scholar] [CrossRef]
- Padalia, H.; Prakash, A.; Watham, T. Modelling Aboveground Biomass of a Multistage Managed Forest through Synergistic Use of Landsat-OLI, ALOS-2 L-Band SAR and GEDI Metrics. Ecol. Inform. 2023, 77, 102234. [Google Scholar] [CrossRef]
- Silveira, E.M.O.; Silva, S.H.G.; Acerbi-Junior, F.W.; Carvalho, M.C.; Carvalho, L.M.T.; Scolforo, J.R.S.; Wulder, M.A. Object-Based Random Forest Modelling of Aboveground Forest Biomass Outperforms a Pixel-Based Approach in a Heterogeneous and Mountain Tropical Environment. Int. J. Appl. Earth Obs. Geoinf. 2019, 78, 175–188. [Google Scholar] [CrossRef]
- Campbell, M.J.; Dennison, P.E.; Kerr, K.L.; Brewer, S.C.; Anderegg, W.R.L. Scaled Biomass Estimation in Woodland Ecosystems: Testing the Individual and Combined Capacities of Satellite Multispectral and Lidar Data. Remote Sens. Environ. 2021, 262, 112511. [Google Scholar] [CrossRef]
- Chirici, G.; Giannetti, F.; Mcroberts, R.E.; Travaglini, D.; Pecchi, M.; Maselli, F.; Chiesi, M.; Corona, P. Wall-to-Wall Spatial Prediction of Growing Stock Volume Based on Italian National Forest Inventory Plots and Remotely Sensed Data. Int. J. Appl. Earth Obs. Geoinf. 2020, 84, 101959. [Google Scholar] [CrossRef]
- Li, C.; Li, M.; Iizuka, K.; Liu, J.; Chen, K.; Li, Y. Effects of Forest Canopy Structure on Forest Aboveground Biomass Estimation Using Landsat Imagery. IEEE Access 2021, 9, 5285–5295. [Google Scholar] [CrossRef]
- Mareya, H.T.; Tagwireyi, P.; Ndaimani, H.; Gara, T.W.; Gwenzi, D. Estimating Tree Crown Area and Aboveground Biomass in Miombo Woodlands from High-Resolution RGB-Only Imagery. IEEE J. Sel. Top. Appl. Earth Obs. Remote Sens. 2018, 11, 868–875. [Google Scholar] [CrossRef]
- Wani, A.A.; Joshi, P.K.; Singha, O. Estimating Biomass and Carbon Mitigation of Temperate Coniferous Forests Using Spectral Modeling and Field Inventory Data. Ecol. Inform. 2015, 25, 63–70. [Google Scholar] [CrossRef]
- Das, S.; Singh, T.P. Forest Type, Diversity and Biomass Estimation in Tropical Forests of Western Ghat of Maharashtra Using Geospatial Techniques Forest Type, Diversity and Biomass Estimation in Tropical Forests of Western Ghat of Maharashtra Using Geospatial Techniques. Small-Scale For. 2016, 15, 517–532. [Google Scholar] [CrossRef]
- Ho Tong Minh, D.; Ndikumana, E.; Vieilledent, G.; McKey, D.; Baghdadi, N. Potential Value of Combining ALOS PALSAR and Landsat-Derived Tree Cover Data for Forest Biomass Retrieval in Madagascar. Remote Sens. Environ. 2018, 213, 206–214. [Google Scholar] [CrossRef]
- Ningthoujam, R.K.; Joshi, P.K.; Roy, P.S. Retrieval of Forest Biomass for Tropical Deciduous Mixed Forest Using ALOS PALSAR Mosaic Imagery and Field Plot Data. Int. J. Appl. Earth Obs. Geoinf. 2018, 69, 206–216. [Google Scholar] [CrossRef]
- Rodrigues de Moura Fernandes, M.; Fernandes da Silva, G.; Quintão de Almeida, A.; Marques Fernandes, M.; Ribeiro de Mendonça, A.; Guimarães Gonçalves, F.; Henrique Breda Binoti, D.; Pereira Martins Silva, J. Aboveground Biomass Estimation in Dry Forest in Northeastern Brazil Using Metrics Extracted from Sentinel-2 Data: Comparing Parametric and Non-Parametric Estimation Methods. Adv. Space Res. 2023, 72, 361–377. [Google Scholar] [CrossRef]
- Ahmad, N.; Ullah, S.; Zhao, N.; Mumtaz, F.; Ali, A.; Ali, A.; Tariq, A.; Kareem, M.; Imran, A.B.; Khan, I.A.; et al. Comparative Analysis of Remote Sensing and Geo-Statistical Techniques to Quantify Forest Biomass. Forests 2023, 14, 379. [Google Scholar] [CrossRef]
- Musthafa, M.; Singh, G. ScienceDirect Forest Above-Ground Woody Biomass Estimation Using Multi-Temporal Space-Borne LiDAR Data in a Managed Forest at Haldwani, India. Adv. Space Res. 2022, 69, 3245–3257. [Google Scholar] [CrossRef]
- Dube, T.; Mutanga, O. Evaluating the Utility of the Medium-Spatial Resolution Landsat 8 Multispectral Sensor in Quantifying Aboveground Biomass in UMgeni Catchment, South Africa. ISPRS J. Photogramm. Remote Sens. 2015, 101, 36–46. [Google Scholar] [CrossRef]
- Dube, T.; Mutanga, O. Investigating the Robustness of the New Landsat-8 Operational Land Imager Derived Texture Metrics in Estimating Plantation Forest Aboveground Biomass in Resource Constrained Areas. ISPRS J. Photogramm. Remote Sens. 2015, 108, 12–32. [Google Scholar] [CrossRef]
- Dube, T.; Mutanga, O. The Impact of Integrating WorldView-2 Sensor and Environmental Variables in Estimating Plantation Forest Species Aboveground Biomass and Carbon Stocks in UMgeni Catchment, South Africa. ISPRS J. Photogramm. Remote Sens. 2016, 119, 415–425. [Google Scholar] [CrossRef]
- Li, Y.; Li, M.; Li, C.; Liu, Z. Forest Aboveground Biomass Estimation Using Landsat 8 and Sentinel-1A Data with Machine Learning Algorithms. Sci. Rep. 2020, 10, 9952. [Google Scholar] [CrossRef]
- Chen, Z.; Sun, Z.; Zhang, H.; Zhang, H.; Qiu, H. Aboveground Forest Biomass Estimation Using Tent Mapping Atom Search Optimized Backpropagation Neural Network with Landsat 8 and Sentinel-1A Data. Remote Sens. 2023, 15, 5653. [Google Scholar] [CrossRef]
- Zhang, Y.; Wang, N.; Wang, Y.; Li, M. A new Strategy for Improving the Accuracy of Forest Aboveground Biomass Estimates in an Alpine Region Based on Multi-Source Remote Sensing. GISci. Remote Sens. 2023, 60, 2163574. [Google Scholar] [CrossRef]
- Domingues, G.F.; Soares, V.P.; Leite, H.G.; Ferraz, A.S.; Ribeiro, C.A.A.S.; Lorenzon, A.S.; Marcatti, G.E.; Teixeira, T.R.; de Castro, N.L.M.; Mota, P.H.S.; et al. Artificial Neural Networks on Integrated Multispectral and SAR Data for High-Performance Prediction of Eucalyptus Biomass. Comput. Electron. Agric. 2020, 168, 105089. [Google Scholar] [CrossRef]
- Huang, T.; Ou, G.; Wu, Y.; Zhang, X.; Liu, Z.; Xu, H.; Xu, X.; Wang, Z.; Xu, C. Estimating the Aboveground Biomass of Various Forest Types with High Heterogeneity at the Provincial Scale Based on Multi-Source Data. Remote Sens. 2023, 15, 3550. [Google Scholar] [CrossRef]
- Chi, H.; Sun, G.; Huang, J.; Li, R.; Ren, X.; Ni, W.; Fu, A. Estimation of Forest Aboveground Biomass in Changbai Mountain Region Using ICESat/GLAS and Landsat/TM Data. Remote Sens. 2017, 9, 707. [Google Scholar] [CrossRef]
- Qian, C.; Qiang, H.; Wang, F.; Li, M. Estimation of Forest Aboveground Biomass in Karst Areas Using Multi-Source Remote Sensing Data and the k-Dbn Algorithm. Remote Sens. 2021, 13, 5030. [Google Scholar] [CrossRef]
- Choi, C.; Pardini, M.; Armston, J.; Papathanassiou, K.P. Forest Biomass Mapping Using Continuous InSAR and Discrete Waveform Lidar Measurements: A TanDEM-X/GEDI Test Study. IEEE J. Sel. Top. Appl. Earth Obs. Remote Sens. 2023, 16, 7675–7689. [Google Scholar] [CrossRef]
- Zhao, P.; Lu, D.; Wang, G.; Liu, L.; Li, D.; Zhu, J.; Yu, S. Forest Aboveground Biomass Estimation in Zhejiang Province Using the Integration of Landsat TM and ALOS PALSAR Data. Int. J. Appl. Earth Obs. Geoinf. 2016, 53, 1–15. [Google Scholar] [CrossRef]
- Van Pham, M.; Pham, T.M.; Viet Du, Q.V.; Bui, Q.T.; Van Tran, A.; Pham, H.M.; Nguyen, T.N. Integrating Sentinel-1A SAR Data and GIS to Estimate Aboveground Biomass and Carbon Accumulation for Tropical Forest Types in Thuan Chau District, Vietnam. Remote Sens. Appl. 2019, 14, 148–157. [Google Scholar] [CrossRef]
- Jiang, F.; Deng, M.; Tang, J.; Fu, L.; Sun, H. Integrating Spaceborne LiDAR and Sentinel-2 Images to Estimate Forest Aboveground Biomass in Northern China. Carbon Balance Manag. 2022, 17, 12. [Google Scholar] [CrossRef] [PubMed]
- Deng, Y.; Pan, J.; Wang, J.; Liu, Q.; Zhang, J. Mapping of Forest Biomass in Shangri-La City Based on LiDAR Technology and Other Remote Sensing Data. Remote. Sens. 2022, 14, 5816. [Google Scholar] [CrossRef]
- Næsset, E.; Ørka, H.O.; Solberg, S.; Bollandsås, O.M.; Hansen, E.H.; Mauya, E.; Zahabu, E.; Malimbwi, R.; Chamuya, N.; Olsson, H.; et al. Mapping and Estimating Forest Area and Aboveground Biomass in Miombo Woodlands in Tanzania Using Data from Airborne Laser Scanning, TanDEM-X, RapidEye, and Global Forest Maps: A Comparison of Estimated Precision. Remote Sens. Environ. 2016, 175, 282–300. [Google Scholar] [CrossRef]
- Kumar, S.; Garg, R.D.; Govil, H.; Kushwaha, S.P.S. PolSAR-Decomposition-Based Extended Water Cloud Modeling for Forest Aboveground Biomass Estimation. Remote Sens. 2019, 11, 2287. [Google Scholar] [CrossRef]
- Wang, P.; Tan, S.; Zhang, G.; Wang, S.; Wu, X. Remote Sensing Estimation of Forest Aboveground Biomass Based on Lasso-SVR. Forests 2022, 13, 1597. [Google Scholar] [CrossRef]
- Wang, Y.; Ni, W.; Sun, G.; Chi, H.; Zhang, Z.; Guo, Z. Slope-Adaptive Waveform Metrics of Large Footprint Lidar for Estimation of Forest Aboveground Biomass. Remote Sens. Environ. 2019, 224, 386–400. [Google Scholar] [CrossRef]
- Shao, Z.; Zhang, L.; Wang, L. Stacked Sparse Autoencoder Modeling Using the Synergy of Airborne LiDAR and Satellite Optical and SAR Data to Map Forest Above-Ground Biomass. IEEE J. Sel. Top. Appl. Earth Obs. Remote Sens. 2017, 10, 5569–5582. [Google Scholar] [CrossRef]
- Santi, E.; Paloscia, S.; Pettinato, S.; Fontanelli, G.; Mura, M.; Zolli, C.; Maselli, F.; Chiesi, M.; Bottai, L.; Chirici, G. The Potential of Multifrequency SAR Images for Estimating Forest Biomass in Mediterranean Areas. Remote Sens. Environ. 2017, 200, 63–73. [Google Scholar] [CrossRef]
- Kumar, A.; Kishore, B.S.P.C.; Saikia, P.; Deka, J.; Bharali, S.; Singha, L.B.; Tripathi, O.P.; Khan, M.L. Tree Diversity Assessment and above Ground Forests Biomass Estimation Using SAR Remote Sensing: A Case Study of Higher Altitude Vegetation of North-East Himalayas, India. Phys. Chem. Earth 2019, 111, 53–64. [Google Scholar] [CrossRef]
- Ferraz, A.; Saatchi, S.; Mallet, C.; Jacquemoud, S.; Gonçalves, G.; Silva, C.A.; Soares, P.; Tomé, M.; Pereira, L. Airborne Lidar Estimation of Aboveground Forest Biomass in the Absence of Field Inventory. Remote Sens. 2016, 8, 653. [Google Scholar] [CrossRef]
- Ne, L.T.; Næsset, E.; Gobakken, T.; Mauya, E.W.; Bollandsås, O.M.; Gregoire, T.G.; Ståhl, G.; Zahabu, E. Large-Scale Estimation of Aboveground Biomass in Miombo Woodlands Using Airborne Laser Scanning and National Forest Inventory Data. Remote Sens. Environ. 2016, 186, 626–636. [Google Scholar] [CrossRef]
- Torre-Tojal, L.; Bastarrika, A.; Boyano, A.; Lopez-Guede, J.M.; Graña, M. Above-Ground Biomass Estimation from LiDAR Data Using Random Forest Algorithms. J. Comput. Sci. 2022, 58, 101517. [Google Scholar] [CrossRef]
- Kankare, V.; Vauhkonen, J.; Holopainen, M.; Vastaranta, M.; Hyyppä, J.; Hyyppä, H.; Alho, P. Sparse Density, Leaf-off Airborne Laser Scanning Data in Aboveground Biomass Component Prediction. Forests 2015, 6, 1839–1857. [Google Scholar] [CrossRef]
- Brovkina, O.; Novotny, J.; Cienciala, E.; Zemek, F.; Russ, R. Mapping Forest Aboveground Biomass Using Airborne Hyperspectral and LiDAR Data in the Mountainous Conditions of Central Europe. Ecol. Eng. 2017, 100, 219–230. [Google Scholar] [CrossRef]
- Vaglio Laurin, G.; Puletti, N.; Chen, Q.; Corona, P.; Papale, D.; Valentini, R. Above Ground Biomass and Tree Species Richness Estimation with Airborne Lidar in Tropical Ghana Forests. Int. J. Appl. Earth Obs. Geoinf. 2016, 52, 371–379. [Google Scholar] [CrossRef]
- Liao, Z.; He, B.; Quan, X.; van Dijk, A.I.J.M.; Qiu, S.; Yin, C. Biomass Estimation in Dense Tropical Forest Using Multiple Information from Single-Baseline P-Band PolInSAR Data. Remote Sens. Environ. 2019, 221, 489–507. [Google Scholar] [CrossRef]
- De Almeida, C.T.; Galvão, L.S.; Aragão, L.E.d.O.C.e.; Ometto, J.P.H.B.; Jacon, A.D.; Pereira, F.R.d.S.; Sato, L.Y.; Lopes, A.P.; Graça, P.M.L.d.A.; Silva, C.V.d.J.; et al. Combining LiDAR and Hyperspectral Data for Aboveground Biomass Modeling in the Brazilian Amazon Using Different Regression Algorithms. Remote Sens. Environ. 2019, 232, 111323. [Google Scholar] [CrossRef]
- Ni-Meister, W.; Rojas, A.; Lee, S. Direct Use of Large-Footprint Lidar Waveforms to Estimate Aboveground Biomass. Remote Sens. Environ. 2022, 280, 113147. [Google Scholar] [CrossRef]
- Loh, H.Y.; James, D.; Ioki, K.; Wong, W.V.C.; Tsuyuki, S.; Phua, M.H. Estimating Aboveground Biomass Changes in a Human-Modified Tropical Montane Forest of Borneo Using Multi-Temporal Airborne LiDAR Data. Remote Sens. Appl. 2022, 28, 100821. [Google Scholar] [CrossRef]
- Cao, L.; Coops, N.C.; Sun, Y.; Ruan, H.; Wang, G.; Dai, J.; She, G. Estimating Canopy Structure and Biomass in Bamboo Forests Using Airborne LiDAR Data. ISPRS J. Photogramm. Remote Sens. 2019, 148, 114–129. [Google Scholar] [CrossRef]
- Huang, R.; Yao, W.; Xu, Z.; Cao, L.; Shen, X. Information Fusion Approach for Biomass Estimation in a Plateau Mountainous Forest Using a Synergistic System Comprising UAS-Based Digital Camera and LiDAR. Comput. Electron. Agric. 2022, 202, 107420. [Google Scholar] [CrossRef]
- Ene, L.T.; Gobakken, T.; Andersen, H.; Næsset, E.; Cook, B.D.; Morton, D.C.; Babcock, C.; Nelson, R. Remote Sensing of Environment Large-Area Hybrid Estimation of Aboveground Biomass in Interior Alaska Using Airborne Laser Scanning Data. Remote Sens. Environ. 2018, 204, 741–755. [Google Scholar] [CrossRef]
- Meng, S.; Pang, Y.; Zhang, Z.; Jia, W.; Li, Z. Mapping Aboveground Biomass Using Texture Indices from Aerial Photos in a Temperate Forest of Northeastern China. Remote Sens. 2016, 8, 230. [Google Scholar] [CrossRef]
- Fatehi, P.; Damm, A.; Schweiger, A.; Schaepman, M.E.; Member, S.; Kneubühler, M. Mapping Alpine Aboveground Biomass from Imaging Spectrometer Data: A Comparison of Two Approaches. IEEE J. Sel. Top. Appl. Earth Obs. Remote Sens. 2015, 8, 3123–3139. [Google Scholar] [CrossRef]
- Wang, G.; Li, S.; Huang, C.; He, G.; Li, Y.; Feng, J.; Tang, F. Mapping the Spatial Distribution of Aboveground Biomass in China ’ s Subtropical Forests Based on UAV LiDAR Data. Forests 2023, 14, 1560. [Google Scholar] [CrossRef]
- Ramachandran, N.; Saatchi, S.; Tebaldini, S.; Mariotti, M.; Dikshit, O. Mapping Tropical Forest Aboveground Biomass Using Airborne SAR Tomography. Sci. Rep. 2024, 13, 6233. [Google Scholar] [CrossRef] [PubMed]
- Chen, Q. ISPRS Journal of Photogrammetry and Remote Sensing Modeling Aboveground Tree Woody Biomass Using National-Scale Allometric Methods and Airborne Lidar. ISPRS J. Photogramm. Remote Sens. 2015, 106, 95–106. [Google Scholar] [CrossRef]
- Liu, X.; Zhang, L.; Yang, X.; Liao, M.; Li, W. Retrieval of Tropical Forest Height and Above-Ground Biomass Using Airborne P- And L-Band SAR Tomography. IEEE Geosci. Remote Sens. Lett. 2022, 19, 4012405. [Google Scholar] [CrossRef]
- Ho, D.; Minh, T.; Le, T.; Rocca, F.; Tebaldini, S.; Villard, L.; Réjou-méchain, M.; Phillips, O.L.; Feldpausch, T.R.; Dubois-fernandez, P.; et al. Remote Sensing of Environment SAR Tomography for the Retrieval of Forest Biomass and Height: Cross-Validation at Two Tropical Forest Sites in French Guiana. Remote Sens. Environ. 2016, 175, 138–147. [Google Scholar] [CrossRef]
- McRoberts, R.E.; Næsset, E.; Gobakken, T. Optimizing the K-Nearest Neighbors Technique for Estimating Forest Aboveground Biomass Using Airborne Laser Scanning Data. Remote Sens. Environ. 2015, 163, 13–22. [Google Scholar] [CrossRef]
- Esteban, J.; McRoberts, R.E.; Fernández-Landa, A.; Tomé, J.L.; Næsset, E. Estimating Forest Volume and Biomass and Their Changes Using Random Forests and Remotely Sensed Data. Remote Sens. 2019, 11, 1944. [Google Scholar] [CrossRef]
- Zald, H.S.J.; Wulder, M.A.; White, J.C.; Hilker, T.; Hermosilla, T.; Hobart, G.W.; Coops, N.C. Integrating Landsat Pixel Composites and Change Metrics with Lidar Plots to Predictively Map Forest Structure and Aboveground Biomass in Saskatchewan, Canada. Remote Sens. Environ. 2016, 176, 188–201. [Google Scholar] [CrossRef]
- Woodcock, C.; Song, C. Mapping Forest Aboveground Biomass Using Multisource Remotely Sensed Data. Remote Sens. 2022, 14, 1115. [Google Scholar] [CrossRef]
- Hojo, A.; Avtar, R.; Nakaji, T.; Tadono, T.; Takagi, K. Ecological Informatics Modeling Forest Above-Ground Biomass Using Freely Available Satellite and Multisource Datasets. Ecol. Inform. 2023, 74, 101973. [Google Scholar] [CrossRef]
- Nguyen, T.H.; Jones, S.D.; Soto-Berelov, M.; Haywood, A.; Hislop, S. Monitoring Aboveground Forest Biomass Dynamics over Three Decades Using Landsat Time-Series and Single-Date Inventory Data. Int. J. Appl. Earth Obs. Geoinf. 2020, 84, 101952. [Google Scholar] [CrossRef]
- Marshak, C.; Simard, M.; Duncanson, L.; Silva, C.A.; Denbina, M.; Liao, T.H.; Fatoyinbo, L.; Moussavou, G.; Armston, J. Regional Tropical Aboveground Biomass Mapping with L-Band Repeat-Pass Interferometric Radar, Sparse Lidar, and Multiscale Superpixels. Remote Sens. 2020, 12, 2048. [Google Scholar] [CrossRef]
- Latifi, H.; Fassnacht, F.E.; Hartig, F.; Berger, C.; Hernández, J.; Corvalán, P.; Koch, B. Stratified Aboveground Forest Biomass Estimation by Remote Sensing Data. Int. J. Appl. Earth Obs. Geoinf. 2015, 38, 229–241. [Google Scholar] [CrossRef]
- Jha, N.; Tripathi, N.K.; Barbier, N.; Virdis, S.G.P.; Chanthorn, W.; Viennois, G.; Brockelman, W.Y.; Nathalang, A.; Tongsima, S.; Sasaki, N.; et al. The Real Potential of Current Passive Satellite Data to Map Aboveground Biomass in Tropical Forests. Remote Sens. Ecol. Conserv. 2021, 7, 504–520. [Google Scholar] [CrossRef]
- Yang, Q.; Su, Y.; Hu, T.; Jin, S.; Liu, X.; Niu, C.; Liu, Z.; Kelly, M.; Wei, J.; Guo, Q. Allometry-Based Estimation of Forest Aboveground Biomass Combining LiDAR Canopy Height Attributes and Optical Spectral Indexes. For. Ecosyst. 2022, 9, 100059. [Google Scholar] [CrossRef]
- Wu, Z.; Dye, D.; Vogel, J.; Middleton, B. Estimating Forest and Woodland Aboveground Biomass Using Active and Passive Remote Sensing. Photogramm. Eng. Remote Sens. 2016, 82, 271–281. [Google Scholar] [CrossRef]
- Narine, L.L.; Popescu, S.; Neuenschwander, A.; Zhou, T.; Srinivasan, S.; Harbeck, K. Estimating Aboveground Biomass and Forest Canopy Cover with Simulated ICESat-2 Data. Remote Sens. Environ. 2019, 224, 1–11. [Google Scholar] [CrossRef]
- Silva, C.A.; Duncanson, L.; Hancock, S.; Neuenschwander, A.; Thomas, N.; Hofton, M.; Fatoyinbo, L.; Simard, M.; Marshak, C.Z.; Armston, J.; et al. Fusing Simulated GEDI, ICESat-2 and NISAR Data for Regional Aboveground Biomass Mapping. Remote Sens. Environ. 2021, 253, 112234. [Google Scholar] [CrossRef]
- Motohka, T.; Yoshida, T.; Shibata, H.; Tadono, T. Mapping Aboveground Biomass in Northern Japanese Forests Using the ALOS PRISM Digital Surface Model. IEEE Trans. Geosci. Remote Sens. 2015, 53, 1683–1691. [Google Scholar] [CrossRef]
- Duncanson, L.; Neuenschwander, A.; Hancock, S.; Thomas, N.; Fatoyinbo, T.; Simard, M.; Silva, C.A.; Armston, J.; Luthcke, S.B.; Hofton, M.; et al. Biomass Estimation from Simulated GEDI, ICESat-2 and NISAR across Environmental Gradients in Sonoma County, California. Remote Sens. Environ. 2020, 242, 111779. [Google Scholar] [CrossRef]
- Zhang, Z.; Ni, W.; Sun, G.; Huang, W.; Ranson, K.J.; Cook, B.D.; Guo, Z. Biomass Retrieval from L-Band Polarimetric UAVSAR Backscatter and PRISM Stereo Imagery. Remote Sens. Environ. 2017, 194, 331–346. [Google Scholar] [CrossRef]
- Cooper, S.; Okujeni, A.; Pflugmacher, D.; van der Linden, S.; Hostert, P. Combining Simulated Hyperspectral EnMAP and Landsat Time Series for Forest Aboveground Biomass Mapping. Int. J. Appl. Earth Obs. Geoinf. 2021, 98, 102307. [Google Scholar] [CrossRef]
- Urbazaev, M.; Thiel, C.; Cremer, F.; Dubayah, R.; Migliavacca, M.; Reichstein, M.; Schmullius, C. Estimation of Forest Aboveground Biomass and Uncertainties by Integration of Field Measurements, Airborne LiDAR, and SAR and Optical Satellite Data in Mexico. Carbon Balance Manag. 2018, 13, 5. [Google Scholar] [CrossRef]
- Rana, P.; Tolvanen, A.; Gautam, B.; Srinivasan, S.; Tokola, T. Estimation of Tropical Forest Aboveground Biomass in Nepal Using Multiple Remotely Sensed Data and Deep Learning. Int. J. Remote Sens. 2023, 44, 5147–5171. [Google Scholar] [CrossRef]
- Qi, W.; Saarela, S.; Armston, J.; Ståhl, G.; Dubayah, R. Remote Sensing of Environment Forest Biomass Estimation over Three Distinct Forest Types Using TanDEM-X InSAR Data and Simulated GEDI Lidar Data. Remote Sens. Environ. 2019, 232, 111283. [Google Scholar] [CrossRef]
- Babcock, C.; Finley, A.O.; Andersen, H.E.; Pattison, R.; Cook, B.D.; Morton, D.C.; Alonzo, M.; Nelson, R.; Gregoire, T.; Ene, L.; et al. Geostatistical Estimation of Forest Biomass in Interior Alaska Combining Landsat-Derived Tree Cover, Sampled Airborne Lidar and Field Observations. Remote Sens. Environ. 2018, 212, 212–230. [Google Scholar] [CrossRef]
- Cartus, O.; Santoro, M.; Wegmuller, U.; Labriere, N.; Chave, J. Sentinel-1 Coherence for Mapping Above-Ground Biomass in Semiarid Forest Areas. IEEE Geosci. Remote Sens. Lett. 2022, 19, 1–5. [Google Scholar] [CrossRef]
- Ene, L.T.; Næsset, E.; Gobakken, T. Simulation-Based Assessment of Sampling Strategies for Large-Area Biomass Estimation Using Wall-to-Wall and Partial Coverage Airborne Laser Scanning Surveys. Remote Sens. Environ. 2016, 176, 328–340. [Google Scholar] [CrossRef]
- Rohli, R.V.; Joyner, T.A.; Reynolds, S.J.; Ballinger, T.J. Overlap of Global Köppen-Geiger Climates, Biomes, and Soil Orders. Phys. Geogr. 2015, 36, 158–175. [Google Scholar] [CrossRef]
- Fang, X.; Guo, X.; Zhang, C.; Shao, H.; Zhu, S.; Li, Z.; Feng, X.; He, B. Contributions of Climate Change to the Terrestrial Carbon Stock of the Arid Region of China: A Multi-Dataset Analysis. Sci. Total Environ. 2019, 668, 631–644. [Google Scholar] [CrossRef] [PubMed]


| Database Source | Spaceborne Platform | Airborne Platform | Spaceborne and Airborne Platform | Total |
|---|---|---|---|---|
| ScienceDirect | 30 | 13 | 13 | 56 |
| MDPI | 10 | 4 | 3 | 17 |
| Nature | 1 | 1 | 0 | 2 |
| Scopus | 10 | 2 | 4 | 16 |
| IEEE Xplore | 3 | 2 | 2 | 7 |
| Total | 54 | 22 | 22 | 98 |
| Study Area | Data Source | Research Highlights | Accuracy | Reference |
|---|---|---|---|---|
| Spaceborne Dataset Articles | ||||
| Minas Gerais State, Brazil | AVNIR-2, PALSAR | An artificial neural network with parameters (NIR, B, G, R, polarization levels) was employed. | R2 = 0.95 | [73] |
| Yunnan, China | GLAS | The plane inclined and point of signal ending (PIPE) method was used with parameters (terrain, slope). | R2 = 0.92 | [85] |
| Liaoning Province, China | Senitinel-1 and 2, GEDI-L2A | The random forest model was employed with parameters (FAPAR, vegetation cover, CAB, CWC, vegetation index). | R2 = 0.89 | [40] |
| KwaZulu-Natal, South Africa | Spot-6 | The study employed a random forest model with parameters (homogeneity, entropy, mean, data range, correlation, variance, and Bands 1, 2, 3, and 4). | R2 = 0.88 | [52] |
| Harare, Zimbabwe | GeoEye-1 | The linear regression model was employed with parameters (canopy area). | R2 = 0.87 | [59] |
| Airborne Dataset Articles | ||||
| Sierra Nevada, USA | LVIS Airborne LiDAR | The geometric optical and canopy radiative model was employed with parameters (tree height, stem diameter, vegetation density, leaf and background reflectivity coefficient ratio, and biomass indices). | R2 = 0.89 | [97] |
| Lope, Gabon | Airborne SAR, Airborne LiDAR | An empirical logarithmic model with parameters (covariance matrix) was employed. | R2 = 0.88 | [107] |
| Heilongjiang, China | Airborne LiDAR, Aerial Imagery | Support vector regression was employed with parameters (wavelength, pulse length, sampling interval, sensor size, pulse firing rate, sensor size, dimensions, r-spectrum, and wavenumber). | R2 = 0.88 | [102] |
| Jiangsu Province, China | Airborne LiDAR | The multiple regression model was employed with parameters (percentile heights h25–h95, variation of height). | R2 = 0.87 | [99] |
| Paracou, French Guiana | Airborne LiDAR, Airborne SAR | The study employed a quadratic model with parameters (backscattered power, FHandQ, HV). | R2 = 0.86 | [105] |
| Spaceborne and Airborne Dataset Articles | ||||
| New Hampshire, USA | ALS, GEDI, TanDEM-X | The multiple regression model was employed with parameters (TDX height). | R2 = 0.87 | [128] |
| California, USA | Landsat-7, AVIRIS, EnMap Imagery, Airborne LiDAR | The Gaussian process regression model was used with parameters (EnMAP and Landsat spectral metrics). | R2 = 0.87 | [125] |
| Howland, USA | Landsat-5, PRISM, UAVSAR | The multivariate regression model employed parameters (backscatter from track and canopy height). | R2 = 0.85 | [124] |
| Texas, USA | ALS, ICESat-2 | The linear regression model with parameters (mean height, height bin, PCL-derived 10th percentiles, and canopy cover) was employed. | R2 = 0.79 | [120] |
| Hokkaido, Japan | Airborne LiDAR, TanDEM-X | The random forest model was employed with parameters (annual precipitation, TDX-CHM, forest type, HV). | R2 = 0.70 | [113] |
Disclaimer/Publisher’s Note: The statements, opinions and data contained in all publications are solely those of the individual author(s) and contributor(s) and not of MDPI and/or the editor(s). MDPI and/or the editor(s) disclaim responsibility for any injury to people or property resulting from any ideas, methods, instructions or products referred to in the content. |
© 2024 by the authors. Licensee MDPI, Basel, Switzerland. This article is an open access article distributed under the terms and conditions of the Creative Commons Attribution (CC BY) license (https://creativecommons.org/licenses/by/4.0/).
Share and Cite
Khan, M.N.; Tan, Y.; Gul, A.A.; Abbas, S.; Wang, J. Forest Aboveground Biomass Estimation and Inventory: Evaluating Remote Sensing-Based Approaches. Forests 2024, 15, 1055. https://doi.org/10.3390/f15061055
Khan MN, Tan Y, Gul AA, Abbas S, Wang J. Forest Aboveground Biomass Estimation and Inventory: Evaluating Remote Sensing-Based Approaches. Forests. 2024; 15(6):1055. https://doi.org/10.3390/f15061055
Chicago/Turabian StyleKhan, Muhammad Nouman, Yumin Tan, Ahmad Ali Gul, Sawaid Abbas, and Jiale Wang. 2024. "Forest Aboveground Biomass Estimation and Inventory: Evaluating Remote Sensing-Based Approaches" Forests 15, no. 6: 1055. https://doi.org/10.3390/f15061055
APA StyleKhan, M. N., Tan, Y., Gul, A. A., Abbas, S., & Wang, J. (2024). Forest Aboveground Biomass Estimation and Inventory: Evaluating Remote Sensing-Based Approaches. Forests, 15(6), 1055. https://doi.org/10.3390/f15061055