Abstract
Forest plantations can be established in order to restore degraded areas. Acoustic tomography, which is of increasing importance in forest management, was used in the present study to obtain information for managing plantations of Cedrelinga cateniformis Ducke in the Peruvian Amazon. The species is valuable in the timber sector of Peru, but the core wood tends to deteriorate and develop cavities. The main objective of the study was to model wood deterioration in Cedrelinga cateniformis Ducke using the data obtained through acoustic tomography. Eight plantations of varying ages were analyzed using acoustic tomography in order to obtain indicators of wood deterioration. Biometric, climatic, and edaphic data (explanatory variables) were also measured in each plantation. The indicator variables and explanatory variables were compared and evaluated using correlation and principal component analysis. Wood deterioration was modelled using stepwise regression. The indicator variables differed significantly between plantations and were mainly correlated with the biometric variables (age and diameter at breast height). The models explained 81% of the variability of pith rot. The percentage rotten area was minimal in young plantations (1%), and the opposite was observed in mature trees (21.5 to 25.6%). The study findings provide valuable information, enabling foresters to determine the optimal age and diameter for felling Cedrelinga cateniformis in plantations in the Peruvian Amazon.
1. Introduction
Forests and forest plantations are invaluable natural resources for humans [1]. However, in the forestry industry in Peru, wood is selected and extracted from natural forests without considering the need to restore these plant formations or to maintain a permanent balance between growth and productivity [2]. Wood is a valuable material with a vital role, and its properties determine the applications and economic value of the final products [3]. Likewise, the loss of the structural functionality of trees due to the deterioration of core wood can negatively impact the value [4]. In the context of the high demand and restricted availability of resources from natural forests [5], wood extraction from forest plantations must be regulated in order to ensure that high-quality products are obtained [6]. Additionally, the use of innovative technologies is essential to optimize the use of forest resources, ensuring sustainability and the supply of good quality raw material [7].
Wood evaluation methods can be categorized according to the level of destruction of the material being evaluated; they are classified as destructive, semi-destructive, and non-destructive [8], the latter of which is the most commonly used [9]. Non-destructive evaluation (NDE) methods that do not alter the structure of the wood can be used to determine the physical and mechanical properties, thus enabling the use of the tested wood [10]. Different tests with different principles are used in this method of evaluating wood quality, including mechanical tests, ultrasound, resonance, and acoustic tomography [11]. NDE methods provide valuable information for different applications, such as performing clonal selection, tree classification, and tree risk management in urban areas [12].
For decades, researchers have used invasive (destructive) methods to detect internal defects in wood [13]. However, since the 1960s, NDE methods have been used to determine the growth characteristics and physical–mechanical properties of standing wood and to detect internal defects in the stem [14]. At present, forest managers and arborists use non-destructive techniques to locate and quantify defects and deterioration in wood at different stands and forest scales [5,15,16]. Maximizing the use of forest resources by considering variations in wood properties at multiple scales can increase the final yields [17]. Acoustic technology has become an essential tool for evaluating material via the use of NDE methods. The technology is also used for other applications in the forestry industry, including quality control and product classification [18].
Sound is produced by wave motion in an elastic medium (solid, liquid, or gas) and requires a source of mechanical vibration [19]. In wood, wave propagation is a dynamic process that is internally related to physical and mechanical properties, particularly the moduli of elasticity, density, and humidity [20,21]. Acoustic tomography relies on measuring sound waves that travel through a material (in this case, tree stems) from one sensor to another [16]. This method can detect the presence of anomalies or deterioration in trees via analyzing the propagation of sound waves generated when sensors are tapped with an electronic impact hammer. The result of this measurement process is a tomogram, which represents the speed of the sound waves in the cross-section [22]. Tomographic images are essential in internal tree inspection [23]. The velocity of sound propagation is generally faster in healthy (more solid) wood than it is in degraded wood [24], although the acoustic properties of wood can also be affected by various factors such as age and phytosanitary status, as well as natural defects such as grain deviation, knots, and resin pockets.
Acoustic tomography is used by professionals in the forestry sector and by arborists [25]. In a study conducted in 2005, researchers concluded that the resolution of the images obtained through stress waves can be improved via increasing the frequency applied and the number of sensors used [26]. In 2014, a demonstration in the Czech Republic showed non-invasive methods to be a promising tool for managing and protecting forest ecosystems [27]. In 2022, the use of the dynamic modulus of elasticity was found to improve the acoustic tomographic evaluation of standing trees, demonstrating that sound velocity is related to the mechanical parameters of wood [24]. The inspection of standing trees in China and Panama showed that acoustic tomography is an effective, non-invasive method for assessing internal decay, cavities, and structural integrity, even in irregularly shaped trees [4,28,29]. Other studies have used tomography for the numerical simulation of wave propagation to determine the size of the cavity and for developing a new approach to the quantitative analysis of acoustic tomography images, demonstrating the effectiveness of the method relative to others [30]. Acoustic tomography studies generally involve the use of the technique in urban trees or the development of new methodologies [15,23]; however, modelling studies of internal tree health are scarce [16]. At present, acoustic tomography is not widely used in Peru. The techniques have been used to evaluate the health of forest plantations in the Amazon [5,31,32] and to determine the risk of falling urban trees in Lima [33]. The number of trunks affected was determined in all of these studies.
Cedrelinga cateniformis Ducke is a monotypic species, with a restricted distribution in the Neotropical region, with the Amazon as the natural center of distribution [34]. It is a low-demanding species, which leads to the rapid early growth of the trees. Annual growth can reach up to 2.56 m in the first 6 years, and tends to continue increasing [35]. In Peru, the species is distributed in the Amazonas, Madre de Dios, Huánuco, Junín, Loreto, Pasco, San Martín, Ucayali, and Cuzco territories [36]. The wood is classified as being of medium density, easy to work with, and with a good surface finish [37]. It is used to produce wood panels, cellulose, and paper, and in civil and marine construction [38]. C. cateniformis is important in the Peruvian timber market [39], representing 9.2% of the national market, 90% of which is obtained from tropical forests, mainly in areas such as Loreto, Madre de Dios, and Ucayali [37]. The demand for the wood has increased constantly due to its good physical and mechanical properties [2]. However, the presence of medullary rotting in the stem [39] discourages producers in plantations using it [40].
The primary aim of this research was to model wood deterioration in Cedrelinga cateniformis Ducke with data acquired from acoustic tomography. We hypothesized that wood decay in this species is influenced by biometric, climatic, and/or edaphic factors. The research findings will help to establish a more efficient forest management system for the species and generate more income for forest producers [41].
2. Materials and Methods
2.1. Study Area
For the study, a total of eight C. cateniformis plantations, distributed in two properties, located in Loreto Department, Maynas province, San Juan Bautista district (Peru), were evaluated. The “Puerto Almendra” property (geographical coordinates 3°50.046′ S and 73°22.670′ W), which belongs to the State University of the Peruvian Amazon (UNAP), is located at an elevation of 95 m.a.s.l. The second property, the “El Dorado” Experimental Annex (geographical coordinates 3°56.279′ S and 73°25.342′ W), belongs to the San Roque Agricultural Experimental Station (INIA), and is located at an elevation of 120 m m.a.s.l. (Figure 1).
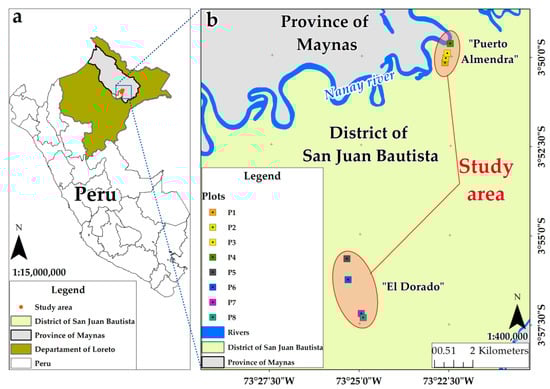
Figure 1.
Location of Cedrelinga cateniformis plantations, Peru. (a) study area, (b) distribution of plots.
The Department of Loreto occupies an area of 369,852 km2, representing 28.7% of the surface area of Peru. It is located in the extreme northeast of Peru, and is divided into 7 provinces and 51 districts. The Department borders with Ecuador, Colombia, and Brazil, and it belongs to the so-called “Amazonian Plain”, whose elevational gradient ranges from 61 to 220 m.a.s.l. [42].
San Juan Bautista has a typical jungle environment below 350 m.a.s.l., with mean and minimum temperatures of, respectively, 25.0 and 23.0 °C; the precipitation ranges from 2000 to 3000 mm annually [43]. The minimum, mean, and maximum temperatures in the study area are 21.17, 26.18, and 31.25 °C, respectively; and the mean precipitation is 2680.88 mm year−1. The soils are mainly clay loam and loamy sand, which are strongly acidic, with low to medium levels of organic matter.
2.2. Methodology
In October 2022, all plantations were inventoried using the Field-Map (FM) software and hardware (version X16). The trees were georeferenced at a precision of 0.03 m. The diameter at breast height (DBH) (1.3 m) was subsequently measured with a diametric tape, and the commercial height (CH) and total height (TH) were determined with a hypsometer. In total, 8 plantations of ages ranging from 15 to 53 years were evaluated as follows: 4 belonging to the UNAP (P1, P2, P3, and P4), and the other 4 to the “El Dorado” site (P5, P6, P7, and P8). The seeds used to establish the plantations were obtained from seed trees of the same population located in the surrounding natural forests [37]. Enrichment planting (EP), forest massifs (FMs), and agroforestry systems (AFSs) were established at different spacings (Table 1). EP aims to add valuable forest species to degraded forest; FMs correspond to plantations in open areas where the plants are uniformly distributed; and AFSs are production systems where crops and trees are planted sequentially. The DBH of the trees evaluated ranged from 11.4 to 152.6 cm, the CH ranged from 1.8 to 19.7 m, and the TH ranged from 9.7 to 45.7 m (Table 1).

Table 1.
Structural characteristics of Cedrelinga cateniformis plantations, Peru.
The wood deterioration was evaluated using acoustic tomography (ArborSonic 3D, Fakopp Enterprise Ltd., Sopron, Hungary). Trees were classified into 10 cm diameter classes in all plantations. Between 3 and 13 individuals were evaluated, depending on the total number of trees included in each class [44]; 30, 40, 17, 24, 40, 40, 51, 40, and 42 individuals were evaluated in plots P1, P2, P3, P4, P5, P6, P7, and P8, respectively. The evaluations were carried out between 40 and 60 cm above the ground because, as previous reports have indicated, in this species, rot mainly occurs in the basal section of the stems [45,46]. Between 8 and 10 sensors were used, depending on the diameter of the shaft, i.e., more than the 6 recommended by [47]. The sensors were inserted around the trunk on a horizontal plane. The tree circumferences and distances were measured precisely via the sensors and were recorded with Arbor-Sonic3D v5.3.125 software. Once the sensors were installed, the transmitter boxes were placed in situ. Acoustic sound waves were generated by repeatedly tapping each sensor with a steel hammer at the same intensity. The sensor transmitted the sound waves and formed the data matrix. The sound velocity was automatically calculated in the software, and a tomogram was generated [29,46,48].
The variables evaluated as indicators of wood deterioration were the wave velocity in m/s (WV), incidence percentage (I), and the percentage of the rotten area (RA). The radial waves were measured, as these pass through the center of the pith and enable the better analysis of the internal health of healthy and affected trees (Figure 2) [49].
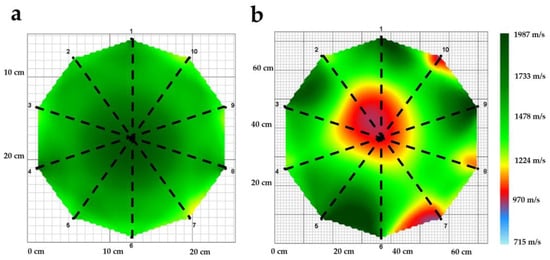
Figure 2.
Radial velocities considered for evaluating wood decay in C. cateniformis plantations (dotted black lines). (a) healthy tree, (b) affected tree.
The I was determined using Equation (1), which related the number of deteriorated wood trees to the total number of trees in the plantation [50] as follows:
Biometric, climatic, and edaphic variables were considered as predictors for wood deterioration modelling (Table 1 and Table 2). The commercial volume (CV) was calculated using Equation (2), where π = 3.1416 and “f” is the species form factor, with a value of 0.496 [51].
Table 2.
Climatic and edaphic characteristics of Cedrelinga cateniformis plantations, Peru.
Climate variables were acquired from NASA’s Global Energy Resources Prediction [52], accessed 7 September 2023. The center point of each plantation was used as the reference point for downloading the data, and the period considered for the analysis was 2001 to 2021. Soil sampling was carried out in October 2022. In each plantation, a composite sample was extracted through systematic collection, according to the methodology established by [53], and the subsamples were extracted with a sampler tube at 30 cm depth. The samples were sent to the Soil, Water and Foliar Laboratory of the E.E.A. Canaán–INIA for analysis.
The statistical analysis was performed with Rstudio 4.3.3 statistical software (Boston, MA, USA). The existence of any significant differences in the wood deterioration indicator variables (WV, I, and RA) between plantations was evaluated, and the mean values for the individuals in the same diameter classes (10 cm) in each plantation were considered as replicates [54]. The analysis of variance (ANOVA) was conducted and the means were compared by applying the Tukey’s HSD test (p < 0.05) in the “agricolae” package [55]. The assumptions of normality and variance homogeneity were evaluated using Shapiro–Wilk and Bartlett tests (p < 0.05), respectively; when the WV did not meet the required assumptions, the Kruskal–Wallis nonparametric test was applied. In addition, the association between the variables through correlation tests and, subsequently, the predictor variables (biometric, climatic, and edaphic) for the wood deterioration models were identified via correlation. The Pearson’s correlation coefficient was determined (p < 0.05) using the cor function in Rstudio [56]. Furthermore, in order to explain all of the existing variability of the variables evaluated, principal component analysis (PCA) was carried out using the R studio packages FactoMineR and factoextra [57,58].
Modelling was conducted using stepwise regression, which has been used to estimate various forest variables in different studies [59,60,61]. The response variable was specified, and a list of possible explanatory variables was provided (Equation (3)). The explanatory variable most closely correlated with the response variable was chosen, and additional explanatory variables were included iteratively or eliminated until no further significant correlations between predictive variables were found [62].
where is the variable indicating wood deterioration (WS, I, and RA), , …, are the explanatory variables, , …, are the model parameters, and is the error term. The regression was carried out using the lm and step functions in Rstudio [63,64], and some of the variables modelled were transformed by Ln. The statistical significance of the regression models generated, and their parameters was verified (F and t at p < 0.05).
3. Results
3.1. Wood Deterioration
The wood deterioration indicator variables differed significantly (p < 0.05) between plantations (Table 3). Significant differences in the WV between the youngest plantation (P1) and the oldest plantation (P3 and P7) were observed, with values of 1650.75 and 1293.21 and 1365.68 m/s, respectively. The highest value of I was recorded in plantation P3 (95.24%), and was statistically significantly different from the value in plot P6 (51.66%). The RA was highest in plantation P3, with 22.52% of the stem cross section, differing significantly from those in plantations P1, P5, P6, and P8, in which low percentages of 1.13, 2.88, 1.16, and 2.16%, respectively, were observed.
Table 3.
Comparison of the means of indicator variables of wood deterioration.
For the young plantations, the tomograms showed regions of high WVs in the cross section, except for small regions in the peripheral section, in which low velocities were attributed to an edge effect (Figure 3). As the plantations aged, the WV decreased, mainly in the stem center, indicating deterioration in the stem medulla (P7, P2, and P3).
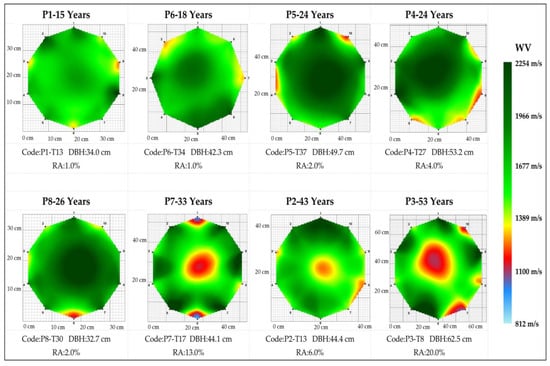
Figure 3.
2D tomograms of Cedrelinga cateniformis at different ages, Peru.
The WV was significantly and negatively correlated with the RA (Figure 4), so that, in an average tree, lower speeds indicated a higher percentage of rotting. Although the I was positively and negatively correlated with other indicator variables, the correlations were not statistically significant.
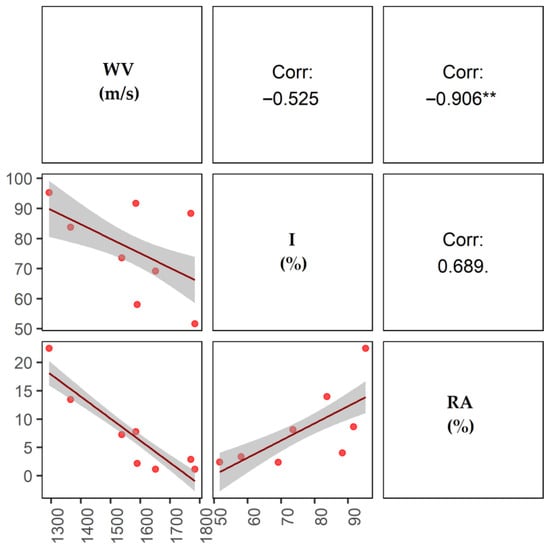
Figure 4.
Correlogram of the indicator variables of wood deterioration. WV: wave velocity, I: incidence percentage, RA: percentage of the rotten area. ** = p < 0.01.
3.2. Relationship between Wood Deterioration and Predictive Variables
All biometric variables, except for the CH, were significantly correlated with the wood decay indicator variables (p < 0.05) (Table 4). Age was the biometric variable most closely correlated with the indicator variables (the WV and RA). In the edaphic variables, only the pH was significantly correlated with a wood deterioration indicator variable (RA). None of the climatic variables were significantly correlated with the indicator variables (Table 4). The WV was significantly negatively correlated with age (r = −0.873). The I was significantly and positively correlated with the DBH and CV (r = 0.721 and 0.822, respectively). The RA was significantly and positively correlated with age, the DBH, the TH, and pH (r = 0.858; 0.767; 0.775; and 0.758, respectively.
Table 4.
Correlations between wood decay indicator variables and predictors.
In the PCA, 72.85% of the variability in the data was explained by the first (46.2%) and second (26.6%) components (Figure 5). The oldest P3 plot (53 years) yielded the highest values of the I and RA and the lowest values of the WV. Plots P1 and P6, which were 15 and 18 years of age, respectively, yielded the lowest values of the I and RA. Regarding the association between variables, the I and RA were positively associated with most of the biometric variables, except for the CH. The WV was negatively associated with the I and the RA. The climatic and edaphic variables were not associated with any of the wood deterioration indicators, except for pH.
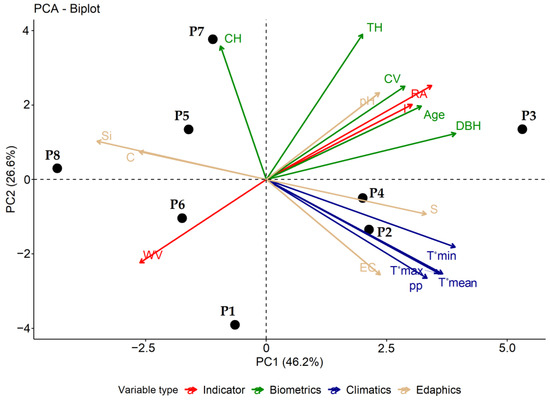
Figure 5.
PCA plot of wood deterioration indicator and predictor variables. WV: wave velocity, I: incidence percentage, RA: percentage of the rotten area, DBH: diameter at breast height at 1.3 m, CH: commercial height, TH: height total, CV: commercial volume, T°min: minimum temperature, T°mean: mean temperature, T°max: maximum temperature, pp: precipitation, S: sand, Si: silt, C: clay, EC: electrical conductivity.
3.3. Relationship between Wood Deterioration and Predictor Variables
The predictive models of wood decay, with age acting as a predictor variable for the WV, explaining 64% of the variability in the linear model, are shown in Table 5. In the young trees, the WV between the radial sensors was 1650.75 m/s; in the mature trees, the value decreased steadily to 1293.21 m/s (Figure 6a). For the I, the only predictor variable was the CV, which explained 68% of the existing variability; both variables increased linearly; for each unit of volume, the I increased by 26.43% (Figure 6b). A high proportion (81%) of the variability in the RA was explained by age and the DBH; in young plantations, the percentage was minimal, with an average of 1.1%, and there were no differences between the diameter classes (e.g., in P1, 1% in trees of DBHs of 25 and 55 cm). In older plantations, the highest percentage of damage, 22.5% on average, occurred in larger diameter trees (e.g., in P3, 21.5 and 25.6% in trees of DBHs of 55 and 75 cm, respectively) (Figure 6c).
Table 5.
Predictive models for indicators of wood deterioration.
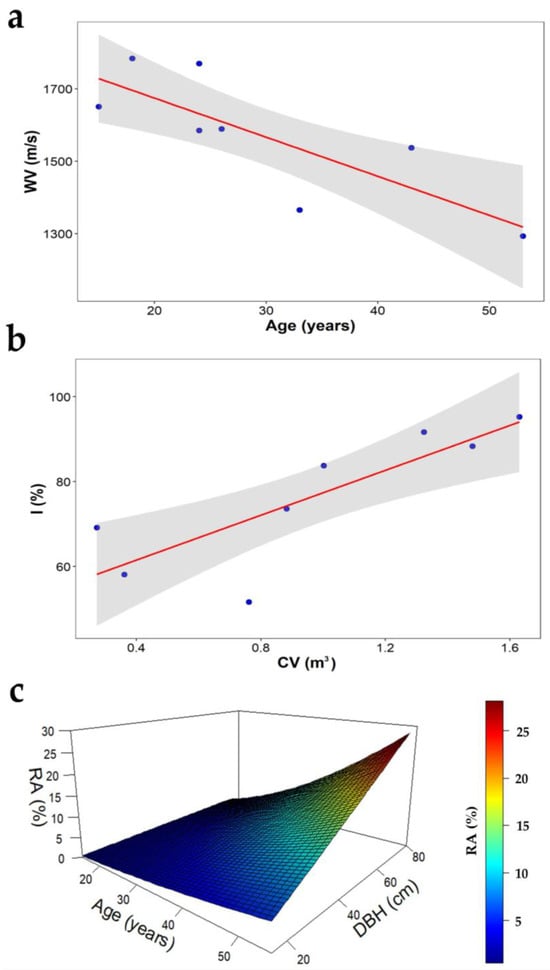
Figure 6.
Model indicators of C. cateniformis wood deterioration in plantations. (a) WV: wave velocity, (b) I: incidence percentage and (c) RA: percentage of the rotten area.
4. Discussion
4.1. Wood Deterioration
The wood quality indicators varied significantly among plantations. This can be attributed to the influence of environmental conditions and the tree age on the wood characteristics and properties [65].
The velocity at which sound waves are propagated in wood depends on the tree species, moisture content, measurement direction, and density [66,67]. In general, the wave velocity is correlated with the rigidity of the wood and the lignin content. Rigid wood will propagate the sound faster, and wood with a high moisture content will propagate the sound waves more slowly because the capillaries contain water rather than air [68]. One of the basic principles of tomography states that the first wave to reach a sensor will have travelled the fastest path. However, in the case of decomposed wood, the wave travels more slowly [69], increasing the transmission time from the sender to the receiver [70]. Relative to the WV, which was higher in young plantations (e.g., P1 and P6, with 1650.75 and 1783.74 m/s), these values reflect healthy wood and transmission times that are consistent with those reported in previous studies [67,71,72,73]. The slowest WVs were recorded in the oldest plots (e.g., 1293.21 and 1365.68 m/s in P3 and P7). Acoustic tomography analysis demonstrated that C. cateniformis was susceptible to the deterioration of the medullary area, as observed in plots P7, P2, and P3 (Figure 3). This condition was reported for species in plantations in the Amazon region [40]. The WV was significantly correlated with the RA (r = −0.906) (Figure 4). The correlation depended on the time and speed of the wave propagation and the ability of acoustic tomography to identify internal defects in tree trunks [67,71,72,73,74].
4.2. Relationship between Wood Deterioration and Predictor Variables
Wood deterioration was closely related to the biometric variables (Table 4 and Figure 5), and the positive association showed that older and larger trees were more susceptible to stem rot. In previous studies with other tree species, wood decomposition was found to increase proportionally with age [2,75,76,77]. The incidence in C. cateniformis was directly related to age [2,45,75], and over-mature trees were found to have a high percentage of medullary rot [2,75]. The susceptibility of the medullary region to deterioration may be due to the small amount of lignin and the subsequent lack of rigidity. The absence of lignin generates a suitable environment for the proliferation of fungi [69,78], and the species is therefore predisposed to attack by pathogenic fungi that can cause wood decay [2,45,75]. The pathogens that cause rotting in the stem center enter via the root system and colonize the tree upwards through the heartwood xylem [4]. The humid conditions at the base of the tree in contact with the soil favor the development of xylophages [5,32], and it has been reported that the humidity influences the proliferation and decomposition of wood [79].
Minimum and maximum temperatures and precipitation affect wood deterioration, and higher or lower levels (extreme rain, extreme heat, extreme cold, strong winds) can cause stress in tree species [80]. Changes in climatic variables may be beneficial for decomposer organisms [80,81]. In the case of C. cateniformis, climatic conditions do not directly affect wood deterioration (Table 4), but extreme events could create conditions that promote the development of pathogens, considering the low tolerance of the species to flooding [82]. The low (or no) correlation between the deterioration indicators and edaphic variables may be associated with the plasticity of C. cateniformis, although it requires clayey, acidic soils with low (or zero) levels of stoniness [83,84]. The RA was the only variable that was positively and significantly correlated with pH (r = 0.758) (Table 4), probably because C. cateniformis growing in alkaline soil is more susceptible to wood deterioration due to the acidophilic nature of the species [85,86].
4.3. Wood Deterioration Modelling
The models yielded robust coefficients of determination, with values ranging from 0.68 to 0.93 (Table 5). Values close to 1 indicate the strongest relationship between the measured values and the predicted values [80,87]. The main model predictor variables were age and the DBH (the WV and RA), which were strongly correlated with the wood deterioration indicators (Table 4). The model estimating the WV yielded a negative parameter , indicating that the propagation of sound waves between sensors was slower in older trees (Figure 6a). The CV acted as a predictor variable for the I, and the parameter demonstrated a positive value, indicating that trees with a larger CV are more susceptible to wood deterioration, as reported by in other studies [2,88].
The percentage of the rotten area was influenced by the tree age and diameter. Young plantations had a minimum percentage of the rotten area, while older plantations (53 years) had a higher percentage, ranging from 21.5% to 25.6%. The silvicultural rotation of C. cateniformis occurs at a young age, but limited diameter growth and immature wood both restrict the use of timber [36,89]. The plantations should therefore be maintained until an optimal age. According to the study findings, in trees of 25–30 years old, with a DBH from 45.0 to 48.5 cm and a CV from 0.9069 to 1.0276 m3, the WV ranges between 1620.43 and 1566.47 m/s, the I between 74.9 and 78.1%, and the RA between 3.9 and 5.9% (Figure 6b,c). The loss of relative resistance was twice as high in trees with a high percentage of cavities than in trees with a low percentage of cavities (Figure 6a–c) [90]. Thus, plantations should not be maintained for more than 30 years, as this could lead to economic losses. The condition of the species beyond 30 years will directly affect the harvestable volume at the time of harvesting [2,88].
Acoustic tomography is a useful tool for identifying damaged areas of tree stems [91]. The proposed inspection protocols can assist in detecting such damage and obtaining more detailed data for managing forest resources [71]. This study proposes the use of this tool to enable the better control of the quality of C. cateniformis wood in forest plantations, generating essential information for timber quality control in plantations, and promoting the planting of the species in the Peruvian Amazon [36]. This is essential in the forestry sector in Peru, which is currently undervalued and faces various challenges that must be addressed [83,84,92]. The results of this study are consistent with those of the National Forest Strategy, which promotes adaptive research for efficient and diversified production [80,93].
5. Conclusions
The study examined tree decay in eight C. cateniformis Ducke plantations of ages between 15 and 53 years in the Peruvian Amazon by using acoustic tomography data. The species began to show variations in trunk pith at 15 years, with a minimal incidence of rot, and a higher incidence of damage due to rot and cavities at 30 years. Based on the information obtained, we recommend harvesting the species at a maximum age of 30 years in order to ensure the presence of a higher percentage of usable volumes of wood for producers. New, less labor-intensive methods of evaluating wood degradation in forestry plantations should be developed using acoustic tomography to obtain accurate data.
Author Contributions
Conceptualization, G.P.C.-R., J.R.B.-V., P.Á.-Á. and S.Y.C.-V.; methodology, G.P.C.-R., J.R.B.-V., S.Y.C.-V., A.T.M.-R. and B.M.; software, G.P.C.-R., J.R.B.-V. and S.Y.C.-V.; validation, G.P.C.-R., J.R.B.-V., S.Y.C.-V., B.M., E.S. and J.A.O.-R.; formal analysis, G.P.C.-R., J.R.B.-V., S.Y.C.-V., P.Á.-Á. and S.S.A.P.; investigation, E.S., S.Q., A.T.M.-R. and A.C.; resources, G.P.C.-R., J.R.B.-V., S.Y.C.-V. and J.A.O.-R.; data curation, G.P.C.-R., J.R.B.-V., S.Y.C.-V., B.M., A.T.M.-R., P.Á.-Á. and S.S.A.P.; writing—original draft preparation, G.P.C.-R., J.R.B.-V., S.Y.C.-V. and. J.A.O.-R.; writing—review and editing, G.P.C.-R., J.R.B.-V., S.Y.C.-V., P.Á.-Á. and S.S.A.P.; visualization, E.S., S.Q., P.Á.-Á. and J.R.B.-V.; supervision, E.S. and J.A.O.-R.; project administration, E.S. and J.A.O.-R.; funding acquisition, E.S. and J.A.O.-R. All authors have read and agreed to the published version of the manuscript.
Funding
This research was financed by the National Program of Scientific Research and Advanced Studies CONCYTEC, project PE501078898-2022-PROCIENCIA: “Sanidad interna de plantaciones de Cedrelinga cateniformis (Ducke) Ducke de diferentes edades mediante tomografía acústica en Amazonía baja, Loreto-Perú, 2022” and executed by the National Institute of Agricultural In-novation-INIA of Peru”.
Data Availability Statement
The data presented in this study are available on request from the corresponding author.
Acknowledgments
We thank Wilfredo Eric Rodriguez Felipa, Roiser Lobato Galvez, and Angela Pillpe Huaman for supporting the logistic activities.
Conflicts of Interest
The authors declare that they have no conflicts of interest.
References
- Li, G.; Wang, X.; Feng, H.; Wiedenbeck, J.; Ross, R.J. Analysis of Wave Velocity Patterns in Black Cherry Trees and Its Effect on Internal Decay Detection. Comput. Elecftron. Agric. 2014, 104, 32–39. [Google Scholar] [CrossRef]
- López, R. Estudio Silvicultural Del Tornillo (Cedrelinga Catenaeformis DUCKE). Rev. For. del Perú v 2005, 10, 1–7. [Google Scholar]
- Živanović, I.; Šurjanac, N.; Jovanović, F.; Đorđević, I.; Češljar, G. Transversal Stress Wave Velocity in the Tree of Serbian Spruce (Picea Omorika (Pančić) Purkyně). Sustain. For. Collect. 2022, 85–86, 87–96. [Google Scholar] [CrossRef]
- Gilbert, G.; Ballesteros, J.O.; Barrios-Rodriguez, C.A.; Bonadies, E.F.; Cedeño-Sánchez, M.L.; Fossatti-Caballero, N.J.; Trejos-Rodríguez, M.M.; Pérez-Suñiga, J.M.; Holub-Young, K.S.; Henn, L.A.; et al. Use of Sonic Tomography to Detect and Quantify Wood Decay in Living Trees. Appl. Plant Sci. 2016, 4, 1600060. [Google Scholar] [CrossRef]
- Angulo-Ruiz, W.E.; Fasabi-Pashanasi, H.; Rengifo-Pérez, C.P.; Valdivia-Marquez, L.N. Non-Destructive Technique Based on Acoustic Tomography for the Identification of Internal Defects in Trees. Sci. Agropecu. 2021, 12, 65–71. [Google Scholar] [CrossRef]
- Panebra Salirrosas, P.I. Evaluacion No Destructiva de La Densidad En Madera de Plantaciones de Dos Especies Forestales. 2019, pp. 1–70. Available online: https://repositorio.lamolina.edu.pe/handle/20.500.12996/3877 (accessed on 6 December 2023).
- Vega Cueto, A.; Canga Libano, E.; Sánchez García, S.; Hevia Canal, A.; Feito Díaz, I.; Menéndez-Miguélez, M.; González-García, M.; Martínez Alonso, C.; Majada Guijo, J.P. Innovación de Procesos y Productos En El Sector de La Madera. Cuad. la Soc. Española Ciencias For. 2016, 336, 323–336. [Google Scholar] [CrossRef]
- Jaskowska-Lemańska, J.; Przesmycka, E. Semi-Destructive and Non-Destructive Tests of Timber Structure of Various Moisture Contents. Materials 2021, 14, 96. [Google Scholar] [CrossRef]
- Lopez, A.J.; Yolanda, P.; Adolfo, J. Evaluacion No-Destructiva de la Densidad de la Madera de Arboles Vivos en pie de Eucalyptus Grandis Utilizando Resistógrafo. Forestry 2010, 1–9. Available online: https://www.jornadasforestales.com.ar/jornadas/2010/trab_res_pos/445.15.T.LOPEZ.pdf (accessed on 6 December 2023).
- Ondrejka, V.; Gergeľ, T.; Bucha, T.; Pástor, M. Innovative Methods of Non-Destructive Evaluation of Log Quality. Cent. Eur. For. J. 2021, 67, 3–13. [Google Scholar] [CrossRef]
- Acuña, L.; Spavento, E.M.; Casado, M.M.; Basterra, L.A.; Keil, G.D. Metodología De Ensayo No Destructivo Aplicada a Madera Estructural De Populus X Euramericana I-214.Populus X Euramericana. 2014. Available online: https://www.researchgate.net/profile/Luis-Acuna-5/publication/329990800_Metodologia_de_ensayo_no_destructivo_y_destructivo_aplicada_a_madera_de_Populus_x_canadensis_’I-214’_de_procedencia_Argentina/links/5c27cb7892851c22a34e7b05/Metodologia-de-ensayo-no-destructivo-y-destructivo-aplicada-a-madera-de-Populus-x-canadensis-I-214-de-procedencia-Argentina.pdf (accessed on 6 December 2023).
- Arciniegas, A.; Brancheriau, L.; Lasaygues, P. Tomography in Standing Trees: Revisiting the Determination of Acoustic Wave Velocity. Ann. For. Sci. 2014, 72, 685–691. [Google Scholar] [CrossRef]
- Liang, S.; Fu, F. Effect of Sensor Number and Distribution on Accuracy Rate of Wood Defect Detection with Stress Wave Tomography. Wood Res. 2014, 59, 521–532. [Google Scholar]
- Wei, X.; Du, C.; Xu, S.; Tian, C.; Yang, X.; Hu, L.; Pang, P. Research on Stress Wave Wood Nondestructive Testing Technology. J. Phys. Conf. Ser. 2022, 2366, 012035. [Google Scholar] [CrossRef]
- Palma, S.; dos Reis, M.N.; Gonçalves, R. Tomographic Images Generated from Measurements in Standing Trees Using Ultrasound and Postprocessed Images: Methodological Proposals for Cutting Velocity, Interpolation Algorithm and Confusion Matrix Metrics Focusing on Image Quality. Forests 2022, 13, 1935. [Google Scholar] [CrossRef]
- Viera, G.; Dos santos, D.; Cerqueira, B.; Monteiro, A.; de-Figueiredo-Latorraca, J.V. Historic Urban Trees: Assessing the Trunks Internal Integrity. Bosque 2023, 44, 481–491. [Google Scholar]
- Schimleck, L.; Dahlen, J.; Apiolaza, L.A.; Downes, G.; Emms, G.; Evans, R.; Moore, J.; Pâques, L.; Van den Bulcke, J.; Wang, X. Non-Destructive Evaluation Techniques and What They Tell Us about Wood Property Variation. Forests 2019, 10, 728. [Google Scholar] [CrossRef]
- Wang, X. Acoustic Measurements on Trees and Logs: A Review and Analysis. Wood Sci. Technol. 2013, 47, 965–975. [Google Scholar] [CrossRef]
- Sonorización, S. Conceptos Fundamentales Del Sonido. Sintec 2012, 1–13. Available online: https://www.acdacustics.com/files/conceptos.pdf (accessed on 6 December 2023).
- Pereira-Rollo, L.C. Tomografia de Impulso Para Estimativa Da Densidade Da Madeira. Master’s Dissertation, Universidade sao Paulo, Piracicaba, Brazil, 2009. [Google Scholar]
- Omonte, M.; Valenzuela-Hurtado, L. Relationship between Acoustic Wave Velocity and Different Characteristics of Wood in Eucalyptus Nitens Trees with Sawing Dimensions. Maderas Cienc. Tecnol. 2020, 22, 559–568. [Google Scholar] [CrossRef]
- Hanum, S.F.; Iryadi, R.; Rahayu, A.; Bangun, T.M.; Darma, I.D.P. Sutomo Wood Decay Diagnostic of Joannesia Princeps Vellozo at Bali Botanical Garden Using Arborsonic Acoustic 3D Tomograph. IOP Conf. Ser. Mater. Sci. Eng. 2020, 935, 012069. [Google Scholar] [CrossRef]
- Liu, L.; Li, G. Acoustic Tomography Based on Hybrid Wave Propagation Model for Tree Decay Detection. Comput. Electron. Agric. 2018, 151, 276–285. [Google Scholar] [CrossRef]
- Cristini, V.; Tippner, J.; Tomšovský, M.; Zlámal, J.; Mařík, R. Acoustic Tomography Outputs in Comparison to the Properties of Degraded Wood in Beech Trees. Eur. J. Wood Wood Prod. 2022, 80, 1377–1387. [Google Scholar] [CrossRef]
- Du, X.; Li, J.; Feng, H.; Chen, S. Image Reconstruction of Internal Defects in Wood Based on Segmented Propagation Rays of Stress Waves. Appl. Sci. 2018, 8, 1778. [Google Scholar] [CrossRef]
- Fathi, S.; Divos, F.; Bejo, L. Comparison between Two Methods of Non-Destructive Evaluation of Standing Trees. Nondestruct. Test. 2019, 2, 8. [Google Scholar]
- Simon, J.; Machar, I.; Brus, J.; Pechanec, V. Combining a Growth-Simulation Model with Acoustic-Wood Tomography as a Decision-Support Tool for Adaptive Management and Conservation of Forest Ecosystems. Ecol. Inform. 2015, 30, 309–312. [Google Scholar] [CrossRef]
- Wu, X.; Li, G.; Jiao, Z.; Wang, X. Reliability of Acoustic Tomography and Ground-Penetrating Radar for Tree Decay Detection. Appl. Plant Sci. 2018, 6, e01187. [Google Scholar] [CrossRef]
- Ostrovský, R.; Kobza, M.; Gažo, J. Extensively Damaged Trees Tested with Acoustic Tomography Considering Tree Stability in Urban Greenery. Trees—Struct. Funct. 2017, 31, 1015–1023. [Google Scholar] [CrossRef]
- Schubert, S.; Gsell, D.; Dual, J.; Motavalli, M.; Niemz, P. Acoustic Wood Tomography on Trees and the Challenge of Wood Heterogeneity. Holzforschung 2009, 63, 107–112. [Google Scholar] [CrossRef]
- Angulo, W.E. Estudio de Sanidad Forestal Mediante Tecnicas Acusticas No Destructivas de Una Plantacion Forestal “Tornillo” Proveniente de La Region Loreto; INIA—Instituto Nacional de Innovación Agraria: Pucallpa, Peru, 2018; Available online: http://repositorio.inia.gob.pe/handle/20.500.12955/732 (accessed on 6 December 2023).
- Cuellar-Bautista, J.; Miriam, R.; Chumbimune, S.Y.; Lara, V.A. Caracterización Radial de La Densidad de La Madera de Cedrelinga Cateniformis y Calycophyllum Spruceanum Mediante El Diseño de Una Red Neuronal Artificial Utilizando Imágenes Tomográficas. 2019. Available online: https://www.researchgate.net/publication/338115628_CARACTERIZACION_RADIAL_DE_LA_DENSIDAD_DE_LA_MADERA_DE_Cedrelinga_cateniformis_y_Calycophyllum_spruceanum_MEDIANTE_EL_DISENO_DE_UNA_RED_NEURONAL_ARTIFICIAL_UTILIZANDO_IMAGENES_TOMOGRAFICAS (accessed on 6 December 2023).
- Mendosa Saucedo, G. Uso de Metodos No Destructivos Para Determinar El Riesgo de Caida de Arboles Urbanos, En El Parque de Las Leyendas. Tesis Pregr. 2018, 100. Available online: https://repositorio.lamolina.edu.pe/handle/20.500.12996/3755 (accessed on 6 December 2023).
- Valderrama, H. Anatomia Comparativa del Xilema del Tronco y de la Rama de Cedrelinga Catenaeformis Ducke (FABACEAE). Folia Amaz. 1998, 9, 5–28. [Google Scholar] [CrossRef]
- Pashanasi-Amasifuen, B.; Aponte-Jaramillo, A.N.; Mathios-Flores, M.A. Crecimiento de Tornillo (Cedrelinga Catenaeformis) y Marupa (Simarouba Amara) Dentro de Un Sistema Agroforestal En Multiestratos. Rev. Peru. Investig. Agropecu. 2022, 1, e10. [Google Scholar] [CrossRef]
- Baluarte, J. El Control de Calidad de La Madera de Plantaciones, Una Alternativa Para Alebtar El Cultivo de Arboles de Especies Forestales Maderables, Estudio de Caso de Cedrelinga Catenaeformis “Tornillo”. Folia Amaz. 2019, 28, 43–51. [Google Scholar] [CrossRef]
- Cruz, W.; Saldaña, C.; Ramos, H.; Baselly, R.; Loli, J.C.; Cuellar, E. Genetic Structure of Natural Populations of Cedrelinga Cateniformis “tornillo” from the Oriental Region of Peru. Sci. Agropecu. 2020, 11, 521–528. [Google Scholar] [CrossRef]
- Melo, M.d.F.F.; Varela, V.P. Aspectos Morfológicos de Frutos, Sementes, Germinação e Plântulas de Duas Espécies Florestais Da Amazônia: I. Dinizia Excelsa Ducke (Angelim-Pedra). II Cedrelinga Catenaeformis Ducke (Cedrorana)—Leguminosae: Mimosoideae. Rev. Bras. Sementes 2006, 28, 54–62. [Google Scholar] [CrossRef][Green Version]
- Vallejos-Torres, G.; Gonzales-Polar, L.E.T.; Arévalo-López, L.A. Enraizamiento de Brotes de Tornillo (Cedrelinga Catenaeformis Ducke), En La Amazonía Peruana. Rev. For. Mesoam. Kurú 2014, 11, 60. [Google Scholar] [CrossRef][Green Version]
- Yepes-Alza, F.; Linares-Bensimón, C. Rendimiento de Trozas Aserradas de Cedrelinga Cateniformis Ducke Obtenidas Del Raleo Silvicultural de Plantaciones En Jenaro Herra, Loreto-Perú. Folia Amaz. 2007, 16, 115. [Google Scholar] [CrossRef]
- Álvarez Gómez, L.; Ríos Torres, S. Evaluación Económica de Plantaciones de Tornillo, Cedrilenga Catenaeformis, En El Departamento de Loreto; Instituto de Investigaciones de la Amazonia Peruana—IIAP: Iquitos, Peru, 2009; ISBN 9789972667695. [Google Scholar]
- Instituto Nacional de Estadistica e Informatica-INEI. Carpeta Georeferencial Región Loreto Perú. Of. Gestión la Inf. y Estadística Dir. 2019, 1–20. [Google Scholar]
- Distrito de San Juan Bautista de La Provincia de Maynas, Región Loreto. Available online: https://www.iperu.org/distrito-de-san-juan-bautista-provincia-de-maynas (accessed on 31 August 2023).
- Loto, D.E.; Gasparri, I.; Azcona, M.; García, S.; Spagarino, C. Estructura y Dinámica de Bosques de Palo Santo En El Chaco Seco. Ecol. Austral 2018, 28, 064–073. [Google Scholar] [CrossRef][Green Version]
- Díaz, R.; Jeilit, N. Identificación de Patógenos Fúngicos Causantes de La “Pudrición Medular” En Cedreliga Cateniformis, (Ducke) Ducke “Tornillo” En Plantaciones Forestales de Jenaro Herrera-Loreto, Perú. 2009. Available online: https://repositorio.unapiquitos.edu.pe/handle/20.500.12737/3109 (accessed on 6 December 2023).
- Muñoz, O. Uso Del Tomografo Para Determinar Sanidad En Plantaciones Forestales de Tornillo En El Dorado-INIA, Distrito de San Juan Bautiusta, Loreto. Tesis Pregr. 2023, 2003–2005. Available online: https://repositorio.unapiquitos.edu.pe/handle/20.500.12737/9485 (accessed on 6 December 2023).
- Palma, S.S.A.; Gonçalves, R. Tomographic Images of Tree Trunks Generated Using Ultrasound and Post-Processed Images: Influence of the Number of Measurement Points. BioResources 2022, 17, 6638–6655. [Google Scholar] [CrossRef]
- Chumbimune, S.Y.; Cardenas, G.P.; Saravia, D.; Valqui, L.; Salazar, W.; Arbizu, C.I. Methodology for Avocado (Persea Americana Mill.) Orchard Evaluation Using Different Measurement Technologies. Chil. J. Agric. Anim. Sci. 2022, 38, 259–273. [Google Scholar] [CrossRef]
- Palma, S.S.A.; Gonçalves, R.; Trinca, A.J.; Costa, C.P.; Reis, M.N.; Martins, G.A. Interference from Knots, Wave Propagation Direction, and Effect of Juvenile and Reaction Wood on Velocities in Ultrasound Tomography. BioResources 2018, 13, 2834–2845. [Google Scholar] [CrossRef]
- Armengot, L.; Ferrari, L.; Milz, J.; Velásquez, F.; Hohmann, P.; Schneider, M. Cacao Agroforestry Systems Do Not Increase Pest and Disease Incidence Compared with Monocultures under Good Cultural Management Practices. Crop Prot. 2020, 130, 105047. [Google Scholar] [CrossRef]
- Otarola-Acevedo, E.; Linares-Bensimón, C. Tablas de Volumen Total y Comercial de Cedrelinga Catenaeformis Ducke “Tornillo” Para Las Plantaciones En Loreto, Peru. Folia Amaz. 2006, 13, 151. [Google Scholar] [CrossRef]
- POWER|Data Access Viewer. Available online: https://power.larc.nasa.gov/data-access-viewer/ (accessed on 6 December 2023).
- Osorio, W. Toma De Muestras De Suelos Para Evaluar La Fertiidad Del Suelo. Suelos Ecuat. 2010, 41, 23–28. [Google Scholar]
- Sotomayor Garretón, A.; Moya Navarro, I.A.; Acuña Aroca, B. Comportamiento de Las Variables Dasométricas En Plantaciones de Pinus Contorta Doug. Ex Loud., Bajo Manejo Silvopastoral y Forestal En La Región de Aysén, Chile. Cienc. Investig. For. 2010, 16, 265–290. [Google Scholar] [CrossRef]
- Mendiburu, F. De Manual Práctico Para El Uso de Agricolae. Univ. Nac. Agrar. La Molina 2010, 58. Available online: https://www.google.com/search?q=Manual+Prático+para+el+uso+de+agricolae&oq=manual&aqs=chrome.0.69i59l3j69i57j0l4.4175j0j8&sourceid=chrome&ie=UTF-8 (accessed on 6 December 2023).
- Lalinde, H.; Diego, J.; Castro, E.; Johel, E.; Rangel, C.; Sierra, T.; Andrés, C.; Torrado, A.; Karina, M.; Sierra, C.; et al. Sobre El Uso Adecuado Del Coeficiente de Correlación de Pearson: Definición, Propiedades y Suposiciones. AVFT Arch. Venez. Farmacol. y Ter. 2018, 18. Available online: https://www.redalyc.org/journal/559/55963207025/55963207025.pdf (accessed on 6 December 2023).
- Lê, S.; Josse, J.; Husson, F. FactoMineR: An R Package for Multivariate Analysis. J. Stat. Softw. 2008, 25, 1–18. [Google Scholar] [CrossRef]
- Kassambara, A.; Mundt, F. _factoextra: Extract and Visualize the Results of Multivariate Data Analyses_.R Package Version 1.0.7. 2022. Available online: https://CRAN.R-project.org/package=factoextra (accessed on 6 December 2023).
- Menéndez-Miguélez, M.; Álvarez-Álvarez, P.; Majada, J.; Canga, E. Effects of Soil Nutrients and Environmental Factors on Site Productivity in Castanea Sativa Mill. Coppice Stands in NW Spain. New For. 2015, 46, 217–233. [Google Scholar] [CrossRef]
- Farrelly, N.; Dhubháin, Á.N.; Nieuwenhuis, M. Sitka Spruce Site Index in Response to Varying Soil Moisture and Nutrients in Three Different Climate Regions in Ireland. For. Ecol. Manag. 2011, 262, 2199–2206. [Google Scholar] [CrossRef]
- Villabrille, J.D. Modelización Del Crecimiento y La Producción de Plantaciones de Eucalyptus Globulus Labill. En El Noroeste de España. Doctoral Thesis, Universidad Santiago de Compostela España, Lugo, Spain, 2015. [Google Scholar]
- Vanclay, J.K. Modelling Forest Growth and Yield: Applications to Mixed Tropical Forests. CAB Int. 1994. Available online: https://espace.library.uq.edu.au/view/UQ:8211/ModellingForestG.pdf (accessed on 6 December 2023).
- Venables, W.N.; Ripley, B.D. Modern Applied Statistics with S, 4th ed.; 2002; Volume 53, ISBN 0387954570. Available online: https://www.stats.ox.ac.uk/pub/MASS4/VR4stat.pdf (accessed on 6 December 2023).
- John, M.; Chambers, T.J.H. Statistical Models in S; Routledge: Washington, DC, USA, 1991; ISBN 9780412830402. [Google Scholar]
- Arciniegas, A.; Prieto, F.; Brancheriau, L.; Lasaygues, P. Literature Review of Acoustic and Ultrasonic Tomography in Standing Trees. Trees 2014, 28, 1559–1567. [Google Scholar] [CrossRef]
- Kloiber, M.; Reinprecht, L.; Hrivnák, J.; Tippner, J. Comparative Evaluation of Acoustic Techniques for Detection of Damages in Historical Wood. J. Cult. Herit. 2016, 20, 622–631. [Google Scholar] [CrossRef]
- Proto, A.R.; Cataldo, M.F.; Costa, C.; Papandrea, S.F.; Zimbalatti, G. A Tomographic Approach to Assessing the Possibility of Ring Shake Presence in Standing Chestnut Trees. Eur. J. Wood Wood Prod. 2020, 78, 1137–1148. [Google Scholar] [CrossRef]
- Makýš, O.; Krušinský, P.; Korenková, R.; Šrobárová, D. Diagnostics of Wooden Poles Situated in the Open—Air Museum Using Sonic Tomography. Civ. Environ. Eng. 2018, 14, 54–60. [Google Scholar] [CrossRef]
- Perlin, L.P.; Pinto, R.C.d.A.; Valle, Â. do Ultrasonic Tomography in Wood with Anisotropy Consideration. Constr. Build. Mater. 2019, 229, 116958. [Google Scholar] [CrossRef]
- Espinosa, L.; Prieto, F.; Brancheriau, L.; Lasaygues, P. Effect of Wood Anisotropy in Ultrasonic Wave Propagation: A Ray-Tracing Approach. Ultrasonics 2019, 91, 242–251. [Google Scholar] [CrossRef]
- Papandrea, S.F.; Cataldo, M.F.; Zimbalatti, G.; Proto, A.R. Comparative Evaluation of Inspection Techniques for Decay Detection in Urban Trees. Sens. Actuators A Phys. 2022, 340, 113544. [Google Scholar] [CrossRef]
- Wang, X.; Bruce, R. Detección de Decaimiento En Robles Rojos Mediante Una Combinación de Inspección Visual, Pruebas Acústicas y Microperforación de Resistencia. Int. Soc. Arbiculture 2008, 34, 1–4. [Google Scholar] [CrossRef]
- Soge, A.O.; Popoola, O.I.; Adetoyinbo, A.A. Detection of Wood Decay and Cavities in Living Trees: A Review. Can. J. For. Res. 2021, 51, 937–947. [Google Scholar] [CrossRef]
- Basterchea, M. Comparación de Las Técnicas No Destructivas de Tomografía Ultrasónica y Resistencia a La Perforación En La Evaluación de Discos de Madera. J. Penelit. Pendidik. Guru Sekol. Dasar 2016, 6, 128. [Google Scholar]
- Franco, W.; Radwan, A. Cedrelinga Cateniformis (Ducke) Ducke (Chuncho o Tornillo): Una Oportunidad de Desarrollo Sostenible Para La Amazonía Ecuatoriana y La Industria Forestal Mediante Plantaciones y Sistemas Agroforestales; Tena, Ecuador, 2023; Available online: https://www.researchgate.net/publication/373976460_Cedrelinga_cateniformis_Ducke_Ducke_Chuncho_o_Tornillo_una_oportunidad_de_desarrollo_sostenible_para_la_Amazonia_ecuatoriana_y_la_Industria_Forestal_mediante_plantaciones_y_sistemas_Agroforestales (accessed on 6 December 2023).
- Niemtur, S.; Chomicz, E.; Kapsa, M. Computer Tomography in Wood-Decay Assessment of Silver Fir (Abies Alba Mill.) Stands in the Polish Part of the Carpathians. Environ. Sci. Eng. 2013, 629–637. [Google Scholar] [CrossRef]
- Bouslimi, B.; Koubaa, A.; Bergeron, Y. Variation of Brown Rot Decay in Eastern White Cedar (Thuja occidentalis L.). BioResources 2013, 8, 4735–4755. [Google Scholar] [CrossRef]
- González, F.V.R.; Ames de Icochea, T.I. Pudricion de La Madera de Diez Especies Forestales Por Acción de Cinco Hongos Xilofagos. Rev. For. del Perú 1981, 10, 1–38. [Google Scholar]
- Kamperidou, V. The Biological Durability of Thermally-and Chemically-Modified Black Pine and Poplarwood against Basidiomycetes and Mold Action. Forests 2019, 10, 1111. [Google Scholar] [CrossRef]
- Falvai, D.; Saláta, D.; Baltazár, T.; Czóbel, S. Instrumental Study of the Health Status of Picea Abies [l.] Karst and Pinus Mugo (Turra) and Their Relation to Environmental Parameters in the Eastern Alps. Forests 2021, 12, 716. [Google Scholar] [CrossRef]
- Austin, A.T.; Classen, A.T.; Eggleton, P.; Okada, K.; Parr, C.L.; Adair, E.C.; Adu-bredu, S.; Alam, A.; Alvarez-garzón, C.; Barber, N.A.; et al. Termite Sensitivity to Temperature Affects Global Wood Decay Rates. Science 2022, 377, 1440–1444. [Google Scholar]
- Flores Bendezú, Y. Fichas Técnicas Para Plantaciones Con Especies Nativas En Zona De Selva Baja; Instituto Nacional de Innovación Agraria-INIA: Pucallpa, Peru, 2019. [Google Scholar]
- Aldana, R.; García, C.R.; Hidalgo, C.G.; Flores, G.; Del Castillo, D.; Reynel, C.; Pariente, E.; Honorio, E. Morphometric Analysis of the Species of Dipteryx in the Peruvian Amazon Folia. Inst. Investig. la Amaz. Peru. Folia Amaz. 2016, 25, 101–118. [Google Scholar]
- Monteverde-Calderón, E.G. Evaluación Rápida de La Regeneración Natural de Cedrelinga Cateniformis En Un Bosque Premontano de Satipo, Perú. Xilema 2021, 31, 75–83. [Google Scholar] [CrossRef]
- Angulo, W.E. Crecimiento y Productividad de La Plantación de Cedrelinga Catenaeformis Ducke, Establecida En Diferentes Condiciones de Sitio, En Suelo Inceptisol En El Bosque Alexander von Humboldt. Inst. Nac. Innov. Agrar.-INIA 2014, 31. Available online: http://repositorio.inia.gob.pe/bitstream/inia/578/1/Angulo-crecimiento_productividad.pdf (accessed on 6 December 2023).
- Soto Sabino, G. Efecto de Indicadores Fisicoquimos Del Suelos En El Crecimiento de Cedrelinga Cateniformis (Tornillo) En Supte San Jorge, Leoncio Prado. 2023. Available online: https://repositorio.unas.edu.pe/handle/20.500.14292/2357 (accessed on 6 December 2023).
- Nakagawa, S.; Schielzeth, H. A General and Simple Method for Obtaining R2 from Generalized Linear Mixed-Effects Models. Methods Ecol. Evol. 2013, 4, 133–142. [Google Scholar] [CrossRef]
- Hazir, E.; Koc, K.H. A Modeling Study to Evaluate the Quality of Wood Surface. Maderas Cienc. y Tecnol. 2018, 20, 691–702. [Google Scholar] [CrossRef]
- Baluarte, J.; Alvarez, J. Modelamiento Del Crecimiento de Tornillo Cedrelinga Catenaeformis Ducke En Plantaciones En Jenaro Herrera, Departamento de Loreto, Perú. Folia Amaz. 2015, 24, 21–32. [Google Scholar] [CrossRef]
- Rinn, B.F. Basic Aspects of Mechanical Stablility of Tree Cross-Sections. Arborist News 2011, 20, 52–54. [Google Scholar]
- Szabó, K.; Sütöri-Diószegi, M.; Szabo, V.; Bagdi-Fekete, O.; Doma-Tarcsányi, J. Examination of Tthe Condition of the Oldest Trees in the Buda Arboretum. Proc. Fábos Conf. Landsc. Greenw. Plan. 2022, 7, 45. [Google Scholar]
- Pari, G.; Santana, L.; Villanueva, E.; Zarate, D. Planeamiento Estrategico Del Sector Forestal En El Perú. Tesis pregrado, Pontificia Universidad católica del Peru, Lima, Peru, 2017. Available online: https://tesis.pucp.edu.pe/repositorio/handle/20.500.12404/8020 (accessed on 6 December 2023).
- MINAGRI, Ministerio de Agricultura y riego. Estrategia Nacional Forestal Versión Concertada Con Instituciones Y Actores Forestales 2002. pp. 1–120. Available online: https://faolex.fao.org/docs/pdf/per136311anx.pdf (accessed on 6 December 2023).
Disclaimer/Publisher’s Note: The statements, opinions and data contained in all publications are solely those of the individual author(s) and contributor(s) and not of MDPI and/or the editor(s). MDPI and/or the editor(s) disclaim responsibility for any injury to people or property resulting from any ideas, methods, instructions or products referred to in the content. |
© 2024 by the authors. Licensee MDPI, Basel, Switzerland. This article is an open access article distributed under the terms and conditions of the Creative Commons Attribution (CC BY) license (https://creativecommons.org/licenses/by/4.0/).