Abstract
Due to the special nature of karst landforms, quantification of their vegetation dynamics and their underlying driving factors remains a formidable challenge. Based on the NDVI dataset, this study uses principal component analysis to extract comprehensive factors and utilizes an optimized parameter-based geographical detector and geographically weighted regression models to assess the explanatory capacity of comprehensive factors concerning the spatial differentiation of vegetation change. The results of this study revealed the following: (1) In terms of temporal and spatial vegetation changes, the Asian karst concentrated distribution area (AKC) displayed overall stability and an increasing trend between 2000 and 2020. Notably, the northern (Southwest China) karst region experienced the most substantial vegetation increase, with increased areas exceeding 70%, primarily concentrated in the provinces of Guizhou and Guangxi. In contrast, the southern (Indochina Peninsula) karst region, particularly in Cambodia, Laos, and Vietnam (CLV), exhibited a significant decreasing trend, with decreased areas exceeding 30%. (2) By analyzing the driving factors affecting vegetation change, vegetation changes exhibited distinct spatial differentiations, along with positive and negative effects. Human factors, including human activity intensity, urban economic development, and agricultural economic development (explanatory power and local R2 were both greater than 0.2), exerted a more significant impact on vegetation change in the AKC than natural factors such as thermal conditions, water conditions, and soil conditions. This impact was positive in Southwest China but inhibited in the Indochina Peninsula, particularly within the CLV karst area. Notably, the interaction between natural and human factors greatly enhanced their impacts on vegetation changes. These results provide valuable insights into vegetation changes and their driving mechanisms, which are crucial for preserving the stability of delicate karst ecosystems and facilitating vegetation recovery.
1. Introduction
Vegetation plays a pivotal role in terrestrial ecosystems, exerting a significant influence on energy exchange, carbon cycling, and climate change, while also contributing to ecosystem stability on regional and global scales [1,2,3]. Vegetation change represents a complex process that reflects the dynamics of terrestrial ecosystems [4]. Notably, vegetation exhibits high sensitivity to the impacts of both natural and anthropogenic environmental factors, with a pronounced impact in karstic regions [5], where excessive anthropogenic disturbances and climatic extremes can trigger severe degradation [6]. Crucial natural determinants such as climate, soil quality, and moisture availability are indispensable prerequisites for vegetation growth and profoundly affect its geographical distribution [7,8,9]. Additionally, human activities exert dualistic effects on vegetation dynamics [10]. Initiatives such as ecological projects, including afforestation and land conversion to forested areas, promote vegetation rejuvenation [11,12], while urban expansion and deforestation exacerbate vegetation degradation [13]. Therefore, it is imperative to systematically monitor the dynamic changes of vegetation and identify the nuanced impacts of driving factors on vegetation transformation.
The Asian karst concentration distribution area (AKC) is located in southern East Asia and Southeast Asia and constitutes one of the three major globally concentrated and contiguous karst distribution regions. It falls within the tropical-subtropical karst domain [14] and represents the most contiguous karst expanse in Asia [15]. The northern section comprises Southwest China (SC), while the southern portion encompasses the Indochina Peninsula (IP). Karst formations are characterized by distinctive bedrock weathering and soil layers [16], intricate water circulation dynamics [17,18], and unfavorable land use practices [19], rendering the region exceedingly sensitive and fragile. These factors create exceptionally challenging conditions for the growth of vegetation. Consequently, investigations focusing on vegetation change in karst areas are of paramount importance. With the ongoing advancements in satellite remote sensing technology, a discernible greening trend has been observed in the AKC [20,21]. However, certain studies have reported a relatively rapid forest loss rate in the IP [22], potentially affecting ecosystem stability and precipitating a series of climatic and environmental issues. Although current research on vegetation restoration in the karst areas of SC has made initial strides [23,24,25], it has generally overlooked the dynamics and drivers of vegetation across the entire contiguous distribution of karst landscapes. Moreover, limited research has been conducted on vegetation changes in the IP karst region. Hence, it is imperative to gain a comprehensive understanding of the state of vegetation change within the AKC, elucidate internal disparities, and delineate the factors influencing these alterations. Such insights will facilitate the development of vegetation restoration strategies to address the challenges posed by natural and anthropogenic factors in vegetation ecosystems in karst regions.
The normalized difference vegetation index (NDVI) is a crucial indicator in satellite remote sensing for assessing vegetation growth. It has been extensively applied for monitoring dynamic vegetation changes [26,27]. Compared with other vegetation indices, it is simple and widely used, and its calculation is relatively convenient [28]. The calculation only needs to use the reflection values of the red light band and near-infrared band, which is very convenient for large-scale remote sensing data analysis. It has higher sensitivity under low vegetation coverage and is suitable for areas such as cropland, commercial agriculture [29], grassland, and karst rocky desertification. The MODIS NDVI dataset has gained prominence in vegetation dynamics research because of its superior spatial and temporal resolution and reliance on a single unaffected sensor, immune to platform, or sensor drift. It offers more accurate spectral, spatial, geometric, and radiometric attributes [30,31]. Therefore, this study adopted MODIS NDVI products to analyze vegetation changes in large-scale karst-concentrated distribution areas. As NDVI datasets evolve and improve, various methodologies have emerged for estimating changes in vegetation dynamics and driver analysis. Trend analysis [32] and the coefficient of variation [33] have been widely employed to examine the spatial and temporal fluctuations and stability of vegetation in diverse regions, yielding results closer to actual vegetation changes. Traditional statistical methods are commonly used to study the factors affecting vegetation change, including multivariate residual analysis [34], partial correlation analysis [35], and regression analysis [36]. However, these approaches predominantly rely on linearity and smoothness assumptions and often ignore the inherent complexity of vegetation change. Principal component analysis (PCA) [37] can combine multiple variables into a composite one, facilitating the extraction of multiple factors. Geographically weighted regressions (GWR) can detect spatially varying relationships between vegetation change and one or more influencing factors [38], capturing spatial non-stationarity and the positive and negative effects of vegetation change. Geographical detectors [39,40] excel at delineating spatially stratified heterogeneity in response variables and unveiling driver impacts free from assumptions of linearity, while also uncovering nonlinear relationships among multiple variables. However, numerous current studies have yielded unsatisfactory and unreliable results regarding the explanatory power of driving factors. Therefore, in this study, we employed an optimal parameter-based geographical detector (OPGD) [41], which leverages spatial discretization optimization and spatial scale optimization to identify the most influential drivers affecting vegetation change. Given the complexity of vegetation change, PCA, GWR, and OPGD offer robust credibility for quantifying the factors that influence these changes.
In this study, we pursued the following objectives: (1) employing trend analysis, coefficient of variation, and spatial autocorrelation to investigate the temporal and spatial variations as well as the stability of vegetation NDVI; (2) utilizing PCA to extract multiple natural and human factors, integrating them into a comprehensive framework; (3) quantifying the impacts of driving factors and their interactions on vegetation change based on OPGD; and (4) utilizing GWR to identify spatial non-stationarity and both positive and negative effects of comprehensive factors on vegetation change. The results from this study can provide a sustainable scientific basis and guidance for ecological restoration projects and vegetation restoration work in the Asian karst areas and other karst areas.
2. Materials and Methods
2.1. Study Area
The AKC spans the geographic coordinates of 5°30′–29°15′ N and 92°10′–112°04′ E (Figure 1), with a total land area of approximately 2.75 × 10⁶ km2. The northern region, designated as SC, includes the provinces of Yunnan, Guizhou, and Guangxi, covering an area of approximately 8.1 × 10⁵ km2, divided into 39 municipal administrative regions. The southern segment, known as the IP, comprises Myanmar, Laos, Vietnam, Thailand, and Cambodia, with an aggregate land area of approximately 1.94 × 10⁶ km2, partitioned into 198 provincial administrative regions. The karst region within this study spans approximately 7.3 × 10⁵ km2, constituting 26% of the overall land area. It is most densely concentrated in the SC, extending from Yunnan and Guangxi provinces to Myanmar, Laos, and Vietnam. The topography exhibits a gradient from high to low, with an average elevation of 1268 m in the north, characterized by mountainous plateaus, and an average elevation of 435 m in the south, primarily comprising plains and hilly terrain. The climate types vary, with a subtropical monsoon climate in the north and a tropical monsoon climate in the south. The AKC has extremely rich vegetation, including coniferous forests, broad-leaved forests, mixed forests, grasslands, wetlands, tropical rainforests, etc. The canopy layer is relatively high, and the species diversity is high. The northern part is dominated by plateau coniferous forests, evergreen broadleaf forests, arbor forests, etc., while tropical rainforests are most widely distributed in the south, accounting for more than 50% of the forest area [42]. Since there are a large number of croplands distributed in the south, agricultural crops also account for a large proportion of the vegetation. In recent years, the socioeconomic development of AKC has progressed rapidly. Specifically, the IP has witnessed the most rapid urban expansion (Figure 1b), whereas the SC has experienced the fastest growth in GDP (Figure 1c). This heightened socioeconomic development, coupled with increased human activities, has drawn substantial attention to the state of vegetation increase and decrease within the AKC.
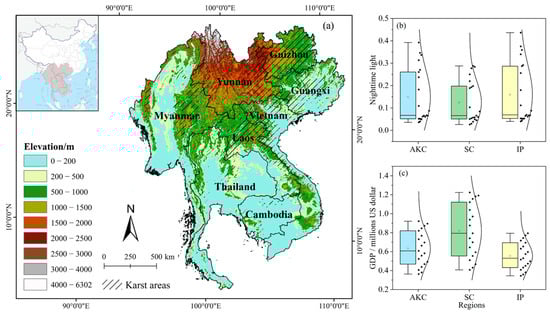
Figure 1.
Location map of the study area. (a) DEM; (b) nighttime light; (c) gross domestic product (GDP). Note: AKC: Asian karst concentration distribution area; SC: Southwest China; IP: Indochina Peninsula. DEM, nighttime light, and GDP data from Table 1.
2.2. Data Sources and Preprocessing
The NDVI data utilized in this study was derived from MOD13A3, a dataset in the MODIS data series provided by NASA (https://modis.gsfc.nasa.gov/, accessed on 25 July 2023). For a span of 21 years, from February 2000 to December 2020, monthly NDVI data were selected for this study. The NDVI value for January 2000 was replaced with the annual average value. Subsequently, the anomalous values were eliminated, with the identification of NDVI values greater than 0 as indicative of vegetative cover and labeled as the vegetation NDVI. To mitigate the influence of certain factors such as cloud cover, atmospheric interference, and sunlight, the annual average NDVI data were obtained through the maximum synthesis method [43,44].
The karst data utilized in this study were sourced from the China Geological Survey’s mapping of karst development in southern China and Southeast Asia (https://www.cgs.gov.cn/, accessed on 20 July 2023). These data were digitized to represent the distribution of karst within the study area and were categorized into two distinct groups: karst and non-karst regions. In this study, there were a total of 237 administrative regions, comprising 39 municipal administrative regions in SC and 198 provincial administrative regions in the IP. Data processing and analysis were performed at pixel or administrative unit levels.
Table 1 presents the data sources and descriptions (all data accessed on 5 September 2023) of potential natural and human factors affecting vegetation changes, all of which were remote sensing datasets derived from satellites or published papers by scholars and had high reliability and accuracy. These datasets were standardized by clipping and projecting them onto a uniform coordinate system using ArcGIS software (Version 10.2 (2013), Environmental Systems Research Institute, Redlands, CA, USA, https://www.esri.com). The spatial resolution was resampled to 1 km to align with the resolution of the NDVI data and ensure data consistency. The methods used for resampling are the nearest neighbor allocation method and the bilinear interpolation method. The nearest neighbor allocation method is mainly used for discrete data, such as land use types, and the bilinear interpolation method is used for continuous data, and some smoothing is performed on the data. To enhance data accuracy, minor adjustments were made based on regional statistical insights, mainly for social and humanistic data, such as GDP, population density, and other data. We collected some data from the statistical yearbooks of various countries and regions and made appropriate adjustments to correct some outliers to make the data results more consistent with reality. Natural factors included topographic parameters (elevation and slope), climate factors (annual mean temperature, annual precipitation, annual solar radiation [45], aridity index [46], and evapotranspiration), and soil factors (soil organic carbon content, soil moisture content, soil clay content, and soil sand content), totaling 11 indicators. Human factors consist of nine indices: nighttime light [47], road network density, population density, gross domestic product (GDP) [48], impervious surface [49], human footprint [50], cropland expansion [51], cropping intensity [52], and land use. To transform categorical variables into continuous variables, impervious surfaces, human footprints, cropland expansion, and cropping intensity were represented as continuous variables based on area change. Land use types were categorized into six classes: cropland, forestland, grassland, water bodies, construction land, and unused land. The average land use degree comprehensive index (LDCI) [53] was employed to quantify the land use types for 2000, 2010, and 2020 (Method S1).

Table 1.
Datasets in the study area.
2.3. Methods
The research methodology and workflow are shown in Figure 2. This study assessed the spatial and temporal trends, stability, and spatial clustering of vegetation NDVI using trend analysis, coefficient of variation (Method S4) [54], and spatial autocorrelation analysis (Methods S2 and S3) [55] applied to an extensive time series of remote sensing data. To investigate the extent of vegetation change in response to the drivers, we employed PCA to integrate various factors into a comprehensive framework. The vegetation NDVI slope served as the dependent variable. Additionally, we leveraged the OPGD and GWR to quantify the explanatory capacity of comprehensive factors concerning the spatial differentiation of vegetation change, encompassing non-stationarity and positive and negative effects.
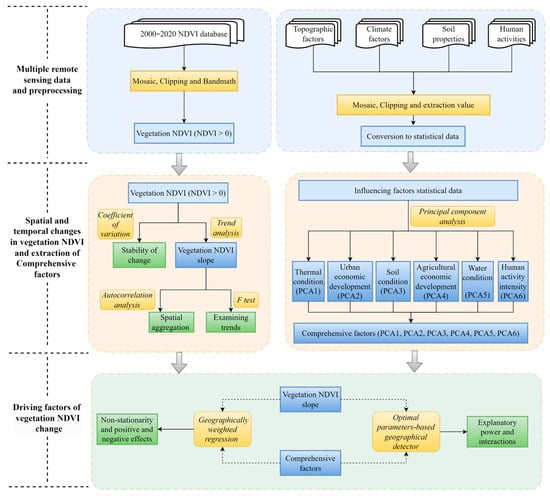
Figure 2.
A flowchart showing the data and results analysis procedures in this study. Note: PCA1: thermal conditions; PCA2: urban economic development; PCA3: soil conditions; PCA4: agricultural economic development; PCA5: water conditions; PCA6: human activity intensity.
2.3.1. Slope Trend Analysis
The slope trend analysis method employed in this study was a one-dimensional linear regression model rooted in the least squares technique, which is used to evaluate long-term trends within time-series data [56]. We conducted a pixel-by-pixel analysis of the annual mean vegetation NDVI values from 2000 to 2020. The relevant formula is as follows:
where is the study period, is the average value of NDVI in the year. > 0 indicates an upward trend in NDVI over the years and < 0 a downward trend. The F-test [57] was used to test the significance of the vegetation NDVI slope (Table S1). Additionally, our definitions of vegetation degradation and improvement are as follows: if the average annual NDVI shows a downward trend or decreases compared with previous years, we call it degradation. On the contrary, if the average annual NDVI shows an upward trend or if it is higher than in previous years, we call it improving.
2.3.2. Principal Component Analysis
PCA is a multivariate statistical technique used to convert data from correlated variables into uncorrelated variables through orthogonal transformation [58]. These uncorrelated variables were subsequently combined into principal components. In this study, a set of 20 natural and anthropogenic variables was considered, and PCA was employed to reduce high-dimensional data to lower dimensionality [59]. This transformation allowed multiple variables to be converted into comprehensive variables while retaining essential information within the dataset. Furthermore, it maximized the cumulative variance of variable loadings by utilizing a Variance Maximization Rotation Matrix [60].
2.3.3. Optimal Parameter-Based Geographical Detector
The OPGD represents an enhancement of the geographical detector methodology, designed to identify the optimal spatial heterogeneity criterion using discrete spatial data. This refinement enhances the overall capacity of spatial hierarchical heterogeneity analysis, resulting in more precise spatial assessments [61]. OPGD includes five distinct detectors: factor, parameter optimization, interaction, risk, and ecological. In this study, we focused on the first three detectors, which were employed for optimal parameter analysis using the GD package (Version 1.10 (2020), Institute of Geography, Chinese Academy of Sciences, BJ, CN, https://cran.r-project.org/web/packages/GD/index.html) in the R programming language (Version 4.2.1 (2022), University of Auckland, AKL, NZ, https://www.r-project.org) [62]. This analysis pertained to factors requiring discretization to determine the optimal categories of influencing factors. For more detailed information on the best classification and two factor interactions, see Supplementary Materials (Figures S2–S5 and Table S2). The explanatory power of these influencing factors was quantified using Q, as defined by the following formula:
where = 1, 2, …, is the partition of variable Y or factor X; and are the number of units in layer and the whole region, respectively; and are the variance of Y values in stratum and the whole region, respectively. and represent the summation of intra-stratum variances and total variance encompassing the entire region, respectively. The variable Q is constrained within the range [0, 1], where higher values signify a more conspicuous spatial differentiation of Y [63].
2.3.4. Geographically Weighted Regression
GWR focuses more on spatial heterogeneity within data than the conventional Ordinary Least Squares (OLS) method. This approach enables the direct modeling of non-stationary data and the examination of spatially varying relationships through the estimation of local parameters [64,65]. In this study, GWR was employed to analyze the spatial sensitivity and positive and negative impacts of comprehensive factors on the vegetation NDVI slope. The relevant formula is as follows:
where is the explanatory variable; is the intercept; is the nth explanatory variable of the independent variable ; is the spatial geographic coordinate; is the coefficient of the independent variable ; and is the random error.
3. Results
3.1. Spatial and Temporal Variation Characteristics of Vegetation NDVI in the AKC
3.1.1. Temporal Variation Characteristics of Vegetation NDVI
The aggregate vegetation NDVI exhibited an overall increasing trend (Figure 3a). Notably, this trend was more pronounced within the karst region, whereas the non-karst area exhibited a relatively slow increase. From a regional perspective, differences in vegetation NDVI changes were evident (Figure 3d). Specifically, SC displayed a significant increasing trend, with the karst area exhibiting the fastest growth rate (Figure 3b), characterized by a substantial change range of 0.033/10 yr. In contrast, the IP witnessed a comparatively slower increasing trend and maintained overall relative stability. Although the karst area within the IP had a high NDVI value (Figure 3c), its growth rate was the slowest, with a minimal change range of only 0.009/10 yr. In short, SC played a pivotal role in driving the greening trend within the AKC, particularly in the karst region.
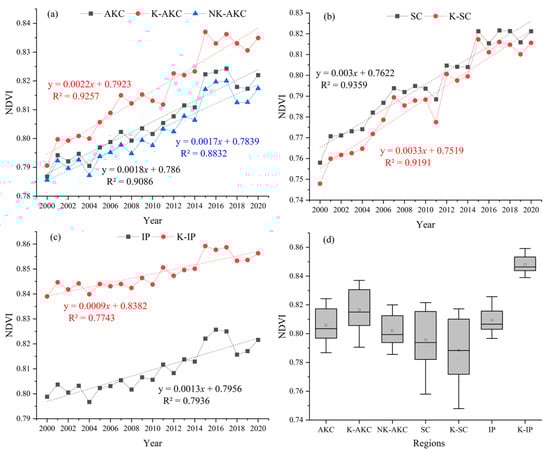
Figure 3.
Inter-annual variation of vegetation NDVI in different regions. (a) Whole area; (b) SC; (c) IP; (d) Boxplots showing the stability of vegetation NDVI change over the different regions. Note: Karst area of AKC (K-AKC); Non-Karst area of AKC (NK-AKC); Karst area of SC (K-SC); Karst area of IP (K-IP).
3.1.2. Spatial Distribution and Variation Characteristics of Vegetation NDVI
The spatial distribution of the multi-year average NDVI within the AKC displayed an overall elevated pattern (Figure 4a). This distribution exhibited a spatial configuration characterized by high values in the central region and low values in both the northern and southern areas. In terms of regional spatial distribution, the karst area in SC exhibited low vegetation NDVI values, while the IP karst area displayed high values. Additionally, the spatial stability of vegetation NDVI remained relatively consistent across the entire region (Figure 4b). This stability exhibited a spatial pattern characterized by higher stability in the central region, with slightly lower stability observed in the surrounding areas. Furthermore, the vegetation NDVI slope demonstrated notable spatial autocorrelation over the 2000–2020 period (Figure 4c), as evidenced by a global Moran’s index and Z-score of 0.27 and 11.3, respectively, denoting strong spatial clustering (Figure S1). Specifically, areas exhibiting an increase in the vegetation NDVI slope formed distinct clusters within SC, particularly within the karst region. Conversely, areas exhibiting a decline in the mean annual NDVI exhibited more pronounced clustering in Cambodia, Vietnam, and Laos within the IP.
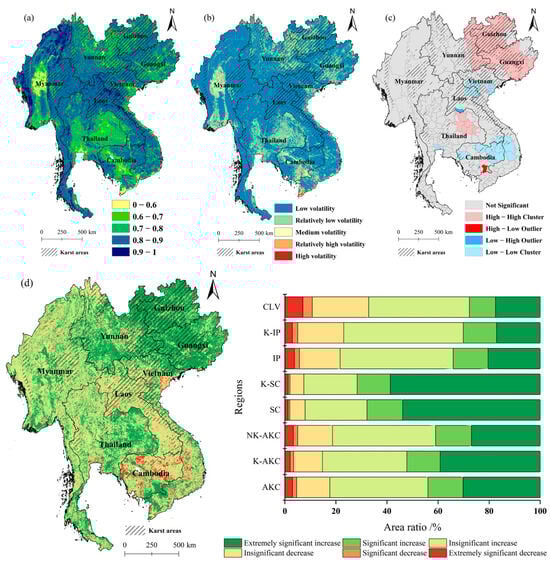
Figure 4.
Spatial distribution and variation in vegetation NDVI. (a) Spatial distribution of multi-year average vegetation NDVI; (b) spatial distribution of vegetation NDVI coefficients of variation; (c) spatial aggregation of positive and negative trends in vegetation NDVI slope; (d) the increasing or decreasing trend of vegetation NDVI. Note: CLV is the abbreviation of Cambodia, Laos, and Vietnam.
The F-test was employed to examine the vegetation NDVI slope, providing further validation of the spatial clustering of vegetation increases or decreases. This analysis revealed varying degrees of changing trends within the AKC (Figure 4d). Overall, the AKC exhibited a prevailing trend of vegetation increase, with a more pronounced increase observed in the northern region, particularly within the karst areas, where the proportion of significantly increased areas exceeded 50%. Conversely, the southern part showed a relatively less substantial increase. From a regional perspective, the overall increasing trend in SC was notably pronounced, especially within its karst regions, primarily Guizhou and Guangxi Provinces. A substantial increase in area encompassed 71.7% of the study area. In contrast, the IP exhibited a less conspicuous overall increasing trend, marked by a decreased area exceeding 20%, significantly higher than the 8% recorded in SC. This decreasing trend was particularly prominent in the karst mountainous regions of Cambodia, Laos, and Vietnam. Consequently, in this study, Cambodia, Laos, and Vietnam (CLV) were designated as areas of concentrated karst with severe vegetation decreases.
3.2. Spatial Distribution and Variation of Potential Influencing Factors in AKC
The process of vegetation dynamics was intricate, and this study examined and analyzed 20 potential factors to affect vegetation changes. Significant variations were observed in the spatial distribution of these potential influencing factors across the study area (Figure 5). An overarching spatial pattern emerged in relation to topographic factors, with higher values observed in the northern regions and lower values observed in the southern regions. Regarding climatic conditions, temperature, evapotranspiration, precipitation, and solar radiation exhibited consistent patterns of lower values in the north and higher values in the south. Notably, areas with exceptionally high precipitation are concentrated in southern Myanmar. The aridity index consistently indicated moist conditions, consistent with the subtropical and tropical monsoon climates prevalent within the study area. Concerning soil factors, soil organic carbon content exhibited higher levels in SC and lower values in the IP. The soil moisture content displayed a north–south gradient, with higher values in the southern regions. Overall, the study area displayed higher levels of soil sand and clay contents. In terms of urban economic indicators, higher values and variations in population density, nighttime light, GDP, and impervious surfaces were concentrated within SC and Thailand. Human activity intensity exhibited a more robust impact throughout the study area, albeit with weaker effects in the less densely populated Laos. Conversely, agricultural economic factors demonstrated a higher spatial distribution within the IP, marked by an expanding cropland area and increasing cropping intensity.
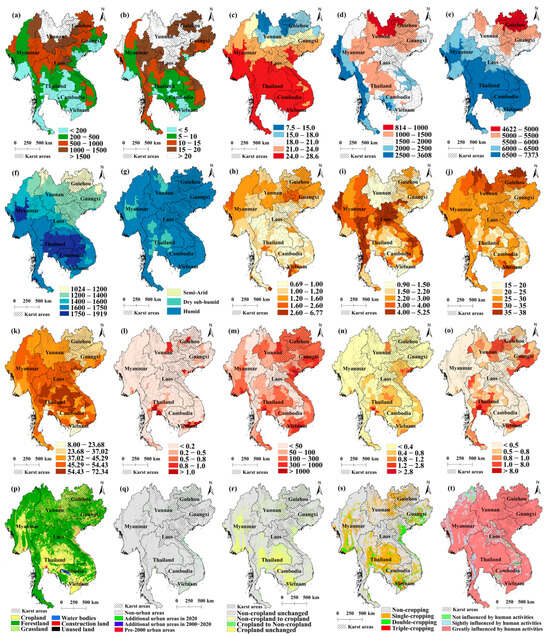
Figure 5.
Spatial distribution of potential influencing factors. (a): DEM/m; (b): Slope/°; (c): Annual mean temperature/°C; (d): Annual mean precipitation/mm; (e): Annual solar radiation/(MJ·m−2); (f): Evapotranspiration/mm; (g): Aridity index; (h): Soil organic carbon/weight %; (i): Soil moisture/weight %; (j): Soil clay content/weight %; (k): Soil sand content/weight %; (l): Nighttime light; (m): Population density/(person·km−2); (n): Road network density/(km·km−2); (o): GDP/millions US dollar; (p): Land use type; (q): Impervious surface; (r): Cropland expansion; (s): Cropping intensity; (t): Human footprint.
Figure 6 illustrates the changes in land use within the northern and southern partitions of the AKC from 2000 to 2020, revealing distinct land use transformation patterns in these two regions. Within SC (Figure 6a), approximately 36.7% of the region’s land use experienced alterations. The most substantial change was observed in croplands, with a net reduction of 5317 km2, which was largely converted into forestland and grassland. This transformation primarily resulted from ecological projects, such as farmland-to-forest conversion and afforestation projects, contributing to a net increase of 1445 km2 in forestland. In the IP (Figure 6b), approximately 10.58% of the region’s land use underwent modifications. Forestland exhibited the most significant reduction, with a net decrease of 27,396 km2, and was primarily converted into cropland. Concurrently, the cropland area expanded by 21,058 km2 in IP.
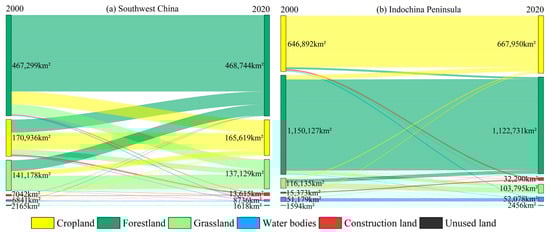
Figure 6.
Changes in land use transfer during the period 2000–2020. Note: the transfer color indicates the target category of the transfer; the width represents the converted area.
3.3. Extraction Results of Comprehensive Factors
In this study, PCA was employed to extract the primary components from a pool of 20 potential factors, including both natural and human elements (Table 1), associated with the vegetation NDVI slope. By fine-tuning the input variables, we derived a selection of principal components characterized by substantial cumulative contributions. Subsequently, 16 influential factors were integrated into the comprehensive factors (Table 2). Utilizing coordinate transformation via the variance-maximizing rotation matrix, we maximized the sum of variances for variable loadings, subsequently identifying influencing factors exhibiting correlations exceeding 50% based on the principal component categories. Finally, six comprehensive factors were delineated (Table 3), including both human (urban economic development, agricultural economic development, and human activity intensity) and natural factors (thermal conditions, soil conditions, and water conditions).
Table 2.
Influencing factors involved in the extraction of the comprehensive factors.
Table 3.
Principal components derived from influencing factors.
3.4. Impact of Comprehensive Factors on Vegetation Change in AKC
3.4.1. Explanatory Power of Comprehensive Factors for Spatial Differentiation in Vegetation Change
Utilizing the OPGD, the study assessed the substantial impacts of all six comprehensive factors on the vegetation NDVI slope, signifying statistical significance (p < 0.05). The Q value was employed to demonstrate the explanatory power of the distinct regional comprehensive factors concerning the spatial differentiation of vegetation changes (Figure 7). Within the AKC (Figure 7a), human activity intensity (0.232), agricultural economic development (0.228), and urban economic development (0.218) exhibited explanatory powers exceeding 20%, indicating the predominant impacts of human activity-related factors on vegetation change in AKC. In SC (Figure 7b), human activity intensity (0.299) and urban economic development (0.287) emerged as the most influential factors affecting vegetation change. Within the IP (Figure 7c), human activity intensity (0.443) exerted a considerably higher impact than other factors, demonstrating its central role in shaping vegetation change in the region. In CLV (Figure 7d), human activity intensity (0.261), urban economic development (0.288), and thermal conditions (0.222) collectively played substantial roles in driving vegetation changes within the area. Overall, this analysis highlights the predominance of human-related factors in the elucidation of vegetation changes across diverse regions.
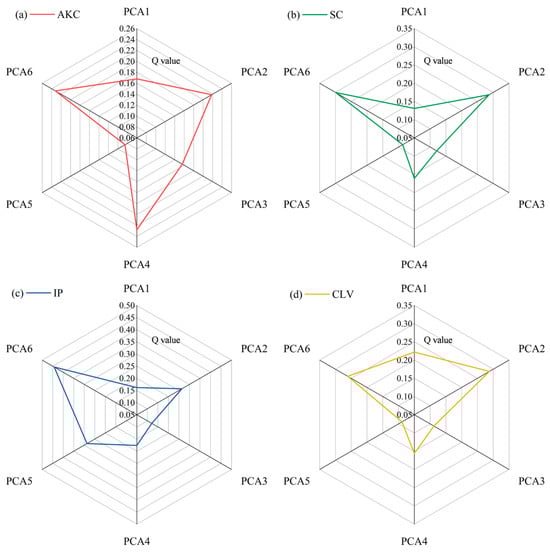
Figure 7.
The explanatory power of comprehensive factors in different regions. PCA1: thermal conditions; PCA2: urban economic development; PCA3: soil conditions; PCA4: agricultural economic development; PCA5: water conditions; PCA6: human activity intensity.
In this study, we examined the interactions among the six comprehensive factors to elucidate how they collectively enhance their impacts on vegetation change. The analysis revealed the presence of two-factor or nonlinear enhancement, with distinct patterns observed across different regions (Figure 8). Within the AKC (Figure 8a), the explanatory power of interactions such as thermal conditions and urban economic development (0.519), soil conditions (0.513), and agricultural economic development (0.524) exceeded 50%. Additionally, the interaction between soil conditions and agricultural economic development (0.516) exhibited explanatory power exceeding 50%. In SC (Figure 8b), interactions, including urban economic development and soil conditions (0.717), urban economic development and agricultural economic development (0.734), and agricultural economic development and human activity intensity (0.757), all demonstrated explanatory powers exceeding 70%. Within the IP (Figure 8c), interactions such as urban economic development and human activity intensity (0.644) and agricultural economic development and human activity intensity (0.666) exhibited explanatory powers exceeding 60%. In CLV (Figure 8d), interactions such as thermal conditions and urban economic development (0.854) and thermal conditions and human activity intensity (0.77) exhibited explanatory powers exceeding 70%. These results indicated the significance of interactions between human-related factors and interactions between human-related factors and natural factors, which collectively enhanced their impacts on vegetation change.
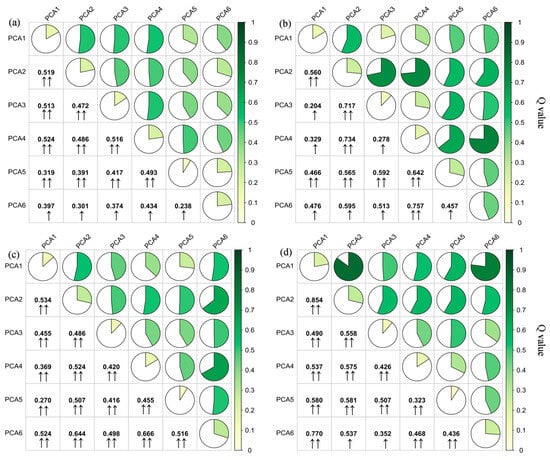
Figure 8.
Interactions of comprehensive factors in different regions. (a) AKC; (b) SC; (c) IP; (d) CLV. Note: “↑” and “↑↑” indicate the bivariate enhancement and the nonlinear enhancement of two factors, respectively.
3.4.2. Spatial Non-Stationarity and Positive and Negative Effects of Comprehensive Factors on Vegetation Change
We constructed a multiple regression model employing both OLS and GWR. The model utilized the vegetation NDVI slope as the dependent variable and six comprehensive factors as the independent variables. To identify the appropriate kernel extent, we employed Bandwidth Parameter (PAR), Cross Validation (CV), and Akaike Information Criterion (AICc). By comparing the statistical results between the OLS and GWR models (Table 4), our analysis clearly demonstrated the superior performance of the GWR model.
Table 4.
Comparison of the statistical results using OLS and GWR models.
The GWR results revealed spatial variability in the sensitivity of the NDVI slope to the composite factor. Boxplots (Figure 9) illustrate the variation in the correlation strength between comprehensive factors and the vegetation NDVI slope across different regions. Notably, human factors exhibited a more substantial correlation than natural factors, with human activity intensity exerting a significant impact across the entire study area and its partitions (R2 > 0.2). Urban economic development also exhibited a pronounced impact on the AKC, IP, and CLV, with mean local R2 values of 0.29, 0.32, and 0.24, respectively. Furthermore, our analysis in CLV highlighted that thermal conditions and soil conditions also played substantial roles in influencing vegetation changes, thereby corroborating and elucidating the results obtained through OPGD analysis.
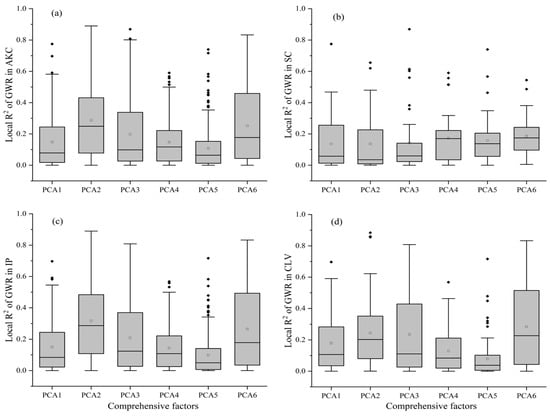
Figure 9.
Local R2 of GWR in different regions. (a) AKC; (b) SC; (c) IP; (d) CLV.
Comprehensive factors exerted both positive and negative impacts on vegetation changes, and the regression coefficients between various comprehensive factors and the vegetation NDVI slope exhibited notable spatial variations (Figure 10), indicating a substantial degree of spatial non-stationarity. (1) Regarding the thermal conditions (Figure 10a), the regression coefficients span the range of [−0.005723, 0.00386]. The overall impact of thermal conditions on vegetation changes in the AKC displayed a predominant negative impact in the northern regions and a positive impact in the southern regions. This pattern generally corresponded with the spatial distribution of temperature, solar radiation, and evapotranspiration, demonstrating north–low and south-high patterns (Figure 5c,e,f). (2) In terms of urban economic development (Figure 10b), the range of regression coefficients was [−0.00574, 0.006284]. Urban economic development exhibited an overall negative effect on vegetation changes in the AKC. Increased urbanization levels were associated with some degree of vegetation damage, but relatively minor, in SC (Figure 9b). (3) The soil conditions (Figure 10c) featured regression coefficients within the range of [−0.001532, 0.000757]. Vegetation changes in the AKC predominantly experienced a negative impact due to soil conditions, with spatial variations indicating positive effects in the north and negative effects in the south. The adverse effect was more pronounced in CLV but mainly positive in Myanmar and Thailand. (4) Agricultural economic development (Figure 10d) exhibited regression coefficients ranging [−0.002156, 0.001506]. Overall, vegetation changes in the AKC primarily showed a positive effect on agricultural economic development, while a more evident negative effect was observed in the karst areas of the CLV. This negative impact was related to planting structures and cropland expansion (Figure 5r,s). (5) The water conditions (Figure 10e) displayed regression coefficients ranging from [−0.002912, 0.0012]. Vegetation changes in the AKC influenced by water conditions predominantly exhibited a negative effect, with positive effects concentrated in Yunnan, Thailand, and Laos. This distribution was broadly aligned with the spatial distribution of precipitation (Figure 5d). (6) Human activity intensity (Figure 10f) featured regression coefficients spanning [−0.003383, 0.003118]. Vegetation changes in the AKC were affected by human activity intensity, with a spatial distribution of positive effects in the north and negative effects in the south. SC exhibited a predominantly positive effect, whereas CLV exhibited a more pronounced negative effect.
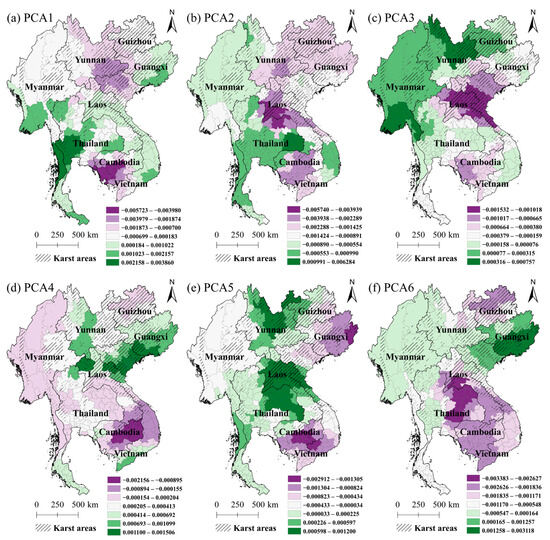
Figure 10.
Regression coefficients of comprehensive factors and vegetation NDVI slope.
4. Discussion
4.1. Temporal and Spatial Variation Characteristics of Vegetation in AKC
Large-scale remote sensing data usually have large uncertainties. Although the measured data are relatively accurate, they are difficult to verify on a large scale because they face problems such as funds, equipment, environment, and accessibility. Therefore, this study is based on the published PKU GIMMS NDVI product [66], which eliminates the obvious orbital drift and sensor degradation effects in the tropics and has high accuracy. By verifying the consistency of the processed MODIS NDVI data from the perspective of time and space, from a time perspective, the annual average NDVI change trends of the two from 2000 to 2020 are highly consistent (Figure 11a), and the differences in annual average values are very small. By constructing a 10 km grid within the study area and extracting the corresponding annual average NDVI values for many years for comparison (Figure 11b), it was found that the two have high correlation and consistency (r = 0.87). From a spatial perspective (Figure 12), the annual average values of NDVI for many years have extremely high consistency in spatial distribution, with very small differences. Therefore, the MODIS NDVI data in this study have high reliability.
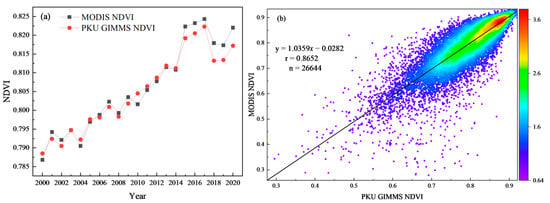
Figure 11.
Time consistency comparison of MODIS and PKU GIMMS NDVI products. (a) Time consistency comparison of the annual average NDVI; (b) consistency comparison of the multi-year average NDVI.
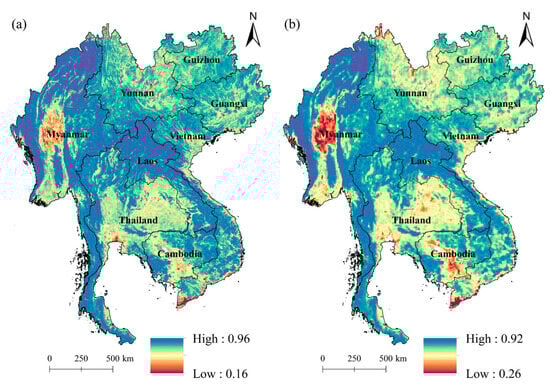
Figure 12.
Comparison of the consistency of the spatial distribution of multi-year average NDVI between MODIS and PKU GIMMS NDVI products. (a) MODIS NDVI; (b) PKU GIMMS NDVI.
Several studies have revealed that an increase in global vegetation degradation is concealed by an overall trend of vegetation greening, with a more extensive area experiencing a transition from greening to degradation than the reverse transition from degradation to greening [67]. This phenomenon is also evident in the AKC. Notably, the positive vegetation trend observed in SC and its karst regions (Figure 3) has been linked to ecological engineering. Since 2000, the SC region has made substantial investments in the protection and restoration of natural capital [68]. These large-scale conservation initiatives have played a pivotal role in the recovery of karst vegetation and have positively affected carbon sequestration for climate change mitigation [69]. Scholars have indicated the substantial contribution of ecological engineering to the positive vegetation trends in the karst areas of SC [70], emphasizing the influence of land-use conversion and the transformation of farmland into forests on vegetation coverage [71]. These findings aligned closely with the results of this study, highlighting the significant role of ecological engineering in promoting vegetation greening in karst regions of the SC. In contrast, the increase in vegetation in the IP and its karst areas has been relatively sluggish. In non-karst regions, the positive impact of climatic factors is counterbalanced by the inhibitory effects of anthropogenic factors [13]. Within karst areas, the suppressive effect of human factors on vegetation change far outweighs the promoting effects of climatic factors. Some studies have elucidated a strong association between vegetation change and land use intensity, particularly in economically disadvantaged karst forest regions [72]. Deforestation is notably more severe in these areas, significantly affecting carbon cycling dynamics within vegetation ecosystems [73].
4.2. Impact of Driving Factors on Vegetation Change
The vegetation dynamics in karst areas exhibit remarkable sensitivity to disturbances from both natural and human-induced factors. Climate factors are typically regarded as the primary drivers of vegetation change and distribution, albeit with variations across regions [74,75]. In this study, thermal and water conditions (climate factors) exerted a relatively limited impact on the overall vegetation changes within the AKC and SC (Figure 7). Conversely, in the IP, climatic factors play a pivotal role in fostering vegetation growth. Numerous studies have indicated the significant correlation between climate factors and vegetation change, emphasizing that increased precipitation and reduced temperature can positively contribute to vegetation greening [36,76]. Furthermore, the composition of the karst bedrock regolith plays a crucial role in shaping soil moisture and soil organic carbon distribution [77], subsequently affecting vegetation growth. Therefore, the impacts of the soil conditions cannot be ignored. Soil conditions were found to promote vegetation changes in SC, Myanmar, and Thailand, while exerting an inhibitory effect on CLV (Figure 10c). In the karst mountainous areas of CLV, which are characterized by a relatively underdeveloped economy and sparse population, unfavorable land-use practices persist, including deforestation, slash-and-burn agriculture, and agricultural expansion [78]. These practices, such as straw burning, result in a substantial loss of carbon and nitrogen compounds and adversely impact the soil structure. Increased erosion rates further reduce soil fertility and impede vegetation growth [79].
Human factors exert a more substantial influence on vegetation changes within the AKC than natural factors, though the direction of this influence exhibits significant regional variations. Notably, urban economic development predominantly suppressed vegetation change within the AKC (Figure 10b). This suppression arises from the expansion of urban construction land, which occupies parts of forested and cultivated areas, resulting in a reduction in vegetation cover. This effect is particularly pronounced in Thailand and Vietnam, which are characterized by higher levels of urbanization (Figure 5l,n,o). Conversely, in SC, both agricultural economic development and human activity intensity had primarily positive impacts on vegetation change (Figure 10d,f). Studies have indicated that the expansion of forested areas, as demonstrated by the increase in forestland area (Figure 6a), contributes significantly to the highest biomass carbon density, consequently increasing the total carbon content within vegetation ecosystems [80]. Initiatives such as the conversion of farmland to forests further enhance biodiversity and sustain ecosystem stability [81]. However, in the IP, particularly in the CLV karst region, human activity intensity and agricultural economic development exhibit adverse effects on vegetation changes (Figure 10d,f). Frequent tropical deforestation, characterized by rapid forest area loss (Figure 6b) [82], is particularly pronounced in this region, and the most obvious one is substantial mangrove loss in Myanmar and Cambodia [83]. The loss of tropical forests has resulted in reduced aboveground biocarbon [84], thereby inflicting significant harm to the ecosystem carbon cycle. Furthermore, agricultural economic development has affected ecological resources in the IP through shifts towards alternative cultivation and the expansion of agricultural land [85], particularly within the CLV karst area. Rubber forests, as a prevalent alternative plantation type, have witnessed substantial expansion in response to increasing global demand, thereby leading to frequent land use transitions, reducing natural forest areas, and expanding rubber forest coverage [86].
In this study, the interaction of climatic factors, soil factors, human activity intensity, agricultural economic development, and urban economic development enhanced their combined impacts on vegetation change. This enhancement was primarily nonlinear and exhibited varying degrees of contribution across the different regions within the study area. Based on the insights gained from our findings, it is imperative for governments and resource managers to recognize regional disparities within the AKC. They should also identify the principal factors affecting vegetation changes and integrate the complexity of each factor to develop appropriate strategies for karst ecological environment protection and vegetation restoration to address ecosystem changes and the challenges posed by global change instability.
4.3. Innovation, Limitations, and Prospects
This study area is located in subtropical and tropical areas, where vegetation is extremely dense, and NDVI has a saturated phenomenon (that is, it is insensitive to changes in the environment or biomass) [29]. This phenomenon, which is affected by soil brightness, solar sensor geometry, and canopy structure [87], may underestimate the vegetation coverage and ecosystem productivity of the area. Enhanced vegetation index (EVI) was developed to solve this saturation phenomenon, but the saturation problem still exists, and it is highly sensitive to the solar sensor geometry [28], with large uncertainties. The proposal of kernel NDVI (kNDVI) solves the problem of vegetation index saturation [88]. It is better than other indices in tropical areas with dense vegetation, has a high correlation with gross primary productivity (GPP) and sun-induced chlorophyll fluorescence (SIF) in all biological communities, and has good robustness to noise and saturation. And enhance the stability of the entire space. Therefore, in subsequent research, kNDVI will be our first choice. At the same time, we will focus on considering the advantages and disadvantages of each vegetation index, combined with the actual situation of the study area, to seek the most suitable vegetation index for the area.
In this study, we employed trend analysis, coefficient of variation, and spatial autocorrelation techniques on the NDVI dataset to examine the trends and stability of vegetation in the AKC. However, this study did not consider the seasonality of vegetation changes or account for potential time lags in response to climatic factors. Previous studies have indicated that climatic factors may exhibit a significant time lag and cumulative effects on vegetation growth [89,90]. Therefore, future studies should integrate these effects into their analyses of vegetation dynamics to ensure a more precise estimation of vegetation change.
This study employed a methodology based on PCA to consolidate comprehensive factors by combining multiple variables with similar characteristics. Subsequently, OPGD and GWR were harnessed to assess the explanatory power of these comprehensive factors concerning spatial variations in vegetation changes, including non-stationarity and positive/negative effects. OPGD addressed limitations in spatial classification and optimized classification results, whereas by comparing the different results of several parameter models (Table 4), GWR with a better parameter value optimization effect was selected. By combining these analytical approaches, this study achieved a more robust quantification of the driving forces behind vegetation changes in the AKC, elucidating both their direction and impact magnitude. Nevertheless, certain potential influencing factors, such as elevation, slope, population density, and policy-related information, were not considered in this analysis, and the criteria for selecting comprehensive factors were not explicitly outlined. Future research endeavors will prioritize the refinement of comprehensive factors and the incorporation of additional potential influencing factors to enhance the analytical framework.
5. Conclusions
This study analyzed the temporal and spatial changes and driving factors of AKC vegetation from a regional perspective and a landform zoning perspective and found that:
- (1)
- In terms of spatiotemporal variations in vegetation NDVI, AKC exhibited overall stability and an increasing trend in NDVI from 2000 to 2020. At the regional scale, significant disparities in vegetation NDVI changes were observed. The karst areas within the SC region experienced the swiftest growth, primarily concentrated in Guizhou and Guangxi provinces. Conversely, karst areas within the IP region displayed the slowest growth rate. Furthermore, a significant decreasing trend was evident in the karst mountainous regions of the CLV.
- (2)
- In terms of the factors influencing vegetation change, spatial differentiation of both vegetation change and comprehensive factors was evident in the AKC. The interaction between these natural and human factors intensified their impact on vegetation change, predominantly through nonlinear interactions. Human factors, including human activity intensity, urban economic development, and agricultural economic development, exerted a more significant impact on vegetation change in the AKC than natural factors such as thermal conditions, water conditions, and soil conditions. This impact was positive in SC, but inhibited in the IP, particularly within the CLV karst area, which was closely linked to shifts in crop structure, the expansion of cropland areas, and the retention of traditional farming practices.
Supplementary Materials
The following supporting information can be downloaded at: https://www.mdpi.com/article/10.3390/f15030398/s1, Method S1: Land use degree comprehensive index (LDCI); Methods S2 and S3: global spatial autocorrelation Moran’s Index (I) and local spatial autocorrelation Moran’s I. Method S4: Optimal parameters-based geographical detector (OPGD); Figure S1: The value and aggregation degree of Moran’s I; Figures S2–S5: The best category with the largest Q value at different regional scales; Figure S6: Data distribution of the annual average NDVI. Table S1: Significance test results and classification of vegetation change slope; Table S2: Types of two-factor interactions. References cited in supplementary materials [53,54,55,57,61,62,63].
Author Contributions
S.Y.: investigation, data curation, methodology, software, writing—original draft preparation, visualization, formal analysis. Y.Z.: conceptualization, validation, writing—reviewing and editing, project administration, funding acquisition. D.Y.: investigation, visualization. A.L.: investigation, visualization, reviewing and editing. All authors have read and agreed to the published version of the manuscript.
Funding
This research was funded by the Key Project of the Natural Science Foundation of Guizhou Province (No. QiankeheJichu-ZK [2023] Zhongdian027), and the Project of the Science and Technology Innovation Base Construction of Guizhou Province (No. QiankeheZhongyindi [2023]005).
Data Availability Statement
This study was performed based on public-access data. The data that support the findings of this study are available from the corresponding author upon reasonable request.
Acknowledgments
We would like to thank the anonymous reviewers and editors for their valuable comments and suggestions.
Conflicts of Interest
The authors declare no conflicts of interest.
References
- Wen, Z.; Wu, S.; Chen, J.; Lü, M. NDVI indicated long-term interannual changes in vegetation activities and their responses to climatic and anthropogenic factors in the Three Gorges Reservoir Region, China. Sci. Total Environ. 2017, 574, 947–959. [Google Scholar] [CrossRef]
- Ouyang, W.; Wan, X.; Xu, Y.; Wang, X.; Lin, C. Vertical difference of climate change impacts on vegetation at temporal-spatial scales in the upper stream of the Mekong River Basin. Sci. Total Environ. 2020, 701, 134782. [Google Scholar] [CrossRef]
- Zhang, P.; Cai, Y.; Yang, W.; Yi, Y.; Yang, Z.; Fu, Q. Contributions of climatic and anthropogenic drivers to vegetation dynamics indicated by NDVI in a large dam-reservoir-river system. J. Clean. Prod. 2020, 256, 120477. [Google Scholar] [CrossRef]
- Li, J.; Wang, J.; Zhang, J.; Liu, C.; He, S.; Liu, L. Growing-season vegetation coverage patterns and driving factors in the China-Myanmar Economic Corridor based on Google Earth Engine and geographic detector. Ecol. Indic. 2022, 136, 108620. [Google Scholar] [CrossRef]
- Liu, H.; Zhang, M.; Lin, Z.; Xu, X. Spatial heterogeneity of the relationship between vegetation dynamics and climate change and their driving forces at multiple time scales in Southwest China. Agric. For. Meteorol. 2018, 256, 10–21. [Google Scholar] [CrossRef]
- Zhong, F.; Xu, X.; Li, Z.; Zeng, X.; Yi, R.; Luo, W.; Zhang, Y.; Xu, C. Relationships between lithology, topography, soil, and vegetation, and their implications for karst vegetation restoration. Catena 2022, 209, 105831. [Google Scholar] [CrossRef]
- Piedallu, C.; Chéret, V.; Denux, J.P.; Perez, V.; Azcona, J.S.; Seynave, I.; Gégout, J.C. Soil and climate differently impact NDVI patterns according to the season and the stand type. Sci. Total Environ. 2019, 651, 2874–2885. [Google Scholar] [CrossRef] [PubMed]
- Huang, S.; Zheng, X.; Ma, L.; Wang, H.; Huang, Q.; Leng, G.; Meng, E.; Guo, Y. Quantitative contribution of climate change and human activities to vegetation cover variations based on GA-SVM model. J. Hydrol. 2020, 584, 124687. [Google Scholar] [CrossRef]
- Deng, Y.; Wang, X.; Wang, K.; Ciais, P.; Tang, S.; Jin, L.; Li, L.; Piao, S. Responses of vegetation greenness and carbon cycle to extreme droughts in China. Agric. For. Meteorol. 2021, 298, 108307. [Google Scholar] [CrossRef]
- Qu, S.; Wang, L.; Lin, A.; Zhu, H.; Yuan, M. What drives the vegetation restoration in Yangtze River basin, China: Climate change or anthropogenic factors? Ecol. Indic. 2018, 90, 438–450. [Google Scholar] [CrossRef]
- Zhang, D.; Jia, Q.; Xu, X.; Yao, S.; Chen, H.; Hou, X. Contribution of ecological policies to vegetation restoration: A case study from Wuqi County in Shaanxi Province, China. Land Use Pol. 2018, 73, 400–411. [Google Scholar] [CrossRef]
- Heilmayr, R.; Echeverría, C.; Lambin, E.F. Impacts of Chilean forest subsidies on forest cover, carbon and biodiversity. Nat. Sustain. 2020, 3, 701–709. [Google Scholar] [CrossRef]
- Brandt, M.; Rasmussen, K.; Peñuelas, J.; Tian, F.; Schurgers, G.; Verger, A.; Mertz, O.; Palmer, J.R.B.; Fensholt, R. Human population growth offsets climate-driven increase in woody vegetation in sub-Saharan Africa. Nat. Ecol. Evol. 2017, 1, 81. [Google Scholar] [CrossRef] [PubMed]
- Jiang, G.; Chen, Z.; Siripornpibul, C.; Haryono, E.; Nguyen, N.X.; Oo, T.; Manzano, L.S.J.; Vongphachanh, S.; Kong, S.; Guo, F. The karst water environment in Southeast Asia: Characteristics, challenges, and approaches. Hydrogeol. J. 2020, 29, 123–135. [Google Scholar] [CrossRef]
- Li, X.-Q.; Xiang, X.-G.; Jabbour, F.; Hagen, O.; Ortiz, R.d.C.; Soltis, P.S.; Soltis, D.E.; Wang, W. Biotic colonization of subtropical East Asian caves through time. Proc. Natl. Acad. Sci. USA 2022, 119, e2207199119. [Google Scholar] [CrossRef] [PubMed]
- Jiang, Z.; Liu, H.; Wang, H.; Peng, J.; Meersmans, J.; Green, S.M.; Quine, T.A.; Wu, X.; Song, Z. Bedrock geochemistry influences vegetation growth by regulating the regolith water holding capacity. Nat. Commun. 2020, 11, 2392. [Google Scholar] [CrossRef] [PubMed]
- Li, J.; Yuan, D.; Liu, J.; Ma, M.; Li, Y. Evaluating the effects of water exchange between surface rivers and karst aquifers on surface flood simulations at different watershed scales. J. Hydrol. 2023, 623, 129851. [Google Scholar] [CrossRef]
- Jiang, C.; Gao, X.; Hou, B.; Zhang, S.; Zhang, J.; Li, C.; Wang, W. Occurrence and environmental impact of coal mine goaf water in karst areas in China. J. Clean. Prod. 2020, 275, 123813. [Google Scholar] [CrossRef]
- Li, Z.; Xu, X.; Yu, B.; Xu, C.; Liu, M.; Wang, K. Quantifying the impacts of climate and human activities on water and sediment discharge in a karst region of southwest China. J. Hydrol. 2016, 542, 836–849. [Google Scholar] [CrossRef]
- Piao, S.; Wang, X.; Park, T.; Chen, C.; Lian, X.; He, Y.; Bjerke, J.W.; Chen, A.; Ciais, P.; Tømmervik, H.; et al. Characteristics, drivers and feedbacks of global greening. Nat. Rev. Earth Environ. 2019, 1, 14–27. [Google Scholar] [CrossRef]
- Chen, C.; Park, T.; Wang, X.; Piao, S.; Xu, B.; Chaturvedi, R.K.; Fuchs, R.; Brovkin, V.; Ciais, P.; Fensholt, R.; et al. China and India lead in greening of the world through land-use management. Nat. Sustain. 2019, 2, 122–129. [Google Scholar] [CrossRef]
- Zeng, Z.; Estes, L.; Ziegler, A.D.; Chen, A.; Searchinger, T.; Hua, F.; Guan, K.; Jintrawet, A.; Wood, E.F. Highland cropland expansion and forest loss in Southeast Asia in the twenty-first century. Nat. Geosci. 2018, 11, 556–562. [Google Scholar] [CrossRef]
- Brandt, M.; Yue, Y.; Wigneron, J.P.; Tong, X.; Tian, F.; Jepsen, M.R.; Xiao, X.; Verger, A.; Mialon, A.; Al-Yaari, A.; et al. Satellite-Observed Major Greening and Biomass Increase in South China Karst During Recent Decade. Earth Future 2018, 6, 1017–1028. [Google Scholar] [CrossRef]
- Zhou, L.; Wang, X.; Wang, Z.; Zhang, X.; Chen, C.; Liu, H. The challenge of soil loss control and vegetation restoration in the karst area of southwestern China. Int. Soil Water Conserv. Res. 2020, 8, 26–34. [Google Scholar] [CrossRef]
- Peng, J.; Jiang, H.; Liu, Q.; Green, S.M.; Quine, T.A.; Liu, H.; Qiu, S.; Liu, Y.; Meersmans, J. Human activity vs. climate change: Distinguishing dominant drivers on LAI dynamics in karst region of southwest China. Sci. Total Environ. 2021, 769, 144297. [Google Scholar] [CrossRef] [PubMed]
- Piao, S.; Nan, H.; Huntingford, C.; Ciais, P.; Friedlingstein, P.; Sitch, S.; Peng, S.; Ahlström, A.; Canadell, J.G.; Cong, N.; et al. Evidence for a weakening relationship between interannual temperature variability and northern vegetation activity. Nat. Commun. 2014, 5, 5018. [Google Scholar] [CrossRef] [PubMed]
- Gonsamo, A.; Chen, J.M.; Ooi, Y.W. Peak season plant activity shift towards spring is reflected by increasing carbon uptake by extratropical ecosystems. Glob. Chang. Biol. 2017, 24, 2117–2128. [Google Scholar] [CrossRef] [PubMed]
- Hashimoto, H.; Wang, W.; Dungan, J.L.; Li, S.; Michaelis, A.R.; Takenaka, H.; Higuchi, A.; Myneni, R.B.; Nemani, R.R. New generation geostationary satellite observations support seasonality in greenness of the Amazon evergreen forests. Nat. Commun. 2021, 12, 684. [Google Scholar] [CrossRef] [PubMed]
- Huang, S.; Tang, L.; Hupy, J.P.; Wang, Y.; Shao, G. A commentary review on the use of normalized difference vegetation index (NDVI) in the era of popular remote sensing. J. For. Res. 2020, 32, 1–6. [Google Scholar] [CrossRef]
- Ganguly, S.; Friedl, M.A.; Tan, B.; Zhang, X.; Verma, M. Land surface phenology from MODIS: Characterization of the Collection 5 global land cover dynamics product. Remote Sens. Environ. 2010, 114, 1805–1816. [Google Scholar] [CrossRef]
- Petus, C.; Lewis, M.; White, D. Monitoring temporal dynamics of Great Artesian Basin wetland vegetation, Australia, using MODIS NDVI. Ecol. Indic. 2013, 34, 41–52. [Google Scholar] [CrossRef]
- Zhang, M.; Wang, J.; Li, S. Tempo-spatial changes and main anthropogenic influence factors of vegetation fractional coverage in a large-scale opencast coal mine area from 1992 to 2015. J. Clean. Prod. 2019, 232, 940–952. [Google Scholar] [CrossRef]
- Zhang, Y.; Zhang, L.; Wang, J.; Dong, G.; Wei, Y. Quantitative analysis of NDVI driving factors based on the geographical detector model in the Chengdu-Chongqing region, China. Ecol. Indic. 2023, 155, 110978. [Google Scholar] [CrossRef]
- Zhang, Y.; Ye, A. Quantitatively distinguishing the impact of climate change and human activities on vegetation in mainland China with the improved residual method. GISci. Remote Sens. 2021, 58, 235–260. [Google Scholar] [CrossRef]
- Sun, W.; Wang, Y.; Fu, Y.H.; Xue, B.; Wang, G.; Yu, J.; Zuo, D.; Xu, Z. Spatial heterogeneity of changes in vegetation growth and their driving forces based on satellite observations of the Yarlung Zangbo River Basin in the Tibetan Plateau. J. Hydrol. 2019, 574, 324–332. [Google Scholar] [CrossRef]
- Lamchin, M.; Lee, W.-K.; Jeon, S.W.; Wang, S.W.; Lim, C.H.; Song, C.; Sung, M. Long-term trend and correlation between vegetation greenness and climate variables in Asia based on satellite data. Sci. Total Environ. 2018, 618, 1089–1095. [Google Scholar] [CrossRef] [PubMed]
- Lasaponara, R. On the use of principal component analysis (PCA) for evaluating interannual vegetation anomalies from SPOT/VEGETATION NDVI temporal series. Ecol. Model. 2006, 194, 429–434. [Google Scholar] [CrossRef]
- Tang, X.; Bi, R.; Wang, Z. Spatial analysis of moving-vehicle crashes and fixed-object crashes based on multi-scale geographically weighted regression. Accid. Anal. Prev. 2023, 189, 107123. [Google Scholar] [CrossRef] [PubMed]
- Meng, X.; Gao, X.; Li, S.; Lei, J. Spatial and Temporal Characteristics of Vegetation NDVI Changes and the Driving Forces in Mongolia during 1982–2015. Remote Sens. 2020, 12, 603. [Google Scholar] [CrossRef]
- Wang, J.F.; Li, X.H.; Christakos, G.; Liao, Y.L.; Zhang, T.; Gu, X.; Zheng, X.Y. Geographical Detectors-Based Health Risk Assessment and its Application in the Neural Tube Defects Study of the Heshun Region, China. Int. J. Geogr. Inf. Sci. 2010, 24, 107–127. [Google Scholar] [CrossRef]
- He, Q.; Yan, M.; Zheng, L.; Wang, B. Spatial stratified heterogeneity and driving mechanism of urban development level in China under different urban growth patterns with optimal parameter-based geographic detector model mining. Comput. Environ. Urban Syst. 2023, 105, 102023. [Google Scholar] [CrossRef]
- Feng, Y.; Ziegler, A.D.; Elsen, P.R.; Liu, Y.; He, X.; Spracklen, D.V.; Holden, J.; Jiang, X.; Zheng, C.; Zeng, Z. Upward expansion and acceleration of forest clearance in the mountains of Southeast Asia. Nat. Sustain. 2021, 4, 892–899. [Google Scholar] [CrossRef]
- Yang, L.; Shen, F.; Zhang, L.; Cai, Y.; Yi, F.; Zhou, C. Quantifying influences of natural and anthropogenic factors on vegetation changes using structural equation modeling: A case study in Jiangsu Province, China. J. Clean. Prod. 2021, 280, 124330. [Google Scholar] [CrossRef]
- Holben, B.N. Characteristics of maximum-value composite images from temporal AVHRR data. Int. J. Remote Sens. 2007, 7, 1417–1434. [Google Scholar] [CrossRef]
- Abatzoglou, J.T.; Dobrowski, S.Z.; Parks, S.A.; Hegewisch, K.C. TerraClimate, a high-resolution global dataset of monthly climate and climatic water balance from 1958–2015. Sci. Data 2018, 5, 170191. [Google Scholar] [CrossRef]
- Zomer, R.J.; Xu, J.; Trabucco, A. Version 3 of the Global Aridity Index and Potential Evapotranspiration Database. Sci. Data 2022, 9, 409. [Google Scholar] [CrossRef] [PubMed]
- Chen, Z.; Yu, B.; Yang, C.; Zhou, Y.; Yao, S.; Qian, X.; Wang, C.; Wu, B.; Wu, J. An extended time series (2000–2018) of global NPP-VIIRS-like nighttime light data from a cross-sensor calibration. Earth Syst. Sci. Data 2021, 13, 889–906. [Google Scholar] [CrossRef]
- Chen, J.; Gao, M.; Cheng, S.; Hou, W.; Song, M.; Liu, X.; Liu, Y. Global 1 km × 1 km gridded revised real gross domestic product and electricity consumption during 1992–2019 based on calibrated nighttime light data. Sci. Data 2022, 9, 202. [Google Scholar] [CrossRef] [PubMed]
- Gong, P.; Li, X.; Wang, J.; Bai, Y.; Chen, B.; Hu, T.; Liu, X.; Xu, B.; Yang, J.; Zhang, W.; et al. Annual maps of global artificial impervious area (GAIA) between 1985 and 2018. Remote Sens. Environ. 2020, 236, 111510. [Google Scholar] [CrossRef]
- Mu, H.; Li, X.; Wen, Y.; Huang, J.; Du, P.; Su, W.; Miao, S.; Geng, M. A global record of annual terrestrial Human Footprint dataset from 2000 to 2018. Sci. Data 2022, 9, 176. [Google Scholar] [CrossRef]
- Potapov, P.; Turubanova, S.; Hansen, M.C.; Tyukavina, A.; Zalles, V.; Khan, A.; Song, X.-P.; Pickens, A.; Shen, Q.; Cortez, J. Global maps of cropland extent and change show accelerated cropland expansion in the twenty-first century. Nat. Food 2021, 3, 19–28. [Google Scholar] [CrossRef]
- Han, J.; Zhang, Z.; Luo, Y.; Cao, J.; Zhang, L.; Zhuang, H.; Cheng, F.; Zhang, J.; Tao, F. Annual paddy rice planting area and cropping intensity datasets and their dynamics in the Asian monsoon region from 2000 to 2020. Agric. Syst. 2022, 200, 103437. [Google Scholar] [CrossRef]
- Guo, L.; Luo, M.; Zhangyang, C.; Zeng, C.; Wang, S.; Zhang, H. Spatial modelling of soil organic carbon stocks with combined principal component analysis and geographically weighted regression. J. Agric. Sci. 2018, 156, 774–784. [Google Scholar] [CrossRef]
- Jiang, W.; Yuan, L.; Wang, W.; Cao, R.; Zhang, Y.; Shen, W. Spatio-temporal analysis of vegetation variation in the Yellow River Basin. Ecol. Indic. 2015, 51, 117–126. [Google Scholar] [CrossRef]
- Liang, D.; Cowles, M.K.; Linderman, M. Bayesian MODIS NDVI back-prediction by intersensor calibration with AVHRR. Remote Sens. Environ. 2016, 186, 393–404. [Google Scholar] [CrossRef]
- Luo, M.; Sa, C.; Meng, F.; Duan, Y.; Liu, T.; Bao, Y. Assessing extreme climatic changes on a monthly scale and their implications for vegetation in Central Asia. J. Clean. Prod. 2020, 271, 122396. [Google Scholar] [CrossRef]
- Zhu, L.; Meng, J.; Zhu, L. Applying Geodetector to disentangle the contributions of natural and anthropogenic factors to NDVI variations in the middle reaches of the Heihe River Basin. Ecol. Indic. 2020, 117, 106545. [Google Scholar] [CrossRef]
- Jin, H.; Chen, X.; Wang, Y.; Zhong, R.; Zhao, T.; Liu, Z.; Tu, X. Spatio-temporal distribution of NDVI and its influencing factors in China. J. Hydrol. 2021, 603, 127129. [Google Scholar] [CrossRef]
- Mahmoudi, M.R.; Heydari, M.H.; Qasem, S.N.; Mosavi, A.; Band, S.S. Principal component analysis to study the relations between the spread rates of COVID-19 in high risks countries. Alex. Eng. J. 2021, 60, 457–464. [Google Scholar] [CrossRef]
- Forootan, E.; Kusche, J.; Talpe, M.; Shum, C.K.; Schmidt, M. Developing a Complex Independent Component Analysis (CICA) Technique to Extract Non-stationary Patterns from Geophysical Time Series. Surv. Geophys. 2017, 39, 435–465. [Google Scholar] [CrossRef]
- Zhang, W.; Xi, M.; Liu, H.; Zheng, H. Low sensitivity of net primary productivity to climatic factors in three karst provinces in southwest China from 1981 to 2019. Ecol. Indic. 2023, 153, 110465. [Google Scholar] [CrossRef]
- Song, Y.; Wang, J.; Ge, Y.; Xu, C. An optimal parameters-based geographical detector model enhances geographic characteristics of explanatory variables for spatial heterogeneity analysis: Cases with different types of spatial data. GISci. Remote Sens. 2020, 57, 593–610. [Google Scholar] [CrossRef]
- Wang, J.-F.; Zhang, T.-L.; Fu, B.-J. A measure of spatial stratified heterogeneity. Ecol. Indic. 2016, 67, 250–256. [Google Scholar] [CrossRef]
- Zhao, J.; Zhao, Y. Synergy/trade-offs and differential optimization of production, living, and ecological functions in the Yangtze River economic Belt, China. Ecol. Indic. 2023, 147, 109925. [Google Scholar] [CrossRef]
- Peng, J.; Liu, Y.; Liu, Z.; Yang, Y. Mapping spatial non-stationarity of human-natural factors associated with agricultural landscape multifunctionality in Beijing–Tianjin–Hebei region, China. Agric. Ecosyst. Environ. 2017, 246, 221–233. [Google Scholar] [CrossRef]
- Li, M.; Cao, S.; Zhu, Z.; Wang, Z.; Myneni, R.B.; Piao, S. Spatiotemporally consistent global dataset of the GIMMS Normalized Difference Vegetation Index (PKU GIMMS NDVI) from 1982 to 2022. Earth Syst. Sci. Data 2023, 15, 4181–4203. [Google Scholar] [CrossRef]
- Pan, N.; Feng, X.; Fu, B.; Wang, S.; Ji, F.; Pan, S. Increasing global vegetation browning hidden in overall vegetation greening: Insights from time-varying trends. Remote Sens. Environ. 2018, 214, 59–72. [Google Scholar] [CrossRef]
- Ouyang, Z.; Zheng, H.; Xiao, Y.; Polasky, S.; Liu, J.; Xu, W.; Wang, Q.; Zhang, L.; Xiao, Y.; Rao, E.; et al. Improvements in ecosystem services from investments in natural capital. Science 2016, 352, 1455–1459. [Google Scholar] [CrossRef] [PubMed]
- Tong, X.; Brandt, M.; Yue, Y.; Horion, S.; Wang, K.; Keersmaecker, W.D.; Tian, F.; Schurgers, G.; Xiao, X.; Luo, Y.; et al. Increased vegetation growth and carbon stock in China karst via ecological engineering. Nat. Sustain. 2018, 1, 44–50. [Google Scholar] [CrossRef]
- Zhang, X.; Yue, Y.; Tong, X.; Wang, K.; Qi, X.; Deng, C.; Brandt, M. Eco-engineering controls vegetation trends in southwest China karst. Sci. Total Environ. 2021, 770, 145160. [Google Scholar] [CrossRef]
- Cai, Y.; Zhang, F.; Duan, P.; Yung Jim, C.; Weng Chan, N.; Shi, J.; Liu, C.; Wang, J.; Bahtebay, J.; Ma, X. Vegetation cover changes in China induced by ecological restoration-protection projects and land-use changes from 2000 to 2020. Catena 2022, 217, 106530. [Google Scholar] [CrossRef]
- Fan, F.; Xiao, C.; Feng, Z.; Yang, Y. Impact of human and climate factors on vegetation changes in mainland southeast asia and yunnan province of China. J. Clean. Prod. 2023, 415, 137690. [Google Scholar] [CrossRef]
- Erb, K.-H.; Kastner, T.; Plutzar, C.; Bais, A.L.S.; Carvalhais, N.; Fetzel, T.; Gingrich, S.; Haberl, H.; Lauk, C.; Niedertscheider, M.; et al. Unexpectedly large impact of forest management and grazing on global vegetation biomass. Nature 2017, 553, 73–76. [Google Scholar] [CrossRef]
- Hao, J.; Xu, G.; Luo, L.; Zhang, Z.; Yang, H.; Li, H. Quantifying the relative contribution of natural and human factors to vegetation coverage variation in coastal wetlands in China. Catena 2020, 188, 104429. [Google Scholar] [CrossRef]
- Huo, H.; Sun, C. Spatiotemporal variation and influencing factors of vegetation dynamics based on Geodetector: A case study of the northwestern Yunnan Plateau, China. Ecol. Indic. 2021, 130, 108005. [Google Scholar] [CrossRef]
- Zhang, Y.; Zhu, Z.; Liu, Z.; Zeng, Z.; Ciais, P.; Huang, M.; Liu, Y.; Piao, S. Seasonal and interannual changes in vegetation activity of tropical forests in Southeast Asia. Agric. For. Meteorol. 2016, 224, 1–10. [Google Scholar] [CrossRef]
- Zhu, X.; Liu, H.; He, W.; Wu, L.; Liu, F. Regolith water storage patterns determine vegetation productivity in global karst regions. Geoderma 2023, 430, 116292. [Google Scholar] [CrossRef]
- Li, P.; Feng, Z.; Xiao, C.; Boudmyxay, K.; Liu, Y. Detecting and mapping annual newly-burned plots (NBP) of swiddening using historical Landsat data in Montane Mainland Southeast Asia (MMSEA) during 1988–2016. J. Geogr. Sci. 2018, 28, 1307–1328. [Google Scholar] [CrossRef]
- Seglah, P.A.; Wang, Y.; Wang, H.; Bi, Y.; Zhou, K.; Wang, Y.; Wang, H.; Feng, X. Crop straw utilization and field burning in Northern region of Ghana. J. Clean. Prod. 2020, 261, 121191. [Google Scholar] [CrossRef]
- Fang, J.; Guo, Z.; Hu, H.; Kato, T.; Muraoka, H.; Son, Y. Forest biomass carbon sinks in East Asia, with special reference to the relative contributions of forest expansion and forest growth. Glob. Chang. Biol. 2014, 20, 2019–2030. [Google Scholar] [CrossRef] [PubMed]
- Hua, F.; Wang, X.; Zheng, X.; Fisher, B.; Wang, L.; Zhu, J.; Tang, Y.; Yu, D.W.; Wilcove, D.S. Opportunities for biodiversity gains under the world’s largest reforestation programme. Nat. Commun. 2016, 7, 12717. [Google Scholar] [CrossRef]
- Hansen, M.C.; Potapov, P.V.; Moore, R.; Hancher, M.; Turubanova, S.A.; Tyukavina, A.; Thau, D.; Stehman, S.V.; Goetz, S.J.; Loveland, T.R.; et al. High-Resolution Global Maps of 21st-Century Forest Cover Change. Science 2013, 342, 850–853. [Google Scholar] [CrossRef]
- Gandhi, S.; Jones, T. Identifying Mangrove Deforestation Hotspots in South Asia, Southeast Asia and Asia-Pacific. Remote Sens. 2019, 11, 728. [Google Scholar] [CrossRef]
- Liu, Y.Y.; van Dijk, A.I.J.M.; de Jeu, R.A.M.; Canadell, J.G.; McCabe, M.F.; Evans, J.P.; Wang, G. Recent reversal in loss of global terrestrial biomass. Nat. Clim. Chang. 2015, 5, 470–474. [Google Scholar] [CrossRef]
- Fox, J.; Castella, J.-C.; Ziegler, A.D. Swidden, rubber and carbon: Can REDD+ work for people and the environment in Montane Mainland Southeast Asia? Glob. Environ. Chang. Human Policy Dimens. 2014, 29, 318–326. [Google Scholar] [CrossRef]
- Chiarelli, D.D.; Passera, C.; Rulli, M.C.; Rosa, L.; Ciraolo, G.; D’Odorico, P. Hydrological consequences of natural rubber plantations in Southeast Asia. Land Degrad. Dev. 2020, 31, 2060–2073. [Google Scholar] [CrossRef]
- Gao, S.; Zhong, R.; Yan, K.; Ma, X.; Chen, X.; Pu, J.; Gao, S.; Qi, J.; Yin, G.; Myneni, R.B. Evaluating the saturation effect of vegetation indices in forests using 3D radiative transfer simulations and satellite observations. Remote Sens. Environ. 2023, 295, 113665. [Google Scholar] [CrossRef]
- Camps-Valls, G.; Campos-Taberner, M.; Moreno-Martínez, Á.; Walther, S.; Duveiller, G.; Cescatti, A.; Mahecha, M.D.; Muñoz-Marí, J.; García-Haro, F.J.; Guanter, L.; et al. A unified vegetation index for quantifying the terrestrial biosphere. Sci. Adv. 2021, 7, eabc7447. [Google Scholar] [CrossRef] [PubMed]
- Ding, Y.; Li, Z.; Peng, S. Global analysis of time-lag and -accumulation effects of climate on vegetation growth. Int. J. Appl. Earth Obs. Geoinf. 2020, 92, 102179. [Google Scholar] [CrossRef]
- Wen, Y.; Liu, X.; Pei, F.; Li, X.; Du, G. Non-uniform time-lag effects of terrestrial vegetation responses to asymmetric warming. Agric. For. Meteorol. 2018, 252, 130–143. [Google Scholar] [CrossRef]
Disclaimer/Publisher’s Note: The statements, opinions and data contained in all publications are solely those of the individual author(s) and contributor(s) and not of MDPI and/or the editor(s). MDPI and/or the editor(s) disclaim responsibility for any injury to people or property resulting from any ideas, methods, instructions or products referred to in the content. |
© 2024 by the authors. Licensee MDPI, Basel, Switzerland. This article is an open access article distributed under the terms and conditions of the Creative Commons Attribution (CC BY) license (https://creativecommons.org/licenses/by/4.0/).