Abstract
Protected areas have a key role in preserving biodiversity at different scales, as well as in providing ecosystem services to rural communities. Natura 2000 is the primary conservation network at the EU level, with the aim of protecting the most valuable species and habitats; it covers around 18.6% of the EU’s land area. The aim of this study is to assess the evolution of forest cover in EU Natura 2000 sites in the period 2012–2018 through GIS-based spatial analyses of the High-Resolution Layers produced in the framework of the Copernicus initiative. In 2018, fifteen EU countries had more than 50% of their surface covered by forests, with the top three countries being Slovenia (71.9%), the Czech Republic (70.5%), and Slovakia (69.3%). In 2012–2018, the net forest cover increase in EU Natura 2000 areas was equal to 105,750 ha/year (+1.7%). France, Bulgaria, and Germany recorded the greater net forest cover increase: 303,000 ha, 267,000 ha, and 150,000, respectively. France also recorded the highest yearly rate of forest gain (+51,491 ha/year). Most of the forest gain in EU Natura 2000 areas was found to be located between 0 and 200 m a.s.l. The study demonstrated that forest cover in EU Natura 2000 areas is increasing, with a consequent reduction of open spaces, homogenization of rural landscapes, and loss of landscape-scale biodiversity. The management and design of EU protected areas should consider the importance of preserving biodiversity-friendly land uses and practices, instead of promoting a diffuse “rewilding” with negative consequences for the landscape complexity and heterogeneity, as well as for biodiversity.
1. Introduction
Protected areas (PAs) all over the world have a key role in preserving wild flora and fauna species, together with a wide variety of habitats and microhabitats, as well as in providing different ecosystem services to rural communities [1,2]. However, human pressure on PAs increased in the last two decades, especially in some areas of the world, suggesting that the effectiveness of PAs is not globally homogeneous [3,4].
There is a conflicting relationship between PAs and agro-silvo-pastoral activities; while some studies highlighted the positive role of traditional human activities in preserving different habitats and the related biodiversity, or even in counteracting illegal deforestation, other studies focused on the conflicts and competition between farmers and wildlife [5,6,7,8,9,10,11]. In general, traditional and sustainable agro-silvo-pastoral activities are considered to have positive effects on agrobiodiversity and the preservation of different habitats and microhabitats, and the involvement of local communities in conservation activities has been demonstrated to be a key feature already since the 1980s [12,13]. In addition, according to the IUCN (International Union for Conservation of Nature), the aims of PAs should include the “long-term conservation of nature with associated ecosystem services and cultural values” [14]. Therefore, it is important to recognize the presence and role of the cultural dimension within PAs.
At the European level, the primary European Union (EU) conservation network is represented by the Natura 2000 network, whose aim is to ensure the protection of Europe’s most valuable and threatened species and habitats, listed under both the Birds Directive (Special Protection Areas—SPAs) and the Habitats Directive (Sites of Community Importance—SCIs, Special Areas of Conservation—SACs). As of February 2023, the Natura 2000 network is spread across all 27 EU countries, both on land and at sea, covering around 18.6% of the EU’s land area and more than 8% of its marine territory, representing the largest network of protected areas in the world.
Most EU rural areas, especially in Central and Southern Europe, have always been shaped and regularly managed since ancient times. For example, during the Roman times, forests played a crucial role in providing a wide range of products and services to local communities, but also in the following centuries, they were largely managed according to specific regulations issued by the states and kingdoms that have succeeded one another. Moreover, according to the Florence Declaration on the Links Between Biological and Cultural Diversity signed in 2014, the EU rural landscape “is predominantly a biocultural multifunctional landscape”, and “the current state of biological and cultural diversity in Europe results from the combination of historical and on-going environmental and land use processes and cultural heritage” [15]. In most EU countries, forests have been managed for centuries by applying different techniques to obtain different products and services, selecting and spreading different forest species that affect the species composition and the vertical and horizontal structures or the soil characteristics, contributing to the creation of different forest habitats [16]; socioeconomic changes that occurred in the last century deeply affected EU forest in terms of surface, species composition. and structure. According to the Food and Agriculture Organization (FAO) of the United Nations, forests increased their surface in Europe in the period 1990–2020, passing from 994.32 to 1017.46 million hectares [17], at an average rate of 771,367 ha/year. This trend started long before the 1990s, as forest surfaces started to increase at the European level, at least from the 1960s [18]. The main cause of the increase in forest cover is not to be found in forest policies or direct afforestation but is related to secondary successions on areas previously occupied by other land uses, primarily pastures and agricultural surfaces. Different studies at national, regional or local levels have, in fact, highlighted that the increase of forest cover is linked to the abandonment of cultivated areas and pastures, as a consequence of the depopulation of rural areas affecting European countries during the 20th century, and in particular after WWII [19,20,21,22,23,24]. This trend started in marginal areas, but during the last 60 years also occurred in most of the European rural spaces, with the only exception being plains that turned out to be the most suitable for agricultural intensification [25]. This tendency fits perfectly with the Forest Transition Theory [26], which places most European states in the fourth phase, the one where the net forested area rises again after previous phases of decline [27]. Forest-surface expansion through secondary successions has led to a homogenization of European rural areas that were traditionally made of diverse cultural landscape mosaics with high complexity and diversity and a multiplicity of habitats, causing negative effects on biodiversity at the species and landscape scales [28,29]. In addition, spontaneous forest regrowth is generally perceived as a worsening of the local aesthetic dimension, especially by local inhabitants and farmers, while the population living in the cities tend to perceive it as an increase of “wilderness” and of “nature” [30,31,32,33]. Furthermore, forests grown on abandoned pastures and agricultural areas are often of lower economic value [34,35]; therefore, they are left unmanaged, making them more subject to natural hazards, especially in Mediterranean areas where biomass accumulation significantly increases the risk of forest fires [36,37,38,39].
Forest expansion in Europe also occurred inside PAs in different countries and socioeconomic situations. Within PAs, landscape homogenization due to forest-surface expansion could represent a major risk for the conservation of a variety of habitats and, in particular, of ecotone areas. These areas are, in fact, well recognized for their key roles as crucial nesting places, refuges, or food-source areas for a wide variety of fauna and micro-fauna species, as well as habitats for different flora species [40,41,42].
Traditionally, forest conservation has been considered as opposed to the issues of cultural heritage. But, in recent years, the importance of traditional management in the maintenance of biodiversity has been recognized, even for forests included in areas devoted to nature protection [43,44,45], but a complete study on forest cover changes included in the largest EU network of PAs is still lacking.
The main aim of the present study is to contribute to filling the knowledge gap related to reliable and comparable data at the EU and country level on forest-cover changes within EU Natura 2000 areas and on the relations between forest-cover changes and elevation. The results of the study will provide reliable and updated spatial data at the European level regarding forest-cover changes in Natura 2000 areas, including the identification of the elevation classes more and less affected by forest-cover change, and also to properly address the future management of Natura 2000 sites.
2. Materials and Methods
2.1. Materials
Different sources have been used to assess the transformations of forest cover in EU Natura 2000 sites.
Forest-cover maps have been downloaded from the Copernicus Land Monitoring Service website. The datasets used are part of the High-Resolution Layers project (https://land.copernicus.eu/pan-european/high-resolution-layers accessed on 20 December 2023) [46]. These Pan-European High-Resolution Layers (HRL) provide information on specific land-cover characteristics and are produced from satellite imagery through a combination of automatic processing and interactive rule-based classification. These datasets cover all the 39 countries belonging to the European Economic Area (EEA). Different datasets for three different years (2012, 2015, and 2018) are available for the “Forest” family:
- Tree-cover density (TCD): tree-cover density in a range from 0%–100%;
- Dominant leaf type (DLT): presence of all kinds of tall trees, including the ones under agricultural land use (orchards, trees in urban areas, …), differentiating between broadleaved or coniferous;
- Forest type (FTY): it is based on the FAO forest definition [47]; therefore, it excludes trees in cultivated areas (olive groves, fruit orchards, …) and urban areas, differentiating between broadleaved or coniferous. Some of the forest surfaces have been categorized as “unclassifiable”, as it was not possible to assign a forest type due to no satellite image availability or the presence of clouds, shadows, or snow.
The present study is based on the forest type (FTY) dataset, as it is the one that is closer to the FAO official forest definition and excludes trees located in cultivated and urban areas.
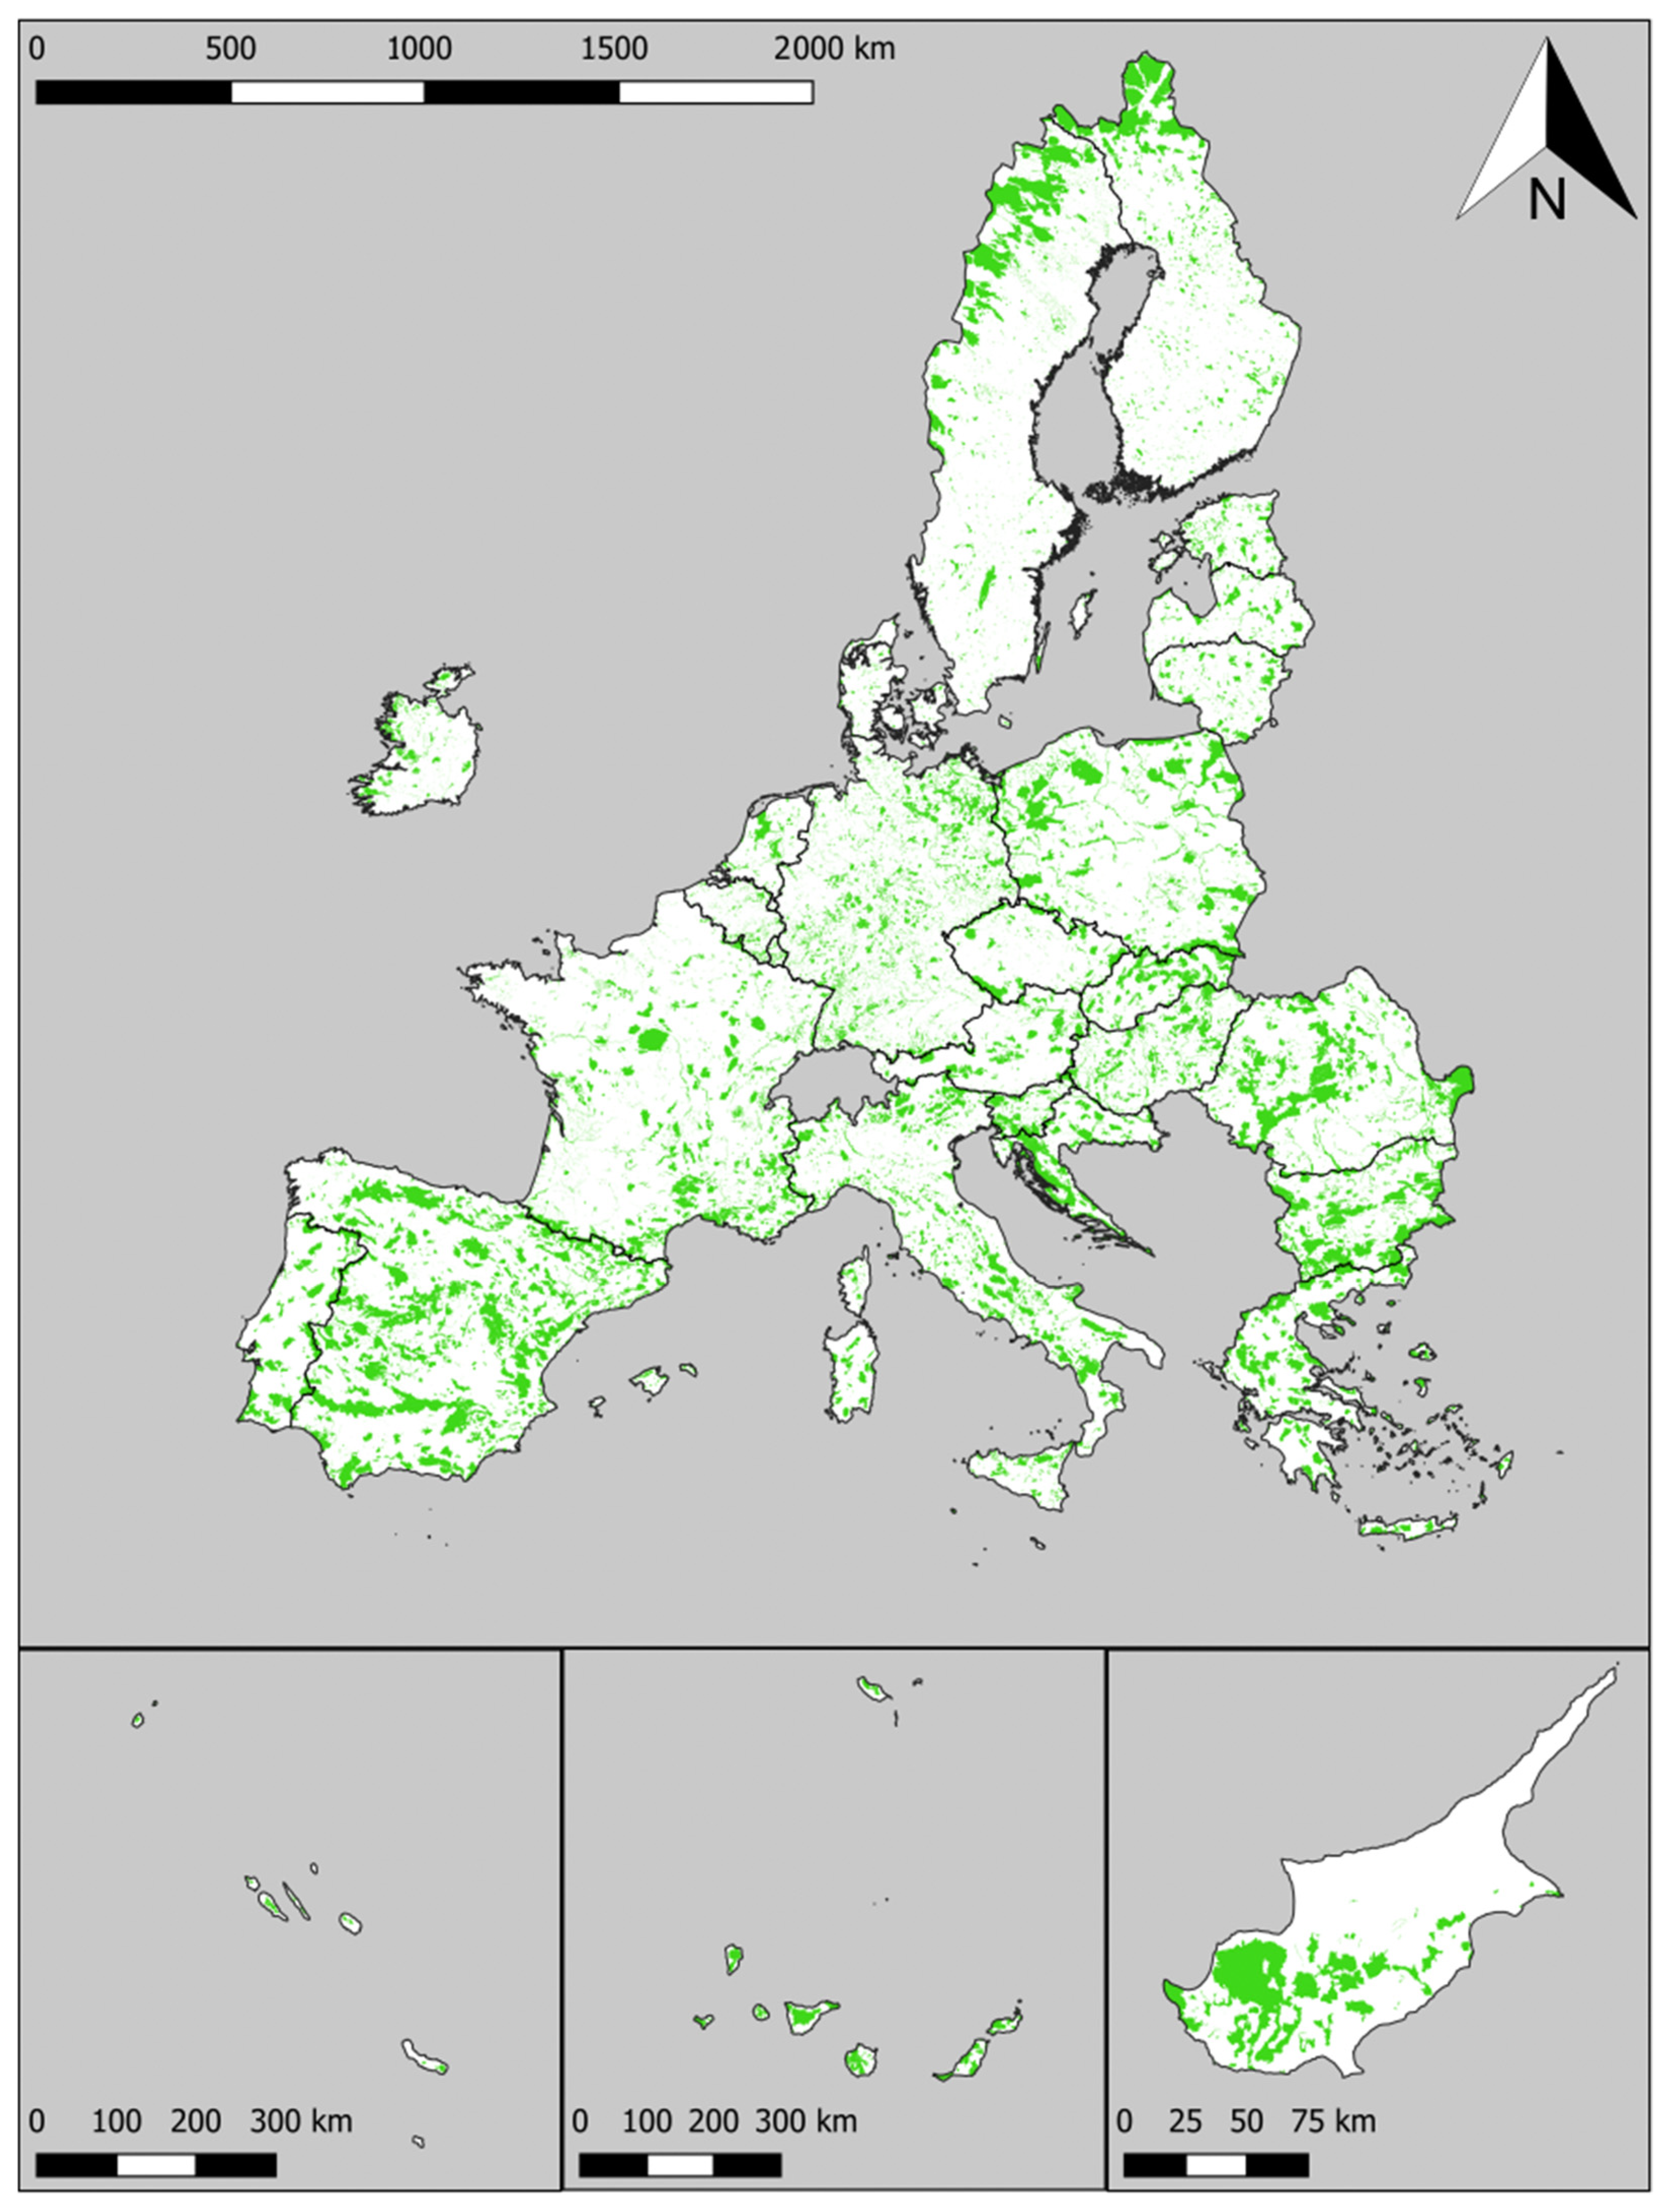
The official boundaries of the Natura 2000 sites have been downloaded from the European Environment Agency website [48] and have been produced according to the data submitted by each EU member state. The database used in this study is the one available and downloaded in February 2023 which corresponds to the version updated in October 2022 (Figure 1).
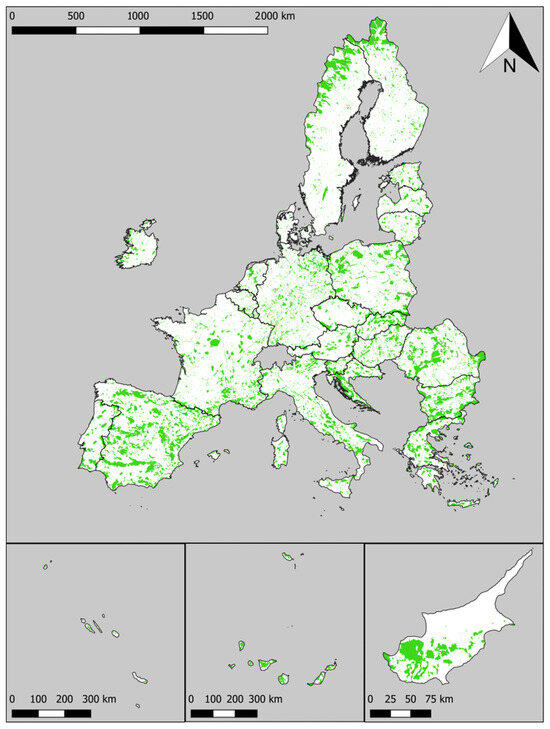
Figure 1.
Map of the terrestrial Natura 2000 sites (in green) in the different EU countries (box at lower left: Azores; box at lower middle: Canary and Madeira; box at lower right: Cyprus).
The official terrestrial boundaries of the EU countries have been downloaded from the Eurostat website (https://ec.europa.eu/eurostat/web/gisco/geodata/reference-data/administrative-units-statistical-units/countries accessed on 20 December 2023).
Both the datasets of Corine Land Cover 2012 and 2018 have been downloaded from the Copernicus websites (https://land.copernicus.eu/pan-european/corine-land-cover/ accessed on 20 December 2023) [49].
Finally, the Continental Europe Digital Terrain Model (DTM), at 30 m resolution elaborated by Hengl et al. [50], has been used to perform the spatial elaborations according to the altimetry.
2.2. Methodology
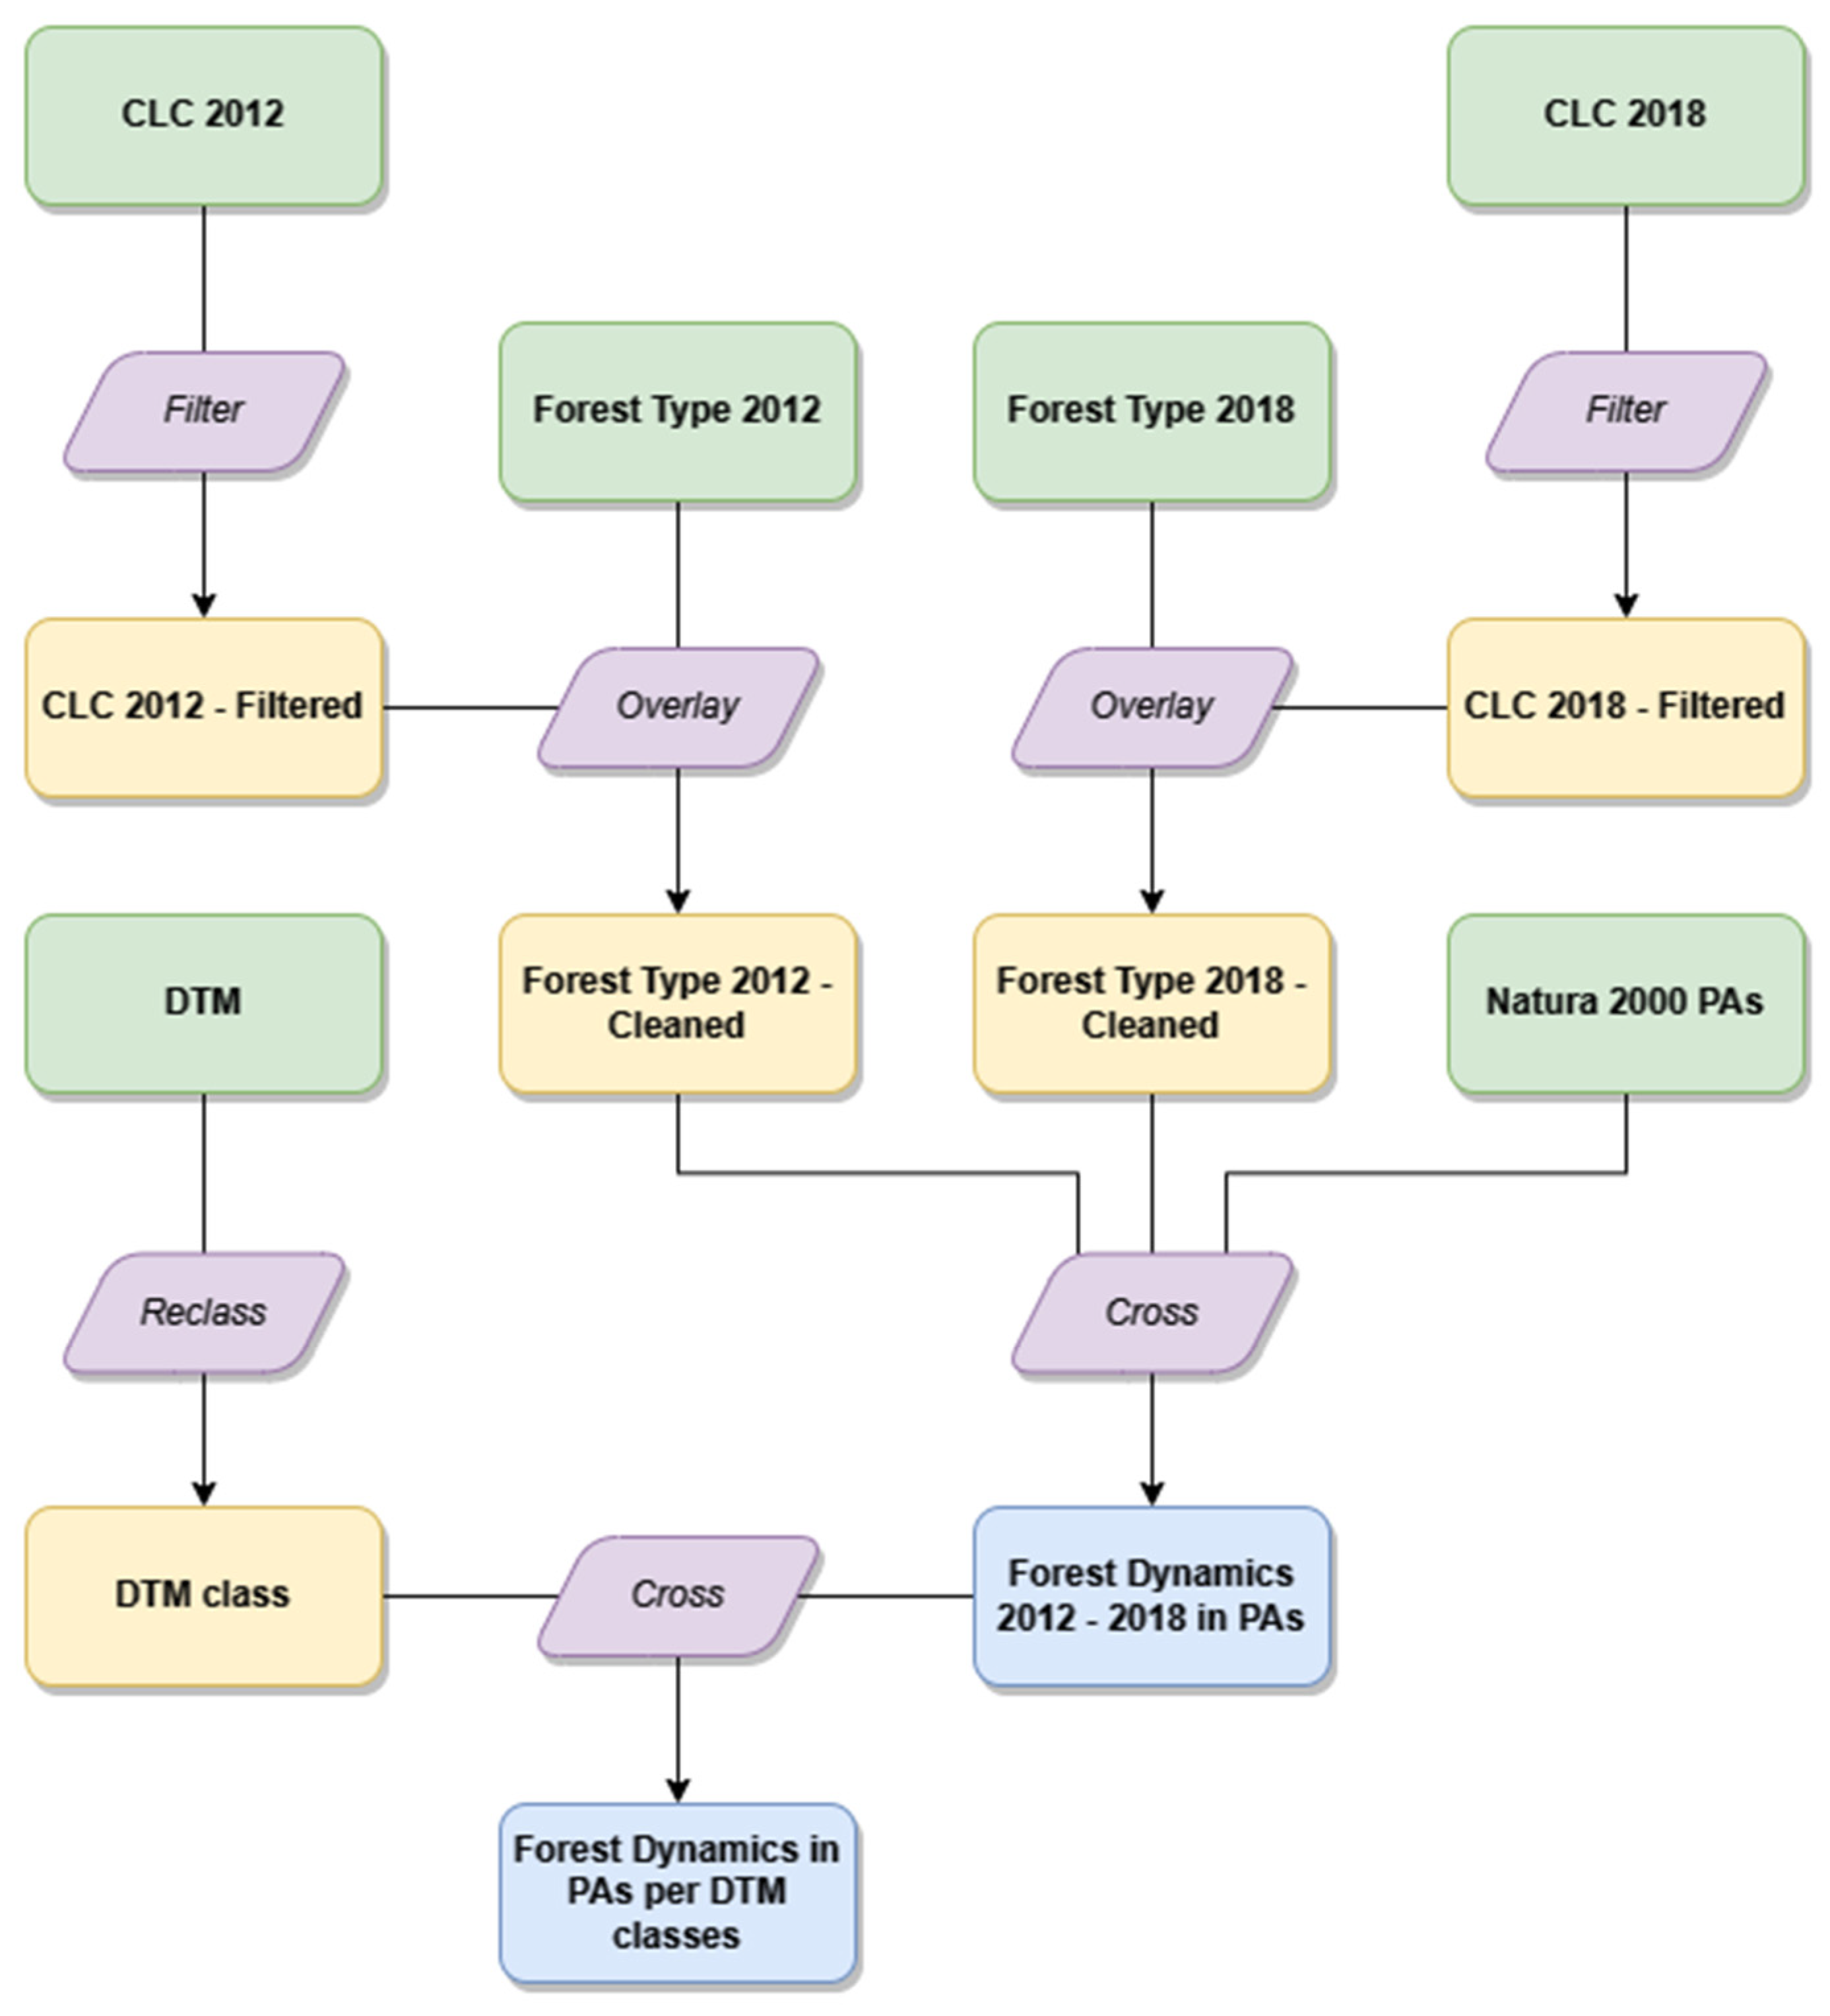
All the spatial analyses have been performed using QGIS 3.22 or GRASS GIS version 7 (Figure 2).
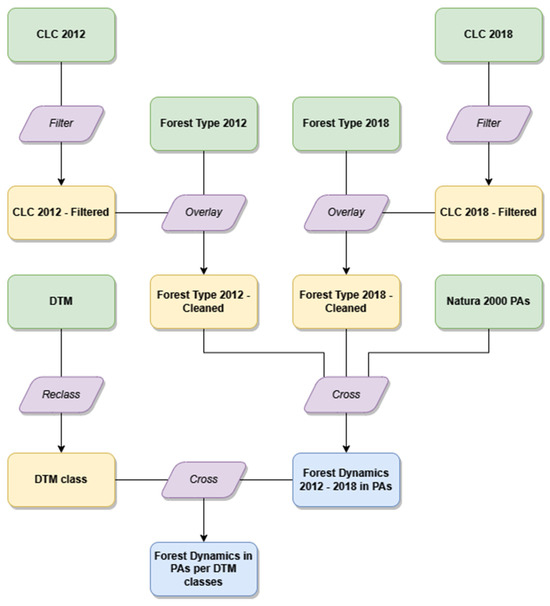
Figure 2.
Workflow of the methodological approach. The forest-type layers (FTY) were filtered with Corine Land Cover to obtain the forest-type cleaned layers to make them comparable, which were overlayed to obtain the forest-dynamics layers within Natura 2000 sites. Subsequently, the dynamics were overlayed on the elevation classes (DTM class) to obtain the aggregated data per altitude class.
The first phase regarded the preparation of the Natura 2000 layer, as the original shapefile included many overlapping polygons due to the presence of different types of protected areas in the same place, as well as maritime Natura 2000 sites. The original Natura 2000 vector layer has been clipped according to the official terrestrial boundaries of EU countries to exclude maritime areas, while all the resting features have been rasterized (applying a resolution equal to 10 m, the same as the 2018 FTY layer) with codes referring to the country.
The second phase focused on the preparation of the forest databases to allow for an accurate comparison. In fact, the original FTY layers for 2012 and 2018 are not coherent, and a visual check performed using Google satellite images found significant criticalities, especially for some countries such as Spain. In particular, according to the forest high-resolution layers’ official description, FTY 2018 should already be “cleaned” with respect to the presence of trees under agricultural use and in an urban context, while FTY 2012 instead still includes these nonforest areas. However, while performing the visual check of FTY 2018, it has been found that a significant part of the olive groves (both traditional and intensive) located in Andalusia (Spain) and southern Italy were erroneously included among the forests. FTY 2012, instead, excluded all the areas under large agroforestry systems (such as pastured woodlands in Sardinia (Italy) and dehesas in Spain) that were instead correctly included in the forest cover in FTY 2018, since their canopy cover and density make them fall within the definition of a forest. Therefore, to solve this discrepancy and to make the two layers comparable, it has been decided to apply a mask derived from Corine land cover (CLC) 2012 and 2018 to FTY 2012 and 2018, respectively. The choice of using CLC is due to the fact that the removal of trees in agricultural and urban areas in FTY, according to the official description of Forest High Resolution Layers, was based on a mask derived from CLC itself and from the High Resolution Imperviousness Layer. Considering that the focus of this study is only on Natura 2000 sites, it has been decided to standardize FTY 2012 and 2018 using only some CLC categories as a mask; therefore, the High Resolution Imperviousness Layers have not been used to produce the mask, given that urban trees would not be included within the Natura 2000 sites in any case. Therefore, all the areas that in CLC 2012 and 2018 were classified as 1. Artificial surfaces, or 2. Agricultural areas (except 2.1.1 Non-irrigated arable land, 2.3.1 Pastures, 2.4.3 Land principally occupied by agriculture with significant areas of natural vegetation, 2.4.4 Agro-forestry areas) have been excluded from FTY layers.. The choice of including 2.1.1 Nonirrigated arable land, 2.3.1 Pastures, and 2.4.3 Land principally occupied by agriculture with significant areas of natural vegetation is due to the fact that in many cases these land uses included small forests, while 2.4.4 Agro-forestry areas correspond to areas located in Spain and Italy with high tree density (therefore classifiable as forests) used for free livestock grazing. Furthermore, the classification of forest cover within these areas is more precise and more in line with a concordant definition of forest between the two dates, and misclassification, although not entirely absent, is uncommon enough to be accepted. As the resolutions of FTY 2012 and FTY 2018 is different (20 and 10 m, respectively), it has been decided to perform all the spatial analyses by applying a 10 m resolution so as not to miss the highest level of detail in 2018.
After that, the two comparable FTY layers have been overlapped together with the Natura 2000 borders layer to obtain a new classified raster layer, with the following data for each pixel of 10 × 10 m:
- The presence and the type of forest in 2012 (coded: 0 = no forest, 1 = broadleaf, 2 = conifer, 255 = unclassified);
- The presence and the type of forest in 2018 (coded: 0 = no forest, 1 = broadleaf, 2 = conifer);
- The country (coded from 1 to 27).
Each pixel has then been reclassified using the criteria in Table 1:

Table 1.
Categorization of the final raster for forest dynamics classification. From the code combination from the two years has been derived the dynamics, sometimes simplified.
Finally, the Continental Europe Digital Terrain Model (DTM) at 30 m resolution has been reclassified into variable altitude classes to facilitate the analysis of the results and to minimize the error. In fact, the original DTM has not been cleaned from the forest canopy; therefore, there is an overestimation of the terrain elevation in forested areas. Considering that this overestimation is, anyhow, limited to the tree heights, the reclassification allows for the reduction of this error. After some attempts, considering the altitude variability within the Natura 2000 sites at the EU level, it has been decided to apply uniform classes of 100 m each to analyse with sufficient detail the forest-cover transformation.
3. Results
3.1. Forest-Cover Changes 2012–2018 within Natura 2000 Sites at EU Level
Terrestrial Natura 2000 sites extend to about 76.82 Mha in 27 countries, corresponding to about 18.5% of the total terrestrial EU surface. In 2012, 47.5% of the Natura 2000 sites were covered by forest, of which 60.7% were represented by broadleaf forests and 39.3% by conifer; in 2018 the coverage of forests reached 48.8%, composed of broadleaf (62.4%) and conifer (37.6%). In total, in six years the forests in Natura 2000 sites expanded from 36.5 Mha to 37.5 Mha (+2.84%), with an increment equal to 172,818 ha/year. In the same time interval, the increase of forest surfaces outside the Natura 2000 network is equal to +4.1%, corresponding to an increment of 791,621 ha/year.
The changes in forest cover in Natura 2000 sites do not occur in the same way for the two types of forest; in fact, while broadleaved woods increase, forests mainly composed of conifers decrease. This can be partly explained by natural successions in unmanaged conifer reforestations that tend to evolve towards mixed or predominantly broad-leaved forest types. The annual increment in the broadleaved forest is around 209,339 ha/year, while for conifer, a decrease equal to −36,521 ha/year has been recorded. Broadleaved forests increased from 22.14 Mha in 2012 to 23.39 Mha in 2018, while conifer forests decreased from 14.32 Mha to 14.10 Mha. It is important to highlight, though, that the most extended surfaces of “unclassified areas” for 2012 were located in Sweden (9.5%) and Finland (10.7%), two countries where the conifer presence has always been particularly significant.
3.2. Forest Cover in 2012 and 2018 within Natura 2000 Sites at the Country Level
Spain is the EU country with the largest surface occupied by terrestrial Natura 2000 sites (over 13.8 Mha, 27.5% of the national terrestrial surface), even if the countries with the highest percentage cover of the Natura 2000 sites with respect to the size of the country are Slovenia (37.8%), Croatia (36.7), and Bulgaria (34.9%). Malta is the one with the lower surface under Natura 2000 protection (4356 ha, 13.8% of the terrestrial surface), while Denmark is the one with the lowest percentage (8.5%) and the only one under 10%.
Forest-cover surfaces in 2012 and 2018 within Natura 2000 sites at the country level are summarized in Figure 3.
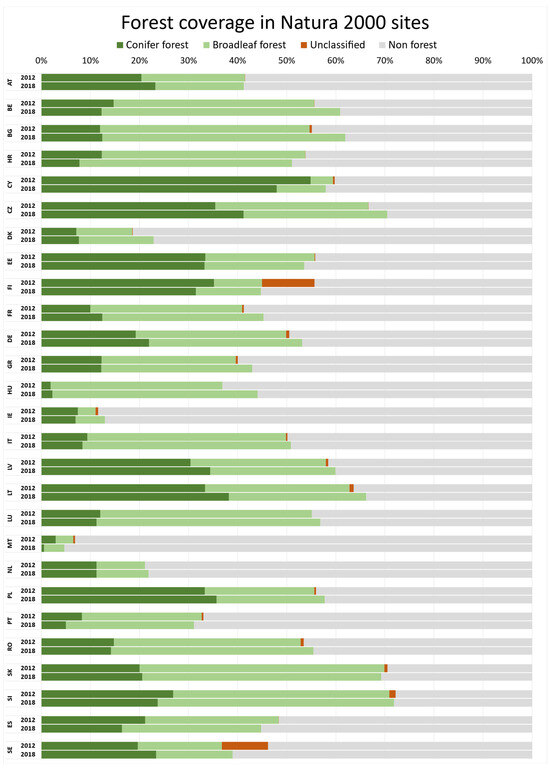
Figure 3.
Forest distribution in Natura 2000 sites per country, in 2012 and 2018.
Considering the 2012 data (Table 2), the countries with the highest forest cover within the Natura 2000 sites were Slovenia (70.9%), Slovakia (69.9%), and the Czech Republic (66.6%), while Spain was the country with the largest forest surface of the Natura 2000 sites, at about 6.7 Mha, corresponding to 48.3%. Of a total of 27 countries, 13 countries had more than half of their Natura 2000 surface covered by forest, and only three with a forest coverage of less than 20% (Denmark, Ireland, and Malta). Most of the forest cover corresponded to broadleaved forests, especially in countries like Hungary (94.9% of the total forest cover included in Natura 2000), Italy (81.1%), Luxembourg (78.2%), and Bulgaria (78.1%), even if the country with the wider broadleaved surface in Natura 2000 sites was Spain, with more than 3.7 Mha. The country with the highest percentage of conifer surface in Natura 2000 sites was Cyprus (92.4%), but the ones with the largest conifer coverage were Spain (2.9 Mha), Poland (2 Mha), Finland (1.5 Mha), and Sweden (1.1 Mha).
Table 2.
Forest surface in EU Natura 2000 sites in 2012 for the different countries. [a] Excludes the disputed territory of Turkish Cyprus and the UN buffer zone. [b] Excludes the Faroe Islands and Greenland. [c] Excludes overseas departments and regions of France. [d] Excludes overseas municipalities and other constituent countries of the Kingdom of the Netherlands. [e] Includes Azores and Madeira archipelagos. [f] Includes Canary Islands, Ceuta, and Melilla.
The situation in 2018 was quite similar (Table 3), but the number of countries with more than half of Natura 2000 surface covered by forest increased to 15, while the number of countries with forest cover of less than 20% was only two, as Denmark reached 22.9%. Regarding the forest types, Hungary was still the country with the highest percentage of broadleaved (94.9%), followed by Malta (88.7%), Croatia (84.8%), Portugal (84%), and Italy (83.6%); this latter was also the one with the wider surface of broadleaved, about 2.4 Mha. On the opposite end, conifers were more common in Natura 2000 sites located in Spain (2.3 Mha), Poland (2.2 Mha), Sweden (1.4 Mha), and Finland (1.3 Mha).
Table 3.
Forest surface in EU Natura 2000 sites in 2018 for the different countries. [a] Excludes the disputed territory of Turkish Cyprus and the UN buffer zone. [b] Excludes the Faroe Islands and Greenland. [c] Excludes overseas departments and regions of France. [d] Excludes overseas municipalities and other constituent countries of the Kingdom of the Netherlands. [e] Includes Azores and Madeira archipelagos. [f] Includes Canary Islands, Ceuta, and Melilla.
3.3. Forest-Cover Changes 2012–2018 within Natura 2000 Sites at Country Level
The results regarding overall forest-cover changes at the national level within Natura 2000 sites (Table 4), show that Denmark, Hungary and Ireland have the higher percent increase (+23.2%, +19.4%, and +16.1% respectively), but these increases are unevenly distributed with respect to forest type; while in the case of Denmark and Hungary, the increase has involved both broadleaf and conifer forests. In the case of Ireland, the increase involved only deciduous forests, while there was a reduction in coniferous forests. Concerning the forest-over expansion in hectares, the countries with the wider surfaces are France, Bulgaria, and Germany (+302.948 ha, +267.095 ha, and +150,578, respectively), and these increments are distributed similarly regarding forest types. Most of the increase is due to new broadleaf forests. France is also the country with the highest yearly rate of net forest gain, corresponding to +50,491 ha/year, followed by Bulgaria (+44,516 ha/year) and Germany (+25,096 ha/year).
Table 4.
Forest-cover changes in EU countries within Natura 2000 sites in the period 2012–2018. [a] Excludes the disputed territory of Turkish Cyprus and the UN buffer zone. [b] Excludes the Faroe Islands and Greenland. [c] Excludes overseas departments and regions of France. [d] Excludes overseas municipalities and other constituent countries of the Kingdom of the Netherlands. [e] Includes Azores and Madeira archipelagos. [f] Includes Canary Islands, Ceuta, and Melilla.
Some of the EU countries recorded a decrease in forest cover within Natura 2000 sites, ranging from −28.6% (Malta) to −0.1% (Sweden). The decrease in Malta is in reality very low in terms of hectares (−80 ha), because of the reduced total presence of forest surfaces within Natura 2000 sites. If the total forest-cover variation in Natura 2000 sites in Sweden is really reduced, the results showed a relevant change of forest type, considering the loss of 13.512 ha of conifer and 11.398 ha of new broadleaved forest; but it is necessary to consider that 10.7% of Natura 2000 site surface was unclassified in 2012. Therefore, these results are affected by the original data. Due to this high presence of unclassified areas and given the minimal percentage of changes in forest surface, it cannot be ruled out that this percentage could also reach positive values. An unusual case is represented by Spain, considering not only that forest surfaces recorded a decrease equal to −7.4% in 2012–2018 (−82,265 ha/year), but also that more than 750.000 ha of conifer forest changed to broadleaved forest.
The overall trend shows that, in almost all countries, the net change in coniferous forests is less than the one of broadleaved forests. In 15 countries, the transformation of coniferous forests has a negative sign, and the total conifer cover decreases by 267,552 ha. In only two countries, Austria and Latvia, this trend is reversed. In Austria, the loss of forest cover (amounting to 2872 ha) results from the combination of a reduction in deciduous forest of 6296 ha being partially balanced by an increase in coniferous forest of 3424 ha. In Latvia, on the other hand, there is an increase in both forest types, but the most significant category is coniferous forests.
3.4. Forest-Cover Changes 2012–2018 within Natura 2000 According to Altitudinal Ranges
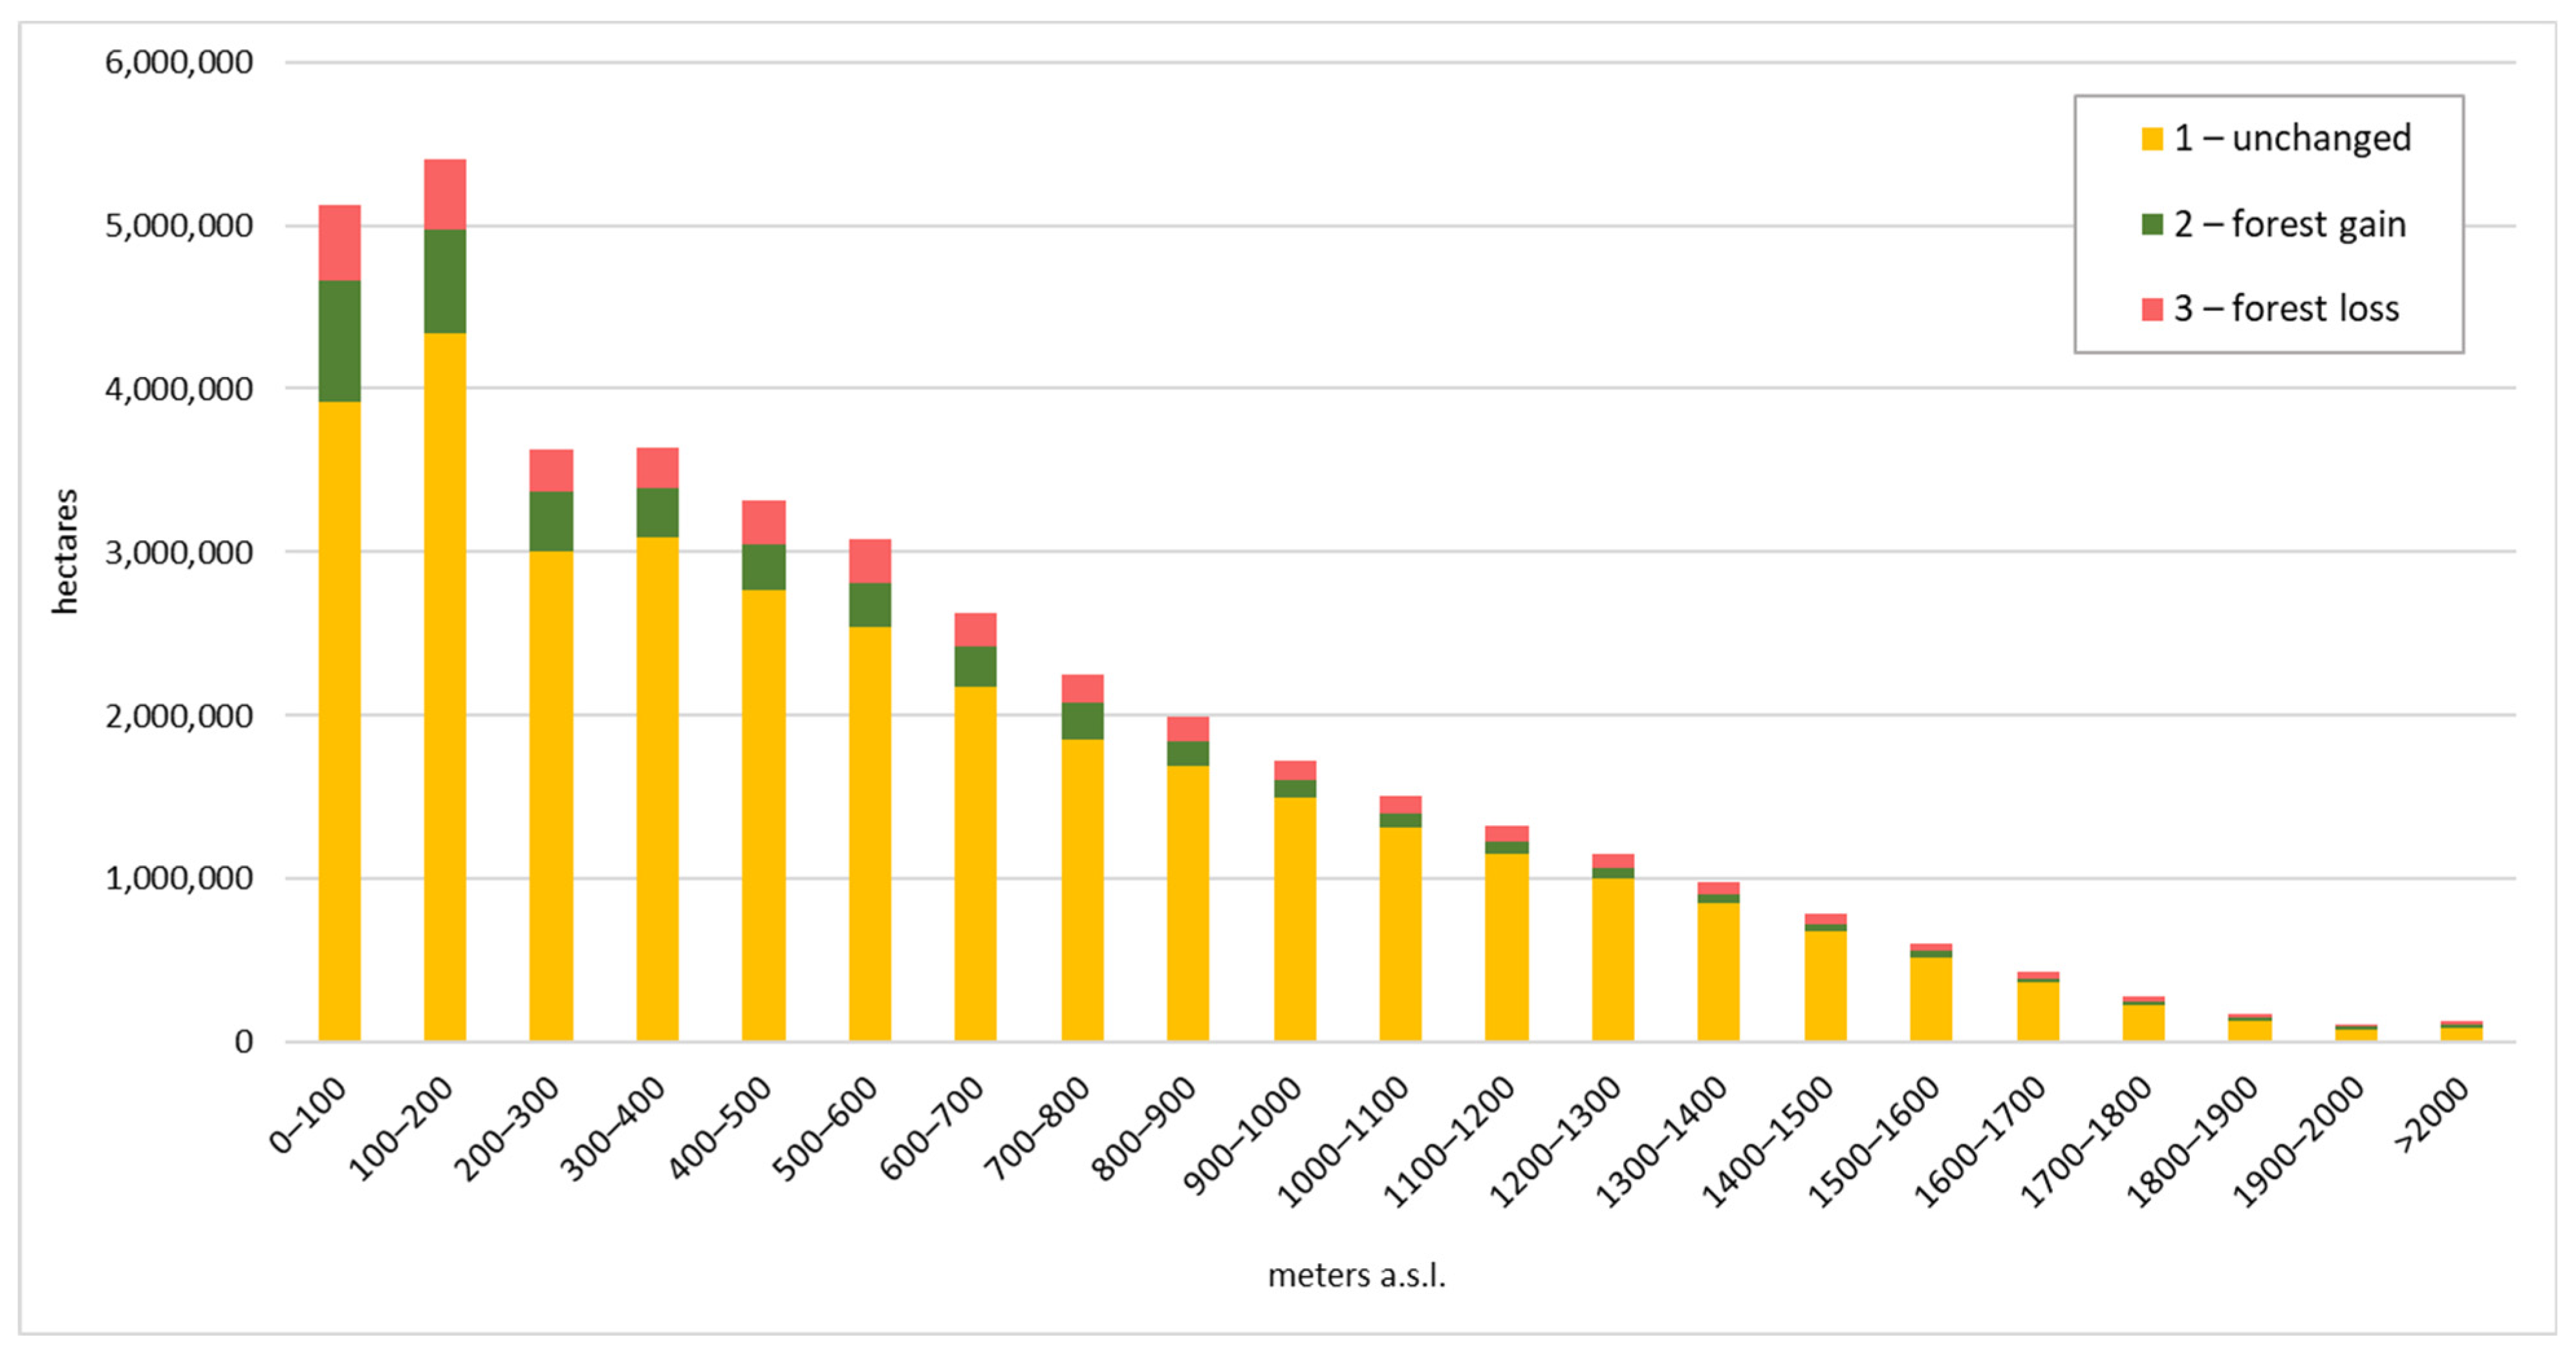
About 20% of the total net forest-surface gain within Natura 2000 is located in the first altitudinal class (between 0 and 100 m a.s.l.), and this value reaches 54% considering the first four altitudinal classes (0–400 m a.s.l.) (Figure 4). Similarly, the highest amount of forest loss is located in the first class (15% of forest loss surface), and the first five altitudinal classes account for 53% of the total forest-surface loss. Forest gain and forest loss remain evenly distributed in all the classes, considering the total Natura 2000 surface, with a cover percentage of 4% to 6% (with the exception of the highest class that corresponds to the altitude limit for forests). Only the first altitude class deviates slightly from this value, where the forest loss only occurs on 3% of the total Natura 2000 surface.

Figure 4.
Unchanged forests, forest gain, and forest loss in EU Natura 2000 sites according to altitudinal ranges.
Compared to the EU average trends, some countries follow different trends related to forest-cover changes in Natura 2000 sites, according to the altimetry, and need additional focus:
- Bulgaria: the forest gain reaches a higher percentage, while forest loss is less incisive (between 1% and 2%). Forest gain is especially high between 300 and 700 m a.s.l., where it exceeds 10%;
- Croatia: the average forest gain is in line with the one at EU Natura 2000 sites, but it is mostly concentrated between 0 and 200 m a.s.l., where it reaches 5%–7%. Average forest loss is higher than the EU average one (7%), especially between 200 and 600 m a.s.l., where it reaches 9%–11%;
- Czech Republic: the average forest gain is higher, and it is split between lower and higher altitude classes (between 100–200 m a.s.l., it reaches 12%, and between 1100–1400 m a.s.l., it reaches 10%–12%);
- Finland: the forest loss is higher (7%), especially in the higher altitude classes (400–600 m a.s.l.), where it ranges from 14% to 18%. Finland is also the country with the highest percentage of unclassifiable areas in 2012 (10.7%). These areas are mostly located in the range 200–400 m a.s.l., where they account for 16% of the Natura 2000 surface;
- France: the average forest gain (7%) is higher than the EU average one, and it is homogeneously distributed in all the altitude classes. Forest loss is lower (3%) than the EU average one, again homogeneously distributed in all the altitude classes;
- Germany: the forest loss is lower (2%) than the EU average one, with no particular distribution peaks;
- Greece: the forest gain (7%) is higher than the EU average one, and mostly found between 200–800 m a.s.l., where it reaches 9%–11%.
- Hungary: the forest gain is high (8%), especially between 100 and 300 m a.s.l., where it reaches 11%;
- Portugal and Spain: both have a higher average percentage of forest loss (7% and 6%, respectively), but it is homogeneously distributed in the different altitude classes;
- Romania: average forest loss (2%) is lower than the EU average one, homogeneously distributed;
- Sweden: the average values are in line with the EU average one, but the forest gain is mostly concentrated between 600 and 800 m a.s.l., where it reaches 11%–13%. This country, like Finland, is heavily interested in unclassifiable land in 2012, which follows an upward trend with the altitude classes.
4. Discussion
The results of our study demonstrated that forest cover in EU Natura 2000 sites is constantly increasing, at an average rate of +105,750 ha/year. This trend is in line with the data provided by Kallimanis et al. [51], who reported an increase in forests between 2000 and 2006 inside 25,703 Natura 2000 sites in 24 EU countries and a decrease in open spaces. The findings testify that Natura 2000 sites are currently affected by forest expansion due to the abandonment of open spaces, leading to the homogenization of the landscape and the reduction of the number of habitats. This is particularly worrying, considering that landscape heterogeneity is recognized to be crucial for biodiversity and habitat conservation [52,53] and that increasing heterogeneity generally leads to benefits for biodiversity and ecosystem services [54]. In addition to forest-surface increase, it is necessary to highlight that this is often combined with the increase of unmanaged EU forests that started in the 1950s [55], and that is responsible for reducing the heterogeneity and variety of forest types.
Our findings are in line with different studies at local or national levels confirming the trend of forest-surface increase within Pas. At the EU level, the increase in forest area was already attested in 2006 by Gold et al. [56], who reported a general increase of about 30% in the period 1950–2000, with lower rates for Northern Europe. Between 1990 and 2018, the most frequent trend in Slovakian protected areas is the conversion of transitional shrubs to forests due to secondary succession [57]. In rural areas of Northern Hungary (Pest County) and Southern Poland (Małopolska Province), in the period 2000–2012, forest areas increased, together with artificial surfaces, replacing agricultural areas [58]. In Poland’s landscape parks, the most frequent land-use change in 2006–2012 was identified in the transformation of nonforest land uses into forests, due to the expansion of forests on abandoned arable land, meadows, and pastures [59]. In the European Alps, the abandonment of summer pastures led to more homogeneous landscape patterns and reduced aesthetic values due to the increase in forests and the closing of open spaces [60]. According to Jiménez-Olivencia et al. [61], who performed a study based on 53 case studies from six different countries located in the mountain regions of Mediterranean Europe, in the last 40 years, in over 90% of the cases, landscape change was caused by the abandonment of farmland and consequent reforestation, and by pressure from urban development at the lower altitudes, leading to degradation processes, landscape homogenization, and open-spaces fragmentation. In Southeastern Sweden, during the 20th century, seminatural grassland cover decreased by over 96%, mostly to become forest, causing detrimental effects on biodiversity [62]. Regarding the forest-surface changes in relation to the altimetry, the results highlight that the spread of new forests is generally more concentrated at lower altitudes. This is partly due to the fact that the length of the vegetative season is reduced at higher altitudes due to climate conditions [63]. According to some studies, it is also necessary to consider that climate change is “moving” the forest treeline north, towards higher altitudes [64], even if the correlation with climate change is not sufficiently studied yet. Especially in the case of Europe, it seems that the abandonment of traditional land-use management at higher altitudes has a greater impact than climate change [65,66].
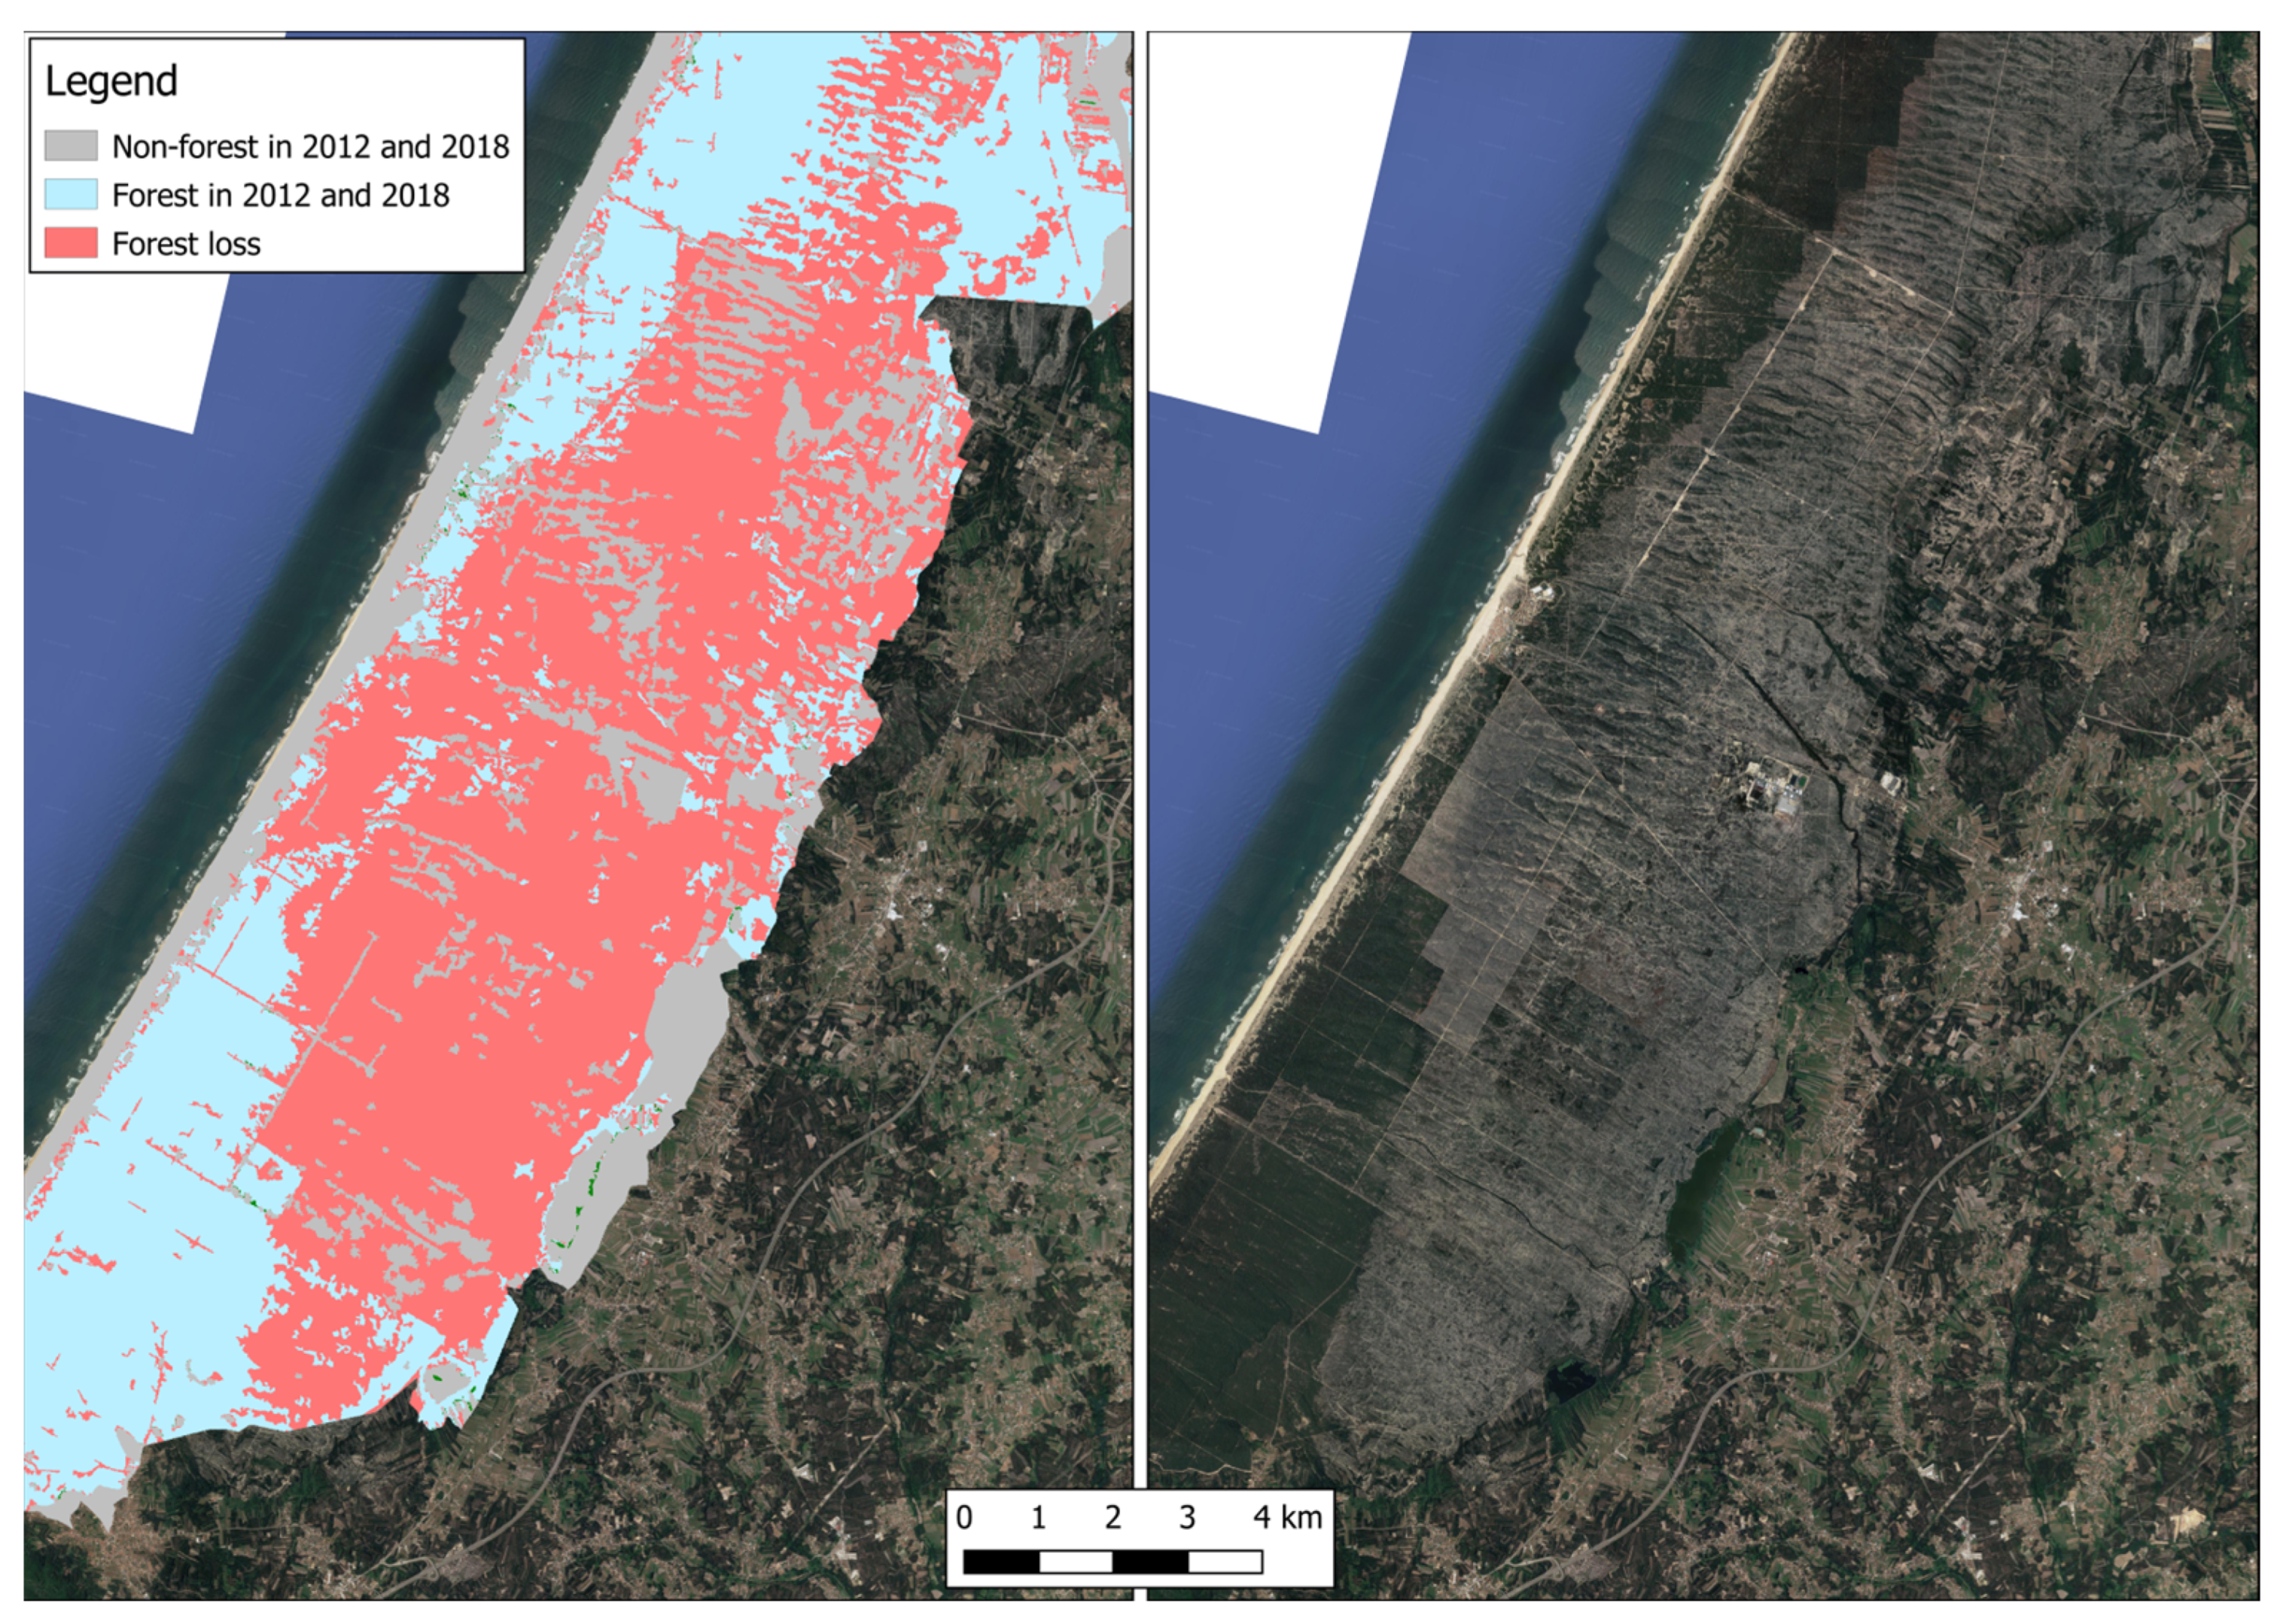
The only country with conflicting data is Spain. In fact, the results of our investigation highlighted a decrease in forest surface in Natura 2000 sites, while different studies reported the opposite trend. For Moncayo Natural Park (Spain) in the period 1987–2010, it is reported that there was an expansion of sessile oaks (Quercus petraea) and beech (Fagus sylvatica) forest and a transformation of artificial pine forest and shrub areas into broadleaved forests, as a consequence of the abandonment of traditional uses and the establishment of the Natural Park [67]. Another study conducted by Ameztegui et al. [42] in three mountain National Parks in Spain reported a +5%–11% of total forest area between 1956 and 2016 and consequent patterns of landscape homogenization due to the collapse of the traditional socioeconomic system and the massive rural–urban migration. Mediterranean Spain has also been affected by the same trend of forest-surface increase. Considering that in the province of Castelló (Valencian Region) from 1957 to 2007, the area dominated by dense forests (shrublands and woodlands) increased from 17% to 28% [68]. This inconsistency regarding Spain can be explained by the fact that the original 2012 data has been “cleaned” using a CLC-based mask, while the 2018 database was already filtered; even if CLC follows a common EU legend, each country produces its own CLC database. Therefore, some differences in classifying the land uses can be found. In particular, Spain seems to have a significant level of inaccuracy in the 2012 classification between agroforestry, olive groves, Mediterranean maquis, and conifer forests, which could have led to an overestimation of 2012 conifer forests. In addition, a relevant amount of the conifer-forest loss registered in the period 2012–2018 in both Spain and Portugal is surely due to the occurrence of forest fires that have affected large forested areas [69]; this has also been confirmed by a visual check of 2012 and 2018 satellite images for some deforested areas in the two countries (Figure 5).
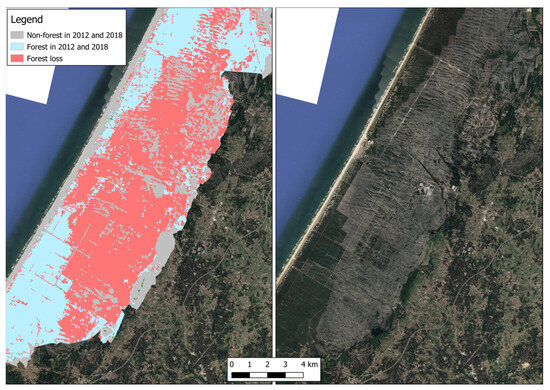
Figure 5.
The image refers to part of the Natura 2000 site “Dunas de Mira, Gândara e Gafanhas” (code: PTCON0055), in Portugal, that was affected by a major forest fire in 2017. Most of the burned area, clearly visible on the right image, was classified as “non forest” in 2018 due to limitations of automatic classification; thus the analysis of the changes (on the left) shows a wide area of “forest loss”.
PAs have a crucial role in preserving biodiversity and threatened species and habitats, and, to meet the Aichi targets, in the last two decades, governments agreed on expanding the global protected area network [70]. As a consequence, between 2010 and 2019, PAs expanded from covering 14.1% to 15.3% of global land and freshwater environments (excluding Antarctica) [71]. Despite the fact that human activities inside most EU PAs continue to be practised [72], the main goal of the Natura 2000 conservation network, being based on the Habitats and Bird Directives, is the preservation of natural habitats and wild fauna and flora species. Therefore, agro-silvo-pastoral activities are considered to be, if not an obstacle, at least not a positive feature. The presence or the creation of new PAs is not a guarantee of biodiversity conservation per se [73], especially in countries where the variety of habitats and the diversity at the landscape scale is the result of traditional agro-silvo-pastoral activities carried out by local rural communities through the centuries. In fact, according to Maxwell et al. [74], area-based conservation, to be more successful after 2020, should better collaborate with the local communities that are central to the successful conservation of biodiversity. In addition, landscape structure is an important predictor of species richness across different taxa and functional groups [75], and cultural landscapes shaped by humans over long periods offer a wide variety of habitats with an abundant variety of species, demonstrating that biodiversity conservation could not be automatically and only associated with primaeval forests or other natural ecosystems [76]. Finally, it is worth noticing that forests that have been managed for centuries and have experienced some decades of management abandonment or strict protection are structurally very different from old-growth forests that have not been managed since ancient times, and they should be managed according to cultural criteria and not only by applying exclusive biodiversity-centred management [77].
Limitations of the Study
Some limitations of this study need to be reported. The first one has to be found in the reduced time interval (6 years), considering that forest dynamics are often characterized by long times; however, the first signs of secondary successions are visible after a few years, especially in Mediterranean environments [78]. In this regard, it was decided not to use other databases prior to 2012, as they were created in the framework of different programmes, using different sources, and applying completely different methodologies and resolutions. Therefore, the comparison could have led to more significant errors. A second limitation is the intrinsic quality and accuracy of the original data sources, in particular of the FTY High Resolution Layers; as already explained in the methodological section, it has been necessary to process the original datasets to make them comparable. The main problem was not related to the different spatial resolution (10 or 20 m) but to the different classification of forest and to the fact that 2018 data were already “cleaned” using a CLC-based mask, while 2012 data were not. Moreover, the FTY 2012 dataset was produced using different input data sets and methodologies compared to the FTY 2018. Despite the accuracy values of FTY layers according to the official documentation, being reported to be above 90%, the visual assessment carried out in the first phase of this research highlighted significant inaccuracies regarding the classification of certain land-use classes, especially in some countries (see methodological section for further details). While an accuracy validation of FTY layers through visual photointerpretation was out of the scope of this research, it would be interesting to explore this topic further from a future research perspective. Despite these limitations, the present study has been performed with the highest possible level of accuracy and precision, thanks to precise research planning, that allowed for obtaining reliable quantitative and spatial data regarding the main trends of forest-cover changes within Natura 2000 sites.
5. Conclusions
The study identified the main trends regarding forest-cover changes in EU Natura 2000 areas; in particular, it demonstrated an increase in forests that are progressively replacing open spaces. The main cause could be found in the abandonment of pastoral and agricultural activities, as reported by different studies in EU countries. Another trend that emerged from the research is the replacement of coniferous forests in favour of deciduous forests. The explanation for this phenomenon probably stems from normal secondary succession, as many coniferous reforestations carried out in the past decades are no longer managed and are gradually being replaced by native broadleaves.
Another consideration that deserves attention is the use of high-definition data on forest coverage. Although EU databases are extremely useful for international studies and research, they require some prior processing in order to obtain the most accurate data and to reduce errors.
The results could be of interest to national and local authorities involved in PAs management and biodiversity conservation, as the database produced in this study can represent a crucial baseline, providing data for forest and territorial planning and management. In fact, the management and design of PAs should carefully evaluate the importance of preserving biodiversity-friendly land uses and practices, instead of promoting a diffuse “rewilding” with negative consequences for landscape complexity and heterogeneity, as well as for biodiversity. Finally, the produced database could be crucial for future monitoring of forest-cover changes within Natura 2000 sites, both at the country and EU levels.
Author Contributions
Conceptualization: A.S. and F.P.; methodology: A.S. and F.P.; software: F.P.; writing: A.S., F.P., A.B., B.F. and M.A.; supervision: A.S. All authors have read and agreed to the published version of the manuscript.
Funding
This research received no external funding.
Data Availability Statement
The datasets generated and/or analysed during the current study are available from the corresponding author upon reasonable request.
Conflicts of Interest
The authors declare no conflicts of interest.
References
- Anderson, E.; Mammides, C. The role of protected areas in mitigating human impact in the world’s last wilderness areas. Ambio 2020, 49, 434–441. [Google Scholar] [CrossRef]
- Naughton-Treves, L.; Holland, M.B.; Brandon, K. The role of protected areas in conserving biodiversity and sustaining local livelihoods. Annu. Rev. Environ. Resour. 2005, 30, 219–252. [Google Scholar] [CrossRef]
- Jones, K.R.; Venter, O.; Fuller, R.A.; Allan, J.R.; Maxwell, S.L.; Negret, P.J.; Watson, J.E.M. One-third of global protected land is under intense human pressure. Science 2018, 360, 788–791. [Google Scholar] [CrossRef]
- Heino, M.; Kummu, M.; Makkonen, M.; Mulligan, M.; Verburg, P.H.; Jalava, M.; Räsänen, T.A. Forest loss in protected areas and intact forest landscapes: A global analysis. PLoS ONE 2015, 10, e0138918. [Google Scholar] [CrossRef]
- Loucks, C.; Ricketts, T.H.; Naidoo, R.; Lamoreux, J.; Hoekstra, J. Explaining the global pattern of protected area coverage: Relative importance of vertebrate biodiversity, human activities and agricultural suitability. J. Biogeogr. 2008, 35, 1337–1348. [Google Scholar] [CrossRef]
- Mona, M.H.; El-Naggar, H.A.; El-Gayar, E.E.; Masood, M.F.; Mohamed, E.S.N. Effect of human activities on biodiversity in nabq protected area, south Sinai, Egypt. Egypt. J. Aquat. Res. 2019, 45, 33–43. [Google Scholar] [CrossRef]
- Hernandez Marentes, M.A.; Venturi, M.; Scaramuzzi, S.; Focacci, M.; Santoro, A. Traditional forest-related knowledge and agrobiodiversity preservation: The case of the chagras in the Indigenous Reserve of Monochoa (Colombia). Biodivers. Conserv. 2021, 31, 2243–2258. [Google Scholar] [CrossRef]
- Myers, N. Protected areas—Protected from a greater ‘what’? Biodivers. Conserv. 1994, 3, 411–418. [Google Scholar] [CrossRef]
- Anaya, F.C.; Espírito-Santo, M.M. Protected areas and territorial exclusion of traditional communities. Ecol. Soc. 2018, 23, 8. [Google Scholar] [CrossRef]
- Maldonado, A.D.; Ramos-López, D.; Aguilera, P.A. The role of cultural landscapes in the delivery of provisioning ecosystem services in protected areas. Sustainability 2019, 11, 2471. [Google Scholar] [CrossRef]
- Saviano, M.; Di Nauta, P.; Montella, M.M.; Sciarelli, F. The cultural value of protected areas as models of sustainable development. Sustainability 2018, 10, 1567. [Google Scholar] [CrossRef]
- Infield, M. Cultural values: A forgotten strategy for building community support for protected areas in Africa. Conserv. Biol. 2001, 15, 800–802. [Google Scholar] [CrossRef]
- Mose, I.; Weixlbaumer, N. A new paradigm for protected areas in Europe. In Protected Areas and Regional Development in Europe: Towards a New Model for the 21st Century, 1st ed.; Mose, I., Ed.; Ashgate: Aldershot, UK, 2007; pp. 3–20. [Google Scholar]
- Dudley, N. Guidelines for Applying Protected Area Management Categories; IUCN: Gland, Switzerland, 2008. [Google Scholar]
- UNESCO, SCBD. Linking Biological and Cultural Diversity. 2014. Available online: https://www.cbd.int/lbcd/ (accessed on 20 December 2023).
- Agnoletti, M.; Piras, F.; Venturi, M.; Santoro, A. Cultural values and forest dynamics: The Italian forests in the last 150 years. For. Ecol. Manag. 2022, 503, 119655. [Google Scholar] [CrossRef]
- FAO. Global Forest Resources Assessment 2020: Main Report; Food and Agriculture Organization: Rome, Italy, 2020. [Google Scholar]
- Kuusela, K. Forest Resources in Europe 1950–1990; EFI Research Report 1; Cambridge University Press: Cambridge, UK, 1994. [Google Scholar]
- André, M.F. Depopulation, land-use change and landscape transformation in the French Massif Central. Ambio 1998, 27, 351–353. [Google Scholar]
- Preiss, E.; Martin, J.L.; Debussche, M. Rural depopulation and recent landscape changes in a Mediterranean region: Consequences to the breeding avifauna. Landsc. Ecol. 1997, 12, 51–61. [Google Scholar] [CrossRef]
- Garbarino, M.; Morresi, D.; Urbinati, C.; Malandra, F.; Motta, R.; Sibona, E.M.; Vitali, A.; Weisberg, P.J. Contrasting land use legacy effects on forest landscape dynamics in the Italian Alps and the Apennines. Landsc. Ecol. 2020, 35, 2679–2694. [Google Scholar] [CrossRef]
- Bracchetti, L.; Carotenuto, L.; Catorci, A. Land-cover changes in a remote area of central Apennines (Italy) and management directions. Landsc. Urban Plan. 2012, 104, 157–170. [Google Scholar] [CrossRef]
- MacDonald, D.; Crabtree, J.R.; Wiesinger, G.; Dax, T.; Stamou, N.; Fleury, P.; Gutierrez Lazpita, J.; Gibon, A. Agricultural abandonment in mountain areas of Europe: Environmental consequences and policy response. J. Environ. Manag. 2000, 59, 47–69. [Google Scholar] [CrossRef]
- Schulp, C.J.; Levers, C.; Kuemmerle, T.; Tieskens, K.F.; Verburg, P.H. Mapping and modelling past and future land use change in Europe’s cultural landscapes. Land Use Policy 2019, 80, 332–344. [Google Scholar] [CrossRef]
- van der Zanden, E.H.; Verburg, P.H.; Schulp, C.J.; Verkerk, P.J. Trade-offs of European agricultural abandonment. Land Use Policy 2017, 62, 290–301. [Google Scholar] [CrossRef]
- Mather, A.S. The Forest Transition. Area 1992, 24, 367–379. [Google Scholar]
- Pendrill, F.; Persson, U.M.; Godar, J.; Kastner, T. Deforestation displaced: Trade in forest-risk commodities and the prospects for a global forest transition. Environ. Res. Lett. 2019, 14, 055003. [Google Scholar] [CrossRef]
- Agnoletti, M. The degradation of traditional landscape in a mountain area of Tuscany during the 19th and 20th centuries: Implications for biodiversity and sustainable management. For. Ecol. Manag. 2007, 249, 5–17. [Google Scholar] [CrossRef]
- Veldman, J.W.; Overbeck, G.E.; Negreiros, D.; Mahy, G.; Le Stradic, S.; Fernandes, G.W.; Durigan, G.; Buisson, E.; Putz, F.E.; Bond, W.J. Where tree planting and forest expansion are bad for biodiversity and ecosystem services. BioScience 2015, 65, 1011–1018. [Google Scholar] [CrossRef]
- Hunziker, M.; Felber, P.; Gehring, K.; Buchecker, M.; Bauer, N.; Kienast, F. Evaluation of landscape change by different social groups. Mount. Res. Dev. 2008, 28, 140–147. [Google Scholar] [CrossRef]
- Ruskule, A.; Nikodemus, O.; Kasparinskis, R.; Bell, S.; Urtane, I. The perception of abandoned farmland by local people and experts: Landscape value and perspectives on future land use. Landsc. Urban Plan. 2013, 115, 49–61. [Google Scholar] [CrossRef]
- Bieling, C. Perceiving and responding to gradual landscape change at the community level: Insights from a case study on agricultural abandonment in the Black Forest, Germany. Ecol. Soc. 2013, 18, 36. [Google Scholar] [CrossRef]
- Santoro, A.; Venturi, M.; Agnoletti, M. Landscape perception and public participation for the conservation and valorization of cultural landscapes: The case of the Cinque Terre and Porto Venere UNESCO site. Land 2021, 10, 93. [Google Scholar] [CrossRef]
- Kumm, K.I.; Hessle, A. Economic comparison between pasture-based beef production and afforestation of abandoned land in Swedish forest districts. Land 2020, 9, 42. [Google Scholar] [CrossRef]
- Gellrich, M.; Baur, P.; Koch, B.; Zimmermann, N.E. Agricultural land abandonment and natural forest re-growth in the Swiss mountains: A spatially explicit economic analysis. Agric. Ecosyst. Environ. 2007, 118, 93–108. [Google Scholar] [CrossRef]
- Ursino, N.; Romano, N. Wild forest fire regime following land abandonment in the Mediterranean region. Geophys. Res. Lett. 2014, 41, 8359–8368. [Google Scholar] [CrossRef]
- Santoro, A.; Venturi, M.; Piras, F.; Fiore, B.; Corrieri, F.; Agnoletti, M. Forest area changes in Cinque Terre National Park in the last 80 years. Consequences on landslides and forest fire risks. Land 2021, 10, 293. [Google Scholar] [CrossRef]
- Höchtl, F.; Lehringer, S.; Konold, W. “Wilderness”: What it means when it becomes a reality—A case study from the southwestern Alps. Landsc. Urban Plan. 2005, 70, 85–95. [Google Scholar] [CrossRef]
- Soliva, R.; Rønningen, K.; Bella, I.; Bezak, P.; Cooper, T.; Flø, B.E.; Marty, P.; Potter, C. Envisioning upland futures: Stakeholder responses to scenarios for Europe’s mountain landscapes. J. Rural. Stud. 2008, 24, 56–71. [Google Scholar] [CrossRef]
- De Pablo, C.L.; Peñalver-Alcázar, M.; De Agar, P.M. Change in landscape and ecosystems services as the basis of monitoring natural protected areas: A case study in the Picos de Europa National Park (Spain). Environ. Monit. Assess. 2020, 192, 220. [Google Scholar] [CrossRef] [PubMed]
- Pallotta, E.; Boccia, L.; Rossi, C.M.; Ripa, M.N. Forest Dynamic in the Italian Apennines. Appl. Sci. 2022, 12, 2474. [Google Scholar] [CrossRef]
- Ameztegui, A.; Morán-Ordóñez, A.; Márquez, A.; Blázquez-Casado, Á.; Pla, M.; Villero, D.; Coll, L. Forest expansion in mountain protected areas: Trends and consequences for the landscape. Landsc. Urban Plan. 2021, 216, 104240. [Google Scholar] [CrossRef]
- Bridgewater, P.; Rotherham, I.D. A critical perspective on the concept of biocultural diversity and its emerging role in nature and heritage conservation. People Nat. 2019, 1, 291–304. [Google Scholar] [CrossRef]
- Trosper, R.L.; Parrotta, J.A. 2012 Introduction: The growing importance of traditional forest-related knowledge. In Traditional Forest-Related Knowledge: Sustaining Communities, Ecosystems and Biocultural Diversity; Parrotta, J.A., Trosper, R.L., Eds.; Springer: Dordrecht, The Netherlands, 2012; Volume 12, pp. 1–36. [Google Scholar]
- Bobiec, A. Białowieża Primeval Forest as a remnant of culturally modified ancient forest. Eur. J. For. Res. 2012, 131, 1269–1285. [Google Scholar] [CrossRef]
- European Environment Agency. Copernicus Land Monitoring Service—High Resolution Layer Forest: Product Specifications Document; Copernicus Team at EEA: Copenhagen, Denmark, 2018. [Google Scholar]
- FAO. Global Forest Resources Assessment 2020: Terms and Definitions; Food and Agriculture Organization: Rome, Italy, 2020. [Google Scholar]
- European Environment Agency. Natura 2000 Data—The European Network of Protected Sites. Available online: http://data.europa.eu/88u/dataset/DAT-68-en (accessed on 23 September 2023).
- European Environmental Agency. Copernicus Land Monitoring Service CORINE Land Cover User Manual; European Environment Agency (EEA): Copenhagen, Denmark, 2021. [Google Scholar]
- Hengl, T.; Leal Parente, L.; Krizan, J.; Bonannella, C. Continental Europe Digital Terrain Model at 30 m Resolution Based on GEDI, ICESat-2, AW3D, GLO-30, EUDEM, MERIT DEM and Background Layers. Version Dataset v3.0. Zenodo. 2020. Available online: https://zenodo.org/records/4724549 (accessed on 20 December 2023).
- Kallimanis, A.S.; Touloumis, K.; Tzanopoulos, J.; Mazaris, A.D.; Apostolopoulou, E.; Stefanidou, S.; Scott, A.V.; Potts, S.G.; Pantis, J.D. Vegetation coverage change in the EU: Patterns inside and outside Natura 2000 protected areas. Biodivers. Conserv. 2015, 24, 579–591. [Google Scholar] [CrossRef]
- Benton, J.; Vickery, J.A.; Wilson, J.D. Farmland biodiversity: Is habitat heterogeneity the key? Trends Ecol. Evol. 2003, 18, 182–188. [Google Scholar] [CrossRef]
- Estrada-Carmona, N.; Sanchez, A.C.; Remans, R.; Jones, S.K. Complex agricultural landscapes host more biodiversity than simple ones: A global meta-analysis. Proc. Natl. Acad. Sci. USA 2022, 119, e2203385119. [Google Scholar] [CrossRef]
- Petit, S.; Landis, D.A. Landscape-scale management for biodiversity and ecosystem services. Agric. Ecosyst. Environ. 2023, 347, 108370. [Google Scholar] [CrossRef]
- McGrath, M.J.; Luyssaert, S.; Meyfroidt, P.; Kaplan, J.O.; Bürgi, M.; Chen, Y.; Erb, K.; Gimmi, U.; McInerney, D.; Naudts, K.; et al. Reconstructing European forest management from 1600 to 2010. Biogeosciences 2015, 12, 4291–4316. [Google Scholar] [CrossRef]
- Gold, S.; Korotkov, A.; Sasse, V. The development of European forest resources, 1950 to 2000. For. Policy Econ. 2006, 8, 183–192. [Google Scholar] [CrossRef]
- Žoncová, M. Land cover changes in protected areas of Slovakia between 1990 and 2018. Acta Geogr. Slov. 2020, 60, 71–89. [Google Scholar] [CrossRef]
- Cegielska, K.; Noszczyk, T.; Kukulska, A.; Szylar, M.; Hernik, J.; Dixon-Gough, R.; Jombach, S.; Valánszki, I.; Kovács, K.F. Land use and land cover changes in post-socialist countries: Some observations from Hungary and Poland. Land Use Policy 2018, 78, 1–18. [Google Scholar] [CrossRef]
- Krajewski, P. Monitoring of landscape transformations within landscape parks in Poland in the 21st century. Sustainability 2019, 11, 2410. [Google Scholar] [CrossRef]
- Schirpke, U.; Zoderer, B.M.; Tappeiner, U.; Tasser, E. Effects of past landscape changes on aesthetic landscape values in the European Alps. Landsc. Urban Plan. 2021, 212, 104109. [Google Scholar] [CrossRef]
- Jiménez-Olivencia, Y.; Ibáñez-Jiménez, Á.; Porcel-Rodríguez, L.; Zimmerer, K. Land use change dynamics in Euro-mediterranean mountain regions: Driving forces and consequences for the landscape. Land Use Policy 2021, 109, 105721. [Google Scholar] [CrossRef]
- Cousins, S.A.; Auffret, A.G.; Lindgren, J.; Tränk, L. Regional-scale land-cover change during the 20th century and its consequences for biodiversity. Ambio 2015, 44, 17–27. [Google Scholar] [CrossRef]
- Malandra, F.; Vitali, A.; Urbinati, C.; Weisberg, P.J.; Garbarino, M. Patterns and drivers of forest landscape change in the Apennines range, Italy. Reg. Environ. Change 2019, 19, 1973–1985. [Google Scholar] [CrossRef]
- Zindros, A.; Radoglou, K.; Milios, E.; Kitikidou, K. Tree line shift in the Olympus Mountain (Greece) and climate change. Forests 2020, 11, 985. [Google Scholar] [CrossRef]
- Bryn, A. Recent forest limit changes in south-east Norway: Effects of climate change or regrowth after abandoned utilisation? Nor. Geogr. Tidsskr. Nor. J. Geogr. 2008, 62, 251–270. [Google Scholar] [CrossRef]
- Wieser, G.; Oberhuber, W.; Gruber, A. Effects of climate change at treeline: Lessons from space-for-time studies, manipulative experiments, and long-term observational records in the Central Austrian Alps. Forests 2019, 10, 508. [Google Scholar] [CrossRef]
- del Castillo, E.M.; García-Martin, A.; Aladrén, L.A.L.; de Luis, M. Evaluation of forest cover change using remote sensing techniques and landscape metrics in Moncayo Natural Park (Spain). Appl. Geogr. 2015, 62, 247–255. [Google Scholar] [CrossRef]
- Delgado-Artés, R.; Garófano-Gómez, V.; Oliver-Villanueva, J.V.; Rojas-Briales, E. Land use/cover change analysis in the Mediterranean region: A regional case study of forest evolution in Castelló (Spain) over 50 years. Land Use Policy 2022, 114, 105967. [Google Scholar] [CrossRef]
- Ferreira-Leite, F.; Bento-Gonçalves, A.; Vieira, A.; Nunes, A.; Lourenço, L. Incidence and recurrence of large forest fires in mainland Portugal. Nat. Hazards 2016, 84, 1035–1053. [Google Scholar] [CrossRef]
- Venter, O.; Fuller, R.A.; Segan, D.B.; Carwardine, J.; Brooks, T.; Butchart, S.H.; Di Marco, M.; Iwanura, T.; Joseph, L.; O’Grady, D.; et al. Targeting global protected area expansion for imperiled biodiversity. PLoS Biol. 2014, 12, e1001891. [Google Scholar] [CrossRef] [PubMed]
- UNEP-WCMC & IUCN. World Database on Protected Areas (WDPA). 2019. Available online: https://www.protectedplanet.net/ (accessed on 20 December 2023).
- Tsiafouli, M.A.; Apostolopoulou, E.; Mazaris, A.D.; Kallimanis, A.S.; Drakou, E.G.; Pantis, J.D. Human activities in Natura 2000 Sites: A highly diversified conservation network. Environ. Manag. 2013, 51, 1025–1033. [Google Scholar] [CrossRef] [PubMed]
- Guerra, C.A.; Rosa, I.; Pereira, H.M. Change versus stability: Are protected areas particularly pressured by global land cover change? Landsc. Ecol. 2019, 34, 2779–2790. [Google Scholar] [CrossRef]
- Maxwell, S.L.; Cazalis, V.; Dudley, N.; Hoffmann, M.; Rodrigues, A.S.; Stolton, S.; Visconti, P.; Woodley, S.; Kingston, N.; Lewis, E.; et al. Area-based conservation in the twenty-first century. Nature 2020, 586, 217–227. [Google Scholar] [CrossRef] [PubMed]
- Scherreiks, P.; Gossner, M.M.; Ambarlı, D.; Ayasse, M.; Blüthgen, N.; Fischer, M.; Klaus, V.H.; Kleinebecker, T.; Neff, F.; Prati, D.; et al. Present and historical landscape structure shapes current species richness in Central European grasslands. Landsc. Ecol. 2022, 37, 745–762. [Google Scholar] [CrossRef]
- Walz, U.; Syrbe, R.U. Linking landscape structure and biodiversity. Ecol. Indic. 2013, 31, 1–5. [Google Scholar] [CrossRef]
- Motta, R.; Garbarino, M.; Berretti, R.; Bono, A.; Curovic, M.; Dukić, V.; Nola, P. Monastic silviculture legacies and current old-growthness of silver fir (Abies alba) forests in the northern Apennines (Italy). Front. For. Glob. Chang. 2023, 6, 1–14. [Google Scholar] [CrossRef]
- Pueyo, Y.; Beguería, S. Modelling the rate of secondary succession after farmland abandonment in a Mediterranean mountain area. Landsc. Urban Plan. 2007, 83, 245–254. [Google Scholar] [CrossRef]

Disclaimer/Publisher’s Note: The statements, opinions and data contained in all publications are solely those of the individual author(s) and contributor(s) and not of MDPI and/or the editor(s). MDPI and/or the editor(s) disclaim responsibility for any injury to people or property resulting from any ideas, methods, instructions or products referred to in the content. |
© 2024 by the authors. Licensee MDPI, Basel, Switzerland. This article is an open access article distributed under the terms and conditions of the Creative Commons Attribution (CC BY) license (https://creativecommons.org/licenses/by/4.0/).