


An Exploration of the Physiological and Psychological Aspects of Student Anxiety Using a Greenspace Restorative Environment Based on Virtual Reality: A Controlled Experiment in Nanjing College


Abstract
1. Introduction
2. Materials and Methods
2.1. Experimental Design
2.1.1. Participants and Experimental Conditions
2.1.2. Technology Roadmap
2.1.3. Measurement Indicators
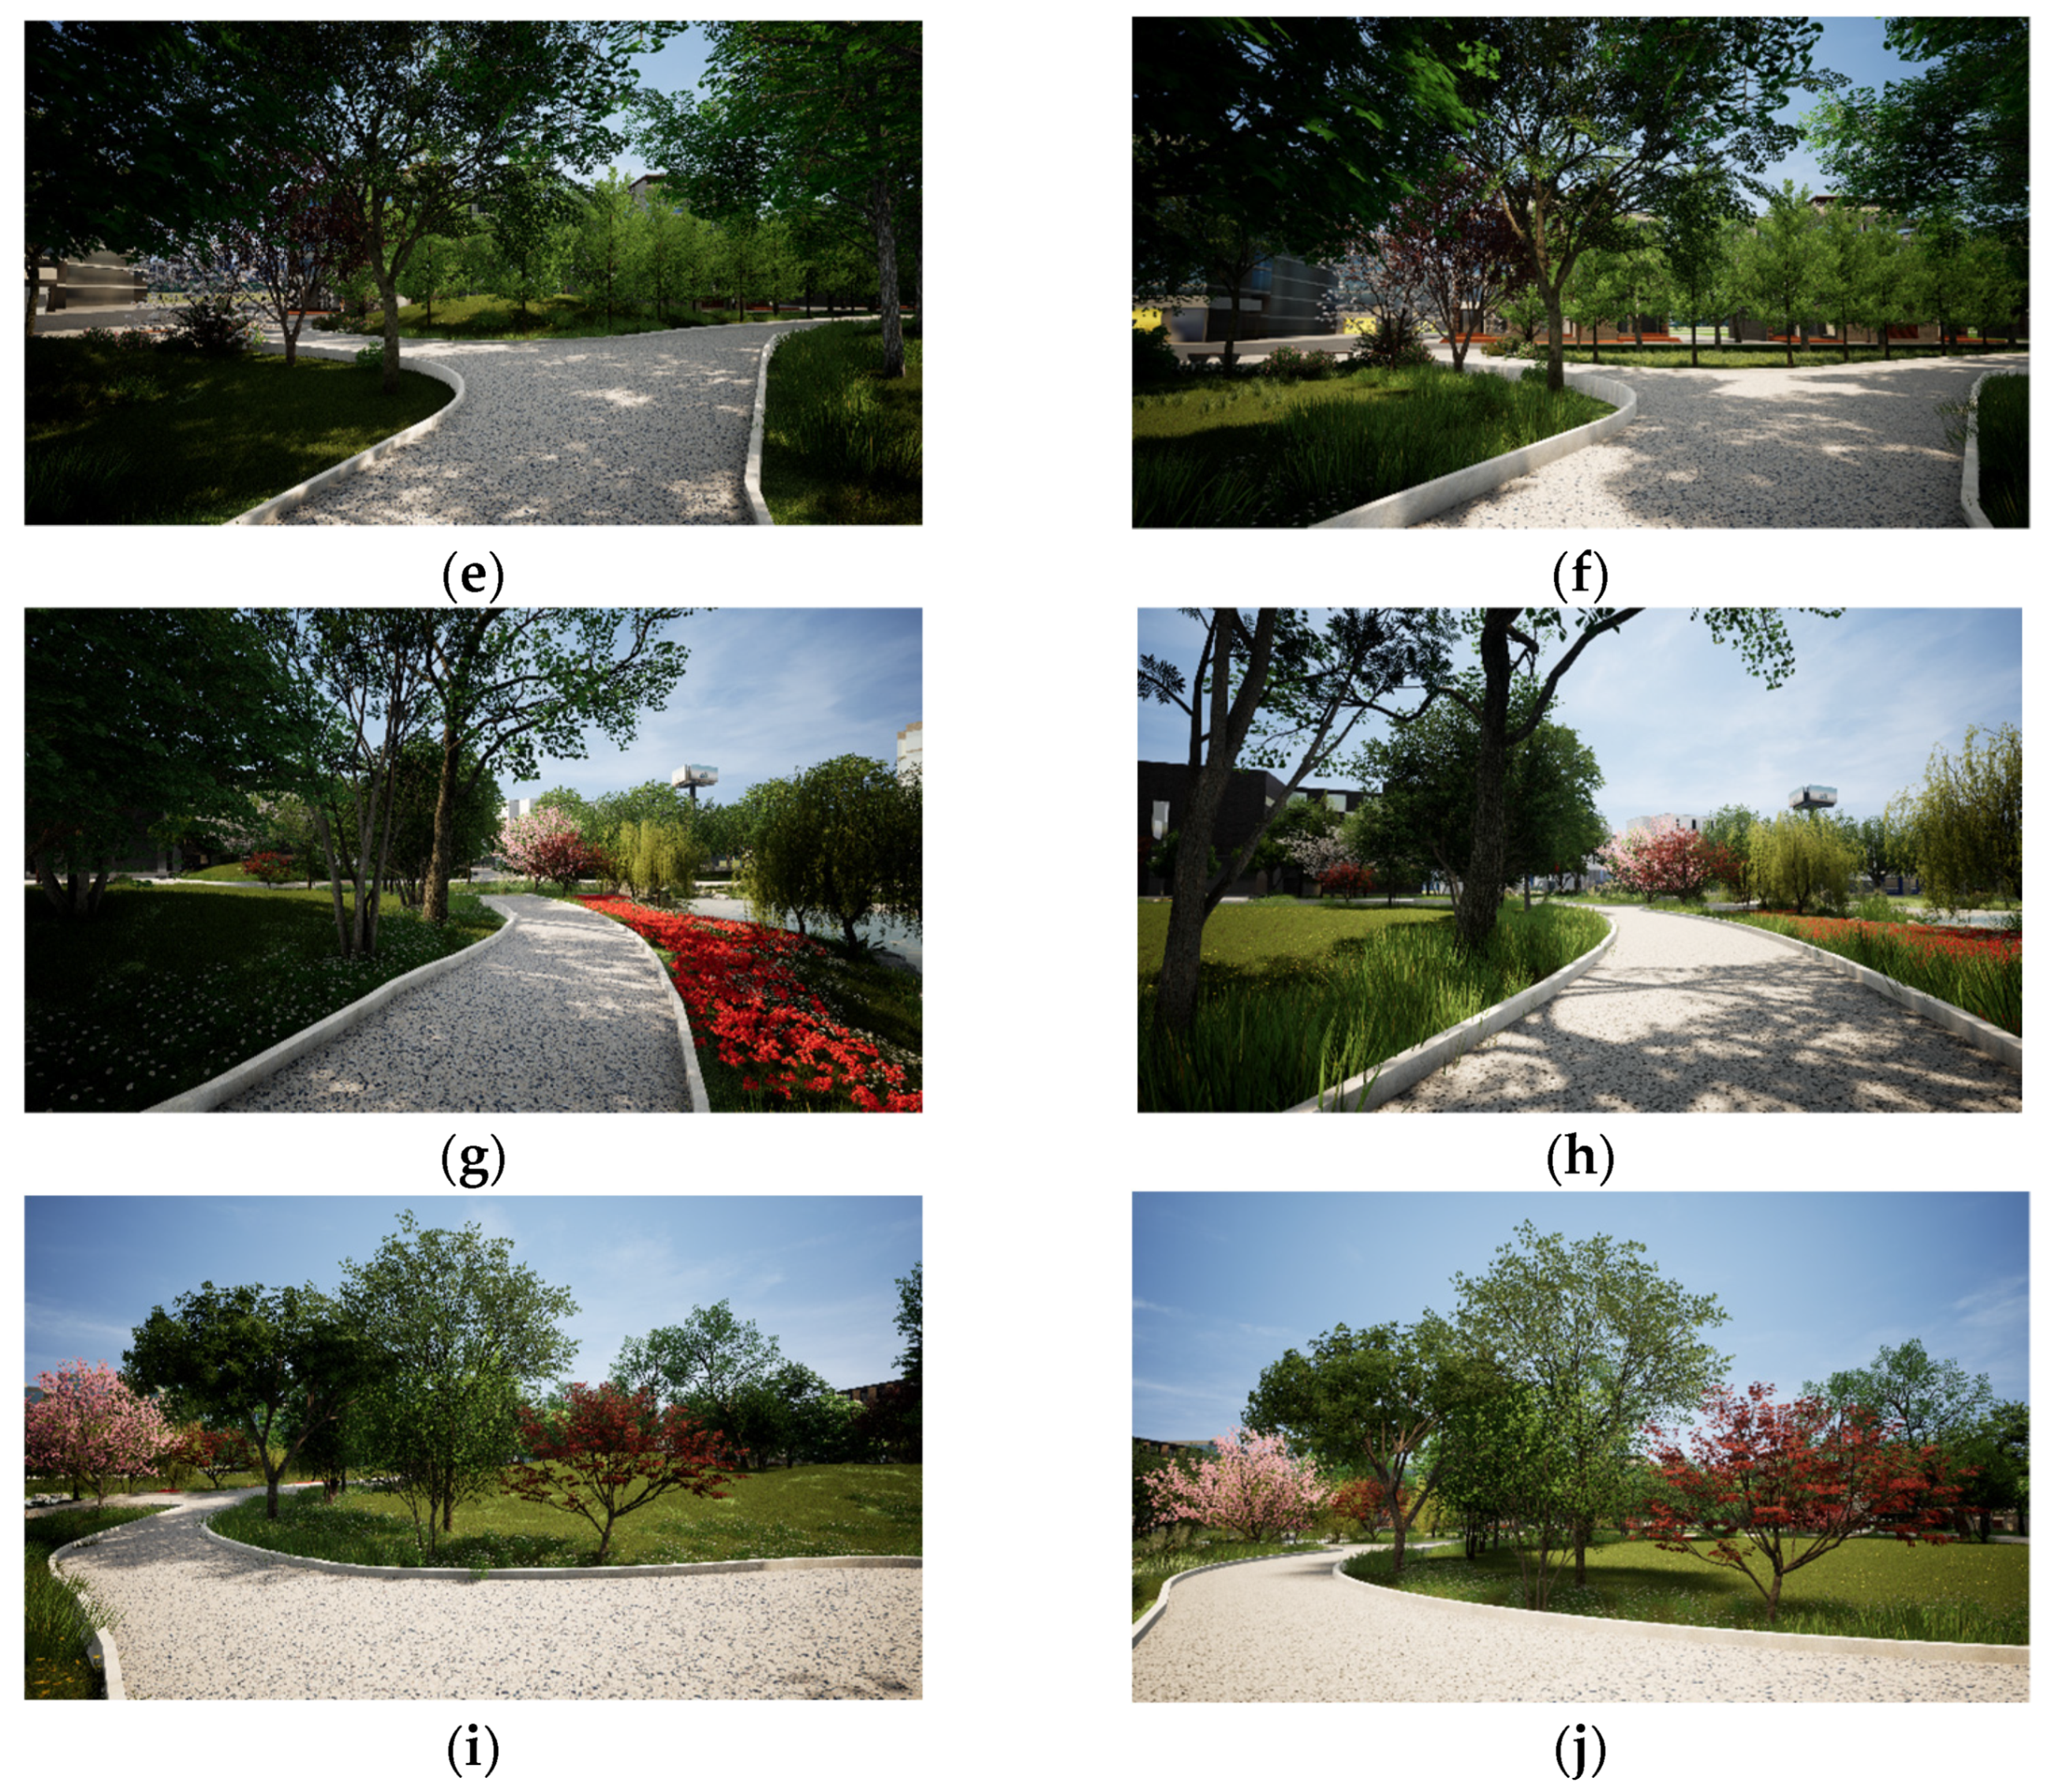
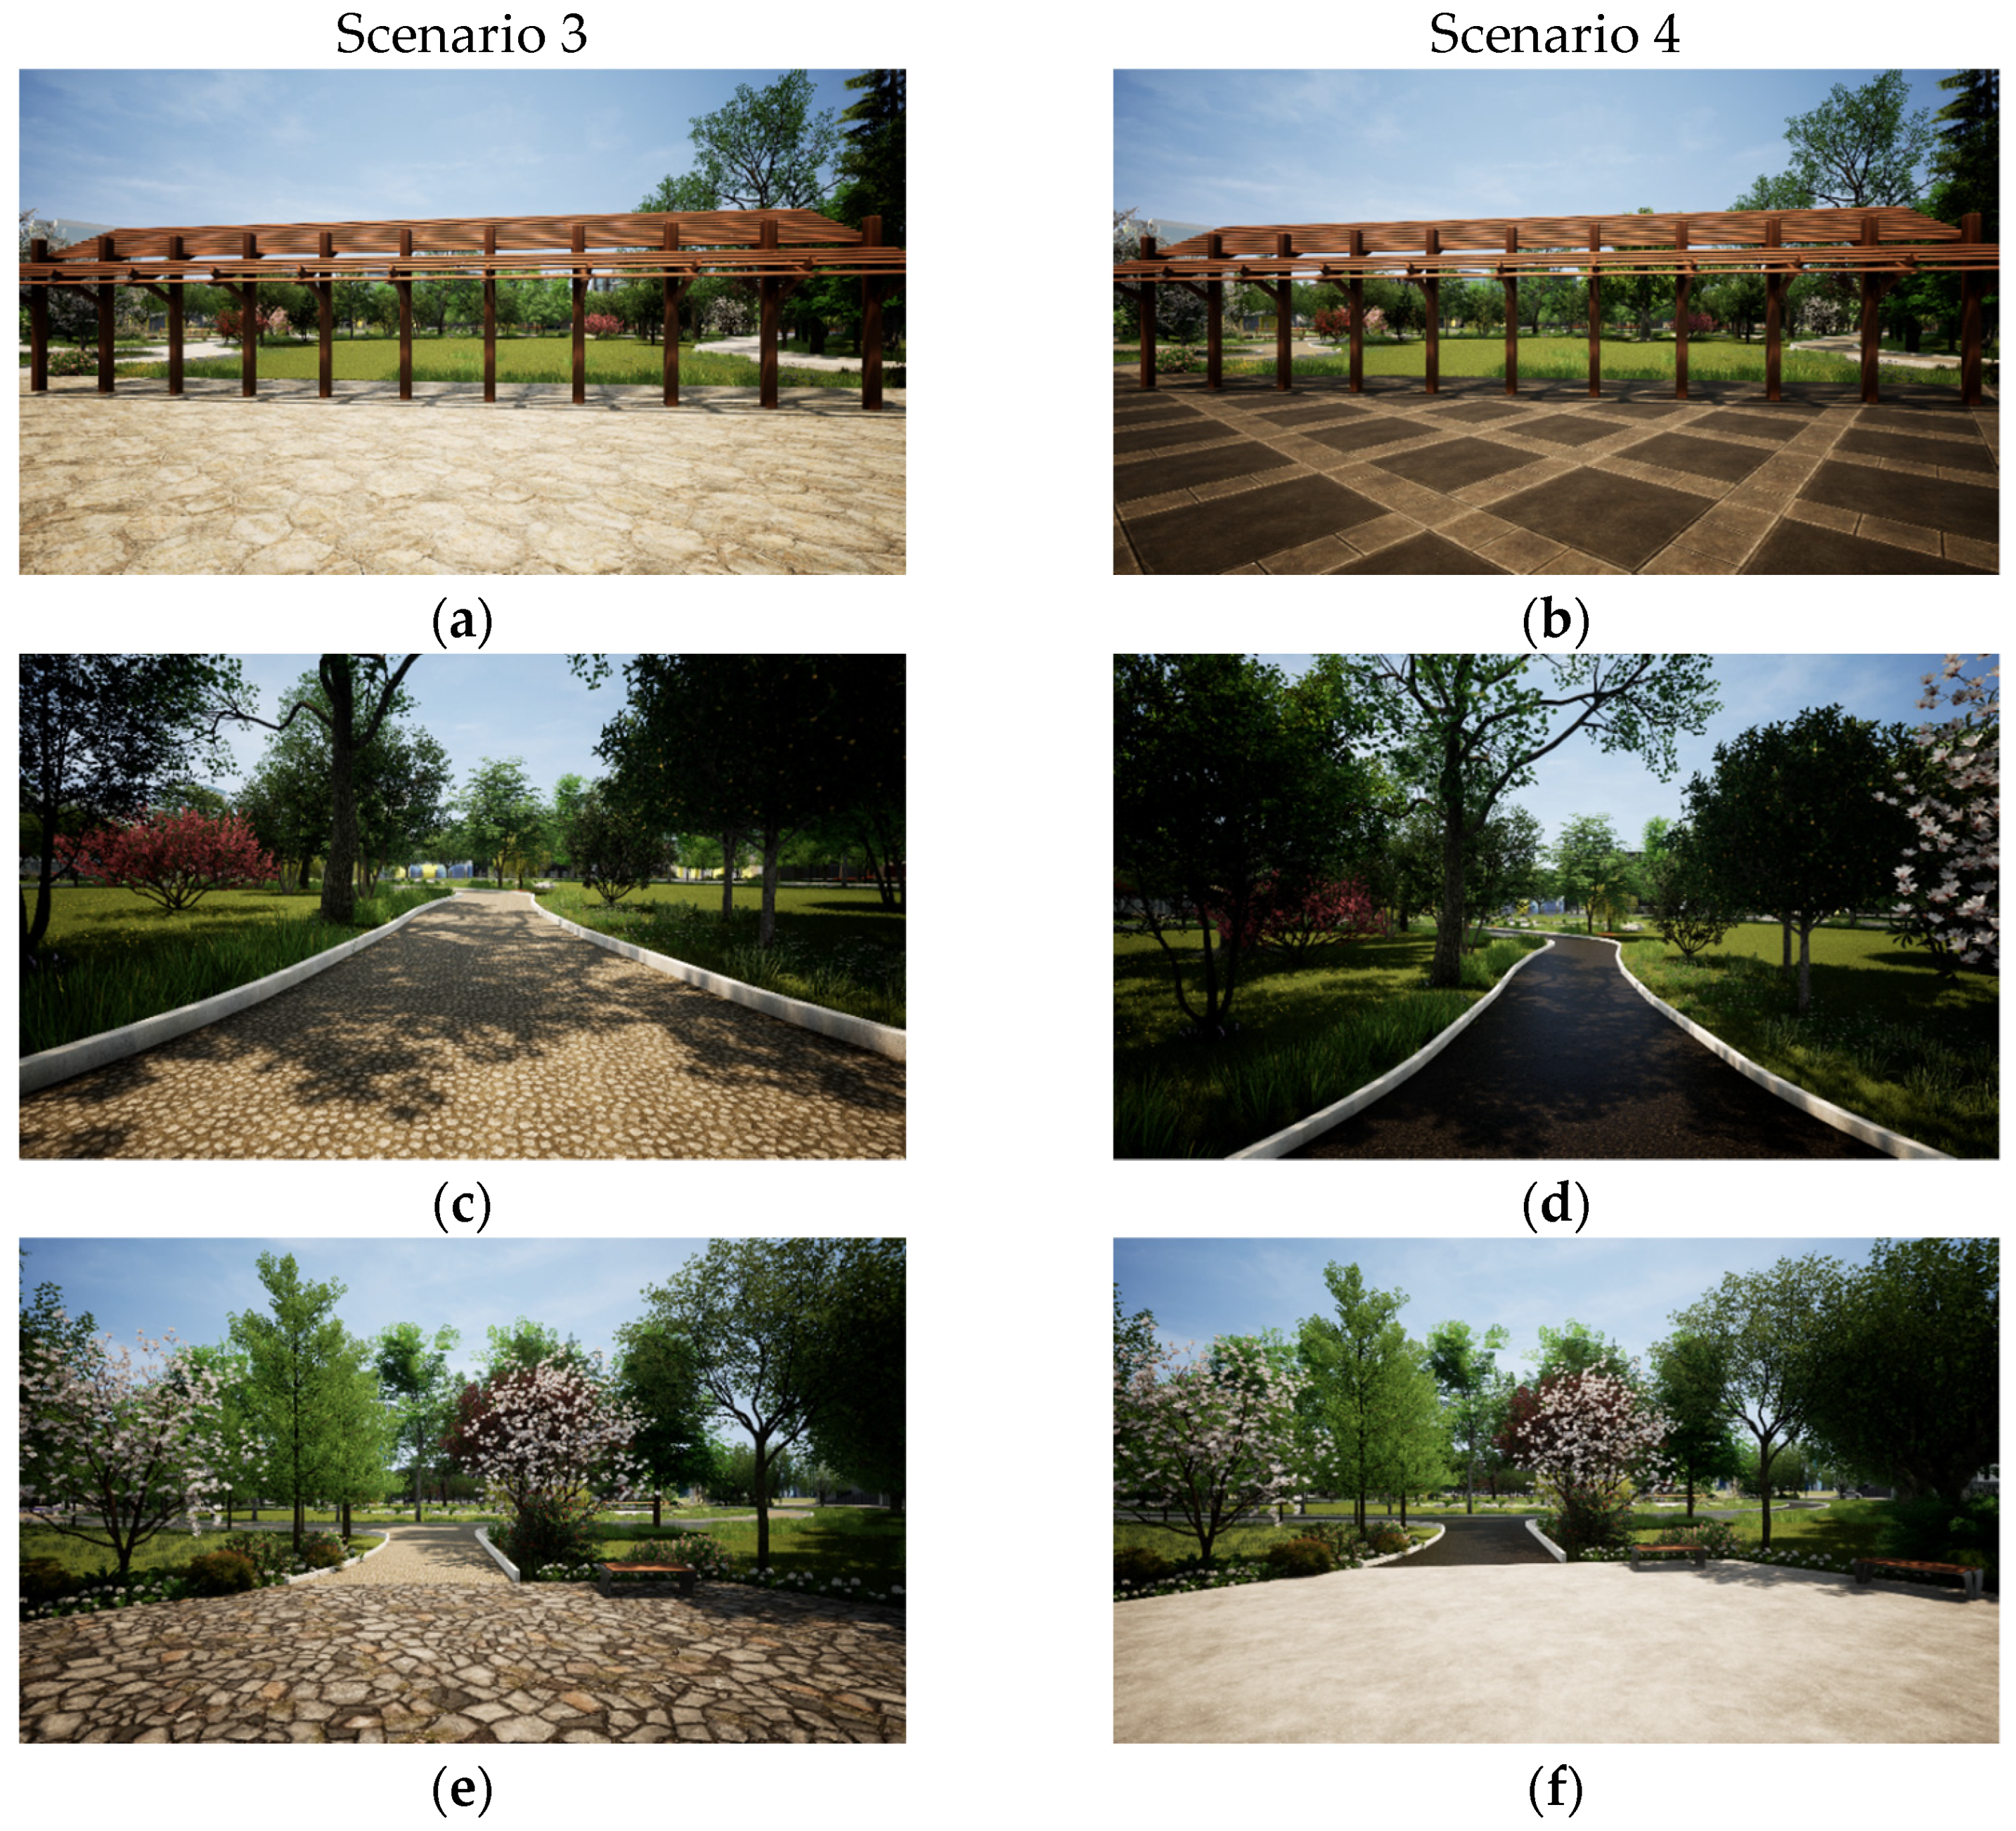
2.1.4. Procedure and Experimental Scene Setting
2.2. Data Analysis
2.2.1. Data Pre-Processing
2.2.2. Statistical Analysis
3. Results
3.1. Terrain Scene and Pavement Material
3.1.1. Effects on Physiological Recovery
3.1.2. Effects on Perceptual Restorability
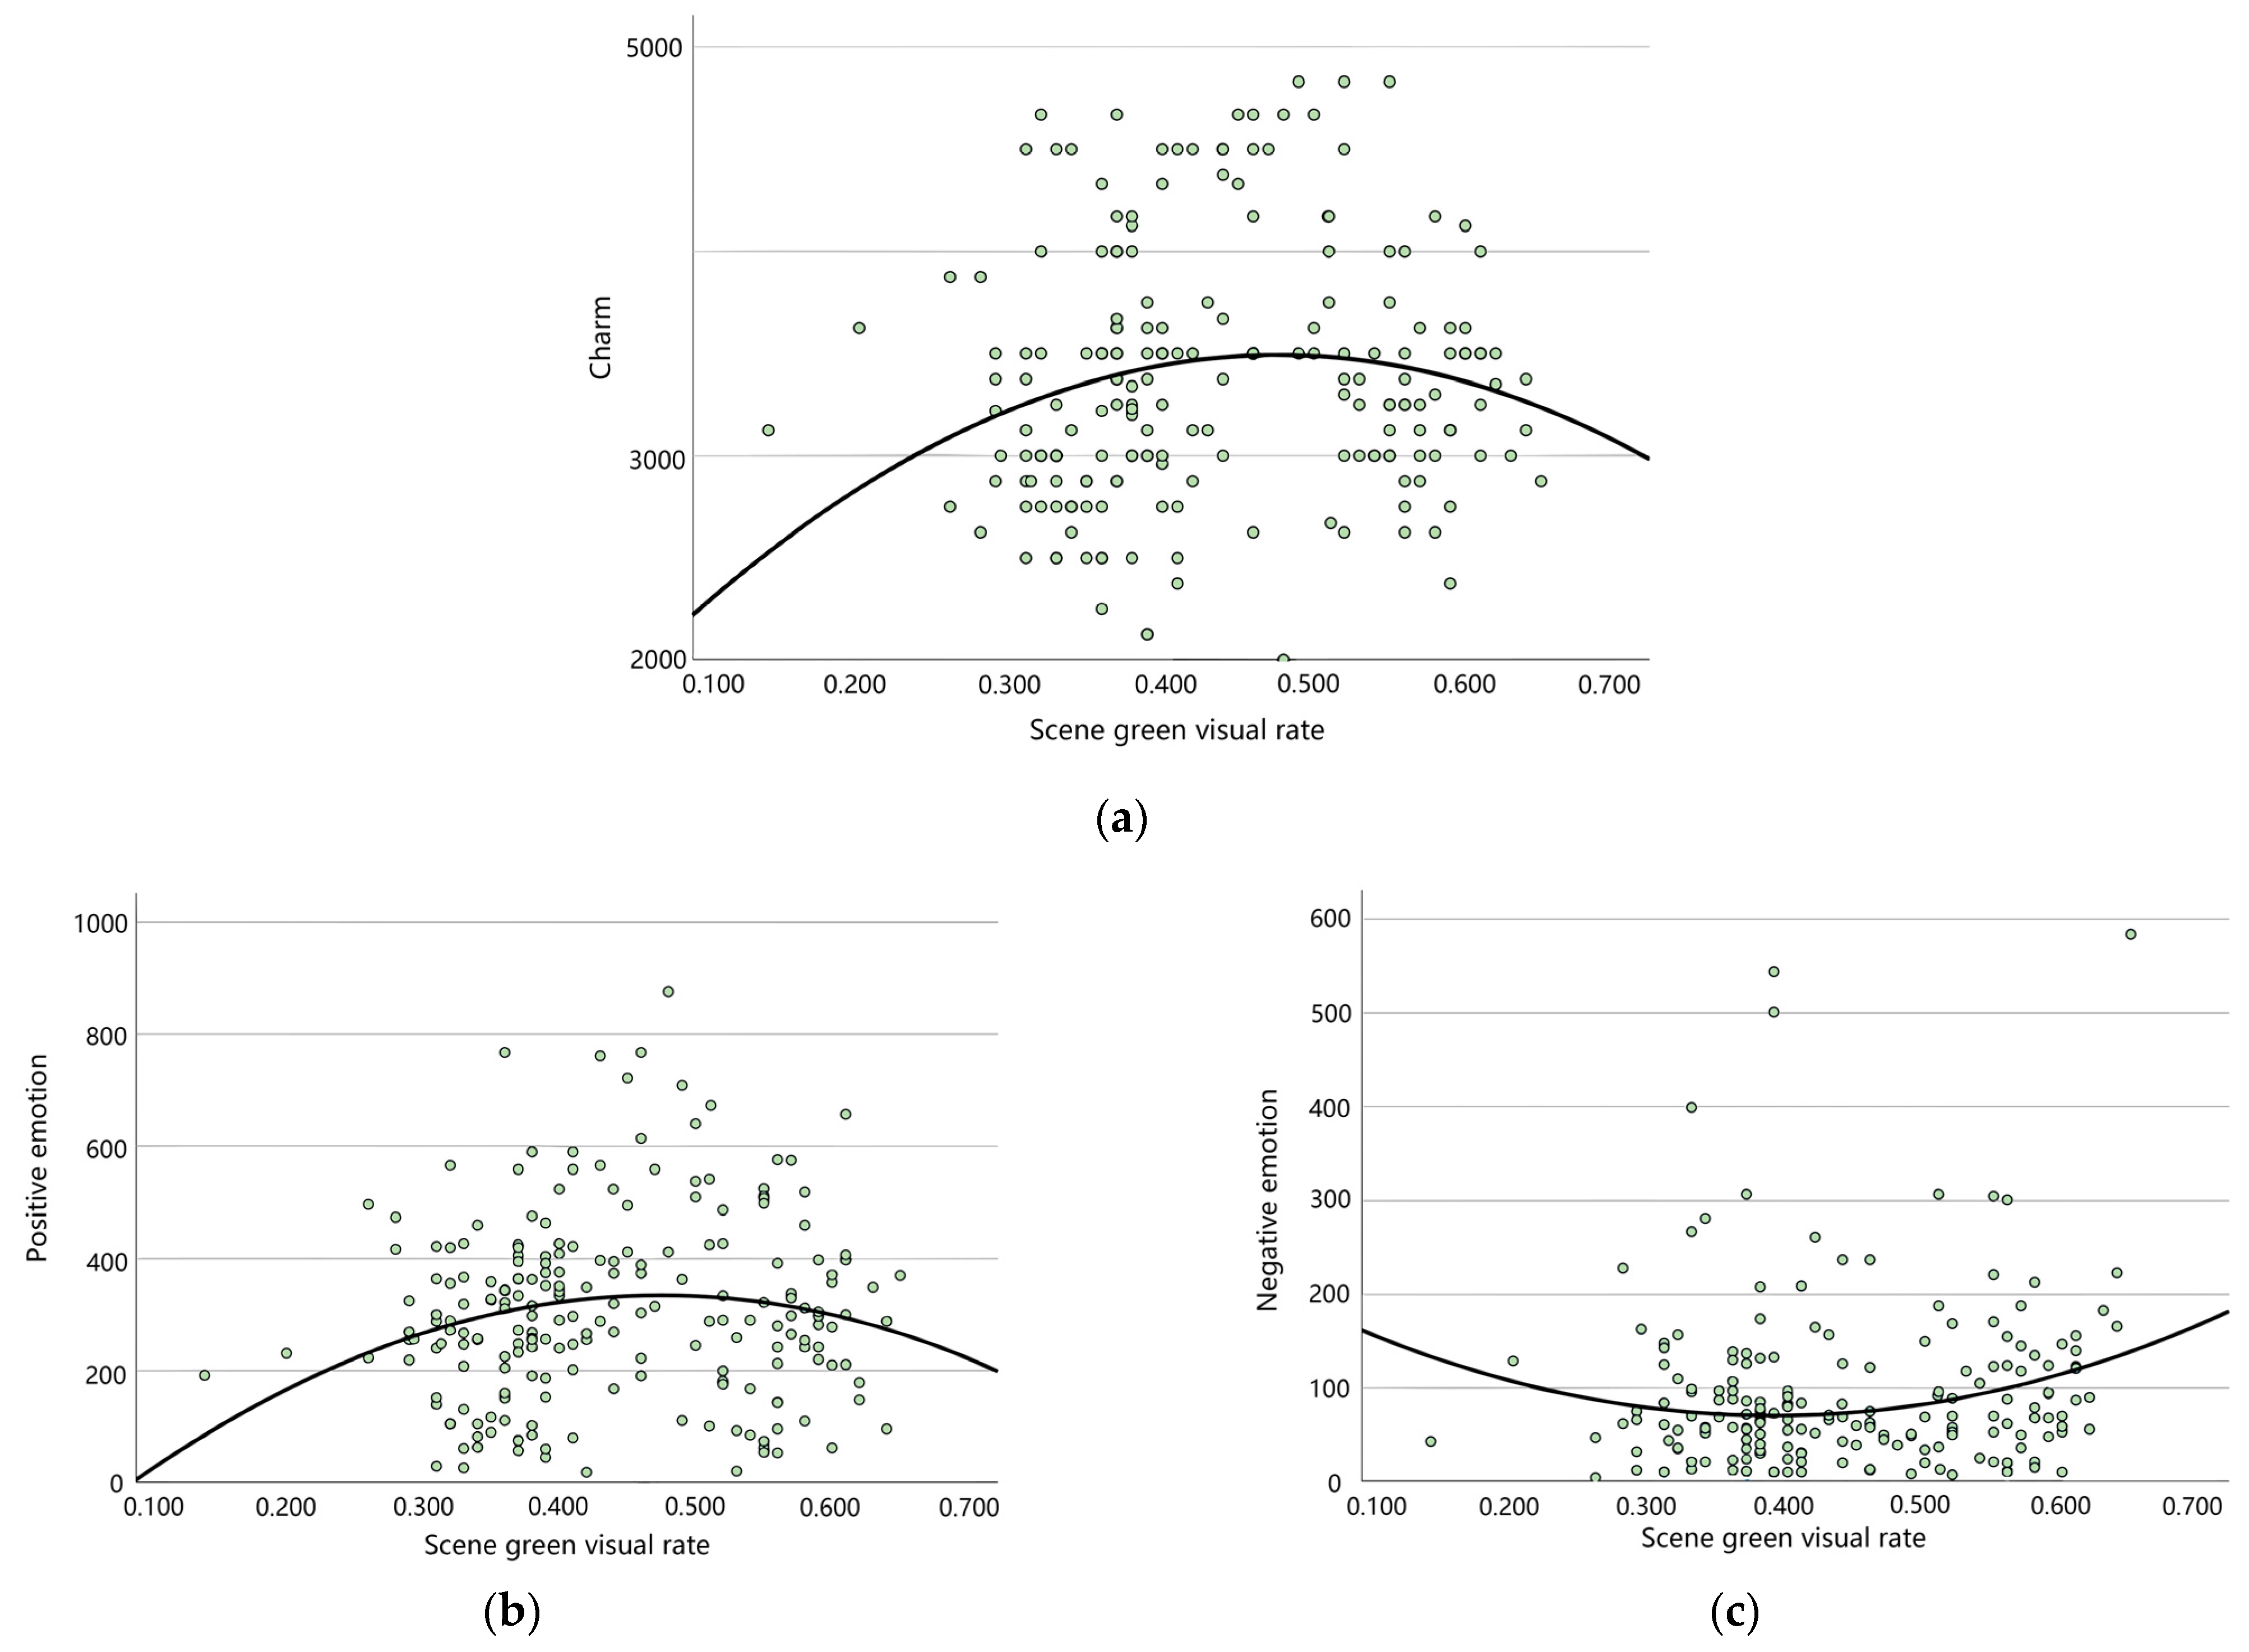
3.2. Scene Green Visual Rate
3.2.1. Physiological Recovery Effects
3.2.2. Perceptual Restorability Effects
4. Discussion
4.1. Terrain Scene and Pavement Material
4.2. Scene Green Visual Rate
4.3. Others
4.4. Research Innovation
4.5. Research Limitation and Further Study
5. Conclusions
5.1. Terrain Scene and Pavement Material
5.2. Scene Green Visual Rate
Author Contributions
Funding
Data Availability Statement
Acknowledgments
Conflicts of Interest
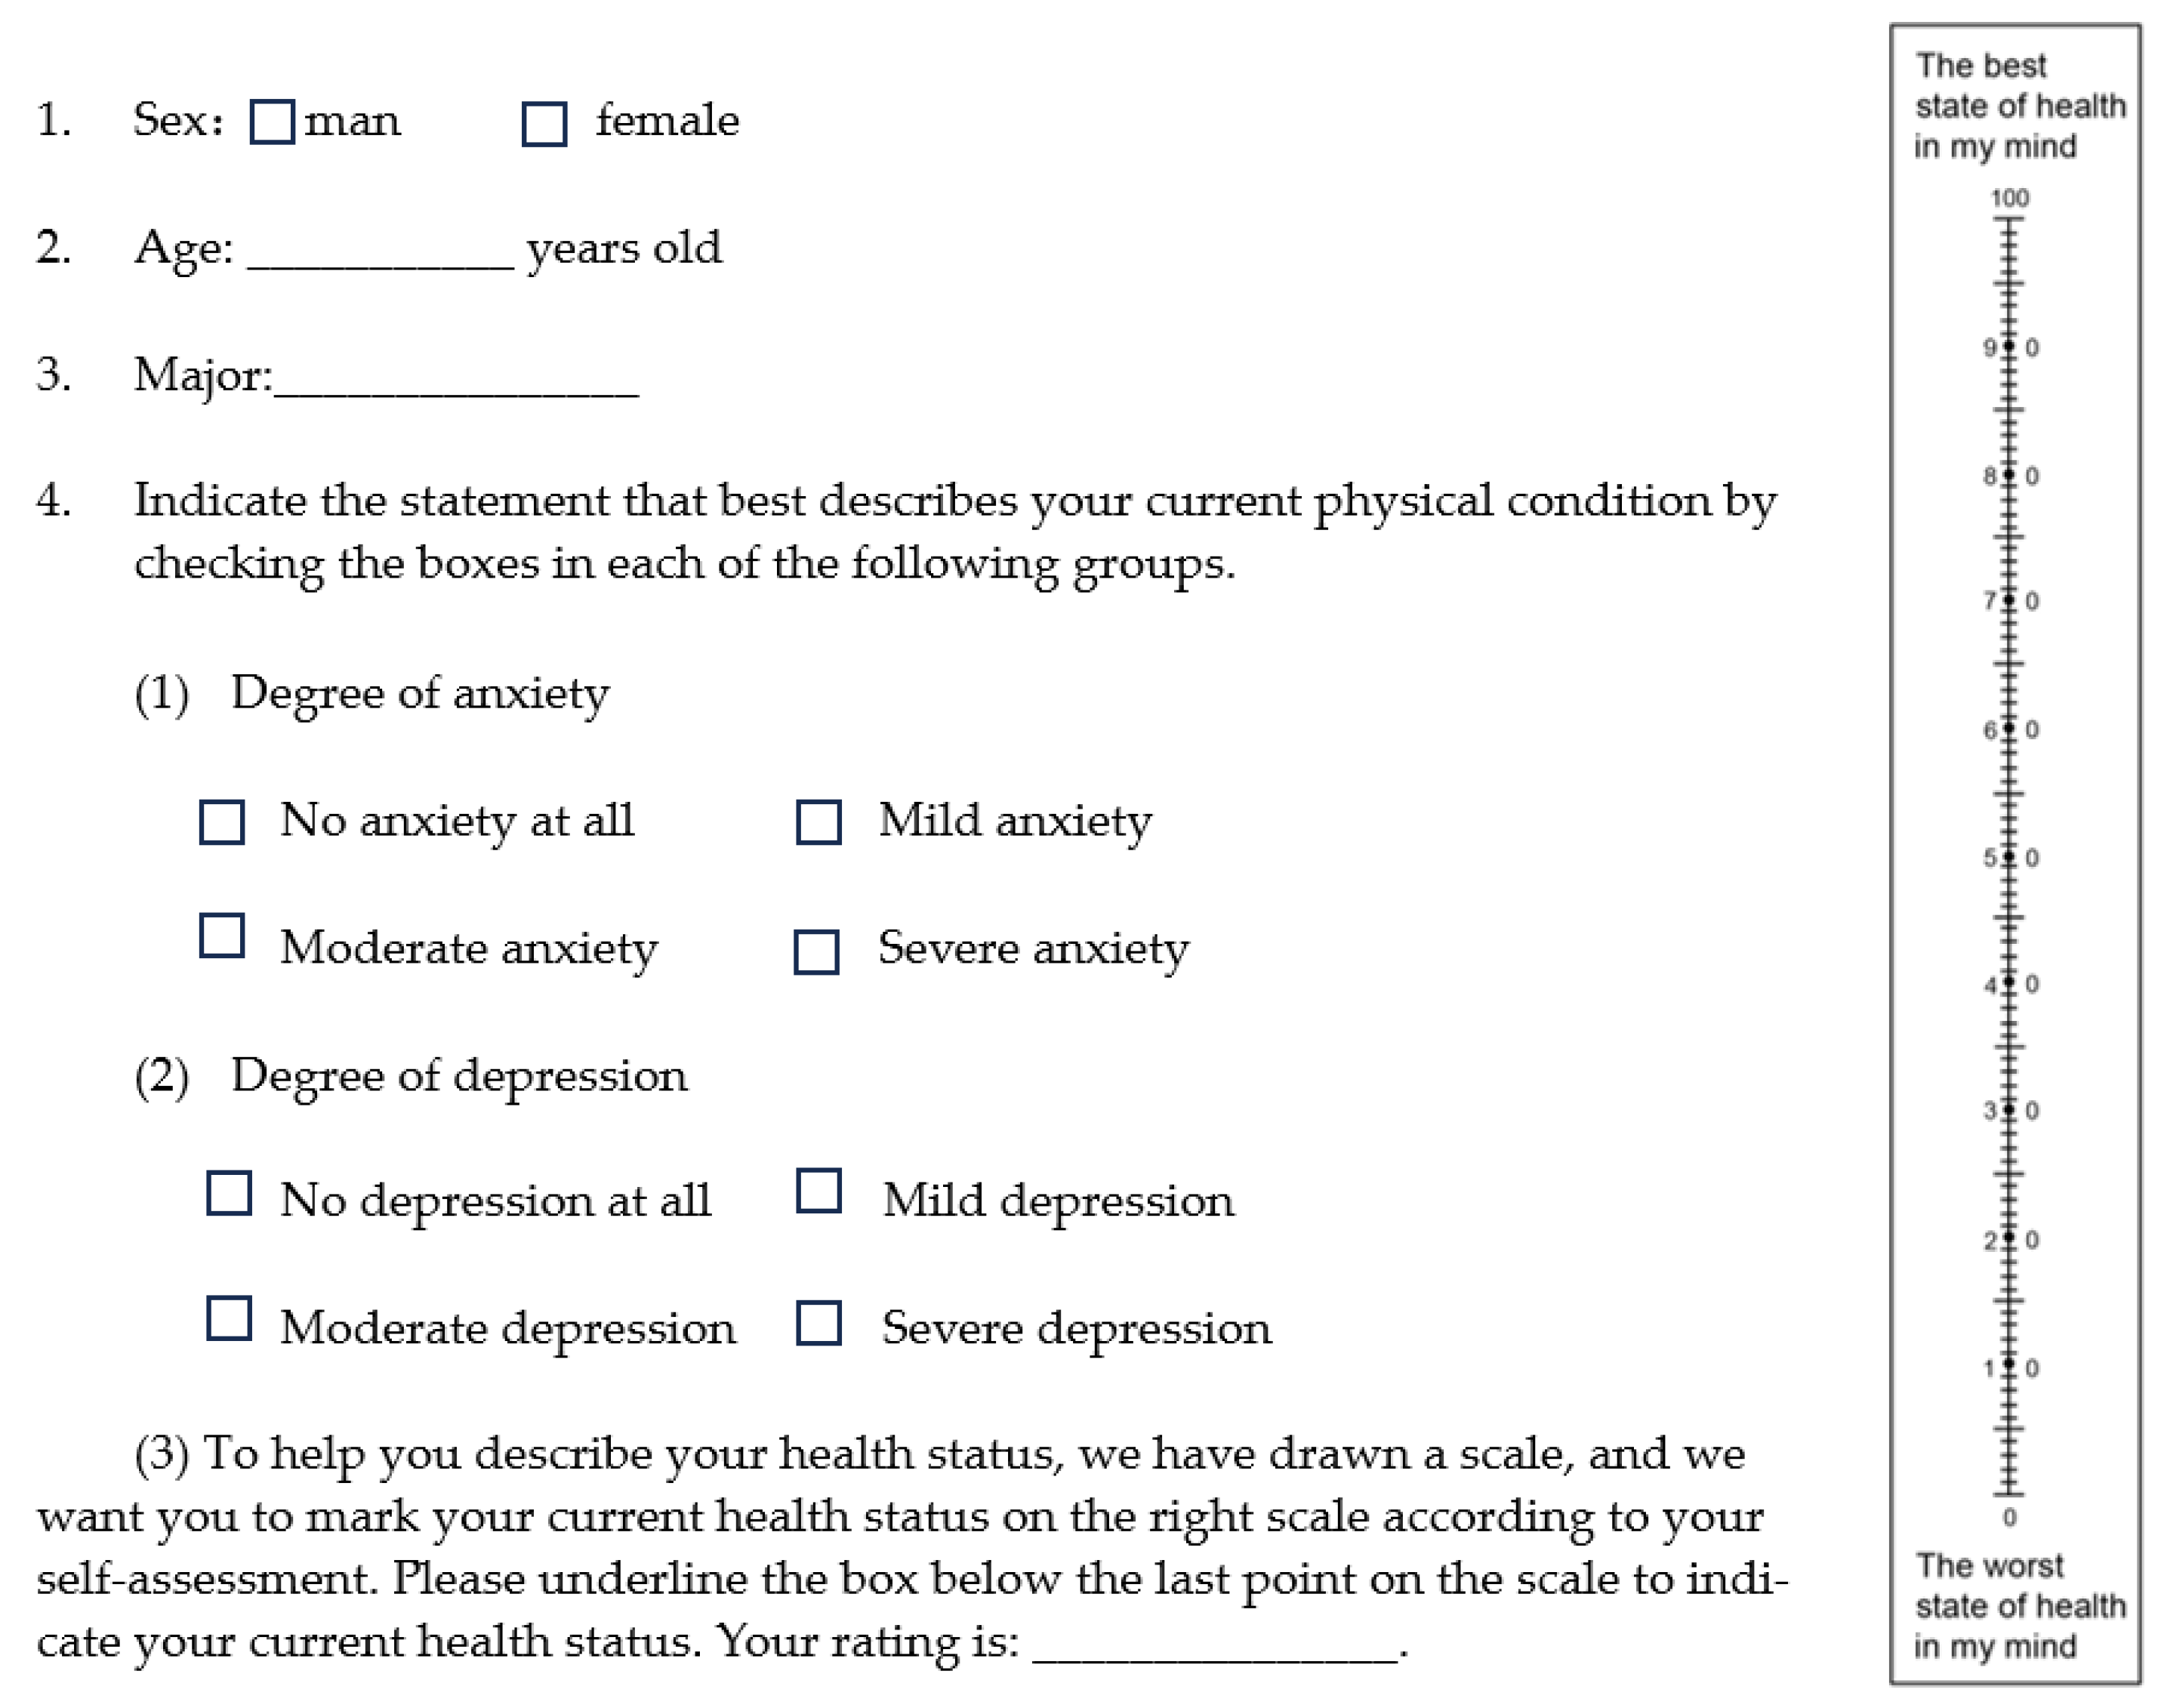
Appendix A

| Mean (SD) | Min | Max | Skewness | Kurtosis | |
|---|---|---|---|---|---|
| Depression self-rated results | 2.03 (0.135) | 1 | 4 | 0.631 | 0.320 |
| Anxiety self-rated results | 1.42 (0.108) | 1 | 4 | 1.986 | 5.628 |
| Health self-rated results | 73.03 (2.890) | 20 | 100 | −1.132 | 1.315 |
| Mean (SD) | Min | Max | Skewness | Kurtosis | |
|---|---|---|---|---|---|
| Green visual rate | 0.448 (0.07) | 3.61 (0.12) | 3.50 (0.12) | 2.21 (0.10) | 3.43 (0.13) |
| Total Points Mean (SD) | Scene Recovery Feature Dimension | ||||
|---|---|---|---|---|---|
| Distancing Mean (SD) | Charm Mean (SD) | Extensibility Mean (SD) | Compatibility Mean (SD) | ||
| Non-terrain scenes | 3.18 (0.07) | 3.61 (0.12) | 3.50 (0.12) | 2.21 (0.10) | 3.43 (0.13) |
| Terrain scenes | 3.39 (0.06) | 3.70 (0.14) | 3.64 (0.15) | 2.32 (0.12) | 3.51 (0.12) |
| Levene Statistics | df1 | df2 | p | |
|---|---|---|---|---|
| SCL | 1.739 | 3 | 212 | 0.160 |
| RMMSD | 3.719 | 3 | 212 | * 0.012 |
| Statistics | df1 | df2 | p | |
|---|---|---|---|---|
| Welch | 0.628 | 3 | 104.529 | 0.599 |
| Brown–Forsythe | 1.246 | 3 | 51.623 | 0.303 |
| Quadratic Sum | df | Mean Square | f | p | ||
|---|---|---|---|---|---|---|
| SCL | Between groups | 53.869 | 3 | 17.956 | 0.800 | 0.495 |
| Within group | 4758.836 | 212 | 22.447 | |||
| Total | 4812.705 | 215 | ||||
| Indicator | Green Vision Rating | Mean (SD) | 95% Confidence Interval for the Mean | Min | Max | |
|---|---|---|---|---|---|---|
| Low | High | |||||
| SCL | Lower green vision (n = 58) | −4.147 (5.565) | −5.611 | −2.684 | −29.720 | 7.060 |
| Low green vision (n = 53) | −3.436 (3.863) | −4.501 | −2.371 | −19.090 | 2.640 | |
| High green vision (n = 52) | −3.232 (4.059) | −4.362 | −2.102 | −22.790 | 5.990 | |
| Higher green vision (n = 53) | −2.786 (5.147) | −4.204 | −1.367 | −16.150 | 16.030 | |
| Total (n = 216) | −3.418 (4.731) | −4.053 | −2.784 | −29.720 | 16.030 | |
| RMSSD | Lower green vision (n = 58) | 10.786 (70.724) | −7.810 | 29.382 | −427.870 | 205.840 |
| Low green vision (n = 53) | 13.056 (21.451) | 7.144 | 18.969 | −53.370 | 71.610 | |
| High green vision (n = 52) | 175.502 (1043.055) | −114.887 | 465.890 | −28.340 | 7545.790 | |
| Higher green vision (n = 53) | 17.362 (36.986) | 7.167 | 27.556 | −53.370 | 205.950 | |
| Total (n = 216) | 52.610 (514.451) | −16.385 | 121.605 | −427.870 | 7545.790 | |
| Levene Statistics | df1 | df2 | p |
|---|---|---|---|
| Scene green vision level effect on perceptual restorative evaluation | |||
| 2.891 | 3 | 212 | * 0.036 |
| Scene green vision level effect on positive emotions | |||
| 1.501 | 3 | 212 | 0.215 |
| Scene green vision level effect on negative emotions | |||
| 0.398 | 3 | 212 | 0.755 |
| Statistics | df1 | df2 | p | |
|---|---|---|---|---|
| Welch | 3.198 | 3 | 116.213 | 0.026 |
| Brown–Forsythe | 3.286 | 3 | 196.498 | 0.022 |
| Green Vision Rating (I) | Green Vision Rating (J) | Mean Difference (I−J) | p | |
|---|---|---|---|---|
| Multiple perceptual restorative evaluation comparisons | Lower green vision (<37%) | Low green vision (37%–42%) | −0.134 (−0.393, 0.124) | 0.664 |
| High green vision (42%–54%) | −0.266706 (−0.506, −0.02) | * 0.021 | ||
| Higher green vision (>54%) | −0.185 (−0.397, 0.026) | 0.116 | ||
| Low green vision (37%–42%) | Lower green vision (<37%) | 0.134 (−0.124, 0.393) | 0.664 | |
| High green vision (42%–54%) | −0.132 (−0.393, 0.129) | 0.688 | ||
| Higher green vision (>54%) | −0.051 (−0.287, 0.185) | 0.993 | ||
| High green vision (42%–54%) | Lower green vision (<37%) | 0.266706 (0.028, 0.506) | * 0.021 | |
| Low green vision (37%–42%) | 0.132 (−0.129, 0.393) | 0.688 | ||
| Higher green vision (>54%) | 0.081 (−0.133, 0.295) | 0.893 | ||
| Higher green vision (>54%) | Lower green vision (<37%) | 0.185 (−0.026, 0.397) | 0.116 | |
| Low green vision (37%–42%) | 0.051 (−0.185, 0.287) | 0.993 | ||
| High green vision (42%–54%) | −0.081 (−0.295, 0.133) | 0.893 | ||
| Negative emotions affect multiple comparisons | Lower green vision (<37%) | Low green vision (37%–42%) | 11.346 (−72.46, 95.15) | 0.790 |
| High green vision (42%–54%) | 61.104 (−23.12, 145.33) | 0.154 | ||
| Higher green vision (>54%) | −57.126 (−140.93, 26.68) | 0.180 | ||
| Low green vision (37%–42%) | Lower green vision (<37%) | −11.346 (−95.15, 72.46) | 0.790 | |
| High green vision (42%–54%) | 49.758 (−36.32, 135.84) | 0.256 | ||
| Higher green vision (>54%) | −68.472 (−154.14, 17.20) | 0.117 | ||
| High green vision (42%–54%) | Lower green vision (<37%) | −61.104 (−145.33, 23.12) | 0.154 | |
| Low green vision (37%–42%) | −49.758 (−135.84, 36.32) | 0.256 | ||
| Higher green vision (>54%) | −118.230 (−204.31, −32.15) | * 0.007 | ||
| Higher green vision (>54%) | Lower green vision (<37%) | 57.126 (−26.68, 140.93) | 0.180 | |
| Low green vision (37%–42%) | 68.472 (−17.20, 154.14) | 0.117 | ||
| High green vision (42%–54%) | 118.230 (32.15, 204.31) | * 0.007 |
| Y | X | Unstandardised Regression Coefficient | Standardised Regression Coefficient | p | t | ||
|---|---|---|---|---|---|---|---|
| B | SE | Beta | |||||
| Four dimensions | Charm | R2 = 0.045, Adjust R2 = 0.036 | F = 5.066, * p = 0.007 | ||||
| (constant) | 0.457 | 0.989 | 0.644 | 0.462 | |||
| Green visual index | 13.632 | 4.453 | * 0.002 | 3.061 | |||
| (Green visual index)2 | −14.207 | 4.836 | * 0.004 | −2.938 | |||
| Distance | R2 = 0.0028, Adjust R2 = −0.0018 | F = 0.6163, p = 0.4333 | |||||
| (constant) | 3.4482 | 0.2443 | <2 × 10⁻¹⁶ | 14.113 | |||
| Green visual index | 0.4172 | 0.5315 | 0.433 | 0.785 | |||
| (Green visual index)2 | 0.4172 | 0.5315 | 0.433 | 0.785 | |||
| Extensibility | R2 = 0.0022, Adjust R2 = −0.0024 | F = 0.4823, p = 0.4881 | |||||
| (constant) | 2.4999 | 0.2258 | <2 × 10⁻¹⁶ | 11.073 | |||
| Green visual index | −0.3411 | 0.4911 | 0.488 | −0.695 | |||
| (Green visual index)2 | −0.3411 | 0.4911 | 0.488 | −0.695 | |||
| Compatibility | R2 = 0.0093, Adjust R2 = 0.0047 | F = 2.014, p = 0.1573 | |||||
| (constant) | 3.0760 | 0.2495 | <2 × 10⁻¹⁶ | 12.327 | |||
| Green visual index | 0.7703 | 0.5428 | 0.157 | 1.419 | |||
| (Green visual index)2 | 0.7703 | 0.5428 | 0.157 | 1.419 | |||
| Emotions | Positive emotions | R2 = 0.028, Adjust R2 = 0.019 | F = 3.084, p = 0.048 * | ||||
| (constant) | −188.827 | 205.905 | 0.360 | −0.917 | |||
| Green visual index | 2160.657 | 927.109 | 1.344 | 0.021 | 2.331 | ||
| (Green visual index)2 | −2228.868 | 1006.696 | −1.277 | *0.028 | −2.214 * | ||
| Negative emotions | R2 = 0.033, Adjust R2 = 0.024 | F = 3.627, p = 0.028 * | |||||
| (constant) | 232.496 | 112.383 | 0.040 | 2.069 | |||
| Green visual index | −810.122 | 506.019 | −0.921 | 0.111 | −1.601 | ||
| (Green visual index)2 | 1012.957 | 549.458 | 1.061 | * 0.047 | 1.844 | ||
Appendix B
| One Point—Five Points | Scene A | Scene B | Scene C | Scene D | Scene E | |
|---|---|---|---|---|---|---|
| 1 | Here I feel relieved | |||||
| 2 | It provides a break from my daily routine | |||||
| 3 | Here I can temporarily escape from the stress of daily life and study | |||||
| 4 | This place helps me relax | |||||
| 5 | This will help me reduce unnecessary attention consumption | |||||
| 6 | I find this scene attractive | |||||
| 7 | My attention is drawn to many interesting things | |||||
| 8 | I want to know more about this place | |||||
| 9 | There is so much to explore and discover here | |||||
| 10 | I wish I had more time to spend looking around | |||||
| 11 | It is boring here | |||||
| 12 | It is charming here | |||||
| 13 | Nothing to look at here | |||||
| 14 | There are too many things here | |||||
| 15 | I am confused here | |||||
| 16 | There are too many things here to distract me | |||||
| 17 | It is chaotic here | |||||
| 18 | This is the place for me | |||||
| 19 | I can do what I want here | |||||
| 20 | I feel like I belong here | |||||
| 21 | I can enjoy happiness here | |||||
| 22 | I feel so connected to the scene |
| One Point—One Hundred Points | Scene A | Scene B | Scene C | Scene D | Scene E | |
|---|---|---|---|---|---|---|
| 1 | I am interested | |||||
| 2 | I am restless | |||||
| 3 | I am excited | |||||
| 4 | I am upset | |||||
| 5 | I am full of energy | |||||
| 6 | I am guilty | |||||
| 7 | I am terrified | |||||
| 8 | I feel trepidation | |||||
| 9 | I am passionate | |||||
| 10 | I am proud | |||||
| 11 | I am angry | |||||
| 12 | I am vigilant | |||||
| 13 | I feel ashamed | |||||
| 14 | I am inspired | |||||
| 15 | I feel nervous | |||||
| 16 | I am determined | |||||
| 17 | I am focused | |||||
| 18 | I am disturbed | |||||
| 19 | I am alive | |||||
| 20 | I am scared |
References
- Bornioli, A.; Subiza-Perez, M. Restorative urban environments for healthy cities: A theoretical model for the study of restorative experiences in urban built settings. Landsc. Res. 2023, 48, 152–163. [Google Scholar] [CrossRef]
- Chung, W.K.; Lin, M.; Chau, C.K.; Masullo, M.; Pascale, A.; Leung, T.M.; Xu, M. On the study of the psychological effects of blocked views on dwellers in high dense urban environments. Landsc. Urban Plan. 2022, 221, 104379. [Google Scholar] [CrossRef]
- Ferrari, A.J.; Santomauro, D.F.; Herrera, A.M.M.; Shadid, J.; Ashbaugh, C.; Erskine, H.E.; Charlson, F.J.; Degenhardt, L.; Scott, J.G.; McGrath, J.J.; et al. Global, regional, and national burden of 12 mental disorders in 204 countries and territories, 1990–2019: A systematic analysis for the Global Burden of Disease Study 2019. Lancet Psychiatry 2022, 9, 137–150. [Google Scholar] [CrossRef]
- Beiter, R.; Nash, R.; McCrady, M.; Rhoades, D.; Linscomb, M.; Clarahan, M.; Sammut, S. The prevalence and correlates of depression, anxiety, and stress in a sample of college students. J. Affect. Disord. 2015, 173, 90–96. [Google Scholar] [CrossRef] [PubMed]
- Yang, T.; Barnett, R.; Fan, Y.; Li, L. The effect of urban green space on uncertainty stress and life stress: A nationwide study of university students in China. Health Place 2019, 59, 10219. [Google Scholar] [CrossRef]
- Diethelm, O.; Jones, M.R. Influence of anxiety on attention, learning, retention and thinking. Arch. Neurol. Psychiatry 1947, 58, 325–336. [Google Scholar] [CrossRef]
- Ryan, I. Anxious Generation: A Review of the Relationship Between Anxiety Disorders and Cardiovascular Disease in Youth. Curr. Epidemiol. Rep. 2020, 7, 39–43. [Google Scholar] [CrossRef]
- Baik, C.; Larcombe, W.; Brooker, A. How universities can enhance student mental wellbeing: The student perspective. High. Educ. Res. Dev. 2019, 38, 674–687. [Google Scholar]
- Markevych, I.; Schoierer, J.; Hartig, T.; Chudnovsky, A.; Hystad, P.; Dzhambov, A.M.; de Vries, S.; Triguero-Mas, M.; Brauer, M.; Nieuwenhuijsen, M.J.; et al. Exploring pathways linking greenspace to health: Theoretical and methodological guidance. Environ. Res. 2017, 158, 301–317. [Google Scholar] [CrossRef]
- Collins, C.; Haase, D.; Heiland, S.; Kabisch, N. Urban green space interaction and wellbeing—Investigating the experience of international students in Berlin during the first COVID-19 lockdown. Urban For. Urban Green. 2022, 70, 127543. [Google Scholar] [CrossRef]
- Hystad, P.; Payette, Y.; Noisel, N.; Boileau, C. Green space associations with mental health and cognitive function: Results from the Quebec CARTaGENE cohort. Environ. Epidemiol. 2019, 3, e040. [Google Scholar] [CrossRef] [PubMed]
- Wang, X.; Zhou, Q.; Zhang, M.; Zhang, Q. Exercise in the Park or Gym? The Physiological and Mental Responses of Obese People Walking in Different Settings at Different Speeds: A Parallel Group Randomized Trial. Front. Psychol. 2021, 12, 728826. [Google Scholar] [CrossRef] [PubMed]
- Hou, J.; Wang, Y.; Zhou, D.; Gao, Z. Environmental Effects from Pocket Park Design According to District Planning Patterns-Cases from Xi’an, China. Atmosphere 2022, 13, 300. [Google Scholar] [CrossRef]
- Wyles, K.J.; White, M.P.; Hattam, C.; Pahl, S.; King, H.; Austen, M. Are some natural environments more psychologically beneficial than others? The importance of type and quality on connectedness to nature and psychological restoration. Environ. Behav. 2019, 51, 111–143. [Google Scholar] [CrossRef]
- Kaplan, S. The Restorative Environment: Nature and Human Experience; Timber Press: Portland, OR, USA, 1992. [Google Scholar]
- Ulrich, R.S. Aesthetic and affective response to natural environment. In Behavior and the Natural Environment; Springer: Berlin/Heidelberg, Germany, 1983; pp. 85–125. [Google Scholar]
- Nukarinen, T.; Rantala, J.; Korpela, K.; Browning, M.H.E.M.; Istance, H.O.; Surakka, V.; Raisamo, R. Measures and modalities in restorative virtual natural environments: An integrative narrative review. Comput. Hum. Behav. 2022, 126, 107008. [Google Scholar] [CrossRef]
- Berto, R. Assessing the restorative value of the environment: A study on the elderly in comparison with young adults and adolescents. Int. J. Psychol. 2007, 42, 331–341. [Google Scholar] [CrossRef]
- Fang, M.Q.; Cheol, K.J. A Study on the Relationship between Young People’s Perceived Restorative Environment and Stress Relief in Urban Parks. Des. Res. 2021, 6, 105–120. [Google Scholar] [CrossRef]
- Lee, K.E.; Williams, K.J.H.; Sargent, L.D.; Williams, N.S.G.; Johnson, K.A. 40-second green roof views sustain attention: The role of micro-breaks in attention restoration. J. Environ. Psychol. 2015, 42, 182–189. [Google Scholar] [CrossRef]
- Akpinar, A. How perceived sensory dimensions of urban green spaces are associated with teenagers’ perceived restoration, stress, and mental health? Landsc. Urban Plan. 2021, 214, 104185. [Google Scholar] [CrossRef]
- Holt, E.W.; Lombard, Q.K.; Best, N.; Smiley-Smith, S.; Quinn, J.E. Active and Passive Use of Green Space, Health, and Well-Being amongst University Students. Int. J. Environ. Res. Public Health 2019, 16, 424. [Google Scholar] [CrossRef]
- Li, D.; Sullivan, W.C. Impact of views to school landscapes on recovery from stress and mental fatigue. Landsc. Urban Plan. 2016, 148, 149–158. [Google Scholar] [CrossRef]
- Mattila, O.; Korhonen, A.; Poyry, E.; Hauru, K.; Holopainen, J.; Parvinen, P. Restoration in a virtual reality forest environment. Comput. Hum. Behav. 2020, 107, 106295. [Google Scholar] [CrossRef]
- Leung, G.Y.S.; Hazan, H.; Chan, C.S. Exposure to nature in immersive virtual reality increases connectedness to nature among people with low nature affinity. J. Environ. Psychol. 2022, 83, 101863. [Google Scholar] [CrossRef]
- Theodorou, A.; Romano, L.; Bratman, G.N.; Carbone, G.A.; Rodelli, R.; Casagrande, G.; Panno, A. Different types of virtual natural environments enhance subjective vitality through restorativeness. J. Environ. Psychol. 2023, 87, 101981. [Google Scholar] [CrossRef]
- Li, H.; Dong, W.; Wang, Z.; Chen, N.; Wu, J.; Wang, G.; Jiang, T. Effect of a Virtual Reality-Based Restorative Environment on the Emotional and Cognitive Recovery of Individuals with Mild-to-Moderate Anxiety and Depression. Int. J. Environ. Res. Public Health 2021, 18, 9053. [Google Scholar] [CrossRef]
- Lähtevänoja, A.; Holopainen, J.; Mattila, O.; Parvinen, P. The use of virtual reality as a potential restorative environment in school during recess. In Proceedings of the Digital Transformation and Global Society: 5th International Conference, DTGS 2020, St. Petersburg, Russia, 17–19 June 2020; Revised Selected Papers 5. Springer: Berlin/Heidelberg, Germany, 2020; pp. 436–446. [Google Scholar]
- Reese, G.; Stahlberg, J.; Menzel, C. Digital shinrin-yoku: Do nature experiences in virtual reality reduce stress and increase well-being as strongly as similar experiences in a physical forest? Virtual Real. 2022, 26, 1245–1255. [Google Scholar] [CrossRef]
- Chan, S.H.M.; Qiu, L.; Esposito, G.; Mai, K.P.; Tam, K.-P.; Cui, J. Nature in virtual reality improves mood and reduces stress: Evidence from young adults and senior citizens. Virtual Real. 2021, 27, 3285–3300. [Google Scholar] [CrossRef]
- White, M.P.; Yeo, N.L.; Vassiljev, P.; Lundstedt, R.; Wallergard, M.; Albin, M.; Lohmus, M. A prescription for “nature”—The potential of using virtual nature in therapeutics. Neuropsychiatr. Dis. Treat. 2018, 14, 3001–3013. [Google Scholar] [CrossRef]
- Depledge, M.H.; Stone, R.J.; Bird, W.J. Can natural and virtual environments be used to promote improved human health and wellbeing? Environ. Sci. Technol. 2011, 45, 4660–4665. [Google Scholar] [CrossRef]
- Ünal, A.B.; Pals, R.; Steg, L.; Siero, F.W.; van der Zee, K.I. Is virtual reality a valid tool for restorative environments research? Urban For. Urban Green. 2022, 74, 127673. [Google Scholar] [CrossRef]
- Newman, M.; Gatersleben, B.; Wyles, K.J.; Ratcliffe, E. The use of virtual reality in environment experiences and the importance of realism. J. Environ. Psychol. 2022, 79, 101733. [Google Scholar] [CrossRef]
- Wang, Z.; Li, Y.; An, J.; Dong, W.; Li, H.; Ma, H.; Wang, J.; Wu, J.; Jiang, T.; Wang, G. Effects of Restorative Environment and Presence on Anxiety and Depression Based on Interactive Virtual Reality Scenarios. Int. J. Environ. Res. Public Health 2022, 19, 7878. [Google Scholar] [CrossRef] [PubMed]
- Huang, Q.; Yang, M.; Jane, H.-a.; Li, S.; Bauer, N. Trees, grass, or concrete? The effects of different types of environments on stress reduction. Landsc. Urban Plan. 2020, 193, 103654. [Google Scholar] [CrossRef]
- Deng, L.; Li, X.; Luo, H.; Fu, E.-K.; Ma, J.; Sun, L.-X.; Huang, Z.; Cai, S.-Z.; Jia, Y. Empirical study of landscape types, landscape elements and landscape components of the urban park promoting physiological and psychological restoration. Urban For. Urban Green. 2020, 48, 126488. [Google Scholar] [CrossRef]
- Tyrväinen, L.; Ojala, A.; Korpela, K.; Lanki, T.; Tsunetsugu, Y.; Kagawa, T. The influence of urban green environments on stress relief measures: A field experiment. J. Environ. Psychol. 2014, 38, 1–9. [Google Scholar] [CrossRef]
- Gidlow, C.J.; Jones, M.V.; Hurst, G.; Masterson, D.; Clark-Carter, D.; Tarvainen, M.P.; Smith, G.; Nieuwenhuijsen, M. Where to put your best foot forward: Psycho-physiological responses to walking in natural and urban environments. J. Environ. Psychol. 2016, 45, 22–29. [Google Scholar] [CrossRef]
- Stragà, M.; Miani, C.; Mäntylä, T.; Bruine de Bruin, W.; Mottica, M.; Del Missier, F. Into the wild or into the library? Perceived restorativeness of natural and built environments. J. Environ. Psychol. 2023, 91, 102131. [Google Scholar] [CrossRef]
- Weber, A.M.; Trojan, J. The restorative value of the urban environment: A systematic review of the existing literature. Environ. Health Insights 2018, 12, 1178630218812805. [Google Scholar]
- Sugimine, S.; Saito, S.; Takazawa, T. Normalized skin conductance level could differentiate physical pain stimuli from other sympathetic stimuli. Sci. Rep. 2020, 10, 10950. [Google Scholar] [CrossRef]
- Qasim, M.S.; Bari, D.S.; Martinsen, O.G. Influence of ambient temperature on tonic and phasic electrodermal activity components. Physiol. Meas. 2022, 43, 065001. [Google Scholar] [CrossRef]
- Drawz, P.E.; Babineau, D.C.; Brecklin, C.; He, J.; Kallem, R.R.; Soliman, E.Z.; Xie, D.; Appleby, D.; Anderson, A.H.; Rahrnan, M.; et al. Heart Rate Variability Is a Predictor of Mortality in Chronic Kidney Disease: A Report from the CRIC Study. Am. J. Nephrol. 2013, 38, 517–528. [Google Scholar] [CrossRef]
- Tegegne, B.S.; Man, T.F.; van Roon, A.M.; Riese, H.; Snieder, H. To the Editor-10-second ECG-based RMSSD as valid measure of HRV. Heart Rhythm. 2019, 16, E35. [Google Scholar] [CrossRef] [PubMed]
- Han, K.-T. A review of self-report scales on restoration and/or restorativeness in the natural environment. J. Leis. Res. 2018, 49, 151–176. [Google Scholar] [CrossRef]
- Crawford, J.R.; Henry, J.D. The positive and negative affect schedule (PANAS): Construct validity, measurement properties and normative data in a large non-clinical sample. Br. J. Clin. Psychol. 2004, 43, 245–265. [Google Scholar] [CrossRef] [PubMed]
- Jang, Y.; Son, Y. The Characteristics of Urban Forests as Restorative Environments with the use of the Perceived Restorativeness Scale: Focusing on the Hongneung Experimental Forest, Seoul, South Korea. Int. Rev. Spat. Plan. Sustain. Dev. 2020, 8, 107–123. [Google Scholar] [CrossRef]
- Halbeisen, G.; Domes, G.; Walther, E. Is stress colorblind? Exploring endocrine stress responses in intergroup contexts using a virtual reality-based Trier Social Stress Test (TSST-VR). Psychoneuroendocrinology 2023, 147, 105970. [Google Scholar] [CrossRef]
- Man, I.S.C.; Shao, R.; Hou, W.K.; Xin Li, S.; Liu, F.Y.; Lee, M.; Wing, Y.K.; Yau, S.-y.; Lee, T.M.C. Multi-systemic evaluation of biological and emotional responses to the Trier Social Stress Test: A meta-analysis and systematic review. Front. Neuroendocrinol. 2023, 68, 101050. [Google Scholar] [CrossRef]
- Yao, Y.; Liang, Z.; Yuan, Z.; Liu, P.; Bie, Y.; Zhang, J.; Wang, R.; Wang, J.; Guan, Q. A human-machine adversarial scoring framework for urban perception assessment using street-view images. Int. J. Geogr. Inf. Sci. 2019, 33, 2363–2384. [Google Scholar] [CrossRef]
- Rickard, S.C.; White, M.P. Barefoot walking, nature connectedness and psychological restoration: The importance of stimulating the sense of touch for feeling closer to the natural world. Landsc. Res. 2021, 46, 975–991. [Google Scholar]
- Marschallek, B.E.; Low, A.; Jacobsen, T. You can touch this! Brain correlates of aesthetic processing of active fingertip exploration of material surfaces. Neuropsychologia 2023, 182, 108520. [Google Scholar] [CrossRef]
- Wang, R.; Browning, M.H.E.M.; Qin, X.; He, J.; Wu, W.; Yao, Y.; Liu, Y. Visible green space predicts emotion: Evidence from social media and street view data. Appl. Geogr. 2022, 148, 102803. [Google Scholar] [CrossRef]
- Mahrous, A.; Dewidar, K.; Refaat, M.; Nessim, A. The impact of biophilic attributes on university students level of Satisfaction: Using virtual reality simulation. Ain Shams Eng. J. 2024, 15, 102304. [Google Scholar] [CrossRef]
- Jansson, M.; Fors, H.; Lindgren, T.; Wistrom, B. Perceived personal safety in relation to urban woodland vegetation—A review. Urban For. Urban Green. 2013, 12, 127–133. [Google Scholar] [CrossRef]
- Brown, R.D.; Corry, R.C. Evidence-based landscape architecture: The maturing of a profession. Landsc. Urban Plan. 2011, 100, 327–329. [Google Scholar] [CrossRef]
- Jiang, B.; Chang, C.-Y.; Sullivan, W.C. A dose of nature: Tree cover, stress reduction, and gender differences. Landsc. Urban Plan. 2014, 132, 26–36. [Google Scholar] [CrossRef]
- Li, X.; Zhang, X.; Jia, T. Humanization of nature: Testing the influences of urban park characteristics and psychological factors on collegers’ perceived restoration. Urban For. Urban Green. 2023, 79, 127806. [Google Scholar] [CrossRef]
- Wilson, C.J.; Soranzo, A. The use of virtual reality in psychology: A case study in visual perception. Comput. Math. Methods Med. 2015, 2015, 151702. [Google Scholar]
- Browning, M.; Shipley, N.; McAnirlin, O.; Becker, D.; Yu, C.P.; Hartig, T.; Dzhambov, A.M. An Actual Natural Setting Improves Mood Better Than Its Virtual Counterpart: A Meta-Analysis of Experimental Data. Front. Psychol. 2020, 11, 2200. [Google Scholar] [CrossRef]
- Hejtmánek, L.; Hůla, M.; Herrová, A.; Surový, P. Forest digital twin as a relaxation environment: A pilot study. Front. Virtual Real. 2022, 3, 1033708. [Google Scholar] [CrossRef]
- Zhang, S.; Zhu, K.; Wang, S.; Jin, X.; Li, Y.; Ding, K.; Zhang, Q.; Li, X. A cross-sectional study about coronavirus fear of Chinese college students in school lockdowns during the COVID-19 pandemic. Heliyon 2022, 8, e09892. [Google Scholar] [CrossRef]


| Index | F Test Result | Group | Mean (SD) | t | p |
|---|---|---|---|---|---|
| Comparison of effects of different terrain elements on physiological indices | |||||
| SCL | F = 0.000, p = 0.987 > 0.05 | Natural material scene (n = 36) | −2.404 (5.254) | −1.218 | 0.227 |
| Artificial material scene (n = 36) | −3.898 (5.149) | ||||
| RMSSD | F = 3.744, p = 0.057 > 0.05 | Natural material scene (n = 36) | 230.751 (254.519) | −1.002 | 0.320 |
| Artificial material scene (n = 36) | 21.097 (33.884) | ||||
| Comparison of effects of pavement material on physiological indices | |||||
| SCL | F = 0.057, p = 0.811 > 0.05 | Natural material scene (n = 36) | −3.476 (4.063) | −1.748 | * 0.045 |
| Artificial material scene (n = 36) | −1.709 (4.501) | ||||
| RMSSD | F = 1.411, p = 0.239 > 0.05 | Natural material scene (n = 36) | 12.862 (22.842) | 0.658 | 0.513 |
| Artificial material scene (n = 36) | 3.629 (81.003) | ||||
| Group | F Test Result | Mean (SD) | t | p |
|---|---|---|---|---|
| Comparative analysis of differences in the effects of different scenarios on perceived recoverability | ||||
| Terrain scenes (n = 36) | F = 0.056, | 3.394 (0.366) | 2.326 | * 0.023 |
| Non-terrain scenes (n = 36) | p = 0.814 > 0.05 | 3.184 (0.399) | ||
| Comparative analysis of differences in the effects of different terrain element scenes on positive emotions | ||||
| Terrain scenes (n = 36) | F = 0.025, | 67.28 (225.203) | −0.212 | 0.832 |
| Non-terrain scenes (n = 36) | p = 0.832 > 0.05 | 56.00 (225.499) | ||
| Comparative analysis of differences in the effects of different terrain element scenes on negative emotions | ||||
| Terrain scenes (n = 36) | F = 1.801, | −170.83 (184.154) | 0.561 | 0.576 |
| Non-terrain scenes (n = 36) | p = 0.576 > 0.05 | −143.19 (231.053) | ||
| Comparative analysis of differences in the impact of different pavement material scenarios on perceived restorability | ||||
| Natural material scene (n = 36) | F = 2.127, | 3.167 (0.387) | 1.319 | 0.192 |
| Artificial material scene (n = 36) | p = 0.149 > 0.05 | 3.014 (0.578) | ||
| Comparative analysis of differences in the effects of different pavement material scenes on positive emotions | ||||
| Natural material scene (n = 36) | F = 0.000, | 27.97 (210.539) | −0.280 | 0.780 |
| Artificial material scene (n = 36) | p = 0.993 > 0.05 | 14.17 (207.576) | ||
| Comparative analysis of differences in the effects of different pavement material scenes on negative emotions | ||||
| Natural material scene (n = 36) | F = 0.943, | −198.78 (203.415) | −0.362 | 0.718 |
| Artificial material scene (n = 36) | p = 0.335 > 0.05 | −179.14 (254.070) | ||
| Quadratic Sum | df | Mean Square | f | p | |
|---|---|---|---|---|---|
| Scene green vision level effect on positive emotions | |||||
| Between groups | 215,030.796 | 3.000 | 71,676.932 | 1.728 | 0.162 |
| Within group | 8,795,137.162 | 212.000 | 41,486.496 | ||
| Total | 9,010,167.958 | 215.000 | |||
| Scene green vision level effect on negative emotions | |||||
| Between groups | 371,320.672 | 3 | 123,773.557 | 2.473 | * 0.043 |
| Within group | 10,610,958.865 | 212 | 50,051.693 | ||
| Total | 10,982,279.537 | 215 | |||
| Group | Mean (SD) | 95% Confidence Interval for the Mean | Description | |
|---|---|---|---|---|
| Low | High | |||
| Descriptive analysis of different green vision level effects on perceptual restorative results | ||||
| Lower green vision (n = 58) | 3.111 (0.476) | 2.986 | 3.237 | There were significant differences in the perceptual restorative evaluation among different green vision levels (F = 3.198, p < 0.05). |
| Low green vision (n = 53) | 3.246 (0.535) | 3.098 | 3.393 | |
| High green vision (n = 52) | 3.378 (0.459) | 3.250 | 3.506 | |
| Higher green vision (n = 53) | 3.297 (0.349) | 3.201 | 3.393 | |
| Total (n = 216) | 3.254 (0.467) | 3.191 | 3.317 | |
| Descriptive analysis of different green vision level effects on positive emotions | ||||
| Lower green vision (n = 58) | 11.690 (172.283) | −33.610 | 56.989 | There was no significant difference in positive emotions among different green vision levels (F = 1.728, p > 0.05). |
| Low green vision (n = 53) | 4.887 (215.479) | −54.507 | 64.280 | |
| High green vision (n = 52) | 85.288 (225.834) | 22.416 | 148.161 | |
| Higher green vision (n = 53) | 43.717 (200.376) | −11.514 | 98.947 | |
| Total (n = 216) | 35.597 (204.714) | 8.142 | 63.052 | |
| Descriptive analysis of different green vision level effects on negative emotions | ||||
| Lower green vision (n = 58) | −173.07 (219.095) | −230.68 | −115.46 | There were significant differences in the different green vision level improvement effects on negative emotions (F = 2.473, p < 0.05). |
| Low green vision (n = 53) | 219.09 (245.244) | −252.01 | −116.82 | |
| High green vision (n = 52) | −234.17 (213.506) | −293.61 | −174.73 | |
| Higher green vision (n = 53) | −115.94 (215.837) | −175.44 | −56.45 | |
| Total (n = 216) | −176.55 (226.010) | −206.86 | −146.24 | |
Disclaimer/Publisher’s Note: The statements, opinions and data contained in all publications are solely those of the individual author(s) and contributor(s) and not of MDPI and/or the editor(s). MDPI and/or the editor(s) disclaim responsibility for any injury to people or property resulting from any ideas, methods, instructions or products referred to in the content. |
© 2024 by the authors. Licensee MDPI, Basel, Switzerland. This article is an open access article distributed under the terms and conditions of the Creative Commons Attribution (CC BY) license (https://creativecommons.org/licenses/by/4.0/).
Share and Cite
Zhao, R.; Xu, Y.; Xia, T.; Li, H.; Zhao, B.; Wei, W. An Exploration of the Physiological and Psychological Aspects of Student Anxiety Using a Greenspace Restorative Environment Based on Virtual Reality: A Controlled Experiment in Nanjing College. Forests 2024, 15, 196. https://doi.org/10.3390/f15010196
Zhao R, Xu Y, Xia T, Li H, Zhao B, Wei W. An Exploration of the Physiological and Psychological Aspects of Student Anxiety Using a Greenspace Restorative Environment Based on Virtual Reality: A Controlled Experiment in Nanjing College. Forests. 2024; 15(1):196. https://doi.org/10.3390/f15010196
Chicago/Turabian StyleZhao, Ruhui, Yuhang Xu, Tianyu Xia, Hongyi Li, Bing Zhao, and Wei Wei. 2024. "An Exploration of the Physiological and Psychological Aspects of Student Anxiety Using a Greenspace Restorative Environment Based on Virtual Reality: A Controlled Experiment in Nanjing College" Forests 15, no. 1: 196. https://doi.org/10.3390/f15010196
APA StyleZhao, R., Xu, Y., Xia, T., Li, H., Zhao, B., & Wei, W. (2024). An Exploration of the Physiological and Psychological Aspects of Student Anxiety Using a Greenspace Restorative Environment Based on Virtual Reality: A Controlled Experiment in Nanjing College. Forests, 15(1), 196. https://doi.org/10.3390/f15010196