Article

Drought and Vulnerability in Mexico’s Forest Ecosystems

by
Noé San Agustín-Canales
1,
Yadihra Cruz-Sánchez
2,
Ma. Amparo Borja-de la Rosa
1,
Ma. Rosa González-Tepale
3 and
Alejandro Ismael Monterroso-Rivas
4,*
1
División de Ciencias Forestales, Universidad Autónoma Chapingo, Texcoco 56230, Mexico
2
Departamento de Fitotecnia, Universidad Autónoma Chapingo, Texcoco 56230, Mexico
3
Departamento de Preparatoria Agrícola, Universidad Autónoma Chapingo, Texcoco 56230, Mexico
4
Departamento de Suelos, Universidad Autónoma Chapingo, Texcoco 56230, Mexico
*
Author to whom correspondence should be addressed.
Forests 2023, 14(9), 1813; https://doi.org/10.3390/f14091813
Submission received: 7 August 2023 / Revised: 31 August 2023 / Accepted: 1 September 2023 / Published: 5 September 2023
(This article belongs to the Special Issue Impacts of Extreme Climate Events on Forests)

Abstract

:
In Mexico, some regions have frequent droughts, while others are beginning to experience their presence and impacts. Therefore, this work aimed to characterize drought in the last twenty-one years and evaluate the vulnerability of forests to this phenomenon. The method consisted of applying the standard precipitation index (SPI-12), calculating the drought vulnerability index (DVI), and applying it to the country’s forest areas. The results confirm that forests are vulnerable to drought for five main reasons. First, geographically, the country has large arid and semiarid areas with little natural precipitation. Second, droughts frequently occur and are present in the national territory, covering from 25% to 75% of the surface in recent years. Third, the socioeconomic characteristics of the population living in municipalities and forest territories increase the vulnerability of these areas to drought. Fourth, drought can trigger other catastrophes, such as fires or forest pests. Fifth, the combination of two or more of the above in the same territory magnifies exposure to drought for both forests and people. Temperate forest ecosystems, in particular, have been subject to the prevalence of drought in recent years and, thus, should receive more attention. Finally, technical and cartographic elements, such as those presented herein, are essential for supporting the formulation of proactive forest response plans to address drought events.

1. Introduction

Drought is a natural phenomenon that occurs in all regions of the world [1]. It occurs when the precipitation rate decreases considerably in a given region and time. Droughts are normal climatic conditions that can occur anywhere in the world in areas with either humid or desert climates [2]. In addition to the lack of rain, other climatic factors, such as high temperatures, strong winds, and low relative humidity, can contribute to the effects of drought and worsen its severity.
Each year, drought has unique climatic characteristics and impacts; drought is related to the effectiveness of rainfall in the region. A prolonged lack of rain results in a scarcity of water for human needs and natural ecosystems [3]. In Mexico, drought has historically been caused by various factors, including climate variability such as lack of rainfall, El Niño/La Niña, and changes in prevailing winds, as well as human factors, including lack of infrastructure, overexploitation, and deforestation. Thus, droughts can have significant and wide-ranging effects, affecting multiple economic sectors and people [4]. In 2022, two-thirds of the Earth’s surface had river flows below the planet’s average [5]. Additionally, losses and damages were approximately 100 billion USD in the period from 2010 to 2019 [6].
Therefore, the World Meteorological Organization [7] has recommended measuring and monitoring the presence of droughts throughout the planet. The effects of drought are considerable and widespread, and each drought occurrence harms many economic sectors and people. Measuring and monitoring drought allows anticipating and preventing impacts, so the surveillance, early warning, and management systems of droughts should be improved. However, drought monitoring requires robust methods that identify droughts early and quickly.
Different methods can be applied to measure drought. Some quantify the reduction in precipitation (known as meteorological drought), such as the Standard Precipitation Index (SPI). This measures the deviation of current precipitation compared to a reference period. Additionally, the normal precipitation percentage method [8] is used to evaluate the amount of precipitation received about the historical average. The water availability percentage assesses the supply and demand for water in a specific region. There are also methods based on quantifying the loss of soil moisture, such as the Palmer index [9] or Soil Moisture Leaking Bucket (Model CPC-NOAA), which assesses soil moisture in relation to its water-holding capacity [10]. Methods that measure the degree of vegetation stress are becoming more frequent, such as the Satellite Vegetation Health Index (VHI) or the Normalized Vegetation Difference Index (NDVI) [11]. The VHI uses temperature and vegetation measurements to determine the condition of vegetation. The NDVI uses the reflectance of the Earth’s surface to assess the health of vegetation. Both the SPI and the NDVI have been shown to be adequate, and they provide reliable results [12,13]. The above are used to monitor and evaluate drought conditions in terms of the amount of precipitation, vegetation, soil moisture, temperature, and water availability. In Mexico, they have been applied for monitoring droughts [6].
In Mexico, drought used to be reactively addressed, implementing emergency aid programs after the phenomenon manifested itself [14]. Programs sought to ensure the supply of water and food, preserve health, or support economic recovery. However, the drought of 2011–2012, considered to date the most severe since 1941 in the northern and central regions of Mexico, generated a radical change in the strategy of the Mexican government and society. Since then, greater anticipation of future drought has led to concrete local prevention plans to mitigate drought in advance [15]. For example, the National Program Against Drought (PRONACOSE) is currently being promoted, which attempts to adopt a comprehensive and participatory approach to face the phenomenon [16].
Due to its geographical position, Mexico is vulnerable to various climatic phenomena, such as hurricanes, cold fronts, and droughts [17]. Although there is specialized cartography on drought, it is not yet applicable to forests. The most recent maps of vulnerability to drought (https://www.gob.mx/conagua/acciones-y-programas/mapas-de-vulnerabilidad-a-la-sequia-a-nivel-municipal?state=published, accessed on 8 June 2023) are valuable products but do not link their presence to or impact on forest ecosystems. Thus, in Mexico, there are no cartography or studies that show the vulnerability of forest ecosystems to drought.
Therefore, this work aims to characterize drought in recent years and evaluate the vulnerability of forests to this phenomenon. The SPI-12 method was applied to quantify the presence of droughts spatially and temporally to more precisely understand drought patterns, including duration, intensity, and frequency. It should be noted that the drought assessment was not comprehensive enough, especially in the interannual period. In addition, the vulnerability of forestlands was evaluated by considering social, economic, and infrastructure aspects at the municipal level. The hypothesis posits the feasibility of identifying areas more prone to drought’s impacts and regions with diverse degrees of vulnerability that can be used to target mitigation and adaptation efforts to areas that require priority attention.

2. Materials and Methods

The method consisted of three stages: spatial mapping of drought in Mexico, calculation of the index of vulnerability to drought, and calculation of the vulnerability of forest ecosystems. They are described below.

2.1. Drought Mapping

The presence of drought was mapped using the SPI-12 or annual drought summary, which is recommended by the OMM [7] for monitoring and tracking meteorological droughts. For this, the database of 415 meteorological stations distributed throughout the Mexican territory was downloaded. The stations included the annual value of the SPI-12 for the period between 2000 and 2020 and were taken from the National Meteorological Service (https://smn.conagua.gob.mx/es/climatologia/monitor-de-sequia/spi, accessed on 15 June 2022). Afterward, drought mapping was obtained for each of the 21 years by interpolation. The method applied was the IDW tool with a pixel resolution of 200 m. The method produces distribution maps, but in some cases, such as areas with sparse data, care must be taken in interpreting the results. The annual maps were classified according to drought intensity following the recommendation of the “Guide of good practices for the preparation of national reports” of the United Nations Convention to Combat Desertification [18], which suggests the following values for SPI-12: from 0 to −0.99 mild drought; from −1 to −1.49 moderate drought; −1.5 to −1.99 severe drought and greater than −2 extreme drought. Positive values or values greater than 0 indicate the presence of moisture. Afterward, a ‘compiled map’ was made by joining the maps of the 21 years into a single map, accounting for the drought classes of each one. This map adds all the droughts of the period and thus reflects the greater severity of droughts in the period studied.

2.2. Vulnerability Indicator

A vulnerability indicator was constructed considering three dimensions: social, economic, and infrastructure, following the recommendation of UNCCD. Five variables were included in the social dimension: (1) literacy rate (percentage of people over 15 years old), (2) rural population (percentage in municipalities), (3) life expectancy at birth (in years per municipality), and (4) population aged 15 to 64 (percentage of the municipality). All of the above were obtained from the INEGI Population and Housing Censuses for the years 2000, 2005, 2010, and 2020 (https://www.inegi.org.mx/programas/ccpv/2020/, accessed on 17 June 2022). Additionally, variable (5) government effectiveness (dimensionless) was obtained from [19].
The economic dimension included three variables: (1) population below the international poverty line (percentage of the municipality) taken from the CONEVAL Poverty Indicators Concentrate (https://www.coneval.org.mx/Medicion/Paginas/Pobreza-municipio-2010–2020.aspx, accessed on 11 July 2022), (2) the Gross Domestic Product per capita and contribution of agriculture to GDP obtained from the Gross Domestic Product by federal entity (PIBE) of INEGI, 1980–2021 (https://www.inegi.org.mx/app/tabulados/default.aspx?pr=17&vr=7&in=2&tp=20&wr=1&cno=2, accessed on 13 July 2022), and (3) energy consumption (kilograms of oil equivalent per capita) obtained from the World Bank (https://data.worldbank.org/indicator/EG.USE.PCAP.KG.OE, accessed on 11 July 2022).
The infrastructure dimension considered four variables: (1) population that has drinking water services (percentage of the municipality) obtained from the INEGI population and housing censuses for the years 2000, 2005, 2010, and 2020 (https://www.inegi.org.mx/programas/ccpv/2020/, accessed on 15 July 2022), (2) total renewable water resources per capita (m3/inhab/year) obtained from CONAGUA in the “Water Statistics” (https://www.gob.mx/conagua/acciones-y-programas/publicaciones-estadisticas-y-geograficas-60692, accessed on 15 July 2022), (3) the cultivated area equipped with irrigation (percentage of the municipality) through the cartographic layers of land use and vegetation of INEGI (http://www.conabio.gob.mx/informacion/gis/, accessed on 11 July 2022), and (4) infiltration (hm3/year) that contemplates a balance of water inlet and outlet in aquifers in the municipalities obtained from the “Water Statistics” of CONAGUA (https://www.gob.mx/conagua/acciones-y-programas/publicaciones-estadisticas-y-geograficas-60692, accessed on 13 July 2022).
With the information on the 12 variables, a database was developed at the municipal level. The data were standardized following Barker et al. [18]. For each dimension, an algebraic sum was made of its variables to obtain a value that was later divided by 3; it was included in the vulnerability index (VI) according to
Vulnerability Index = (Social + Economic + Infrastructure)/3
where the social dimension was the sum of five variables, the economic dimension was the sum of three variables, and the infrastructure dimension included four variables. Once the average was calculated, the values were standardized to determine later the vulnerability index (VI) classes. The k-means statistic was used in R [20] to generate four groups named 1 to 4, which were validated using the elbow method and the strength of the groups to validate if they were adequate, thus obtaining the classes of low, medium, high and very high vulnerability, respectively. The IV ranges were defined as follows: class 1 includes values from 0 to 0.35; class 2 includes values from 0.36 to 0.54; class 3 includes values from 0.55 to 0.71; and class 4 includes values from 0.72 to 1. The compiled drought map (D) was added to the database, which reflects the sum of the last 21 years, and Formula (2) was applied:
DVI = VI + D
Subsequently, the factor that causes the greatest effect on the municipality was added. If it is drought, letter D is assigned; if it is vulnerability, letter V is assigned; and if it is both drought and vulnerability, it is assigned B. In addition, a spatial analysis was carried out from the bivariate local Moran analysis (w in Formula (3)). The analysis is based on Moran’s Local index, which assesses the spatial autocorrelation of one or more variables. In this case, the correlation of two variables was sought based on their presence and spatial magnitude [21]. The analysis was performed with GeoDA (version 1.20) [22], where a weight matrix was created through the map of boundaries between municipalities. For this, the K-Neighbors method was applied with a value of 7 neighbors (national average of municipalities in Mexico). In this way, five groups or clusters were obtained according to the spatial correlation class between drought and vulnerability: not significant for both (NS), high-high correlation between both (HH), high correlation drought and low vulnerability (HL), low correlation drought and high vulnerability (LH) and low-low correlation between the two (LL). Finally, the drought vulnerability index (DVI) was obtained, as shown in Formula (3):
Municipal DVI = w (VI + D)

2.3. Vulnerability of Forest Areas

The forest areas were obtained from the use of soil and vegetation of INEGI (http://www.conabio.gob.mx/informacion/gis/, accessed on 13 July 2022) in 2018. The classes were grouped into forests of temperate zones, forests of tropical zones, and vegetation of semiarid areas. Finally, a DVI intersection was carried out for each forest area of the country, and vulnerability analysis was carried out in these areas.

3. Results

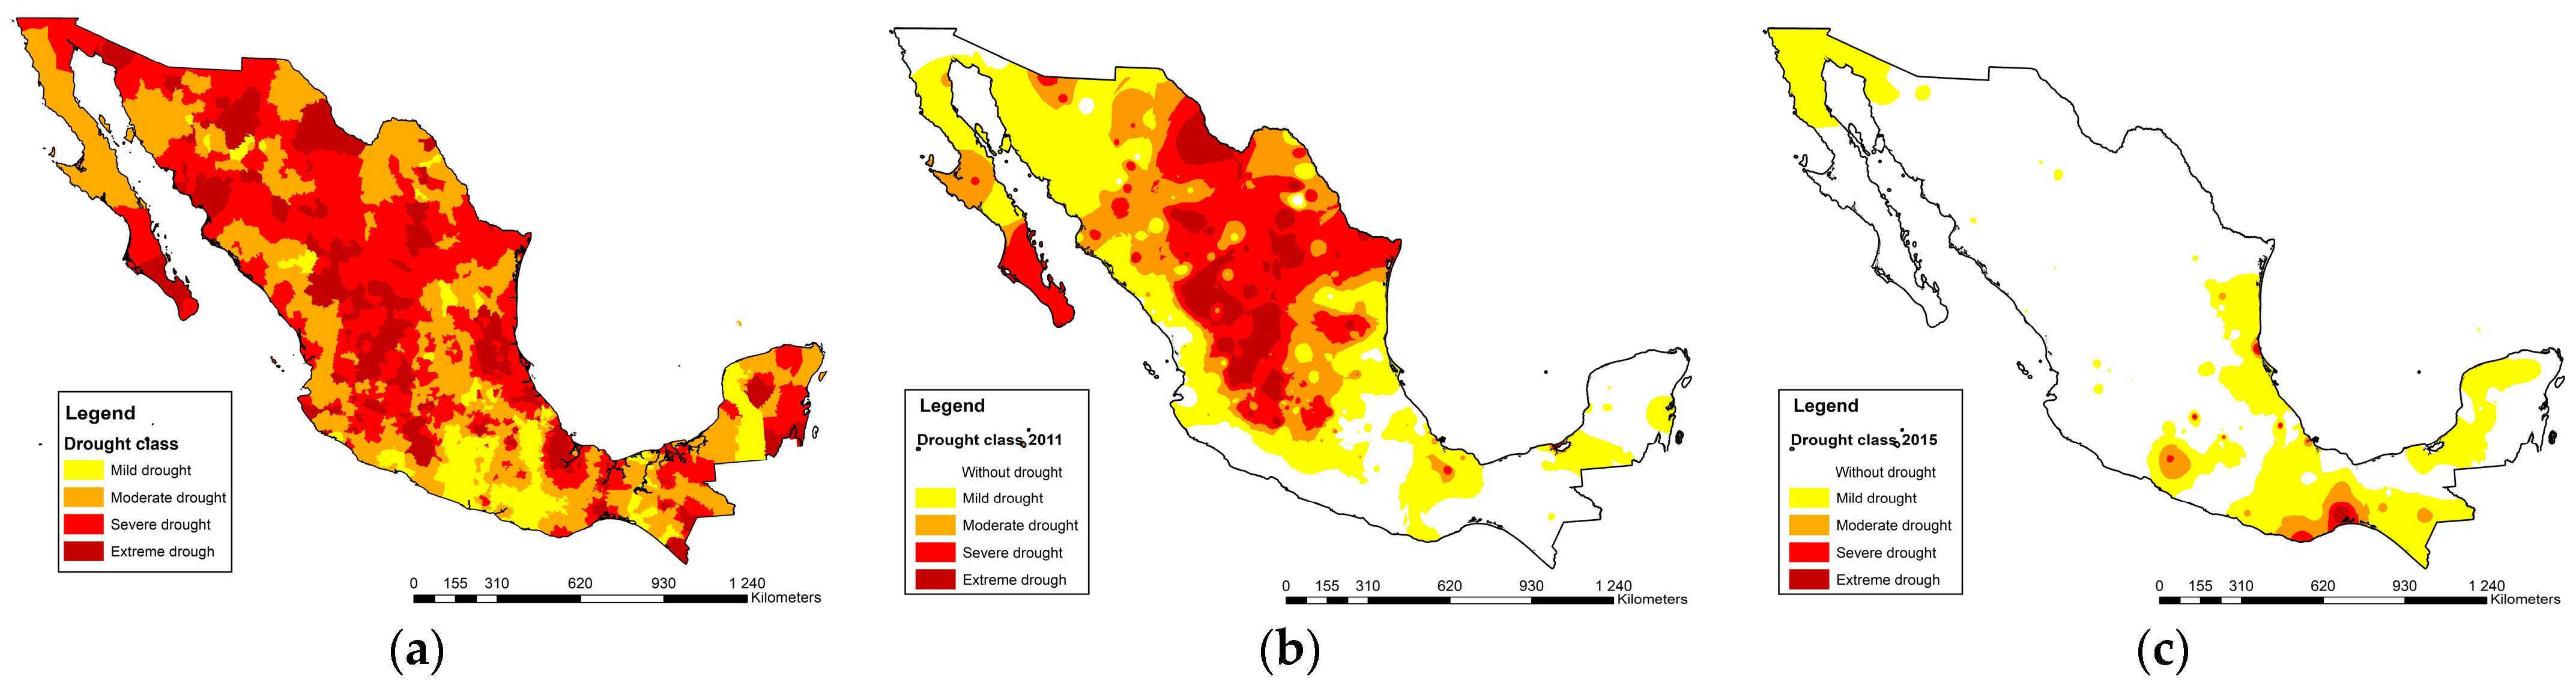
3.1. Drought in Mexico

Mexico is a country that suffers from drought practically every year. The difference is the magnitude and distribution in the territory (Figure 1). In Supplementary Material (Supplementary Material S1), the annual maps are presented. If we consider the years with the least presence of drought at the national level (25 and 30% of the surface), six years in the period studied are of note: 2004, 2008, 2010, 2013, 2014, and 2015. The drought that covered between 30 and 50% of the national territory was observed in another six years: 2003, 2006, 2007, 2016, 2017, and 2018.
Drought covered more than 50% of the national surface in nine years of the study period (2000, 2001, 2002, 2005, 2009, 2011, 2012, 2019 and 2020). The year 2011 affected the country the most, with 77% of the national surface covered. That year, extreme drought impacted 8% of the country, and 19% had a severe drought. The year with the least impact was 2015, with 25% of the national surface covered.
Cumulatively, for the 21 years studied, drought covered practically the entire national territory (Figure 1a). The class with the highest coverage is severe drought (37%), followed by moderate drought (36%), extreme drought (17%), and mild drought (9%). The most severe categories are concentrated in the regions of the north, the west, and the central plateau of Mexico, while in the regions of the center, east, southeast, and southwest, mild or moderate drought is present.
Extreme drought affected 368 municipalities countrywide, which is equivalent to 15% of the total number of municipalities in the country. Severe drought was manifested in 684 municipalities (28%), moderate drought in 924 municipalities (34%), and mild drought in 493 municipalities (20% of the total).

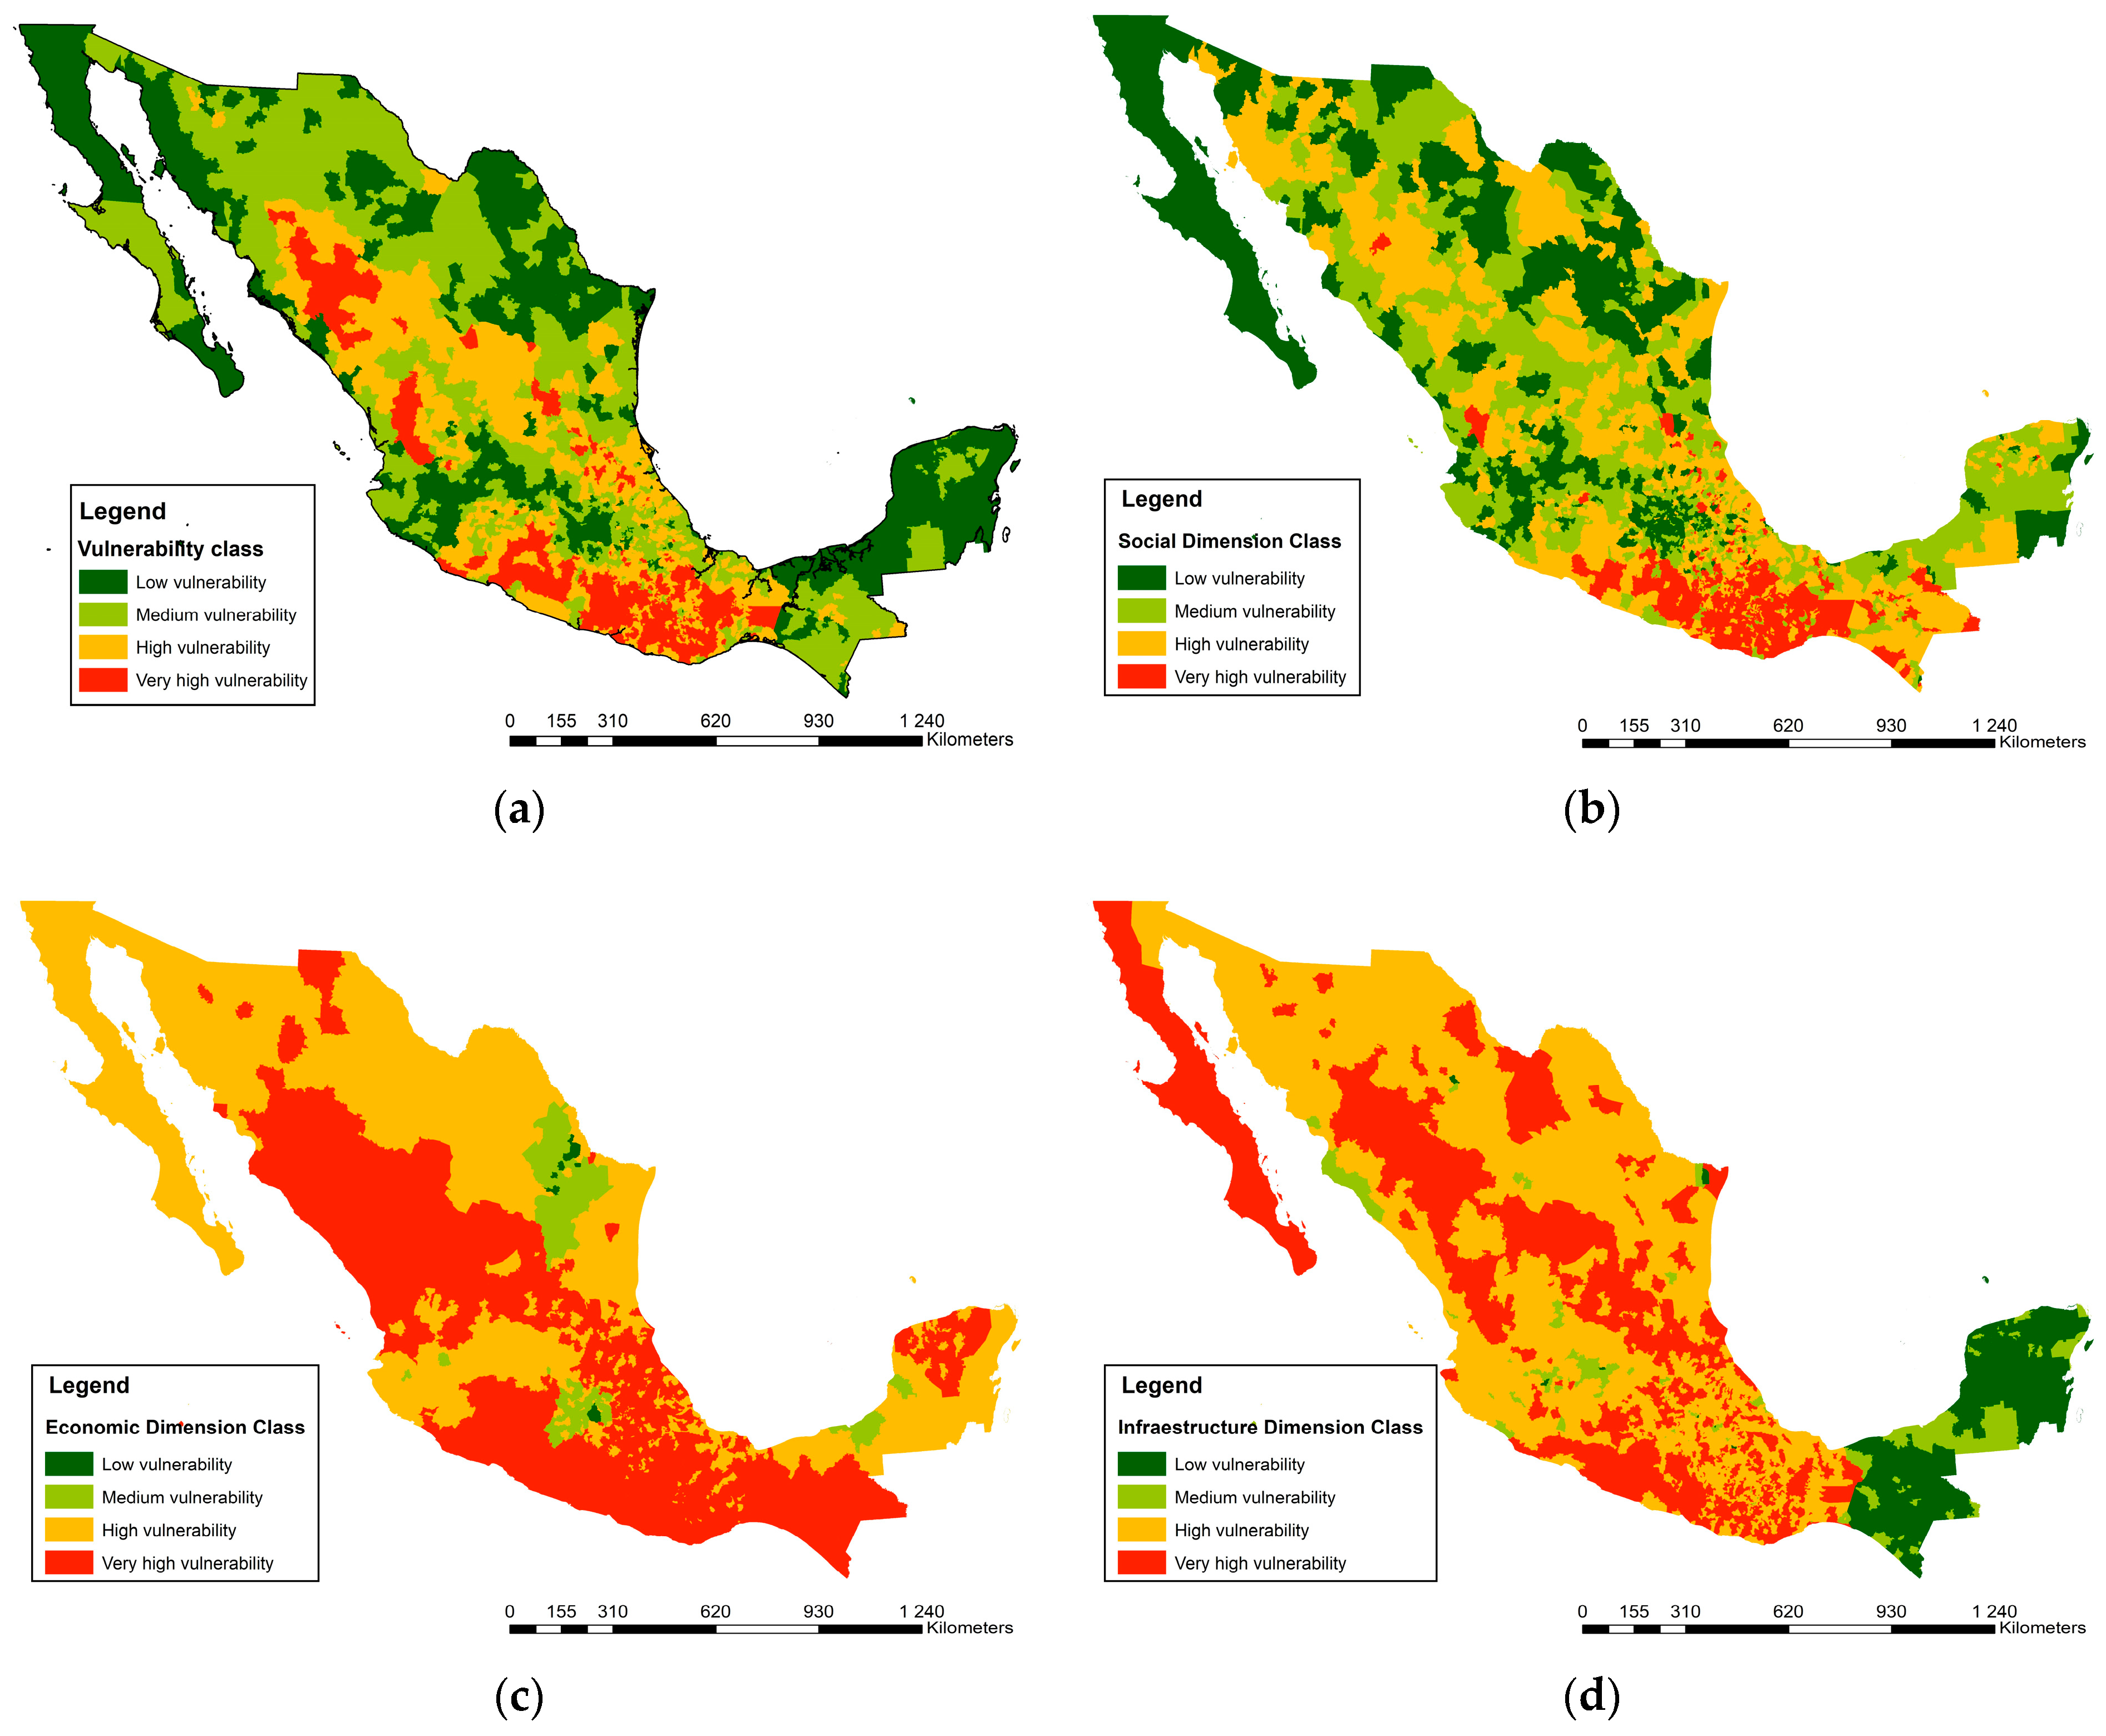
3.2. Vulnerability to Drought

To determine the vulnerability of the municipalities to drought, three dimensions were integrated: social, economic, and infrastructure. The statistical results are presented in Supplementary Materials S2 and S3, and the cartographic results are presented in Figure 2.
The social dimension shows that 553 municipalities (22%) have very high social vulnerability. High vulnerability defines 775 municipalities (31%), and medium vulnerability defines 703 municipalities (32%). Low social vulnerability defines 438 municipalities (18%). For the economic dimension, 1607 municipalities have very high economic vulnerability (65% of the national total). High vulnerability defines 688 municipalities (28%), and medium vulnerability defines 151 municipalities (6%). Low economic vulnerability is identified in 23 municipalities (0.26%). For the infrastructure dimension, 716 municipalities have very high infrastructural vulnerability (29% of the national total). There are 1316 municipalities with high vulnerability (53%) and 142 or 6% with medium vulnerability.
Once the dimensions are integrated, vulnerability at the municipal level (Figure 2a) shows that 485 municipalities (20%) present very high vulnerability. High vulnerability is presented in 663 municipalities (27%), and medium vulnerability is presented in 768 municipalities (31%). Finally, 553 municipalities (22%) exhibit low vulnerability.

3.3. Vulnerability, Drought or Both

The spatial analysis of Morán bivariate [21] allowed us to know if drought or its internal characteristics that define its vulnerability have more weight in a municipality and also allow comparison with neighboring municipalities. The results are shown in Table 1 and Figure 3a.

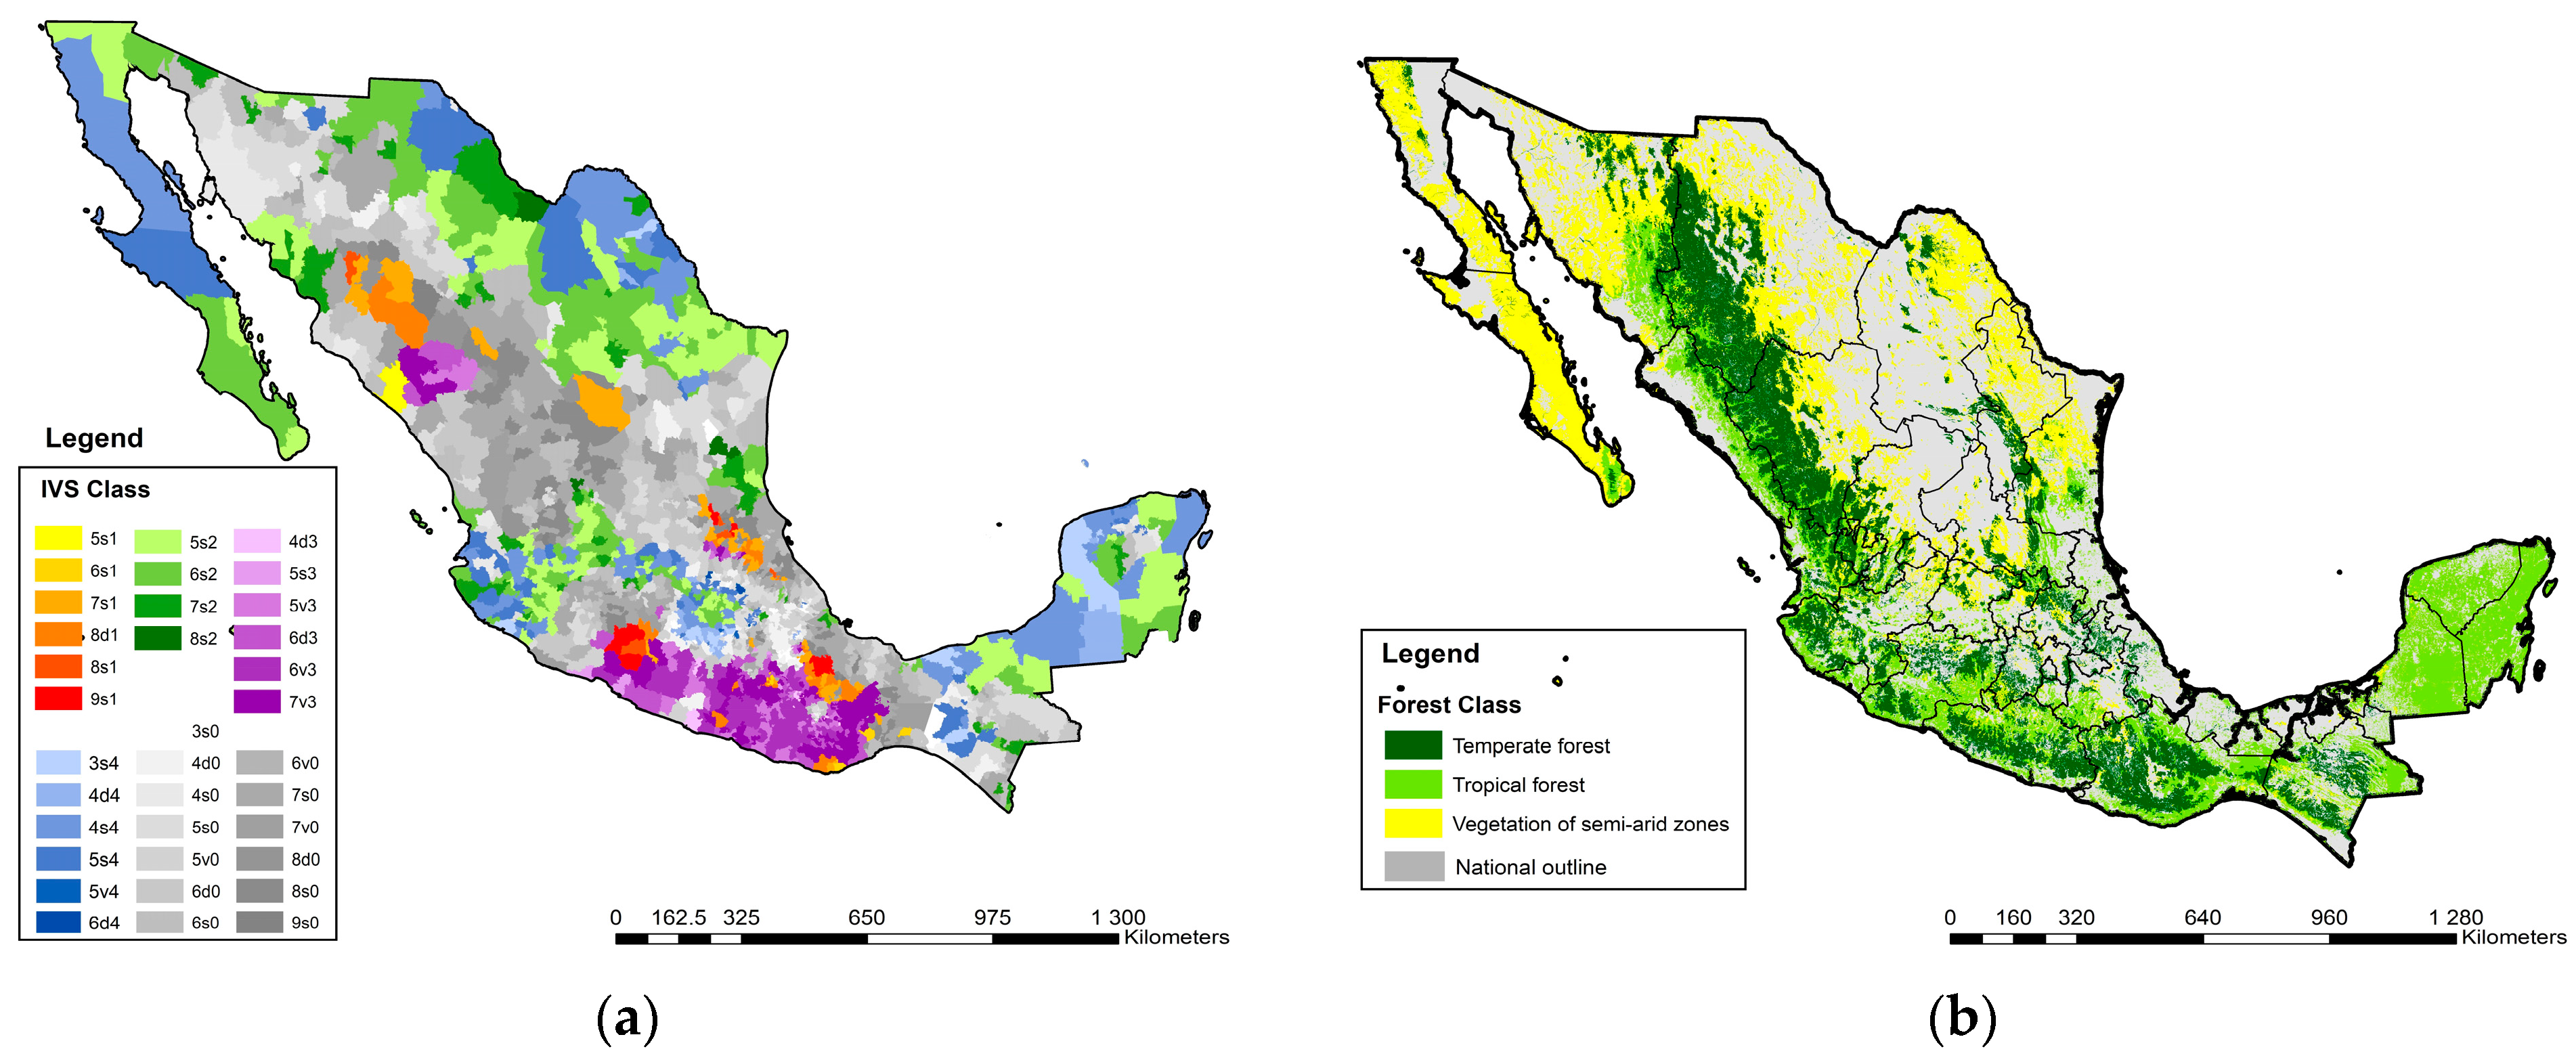
3.4. Vulnerability of Forest Areas to Drought

The forest areas of Mexico are presented in Figure 3b. In recent years, drought has affected almost 90% of the country’s forests; for extreme drought, 16% of the forest area and 728 municipalities have been impacted. Severe drought has occurred in 33% of the area and in 1402 municipalities. Moderate drought was present in 40% of the surface of 1899 municipalities.
According to their type of habitat, the forests were grouped into tropical, temperate, and semiarid (Figure 4). The tropical forests consist of various species of tall trees that retain their foliage throughout the year. Moreover, these forests are rich in lianas, epiphytes, and palms. Most of these plants have large and hard leaves and live in warm, humid climates. Temperate forests are tall tree-dominated communities found in mountainous regions with temperate to cold climates. These forests consist of coniferous, pine, cedar, fir, or oak trees. Semi-arid communities are characterized by shrubs that are less than 4 m in height. These communities are common in regions with infrequent precipitation and a dry climate. Succulent plants with thick leaves are prevalent, but there are also plants with small leaves or thorns.
If extreme and severe drought is considered, 44% of tropical forests have been affected, as have 45% of temperate forests and 55% of semiarid regions. Moderate drought has been present in practically 40% of the three types of forest. The above indicates that the effect of moderate to extreme drought in the forests of Mexico has been 88%, 85%, and 95% for tropical, temperate, and semiarid regions, respectively. Finally, a greater concentration of the most serious DVI classes (those with high-high correlation or HH) was identified for the total forest classes: 8.2% of the temperate forest was covered, followed by the tropical forest with 7.1% and the vegetation of semiarid zones with 1.34%.

4. Discussion

The results obtained show that drought has been present in practically the entire country for the last twenty years. The findings reported here are consistent with what was obtained in the last two national reports on land degradation and drought [23], which indicated an average of 32% and 46% of the country were affected by drought in 2018 and 2023, respectively, which is close to the 47.5% of the present study. Specifically, in 2011, 60% of the territory was declared to have some degree of drought [24], while our results indicate 77% of the national surface. The difference is mainly due to the drought estimation methods used.
In the case of CONAGUA, Mexico’s official source of drought information, the SPI is used on a monthly basis and with a limited number of reference stations. However, the method used here contemplates a 12-month analysis, with 415 stations with data of more than 30 years per station, compared to the data available in Mexico in 2011 and processed by the North American drought monitor (NADM).
The geographical position of the country is a key element that defines the presence of droughts. The country is located between latitudes 14° and 32° north; this location coincides with areas of hot air descent that generate a humidity deficit. The Chihuahuan Desert, a representative ecosystem with little precipitation, is limited to the south at approximately 30° N. Thus, the northern region of the country is more prone to recurrent droughts; however, it is worth noting other regions where the presence of drought has become more frequent.
During the twenty-year period studied, it was observed that the northern region and the central region of the country, where the greatest agricultural production and its derivatives are concentrated, experienced the most extreme types of drought. Severe drought has affected 40% of the surface, and extreme drought has affected 27%, which demands attention. Drought costs are becoming increasingly serious. For example, it is estimated that for each month of severe, extreme, and exceptional drought, in these regions, 0.22, 0.32, and 0.39 points in the national GDP could be lost, respectively [25].
In the north of the country, losses of crops and livestock have been reported in Chihuahua, Coahuila, Durango, Nuevo León, San Luis Potosí, Sonora, and Tamaulipas. These states suffered damage to 2,700,000 hectares of bean and corn crops due to the drought of 2011 [26]. In that year, the affectation meant 35% of the national surface (with extreme drought). Additionally, in that year, 2.7 million hectares of crops were damaged due to drought in the states of Sinaloa, Zacatecas, and Guanajuato [27]; furthermore, water and food shortages in 68% of the territory occurred in subsequent years [28]. Thus, drought occurs with different intensities and frequencies in different areas of the country. In the period studied, for at least nine years, drought has impacted more than 50% of the territory. However, the impacts and consequences have been diverse, socially, economically, and environmentally.
The region of the Yucatan Peninsula has the highest concentration of municipalities, with a low-low relationship between vulnerability and drought. This region is less affected by these variables. This is because it is located in a region with the highest aquifer recharge at the national level (25,316 hm3/year). In addition, it has one of the largest renewable water reserves, 29,647 hm3/year [29]. In contrast, the country’s northeast and northwest regions have been mostly affected by droughts but show low vulnerability. This coincides with the findings of Carrão [30], who noted that the northern region has more socioeconomic capacity to manage problems and crises. Data from PNUD Programa de las Naciones Unidas para el Desarrollo [31], indicates that the northern municipalities with the greatest development are in the state of Nuevo León, where San Pedro Garza García is of particular note, with high values in the human development, education, health, and income indices.
According to data from CONEVAL [32], the states of Oaxaca and Guerrero show greater social lag at the national level despite advances in the last 24 years in increasing basic electricity services or drinking water coverage. In these states, municipalities have the lowest values for the variables used to calculate the vulnerability indicator. These and other entities need to improve their communities’ services for population development purposes and to reduce vulnerability to drought.
Vulnerability refers to the characteristics and circumstances of a community or system that make it susceptible to the damaging effects of a threat [33]. This can include physical, social, economic, and environmental factors that increase the risk of damage in the event of a disaster, such as the presence of a drought. Although this study considered a variety of indicators, it does not explore the underlying factors contributing to the increased vulnerability in recent years. The phenomenon can progress slowly until it affects natural ecosystems, including even the most resilient ones, such as forests.
It is commonly assumed that vegetation rebound from drought occurs immediately upon reintroduction of moisture. Nevertheless, studies have shown the presence of “legacy” effects of drought, such as reduced growth or incomplete recovery [34]. These effects are primarily observed in dry ecosystems or pine forests. Drought leads to a decrease in water supply to cells, causing dehydration. This results in a loss of cell rigidity, which may cause wilting in the plant. As a response, the plant closes its stomata to minimize water loss but also restricts the entry of carbon dioxide necessary for photosynthesis, resulting in oxidative harm to the plant’s tissues [35]. Consequently, drought has an adverse impact on plant development and growth. Forests are vulnerable to drought because they reduce plant morphology, such as leaf size, stem length, leaf length/width, and vegetative growth, as well as physiological traits, including photosynthesis reduction, decreased leaf water potential, and sap movement [35]. Although forests have deep root systems, the frequent presence of droughts can affect them or trigger other catastrophic events, such as forest fires or pests.
According to Cisneros [36], there is a direct relationship between drought events and the occurrence and spread of forest fires. In 2016, there was a 56% increase in the occurrence of forest fires compared to 2005. Additionally, the area affected by fires increased by 68%. An average of 7985 fires per year affected 317,441 hectares. The National Forest Information System [37] has recorded historical data on forest fires from 1970 to the present. The states with the greatest spread of forest fires are Jalisco, Chiapas, Chihuahua, Durango, and Coahuila; more than 1 million hectares have been affected. These regions coincide with the presence of droughts in the period studied.
After the great drought of 2011, an increase in pests, mainly primary and secondary debarking, was detected in temperate forests, which were previously affected by droughts. These damages were located in the states of Chihuahua, Coahuila, Nuevo León, Tamaulipas, Durango, Guanajuato, and Mexico City, with an affected area of more than twenty thousand hectares [38].
Thus, forest ecosystems are not exempt from the impacts of droughts. As the results show, 90% of the country’s forests have suffered from some drought in recent years. Practically half of the forest area (49%) has experienced an extreme and severe drought. In the latest report of the 2015–2020 national forest inventory, the presence of drought was reported in 26% of the sampled forest areas. Temperate forests represented 83% of the reports, tropical forests accounted for 7%, and the vegetation of semiarid zones accounted for 10% [39]. In many cases, drought is almost impossible to manage due to the lack of forecasts and early warnings, but in other cases, it is also due to the socio-economic characteristics of the communities as well as those of neighboring municipalities.
As previously presented, exposure to both drought and vulnerability (Figure 3a) is present in the country’s municipalities. This double exposure affects forests but also prevents an adequate social response. If both a municipality and its neighboring municipalities have high socioeconomic vulnerability, it is more difficult to anticipate drought or manage forest fires or pests. Temperate forests (mostly conifers) found in the states of Durango and Chihuahua are doubly exposed and should receive urgent attention due to the presence of both drought and greater socioeconomic vulnerability. The same situation can be found in other municipalities, though to a lesser degree, in the state of Michoacán and in the northern part of the state of Oaxaca.
However, there are also positive aspects of the presence of droughts. Notably, they can promote tree diversity in tropical forests, which in turn improves the system’s ability to adapt to drier conditions [40]. Additionally, the diversity in species, traits, and functional strategies to face drought is an important factor in regulating the vulnerability of ecosystems to drought. Mixed forests, with their greater diversity, have a lower vulnerability than monospecific forests during drought [41]. In other words, diversity strengthens the capacity of forests to resist and maintain stable operation in the face of extreme climatic events.
In summary, the results confirm that forests are vulnerable to drought for the following reasons: The geographical location results in wide arid and semiarid areas with little natural precipitation. Frequent occurrence and presence of droughts in the national territory. Socioeconomic characteristics of the population that lives in municipalities and forest territories make them vulnerable and, in some cases, prevent them from having plans to prevent medium- and far-horizon droughts. The ability of drought to trigger other catastrophes, such as fires or forest pests, which are increasingly frequent due to climate change. And the combination of two or more of the above in the same territory magnifies the drought exposure of forests and people.
Although the government has made important efforts, it is not prepared to face droughts and their consequences. Fenderman [42] establishes that the Mexican government has traditionally responded to the drought by implementing emergency assistance programs that are activated once the phenomenon has occurred. These programs are aimed at guaranteeing the supply of water and food, maintaining the health of the population, recovering the affected economy, and promoting relief projects. Palliative measures are considered until the rainy season returns, which ends the drought [26]. For this reason, technical and cartographic elements such as those presented here are essential for assisting in the formulation of proactive response plans for droughts.

5. Conclusions

Mexico has a complex territory and a geographic location conducive to droughts. The SPI-12 method was used to obtain annual cartography and accurately identify the presence of droughts in the country. This method is easy to apply and update with new data, and it can be replicated in other regions. Regarding the method to determine the vulnerability of the municipalities, it was a challenge to limit the variables to the ones recommended by the UNCCD. Although the results can shed light on the state of the municipalities, it is essential to establish better variables that are more focused, specific, and linked to drought. According to their exposure to drought or vulnerability, allocating weights to municipalities is useful and innovative in our territory. The same is true when considering neighboring municipalities; thus, defining vulnerability classes can advance the characterization of droughts and possible alternatives for their management. The impacts of this climatic phenomenon on municipalities and surrounding areas can be identified and jointly addressed. With regard to forest areas, the effect of drought is different throughout the country, but arid and semiarid areas have been affected more, as expected, due to their predominantly dry climate. However, drought’s prevalence in temperate ecosystems in recent years has been striking. It is worth paying attention to the states of Durango, Oaxaca, and Guerrero, which require urgent measures for drought adaptation and mitigation. The study tackled a significant issue for the country by introducing a method that can capture the effects of a natural phenomenon (drought) and the socioeconomic conditions of the people living in the forests (vulnerability). Future work should focus on identifying new vulnerability variables, integrating other data sources, as well as projections for climate change. Both increased temperatures and decreased precipitation magnify the country’s drought problem.

Supplementary Materials

The following supporting information can be downloaded at: https://www.mdpi.com/article/10.3390/f14091813/s1, Supplementary Material S1. Annual drought mapping from 2000 to 2020. Supplementary Material S2. Statistics of the variables. Supplementary Material S3. Value of variables and indices for all municipalities.

Author Contributions

Conceptualization, N.S.A.-C. and A.I.M.-R.; data curation, N.S.A.-C. and Y.C.-S.; formal analysis, N.S.A.-C., Y.C.-S. and A.I.M.-R.; investigation, N.S.A.-C. and Y.C.-S.; methodology, N.S.A.-C., Y.C.-S. and A.I.M.-R.; software, N.S.A.-C.; supervision, M.A.B.-d.l.R. and A.I.M.-R.; validation, N.S.A.-C., Y.C.-S., M.A.B.-d.l.R., M.R.G.-T. and A.I.M.-R.; visualization, N.S.A.-C.; writing—original draft, N.S.A.-C. and A.I.M.-R.; writing—review and editing, N.S.A.-C., Y.C.-S., M.A.B.-d.l.R., M.R.G.-T. and A.I.M.-R. All authors have read and agreed to the published version of the manuscript.

Funding

This research received no external funding. N.S.A.C. received a scholarship from the National Council of Science and Technology (CONACYT). The APC was funded by the DGIP program at Universidad Autónoma Chapingo.

Data Availability Statement

Data are available upon reasonable request from the corresponding author.

Acknowledgments

To the National Council of Science and Technology (CONACYT), to the Universidad Autónoma Chapingo, DGIP, Division of Forest Sciences, as well as the Master of Science Program in Forest Sciences. We gratefully acknowledge the comments and suggestions of the three anonymous reviewers, whose comments have substantially improved the paper.

Conflicts of Interest

The authors declare no conflict of interest.

References

  1. Wilhite, D.A. Chapter 1. Drought as a Natural Hazard: Concepts and Definitions. In Drought Mitigation Center Faculty Publications #69; University of Nebraska: Lincoln, NE, USA, 2000; 22p, Available online: https://digitalcommons.unl.edu/cgi/viewcontent.cgi?article=1068&context=droughtfacpub (accessed on 10 June 2023).
  2. WMO; GWP. Introduction. In Handbook of Drought Indicators and Indices; Svoboda, M., Fuchs, B.A., Eds.; Integrated drought Management Tools and Guidelines Series 2; World Meteorological Organization and Global Water Partnership: Geneva, Switzerland, 2016; pp. 1–11. Available online: https://www.droughtmanagement.info/literature/GWP_Handbook_of_Drought_Indicators_and_Indices_2016.pdf (accessed on 8 June 2023).
  3. CONAGUA. Atención a la Sequía en México. Secretaría de Medio Ambiente y Comisión Nacional del Agua. Ciudad de México. 27p. Available online: https://www.gob.mx/cms/uploads/attachment/file/629223/CP_Presentaci_n_Sequ_a_Medios_14042021.pdf (accessed on 10 June 2023).
  4. SEGOB. Acuerdo de Carácter General de Inicio de Emergencia por Ocurrencia de Sequía Severa, Extrema o Excepcional en Cuencas Para el Año 2022. Diario Oficial de la Federación 2022, 41–43. Available online: https://dof.gob.mx/nota_detalle.php?codigo=5657697&fecha=12/07/2022#gsc.tab=0 (accessed on 8 June 2023).
  5. WMO. High-impact events 2021. In State of Global Water Resources 2021; World Meteorological Organization (WMO): Geneva, Switzerland, 2022; pp. 21–24. [Google Scholar]
  6. WMO. Status of mortality and economic losses due to weather, climate and water-related hazards from 1970 to 2019. In Atlas of Mortality and Economic Losses from Weather, Climate and Water Extremes (1970–2019); World Meteorological Organization (WMO): Geneva, Switzerland, 2021; pp. 16–54. Available online: https://library.wmo.int/doc_num.php?explnum_id=10989 (accessed on 8 June 2023).
  7. OMM; CONAGUA. Investigación sobre sequía meteorológica. In Fortalecimiento Del Manejo Integrado Del Agua En México (PREMIA); Magaña, V., Ed.; Comisión Nacional del Agua: Mexico City, Mexico, 2013; pp. 12–19. [Google Scholar]
  8. Mckee, T.B.; Doesken, N.J.; Kleist, J. The Relationship of Drought Frequency and Duration to Time Scales. In Proceedings of the 8th Conference on Applied Climatology, Anaheim, CA, USA, 17–22 January 1993; 6p. Available online: https://www.droughtmanagement.info/literature/AMS_Relationship_Drought_Frequency_Duration_Time_Scales_1993.pdf (accessed on 8 June 2023).
  9. Palmer, W.C. Meteorological Drought; Research Paper No.45; US Department of Commerce: Washington, DC, USA, 1965. Available online: https://www.droughtmanagement.info/literature/USWB_Meteorological_Drought_1965.pdf (accessed on 8 June 2023).
  10. Marinescu, P.J.; Hilburn, K.; Abdi, D.; Jankov, I.; Marinescu, P.J. A Comparison of NOAA Modeled and In Situ Soil Moisture Estimates Across the Continental United States. Authorea 2022, 1–15. [Google Scholar] [CrossRef]
  11. Mishra, A.K.; Singh, V.P. A Review of Drought Concepts. J. Hydrol. 2010, 391, 202–216. [Google Scholar] [CrossRef]
  12. Villazón Gómez, J.A.; Noris Noris, P.; García Reyes, R.A. Uso Del Índice de Precipitación Estandarizado Para La Evaluación de La Intensidad de La Sequía En La Provincia de Holguín. Idesia 2021, 39, 103–109. Available online: https://revistas.uta.cl/pdf/253/11-villazon_gomez_39_4_2021.pdf (accessed on 28 June 2023). [CrossRef]
  13. Olivares, B.O.; López-Beltrán, M.A. Índice de Vegetación de Diferencia Normalizada Aplicado Al Territorio Indígena Agrícola de Kashaama, Venezuela. Cuad. Investig. UNED 2019, 11, 112–121. [Google Scholar] [CrossRef]
  14. Arreguín Cortés, F.I.; López Pérez, M.; Federman, D.K.; Ortega-Gaucin, D. The National Drought Policy in Mexico. J. Energy Chall. Mech. 2016, 3, 157–166. Available online: https://www.nscj.co.uk/JECM/PDF/3-3-7-Arreguin.pdf (accessed on 30 June 2023).
  15. CONAGUA. Política Pública Nacional Para La Sequía; Comisión Nacional del Agua: Coyoacán, Mexico, 2018; 45p. Available online: https://faolex.fao.org/docs/pdf/mex200989.pdf (accessed on 28 June 2023).
  16. CONAGUA. Programa Nacional Contra La Sequía (PRONACOSE). Ciudad De México. 2022. Available online: https://www.gob.mx/cms/uploads/attachment/file/774064/Actualizaci_n_Pol_tica_P_blica_Nacional_para_la_Sequ_a_SEP2022.pdf (accessed on 29 June 2023).
  17. Zepeda Gil, R.; Huerta Pineda, A.; Sánchez Correa, M.K.; Sánchez Ramírez, M.C. La vulnerabilidad ante desastres naturales en el mundo y México. In La Vulnerabilidad de México Ante El Cambio Climático: Una Revisión del Sistema Nacional de Protección Civil, 1st ed.; Senado de la República: Mexico City, Mexico, 2018; 164p. Available online: http://bibliodigitalibd.senado.gob.mx/bitstream/handle/123456789/4108/Cuaderno%20SINAPROC%20FIinalWeb%20sencillas%20OK.pdf?sequence=1&isAllowed=y (accessed on 29 June 2023).
  18. Barker, L.J.; Rickards, N.J.; Sarkar, S.; Hannaford, J.; King-Okumu, C.; Rees, G. Good Practice Guidance for National Reporting on UNCCD Strategic Objective 3; To mitigate, adapt to, and manage the effects of drought in order to enhance resilience of vulnerable populations and ecosystems; UNCCD: Bonn, Germany, 2021; 114p, Available online: https://www.unccd.int/sites/default/files/documents/2021-09/UNCCD_GPG_Strategic-Objective-3_2021.pdf (accessed on 29 June 2023).
  19. Cid, A.; Cano, D.; Montalvo, V.; Ruíz-Bedolla, K.; Romero-Cazares, M.; Monterroso-Rivas, A.I.; Caso, M.; García-Meneses, P.M. Insights for Building Institutional Capacities for Climate Change Adaptation: Evidence from Mexico. In Handbook of Climate Change Management; Leal Filho, W., Luetz, J., Ayal, D., Eds.; Springer: Cham, Switzerland, 2020; pp. 1–21. [Google Scholar] [CrossRef]
  20. RStudio Desktop, version 2023.06.2+561, Programming Language; Posit Data Science: Chicago, IL, USA, 2023.
  21. Siabato, W.; Guzmán-Manrique, J. La Autocorrelación Espacial y El Desarrollo de La Geografía Cuantitativa. Cuad. Geogr. Rev. Colomb. Geogr. 2019, 28, 1–22. [Google Scholar] [CrossRef]
  22. GeoDa, version 1.22, geographic information system; Luc Anselin´s Team: Chicago, IL, USA, 2023.
  23. CONAFOR; UACH. Resultados. In Informe Nacional 2018 De Acciones Contra La Desertificación, Degradación De Tierras Y Sequía En México; Gómez-Diaz, J., Ruíz-García, P., González-Millán, M., De León-Siller, E., Eds.; Comisión Nacional Forestal y Universidad Autónoma Chapingo: Texcoco, Mexico, 2018; pp. 21–96. [Google Scholar]
  24. Semarnat. Informe de la Situación del Medio Ambiente en México. Compendio de Estadísticas Ambientales. Indicadores Clave y de Desempeño Ambiental. Edición 2012. México. 2013. Capítulo 6. Fenómenos Meteorológicos Extremos: El Caso de La Sequía. Available online: https://apps1.semarnat.gob.mx:8443/dgeia/informe_12/06_agua/recuadro1.html (accessed on 30 June 2023).
  25. Banco de México. Sequía En México y Su Potencial Impacto En La Actividad Económica. In Informe Trimestral Abril–Junio 2022; Banco de México: Mexico City, México, 2022; 10p, Available online: https://www.banxico.org.mx/publicaciones-y-prensa/informes-trimestrales/recuadros/%7B3A0127A1-D0C9-7D61-C9AE-E57E127FB39B%7D.pdf (accessed on 30 June 2023).
  26. Esparza, M. Drought and Water Shortages in Mexico: Current Status and Future Prospects. Secuencia 2014, 89, 193–219. [Google Scholar] [CrossRef]
  27. INEGI. Estadísticas a Propósito del Día Mundial de la Lucha Contra la Desertificación y la Sequía; Instituto Nacional de Geografía, Estadística e Informática: Aguascalientes, Mexico, 2012; 10p. Available online: https://www.iieg.gob.mx/contenido/GeografiaMedioAmbiente/INEGI_Diamundialcontraladesertificacionylasequia.pdf (accessed on 30 June 2023).
  28. Dominguez, J. Historical Review of Drought in Mexico: From the Divine Explanation to the Incorporation of Science. Tecnol. Cienc. Agua 2016, 7, 77–93. Available online: http://revistatyca.org.mx/index.php/tyca/article/view/1272 (accessed on 12 May 2023).
  29. SEMARNAT; CONAGUA. Estadísticas Del Agua En México 2019; Comisión Nacional del Agua: Coyoacán, Mexico, 2019; pp. 10–42.
  30. Carrão, H.; Naumann, G.; Barbosa, P. Mapping Global Patterns of Drought Risk: An Empirical Framework Based on Sub-National Estimates of Hazard, Exposure and Vulnerability. Glob. Environ. Chang. 2016, 39, 108–124. [Google Scholar] [CrossRef]
  31. PNUD. Transformando México Desde Lo Local. In Informe de Desarrollo Humano Municipal 2010–2015; Programa de las Naciones Unidas para el Desarrollo: Mexico City, Mexico, 2019; 348p, Available online: https://www.undp.org/es/mexico/publicaciones/idh-municipal-2010-2015 (accessed on 12 May 2023).
  32. CONEVAL. Resultados de Pobreza en México 2020 a Nivel Nacional y Por Entidades Federativas. Available online: https://www.coneval.org.mx/Medicion/Paginas/PobrezaInicio.aspx (accessed on 12 May 2023).
  33. CIIFEN. Definición De Riesgo. Centro Internacional para la Investigación del Fenómeno de El Niño. Guayaquil. Ecuador. Available online: https://ciifen.org/definicion-de-riesgo/ (accessed on 19 July 2023).
  34. Anderegg, W.R.L.; Schwalm, C.; Biondi, F.; Camarero, J.J.; Koch, G.; Litvak, M.; Ogle, K.; Shaw, J.D.; Shevliakova, E.; Williams, A.P.; et al. Pervasive Drought Legacies in Forest Ecosystems and Their Implications for Carbon Cycle Models. Science 2015, 349, 528–532. [Google Scholar] [CrossRef] [PubMed]
  35. Bhusal, N.; Park, I.H.; Jeong, S.; Choi, B.-H.; Han, S.-G.; Yoon, T.-M. Photosynthetic Traits and Plant Hydraulic Dynamics in Gamhong Apple Cultivar under Drought, Waterlogging, and Stress Recovery Periods. Sci. Hortic. 2023, 321, 112276. [Google Scholar] [CrossRef]
  36. Cisneros-González, D.; Zúñiga-Vásquez, J.M.; Pompa-García, M. Actividad Del Fuego En Áreas Forestales de México a Partir de Sensores Remotos y Su Sensibilidad a La Sequía. Madera Bosques 2018, 24, e2431687. [Google Scholar] [CrossRef]
  37. CONAFOR. Manejo Del Fuego. Sistema Nacional De Información Forestal. Guadalajara, Jalisco. Available online: https://snif.cnf.gob.mx/incendios/ (accessed on 28 June 2023).
  38. García Rodriguez, J.L.; CONAFOR. La Sequía En Terrenos Forestales. In Proceedings of the Seminario de información estadística y geográfica para prevenir y mitigar los efectos de la sequía e inundaciones en la población y la economía, Mexico City, Mexico, 1–30 November 2012. [Google Scholar]
  39. Leyva Ovalle, Á.; Valdez-Lazalde, J.R.; De los Santos-Posadas, H.M.; Martínez-Trinidad, T.; Herrera Corredor, J.A.; Lugo Espinosa, O.; García Nava, J.R. Monitoreo de La Degradación Forestal En México Con Base En El Inventario Nacional Forestal y de Suelos (INFyS). Madera Bosques 2017, 23, 69–83. [Google Scholar] [CrossRef]
  40. O’Brien, M.J.; Reynolds, G.; Ong, R.; Hector, A. Resistance of Tropical Seedlings to Drought Is Mediated by Neighbourhood Diversity. Nat. Ecol. Evol. 2017, 1, 1643–1648. [Google Scholar] [CrossRef] [PubMed]
  41. Chen, Q.; Timmermans, J.; Wen, W.; van Bodegom, P.M. Ecosystems Threatened by Intensified Drought with Divergent Vulnerability. Remo. Sens. Environ. 2023, 289, 113512. [Google Scholar] [CrossRef]
  42. Federman, D.K.; Cortés, F.I.A.; Pérez, M.L. Constructing a Framework for National Drought Policy: The Way Forward in Mexico. Weather. Clim. Extrem. 2014, 3, 90–94. [Google Scholar] [CrossRef]
Figure 1. Presence of (a) cumulative drought for 21 years studied (2000–2020), (b) drought in the most severe year 2011, and (c) drought in the least affected year 2015.
Forests 14 01813 g001
Figure 2. (a) Vulnerability in municipalities and dimensions that compose it: (b) social dimension, (c) economic dimension, and (d) infrastructure dimension.
Forests 14 01813 g002
Figure 3. (a) Classes of vulnerability to drought in municipalities of Mexico and (b) types of dominant forest cover. Red colors refer to high-high correlation between drought and vulnerability (HH), green to high drought and low vulnerability correlation (HL), purple to low drought and high vulnerability correlation (LH), and gray to no significance between drought and vulnerability. (NS).
Forests 14 01813 g003
Figure 4. Type of drought (top) and type of vulnerability (bottom) in forest areas of Mexico according to region: (a,d) temperate, (b,e) tropical, (c,f) semiarid.
Forests 14 01813 g004
Table 1. Spatial correlation classes of municipalities according to vulnerability and drought with neighboring municipalities.
Correlation
ClassNeighbors with DroughtWith Vulnerable NeighborsPolicy/ManagementTotal
Municipalities
HHHighHighUrgent attention143
HLHighLowEarly warning systems383
LHLowHighEncourage adaptive capacity510
LLLowLowMonitoring327
NSNot significantMonitoring1106
Total municipalities in country2469
Disclaimer/Publisher’s Note: The statements, opinions and data contained in all publications are solely those of the individual author(s) and contributor(s) and not of MDPI and/or the editor(s). MDPI and/or the editor(s) disclaim responsibility for any injury to people or property resulting from any ideas, methods, instructions or products referred to in the content.

