Abstract
Accurately estimating aboveground biomass (AGB) is crucial for assessing carbon storage in forest ecosystems. However, traditional field survey methods are time-consuming, and vegetation indices based on optical remote sensing are prone to saturation effects, potentially underestimating AGB in subtropical forests. To overcome these limitations, we propose an improved approach that combines three-dimensional (3D) forest structure data collected using unmanned aerial vehicle light detection and ranging (UAV LiDAR) technology with ground measurements to apply a binary allometric growth equation for estimating and mapping the spatial distribution of AGB in subtropical forests of China. Additionally, we analyze the influence of terrain factors such as elevation and slope on the distribution of forest biomass. Our results demonstrate a high accuracy in estimating tree height and diameter at breast height (DBH) using LiDAR data, with an R2 of 0.89 for tree height and 0.92 for DBH. In the study area, AGB ranges from 0.22 to 755.19 t/ha, with an average of 121.28 t/ha. High AGB values are mainly distributed in the western and central-southern parts of the study area, while low AGB values are concentrated in the northern and northeastern regions. Furthermore, we observe that AGB in the study area exhibits an increasing trend with altitude, reaching its peak at approximately 1650 m, followed by a gradual decline with further increase in altitude. Forest AGB gradually increases with slope, reaching its peak near 30°. However, AGB decreases within the 30–80° range as the slope increases. This study confirms the effectiveness of using UAV LiDAR for estimating and mapping the spatial distribution of AGB in complex terrains. This method can be widely applied in productivity, carbon sequestration, and biodiversity studies of subtropical forests.
1. Introduction
Estimating aboveground biomass (AGB) is critical for assessing carbon storage and the quality of forest ecosystems [1,2]. AGB plays a significant role in the carbon cycle between land and atmosphere and climate change [3,4]. Accurate and rapid acquisition of spatial distribution of AGB not only improves resource assessment, carbon storage, and carbon modeling but also plays a vital role in the spatiotemporal monitoring of structure and function of forest ecosystems [5].
Traditional methods for estimating forest AGB relies on high-density ground surveys and the construction of statistical models for tree growth equations [6,7]. While these methods offer high accuracy, they are time-consuming and challenging to implement for spatial distribution and monitoring of AGB at large scales [8]. With the advancement of remote sensing technology, various sensors such as optical remote sensing, light detection and ranging (LiDAR), and aerial photography have been widely used for AGB monitoring [9,10,11,12,13]. Each remote sensing sensor has strengths and limitations, which can be leveraged in different situations to improve AGB estimation accuracy [14]. In subtropical and tropical forests, the relationship between AGB derived from optical remote sensing data and vegetation indices (such as the Normalized Difference Vegetation Index, Enhanced Vegetation Index, Ratio Vegetation Index, and Difference Vegetation Index) may be affected by saturation effects, resulting in underestimation of AGB [15]. To address this issue, various empirical regression models and non-parametric algorithms based on different remote sensing data, such as multispectral, synthetic aperture radar, and LiDAR, have been developed for AGB estimation [16,17,18]. For example, scientists effectively depicted the distribution of AGB in California’s national forests by integrating data from medium-resolution imaging spectrometers with precipitation, temperature, and altitude information [19]. AGB estimation models have also been proposed, including process-based ecosystem models, Geographic Information System (GIS)-based empirical models, biomass expansion factor models, and LiDAR-based estimation models [20]. However, accuracy validation is particularly crucial for AGB estimation in complex terrain forests due to the uncertainties associated with the variables, parameters, and their interactions obtained from different methods [21].
Topography is an important environmental factor in forest ecosystems that regulates the distribution of AGB by affecting soil type, soil hydrological processes, temperature, light conditions, and photosynthetic efficiency [22,23]. Altitude, slope, and aspect act as pivotal drivers for tree species distribution, with vegetation at varying elevations potentially facing constraints associated with temperature fluctuations and the availability of water, which affects the distribution of AGB [24,25,26]. Utilizing generalized additive models (GAMs), a study revealed that within a defined range (e.g., 500 to 2000 m), AGB exhibits an increasing trend with altitude, while beyond this range (e.g., above 2000 m), the relationship tends to reach saturation [27]. The growth of trees in valleys experiences detrimental effects due to high humidity, resulting in reduced transpiration rates and nutrient uptake. Valleys also suffer from diminished sunlight availability caused by dense canopies, ultimately leading to lower photosynthetic intensity and reduced biomass accumulation [28]. Steep slopes (e.g., greater than 30 degrees) exhibit a concentration of AGB in small-diameter trees, whereas flat areas tend to concentrate most of the AGB within a few large trees [29]. Present research on the influence of terrain on AGB primarily relies on field survey data obtained at the plot scale. Nevertheless, due to the limited size and duration of traditional field plots, accurately capturing the impact of complex terrain conditions on tree species coexistence and the spatial distribution of AGB at the regional scale remains a challenge [30,31,32].
Unmanned aerial vehicle (UAV) LiDAR, as an active remote sensing technology, enables direct acquisition of precise 3D structural information of forest canopies and terrain at high spatial resolution [33,34]. Compared to traditional remote sensing methods, UAV LiDAR offers higher detection accuracy and is more convenient for data collection in challenging field environments, making it widely utilized for obtaining structural and functional parameters of forest ecosystems [35,36,37,38]. The objective of this study is to accurately estimate AGB of subtropical forests in China by utilizing high-resolution forest canopy and terrain 3D information obtained from UAV LiDAR. Firstly, we extract the 3Dstructure of the forest using LiDAR data. Secondly, we assess the accuracy of the extracted LiDAR data by combining it with ground survey data. Finally, we employ a binary allometric equation to estimate and map the spatial distribution of AGB in the subtropical forests of China. Specifically, the objectives of this study include: (1) utilizing UAV LiDAR to capture the structural attributes of single trees for estimating AGB in subtropical forests and validating its accuracy; (2) mapping the spatial distribution of AGB within 1.72 km2 of the study area; (3) exploring the effects of topography (altitude and slope) on the spatial distribution of AGB in the study area.
2. Materials and Methods
2.1. Study Area
Jiangxi Nanfengmian National Nature Reserve is located in Suichuan County, Jiangxi Province, as shown in Figure 1. It lies on the eastern side of the southern segment of Wanyang Mountain and the northern segment of Zhuguang Mountain, within the southern section of the Luoxiao Mountain Range. The reserve’s coordinates range from 114°40′50″ to 114°07′20″ E and 26°17′09″ to 26°22′44″ N. A subtropical hilly and mountainous monsoon humid climate, with mild temperatures, abundant rainfall, and significant terrain variations throughout the area, characterizes the climate in this region. The average annual temperature ranges from 15.1 °C to 17 °C, while the annual precipitation ranges between 1400 and 2000 mm. The frost-free period extends for an average of 287 days per year [39]. The dominant vegetation type in this area is subtropical evergreen broad-leaved forest, consisting primarily of well-established evergreen populations, including species from the families Fagaceae, Lauraceae and Theaceae (Figure S1).
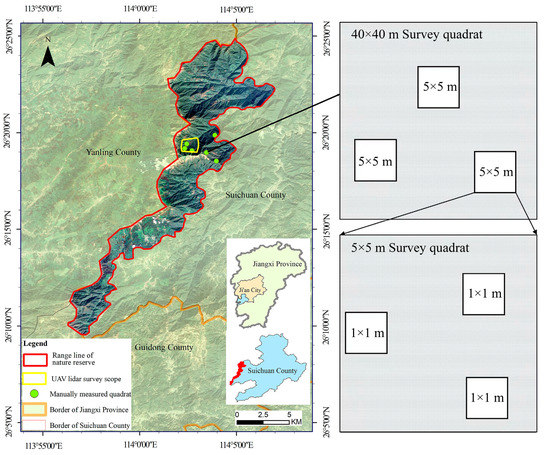
Figure 1.
The study area and 40 × 40 m sample plot.
2.2. Methods
2.2.1. Technical Processes
The technical workflow of this study is illustrated in Figure 2. Initially, UAV LiDAR is employed to acquire precise 3D structural information of single trees. Subsequently, measurement data, including tree height and tree diameter at breast height (DBH), are collected from representative sample plots (Figure 2). The accuracy of the LiDAR-derived data is assessed through rigorous evaluation. Finally, an empirical biomass model is applied to estimate AGB across the study area, thereby mapping the distribution of AGB.
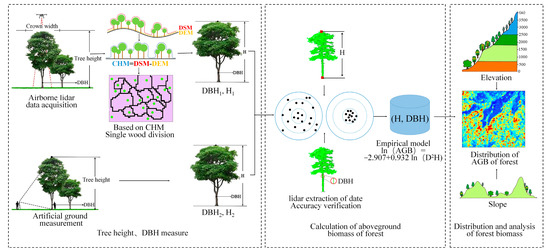
Figure 2.
The technical workflow for mapping AGB based on UAV LiDAR data. Digital elevation model (DEM); digital surface model (DSM); canopy height model(CHM).
2.2.2. Data Acquisition
On 19 November 2021, laser point cloud data for forest structure analysis was collected in the study area using a DJI M300 RTK drone equipped with an onboard LiDAR system (Figure S2). The flight altitude ranges from 300 to 400 m above ground level, with a scanning angle of 30°. The drone follows a single S-shaped flight path and conducts four flights, covering a total scanning area of 1.72 km2. The laser pulse frequency is set to 380 KHz, the measurement accuracy is 10 mm, and the average point cloud density is 50.5 times per square meter (Table 1). When paired with a Global Positioning System (GPS) inertial measurement unit (IMU) system, the UVA LiDAR subsystem offers 3D positioning accuracy and data, enabling it to create a detailed 3D map of the forest canopy and terrain. The subsystem can accurately position each LiDAR point cloud.

Table 1.
Flight parameters of UVA LiDAR system.
From 10 to 15 July 2021, a field survey plot measuring 40 m × 40 m was established in the study area (Figure S1). Measurements and records were made for each tree within the plots, including tree DBH, tree height, height to the lowest branch, crown width, relative coordinates, and crown density. The RD1000 laser altimeter was used to measure tree height and height to the lowest branch. Subsequently, a tape measure was used to measure the vertical projection of the crown in the east–west and north–south directions to determine the crown diameter. The southwest corner of the plot was set as the origin of the coordinate system, with the east–west direction corresponding to the X-axis and the north–south direction corresponding to the Y-axis. GPS differential positioning was conducted for the four corner points of the plot.
2.2.3. Tree Height, DBH Extraction, and Accuracy Verification
Tree height and DBH are significantly correlated with the AGB of an individual tree, and are important parameters for inverting tree biomass. In this study, UAV LiDAR was used to obtain the attribute characteristics of single wood structure. The point cloud data collected by the UAV LiDAR system is processed by the onboard forestry module on LiDAR 360. The primary procedures involve denoising the laser point cloud data, filtering, segregating ground points, and creating a digital elevation model (DEM) and digital surface model (DSM). The DSM-DEM is then applied to generate a canopy height model (CHM), followed by segmenting single trees using the single-wood segmentation approach based on the CHM. We can obtain a segmented attribute table for single trees, which includes information such as the tree’s location, height, canopy diameter, and canopy area.
According to the tree height parameters extracted by UAV LiDAR, the empirical model of tree height and DBH was used to obtain tree DBH information. The forest type in the study area was natural broadleaf forest, so the H-DBH empirical model suitable for broadleaf forest species was selected [40] to obtain DBH; the specific formula was as follows:
where H is the tree height (m), and D is the diameter breast high (cm).
H = 1.3 + 20.3586 (1 − e(−0.0451×D))
To validate the accuracy of tree height and DBH extraction based on UAV LiDAR, a linear regression relationship was established between the extracted data and field survey data. The coefficient of determination (R2) and correlation coefficient (p-value) were used to verify the results.
2.3. Estimation and Analysis of AGB in the Study Area
Estimating AGB of forests is typically achieved through the inversion of allometric equations that consider key factors such as tree height and DBH. In this study, we could not employ the weighing method for calculating forest AGB due to practical constraints. Therefore, we utilized tree height and DBH obtained from UAV LiDAR data to estimate AGB. To achieve the most accurate estimation of forest AGB, we employed an empirical model specific to the local vegetation type, namely, the subtropical evergreen broad-leaved forest, represented by the equation ln(AGB) = −2.907 + 0.932 ln(D2H) [41], to estimate the AGB of single tree species within the study area. We generated spatial distribution maps of AGB in the study area based on tree height and DBH data obtained from UAV LiDAR. Additionally, we employed the “ggplot2″ package in R.4.3.1 software to explore the effects of altitude and slope on the spatial distribution of AGB.
3. Results
3.1. Spatial Distribution of DSM, DEM, and CHM
Altitude of the study area is in the range of 1348.2–1905.4 m, with an average altitude of 1613.8 m, and the overall topography is high in the southwest and low in the northeast. Digital surface elevation values are between 1355.4–1909.9 m (Figure 3). The range of canopy height is within 0–35.7 m, and the taller trees are mainly distributed in the south-central and northwestern areas of the study area. A total of 50,547 single trees are generated, and the single tree structure information table is obtained based on the CHM. More single trees are distributed in the north of the study area than in the south, which is consistent with the actual situation in the field investigation.
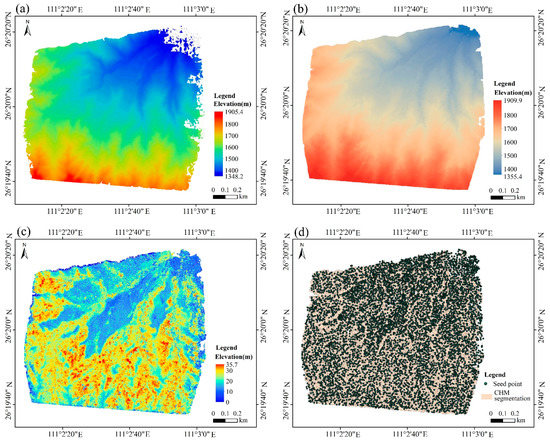
Figure 3.
Spatial distribution of DEM, DSM, CHM, and single-wood segmentation. (a) Digital elevation model; (b) digital surface model; (c) canopy height model; (d) based on CHM single-wood segmentation.
3.2. Verification of Tree Height and DBH
To evaluate the accuracy of forest parameter estimation using UAV LiDAR, we established a linear regression relationship between the 3D structure of single trees extracted from UAV LiDAR and manually measured tree height and DBH. The validation results, as shown in Figure 4, indicate a high level of agreement between ground-measured DBH and UAV LiDAR-measured DBH. In terms of DBH, R2 was 0.92 (p < 0.05), and for tree height, R2 was 0.89 (p < 0.05, Figure 4). These findings suggest a strong consistency between UAV LiDAR measurements and ground-based measurements, with an estimated measurement accuracy of approximately 90% (Table 2).
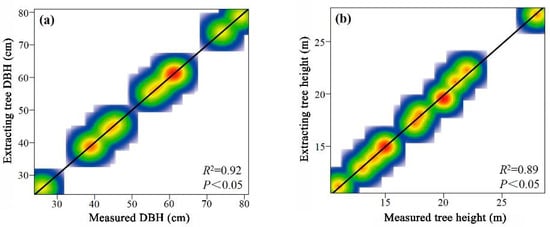
Figure 4.
LiDAR extraction data accuracy verification. (a) LiDAR extraction tree DBH accuracy verification. (b) LiDAR extraction tree height accuracy verification.

Table 2.
Accuracy verification table for Tsuga chinensis.
3.3. Spatial Distribution of AGB and Diameter Structure Distribution in the Study Area
Based on the single tree information obtained from UAV LiDAR data and empirical biomass models, we estimated the forest’s AGB in the study area and mapped its spatial distribution. The AGB values in the study area ranged from 0.22 to 755.19 t/ha, with an average value of 121.28 t/ha (Figure 5). High AGB values were observed in the western and central-southern parts of the study area, while low AGB values were mainly distributed in the northern and northeastern regions, which aligns well with the CHM and ground observations.
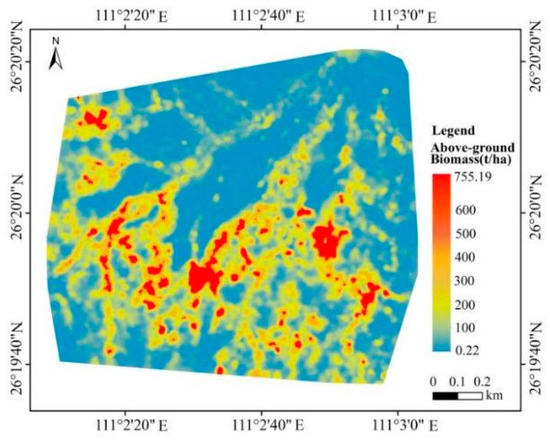
Figure 5.
Spatial distribution of aboveground biomass in forests in the study area.
The relationship between the number of individual trees, diameter classes, and forest aboveground biomass (AGB) in the study area can be revealed by analyzing the proportions of small-diameter (0 < DBH ≤ 10 cm), medium-diameter (DBH > 10 cm), and large-diameter (DBH > 30 cm) trees. The proportions of small-, medium-, and large-diameter trees in the study area are 48.99%, 46.62%, and 4.40%, respectively. However, the proportions of forest AGB for these diameter classes are 3.97%, 56.58%, and 39.45%, respectively. The contribution of medium- to large-diameter trees to forest AGB in the study area exceeds 95% (Figure 6).
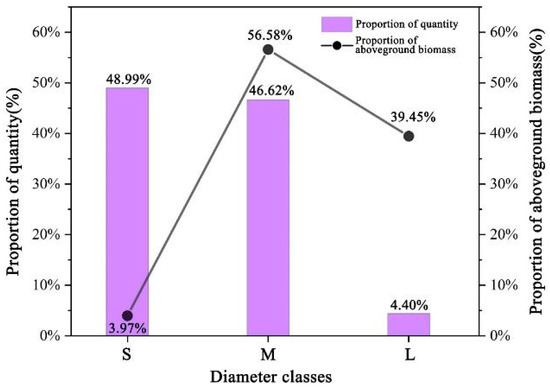
Figure 6.
Proportion of tree quantity and AGB. S, M, and L represent small- (0 < DBH ≤ 10 cm), medium- (10 < DBH ≤ 30 cm), and large-diameter (30 cm < DBH) trees, respectively.
3.4. The Effects of Altitude and Slope on the Spatial Distribution of AGB
AGB in the study area is mainly concentrated within the altitude range of 1400 m to 1900 m. Within the range of 1400 m to 1650 m, the AGB gradually increases with increasing altitude and reaches its peak around 1650 m. However, within the range of 1650 m to 1900 m, the AGB gradually decreases with further increase with altitude (Figure 7a). In the area where altitude is below 1600 m, the slope values are concentrated between 0 and 40°.
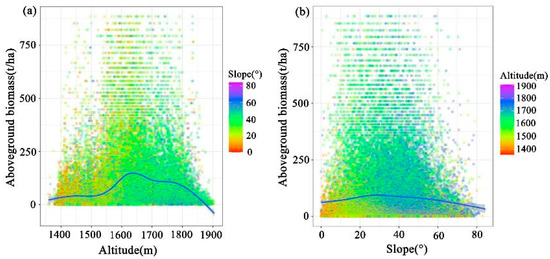
Figure 7.
Relationship between AGB, altitude, and slope in the study area. (a) the relationship between AGB and altitude; (b) the relationship between AGB and slope.
In the slope range of 0–30°, AGB gradually increases with increasing slope and reaches its peak around 30°. In the range of 30–80°, AGB decreases with increasing slope (Figure 7b). In the area where the slope values are above 40°, the altitude is concentrated between 1600 and 1900 m.
4. Discussion
This study evaluated the accuracy of extracting individual tree structural attributes from UAV LiDAR data through field surveys, and the results were found to meet the required accuracy standards. Based on the UAV LiDAR-derived tree height and diameter data, combined with a binary aboveground biomass empirical model using tree height and diameter, the estimation and mapping of forest aboveground biomass at a regional scale were successfully conducted. Furthermore, the impacts of typical terrain factors, such as elevation and slope, on forest aboveground biomass distribution patterns were analyzed. The results of this study demonstrate that UAV LiDAR technology enables rapid and accurate estimation and spatial mapping of aboveground biomass in subtropical forests.
Previous studies have indicated that factors such as soil fertility, elevation, climate, species composition, and topography influence the spatial distribution of AGB at the regional scale [42,43,44]. This study reveals that the western and central-southern regions of the study area exhibit higher levels of AGB, primarily due to the concentrated distribution of large-diameter trees in these regions. Environmental conditions such as temperature, sunlight, and air humidity create favorable conditions for the growth and development of these large trees [45]. Despite accounting for only 4.4% of the total number of trees, these large trees contribute to 39.45% of AGB in the study area. Therefore, the density of large trees can partially explain the variation in the spatial distribution of AGB in forest ecosystems [46,47].
Different species exhibit different habitat preferences in terms of spatial distribution. Differences in species niche differentiation may be responsible for species’ choice of different habitats. Species will accumulate higher biomass in areas with the most suitable environmental conditions, while the total biomass depends on species with high carbon stocks [48,49,50]. Natural or anthropogenic disturbances and restrictions on seed dispersal may also lead to spatial aggregation of specific species in specific habitats [51], resulting in a significant association of forest biomass with habitats.
Changes in temperature and precipitation resulting from changes in altitude have led to spatial variability in AGB of terrestrial ecosystems [52]. Previous studies have indicated that the AGB of vegetation communities in most vegetation types significantly decreases with increasing altitude, primarily due to the gradual decrease in temperature with altitude [53]. At an altitude beyond a certain level, the precipitation in mountainous areas no longer increases with altitude [54,55]. Lower temperatures limit plant growth, while higher temperatures, precipitation, and CO2 concentration can accelerate organic matter mineralization, potentially leading to increased forest biomass in lower altitude areas [56,57]. However, some findings suggest a gradual increase in forest AGB with altitudes between 1400 m and 1650 m, which is a positive effect, but a negative effect is observed above 1650 m. This is consistent with our study results, indicating that within a certain range [58], stand density increases with altitude, and environmental conditions and species habitat selection determine the distribution pattern of AGB.
The distribution of high AGB values in the study area was concentrated on a slope of about 30° and then gradually decreased to both sides. On the one hand, most of the places with high slopes (>25°) are in steep hills, cliffs, etc., with severe soil erosion, and poor site conditions; due to gravity, large-diameter trees are easy to fracture and collapse, and small-diameter trees are more likely to survive, so the AGB is low. In low-slope areas, trees with large diameters account for a larger proportion of forest biomass [29]. Moreover, flat land with sufficient sunlight and suitable terrain is conducive to plant growth and the maintenance of biodiversity, while valleys with limited sunlight and barren soil may be unfavorable for plant growth [59]. The study area’s north-central and northeastern regions have slopes below 30° and trees are located on shaded slopes. In these areas, there are many small-diameter trees, and the AGB is relatively low. In the west and south-central region, slopes are around 30–80° and trees grow mainly on sunny slopes. Here, the number of large-diameter trees is large, photosynthesis is vital, and the AGB is high, suggesting that the availability of light may also be a major factor in differences in species composition between habitats and may contribute to differences in AGB of forests [60].
5. Conclusions
Our results suggested that UAV LiDAR can be used for rapid and accurate estimation of AGB in the forest of this region. The study employed an efficient method that combines UAV LiDAR with a binary allometric growth equation empirical model to generate AGB distribution maps in large-scale batches [61]. This method suits ecologically complex subtropical forest ecosystems with challenging terrain, offering a potential alternative to traditional manual surveys. However, we need to acknowledge that the errors in LiDAR data extraction primarily stem from point cloud data processing, particularly in the extraction of parameters such as single tree segmentation, tree height, and DBH. Existing algorithms for LiDAR point cloud data extraction also have certain limitations, with their applicability varying depending on the circumstances, making them unable to provide absolute accuracy and universality in all cases. Additionally, the study area is relatively small, with limited coverage of altitudinal ranges. A broader range of altitudes and slopes should be considered to investigate the influence of terrain factors on the spatial distribution of AGB. Future studies should integrate UAV LiDAR, multi-source optical remote sensing data, and long-term monitoring plots to investigate the dynamics of subtropical forest tree populations, environmental changes, and their interactions with AGB at larger scales.
Supplementary Materials
The following supporting information can be downloaded at: https://www.mdpi.com/article/10.3390/f14081560/s1, Figure S1: 40 × 40 m survey plots, vegetation status, and photographs of field surveys. Figure S2: Three-dimensional digital elevation model (DEM) of the study area, photographs of the UAV equipment, and a schematic diagram of the UAV flight path planning.
Author Contributions
Conceptualization, G.W., S.L., C.H. and L.Q.; methodology, G.W., S.L. and C.H.; validation, G.W., C.H. and L.Q.; investigation, C.H. and L.Q.; Data curation and analysis, G.W., G.H., Y.L., J.F. and F.T.; writing—review and editing, G.W., S.L., C.H., G.H., Y.L., J.F., P.Y. and L.Q.; project administration, G.W.; funding acquisition, C.H. All authors have read and agreed to the published version of the manuscript.
Funding
This research was funded by the National Natural Science Foundation of China (32160292), JIANGXI DOUBLE THOUSAND PLANS (jxsq2020101080), and the Natural Science Foundation of Jiangxi province (20224BAB205008).
Data Availability Statement
Data will be made available on request.
Acknowledgments
The authors thank the workgroup from the Jiangxi Nanfengmian National Nature Reserve Administration for field investigations.
Conflicts of Interest
The authors declare no conflict of interest.
References
- Hansen, M.C.; Potapov, P.V.; Moore, R.; Hancher, M.; Turubanova, S.A.; Tyukavina, A.; Thau, D.; Stehman, S.V.; Goetz, S.J.; Loveland, T.R.; et al. High-Resolution Global Maps of 21st-Century Forest Cover Change. Science 2013, 342, 850–853. [Google Scholar] [CrossRef] [PubMed]
- Schimel, D.S. Terrestrial ecosystems and the carbon cycle. Glob. Chang. Biol. 1995, 1, 77–91. [Google Scholar] [CrossRef]
- Houghton, R.A.; House, J.I.; Pongratz, J.; vander Werf, G.R.; DeFries, R.S.; Hansen, M.C.; Le Quéré, C.; Ramankutty, N. Carbon emissions from land use and land-cover change. Biogeosciences 2012, 9, 5125–5142. [Google Scholar] [CrossRef]
- Heimann, M.; Reichstein, M. Terrestrial ecosystem carbon dynamics and climate feedbacks. Nature 2008, 451, 289–292. [Google Scholar] [CrossRef]
- Le Toan, T.; Quegan, S.; Davidson, M.W.J.; Balzter, H.; Paillou, P.; Papathanassiou, K.; Plummer, S.; Rocca, F.; Saatchi, S.; Shugart, H.; et al. The biomass mission: Mapping global forest biomass to better understand the terrestrial carbon cycle. Remote Sens. Environ. 2011, 115, 2850–2860. [Google Scholar] [CrossRef]
- Chen, Q.; McRoberts, R.E.; Wang, C.W.; Radtke, P.J. Forest aboveground biomass mapping and estimation across multiple spatial scales using model-based inference. Remote Sens. Environ. 2016, 184, 350–360. [Google Scholar] [CrossRef]
- Zhang, J.L.; Lu, C.; Xu, H.; Wang, G.X. Estimating aboveground biomass of Pinus densata-dominated forests using Landsat time series and permanent sample plot data. J. For. Res. 2018, 30, 1689–1706. [Google Scholar] [CrossRef]
- Segura, M.; Kanninen, M. Allometric models for tree volume and total aboveground biomass in a tropical humid forest in Costa Rica. Biotropica 2005, 37, 2–8. [Google Scholar] [CrossRef]
- Seidel, D.; Fleck, S.; Leuschner, C.; Hammett, T. Review of ground-based methods to measure the distribution of biomass in forest canopies. Ann. For. Sci. 2011, 68, 225–244. [Google Scholar] [CrossRef]
- Gleason, C.J.; Im, J. A review of remote sensing of forest biomass and biofuel: Options for small-area applications. GIScience Remote Sens. 2011, 48, 141–170. [Google Scholar] [CrossRef]
- Lu, D.; Chen, Q.; Wang, G.; Liu, L.; Li, G.; Moran, E. A survey of remote sensing-based aboveground biomass estimation methods in forest ecosystems. Int. J. Digit. Earth 2016, 9, 63–105. [Google Scholar] [CrossRef]
- Banerjee, B.P.; Spangenberg, G.; Kant, S. Fusion of spectral and structural information from aerial images for improved biomass estimation. Remote Sens. 2020, 12, 3164. [Google Scholar] [CrossRef]
- Clark, M.L.; Roberts, D.A.; Ewel, J.J.; Clark, D.B. Estimation of tropical rain forest aboveground biomass with small-footprint lidar and hyperspectral sensors. Remote Sens. Environ. 2011, 115, 2931–2942. [Google Scholar] [CrossRef]
- Latifi, H.; Fassnacht, F.E.; Hartig, F.; Berger, C.; Hernández, J.; Corvalán, P.; Koch, B. Stratified aboveground forest biomass estimation by remote sensing data. Int. J. Appl. Earth Obs. Geoinf. 2015, 38, 229–241. [Google Scholar] [CrossRef]
- Güneralp, İ.; Filippi, A.M.; Randall, J. Estimation of floodplain aboveground biomass using multispectral remote sensing and nonparametric modeling. Int. J. Appl. Earth Obs. Geoinf. 2014, 33, 119–126. [Google Scholar] [CrossRef]
- Arévalo, P.; Baccini, A.; Woodcock, C.E.; Olofsson, P.; Walker, W.S. Continuous mapping of aboveground biomass using Landsat time series. Remote Sens. Environ. 2023, 288, 113483. [Google Scholar] [CrossRef]
- Blackard, J.A.; Finco, M.V.; Helmer, E.H.; Holden, G.R.; Hoppus, M.L.; Jacobs, D.M.; Lister, A.J.; Moisen, G.G.; Nelson, M.D.; Riemann, R.; et al. Mapping US forest biomass using nationwide forest inventory data and moderate resolution information. Remote Sens. Environ. 2008, 112, 1658–1677. [Google Scholar] [CrossRef]
- García, M.; Riaño, D.; Chuvieco, E.; Danson, F.M. Estimating biomass carbon stocks for a Mediterranean forest in central Spain using LiDAR height and intensity data. Remote Sens. Environ. 2010, 114, 816–830. [Google Scholar] [CrossRef]
- Yu, Y.; Saatchi, S.; Heath, L.S.; LaPoint, E.; Myneni, R.; Knyazikhin, Y. Regional distribution of forest height and biomass from multisensor data fusion. J. Geophys. Res. Biogeosci. 2010, 115, G00E12. [Google Scholar] [CrossRef]
- Wang, G.; Oyana, T.; Zhang, M.; Adu-Prah, S.; Zeng, S.; Lin, H.; Se, J. Mapping and spatial uncertainty analysis of forest vegetation carbon by combining national forest inventory data and satellite images. For. Ecol. Manag. 2009, 258, 1275–1283. [Google Scholar] [CrossRef]
- Peng, C.; Liu, J.; Dang, Q.; Apps, M.J.; Jiang, H. TRIPLEX: A generic hybrid model for predicting forest growth and carbon and nitrogen dynamics. Ecol. Model. 2002, 153, 109–130. [Google Scholar] [CrossRef]
- Luizão, R.C.; Luizão, F.J.; Paiva, R.Q.; Monteiro, T.F.; Sousa, L.S.; Kruijt, B. Variation of carbon and nitrogen cycling processes along a topographic gradient in a central Amazonian forest. Glob. Chang. Biol. 2004, 10, 592–600. [Google Scholar] [CrossRef]
- Larsen, D.R.; Speckman, P.L. Multivariate regression trees for analysis of abundance data. Biometrics 2004, 60, 543–549. [Google Scholar] [CrossRef] [PubMed]
- Aiba, M.; Nakashizuka, T. Architectural Differences Associated with Adult Stature and Wood Density in 30 Temperate Tree Species. Funct. Ecol. 2009, 23, 265–273. [Google Scholar] [CrossRef]
- Zhang, H.; Wang, K.; Zeng, Z.; Du, H.; Zou, Z.; Xu, Y.; Zeng, F. Large-scale patterns in forest growth rates are mainly driven by climatic variables and stand characteristics. For. Ecol. Manag. 2019, 435, 120–127. [Google Scholar] [CrossRef]
- McEwan, R.W.; Lin, Y.C.; Sun, L.F.; Hsieh, C.F.; Su, S.H.; Chang, L.W.; MichaelSong, G.Z.; Wang, H.H.; Hwong, J.L.; Lin, K.C.; et al. Topographic and biotic regulation of aboveground carbon storage in subtropical broad-leaved forests of Taiwan. For. Ecol. Manag. 2011, 262, 1817–1825. [Google Scholar] [CrossRef]
- Baccini, A.; Friedl, M.A.; Woodcock, C.E.; Warbington, R. Forest biomass estimation over regional scales using multisource data. Geophys. Res. Lett. 2004, 31. [Google Scholar] [CrossRef]
- Xu, Y.; Franklin, S.B.; Wang, Q.; Shi, Z.; Luo, Y.; Lu, Z.; Zhang, J.; Qiao, X.; Jiang, M. Topographic andbiotic factors determine forest biomassspatial distribution in a subtropicalmountain moist forest. For. Ecol. Manag. 2015, 357, 95–103. [Google Scholar] [CrossRef]
- de Castilho, C.V.; Magnusson, W.E.; de Araújo, R.N.O.; Luizao, R.C.; Luizao, F.J.; Lima, A.P.; Higuchi, N. Variation in aboveground tree live biomass in a central Amazonian Forest: Effects of soil and topography. For. Ecol. Manag. 2006, 234, 85–96. [Google Scholar] [CrossRef]
- Clark, D.B.; Clark, D.A. Landscape-scale variation in forest structure and biomass in a tropical rain forest. For. Ecol. Manag. 2000, 137, 185–198. [Google Scholar] [CrossRef]
- Sun, L.N.; Wang, M.B.; Fan, X.H. Spatial pattern and driving factors of biomass carbon density for natural and planted coniferous forests in mountainous terrain, eastern Loess Plateau of China. For. Ecosyst. 2020, 7, 9. [Google Scholar] [CrossRef]
- Mickler, R.A.; Earnhardt, T.S.; Moore, J.A. Regional estimation of current and future forest biomass. Environ. Pollut. 2002, 116, S7–S16. [Google Scholar] [CrossRef]
- Yang, Q.; Su, Y.; Hu, T.; Jin, S.; Liu, X.; Niu, C.; Liu, Z.; Kelly, M.; Wei, J.; Guo, Q. Allometry-based estimation of forest aboveground biomass combining LiDAR canopy height attributes and optical spectral indexes. For. Ecosyst. 2022, 9, 2197–5620. [Google Scholar] [CrossRef]
- Brede, B.; Terryn, L.; Barbier, N.; Bartholomeus, H.M.; Bartolo, R.; Calders, K.; Derroire, G.; Krishna, M.; Sruthi, M.; Lau, A.; et al. Non-destructive estimation of individual tree biomass: Allometric models, terrestrial and UAV laser scanning. Remote Sens. Environ. 2022, 280, 34–4257. [Google Scholar] [CrossRef]
- Zhang, Z.; Cao, L.; She, G. Estimating forest structural parameters using canopy metrics derived from airborne LiDAR data in subtropical forests. Remote Sens. 2017, 9, 940. [Google Scholar] [CrossRef]
- Morsdorf, F.; Eck, C.; Zgraggen, C.; Imbach, B.; Schneider, F.D.; Kükenbrink, D. UAV-based LiDAR acquisition for the derivation of high-resolution forest and ground information. Lead. Edge 2017, 36, 566–570. [Google Scholar] [CrossRef]
- Beland, M.; Parker, G.; Sparrow, B.; Harding, D.; Chasmer, L.; Phinn, S.; Antonarakis, A.; Strahler, A. On promoting the use of lidar systems in forest ecosystem research. For. Ecol. Manag. 2019, 450, 117484. [Google Scholar] [CrossRef]
- Terryn, L.; Calders, K.; Bartholomeus, H.; Bartolo, R.E.; Brede, B.; D’hont, B.; Disney, M.; Herold, M.; Lau, M.; Shenkin, A.; et al. Quantifying tropical forest structure through terrestrial and UAV laser scanning fusion in Australian rainforests. Remote Sens. Environ. 2022, 271, 112912. [Google Scholar] [CrossRef]
- Kong, F.Q.; Fang, Y.X.; Luo, C.F.; Mei, Y. Analysis of Diversity and Fauna of Butterfly in Jiangxi Nanfengmian Nature Reserve. For. Sci. Technol. 2022, 47, 39–42+47. [Google Scholar] [CrossRef]
- Lou, M.H.; Yang, T.H.; Chen, W.W.; Xu, J. Model between Height and DBH for Natural Castanopsis eyrei Broad-leaved MixedForest in Ningbo City. Prot. For. Sci. Technol. 2021, 5, 1–5. [Google Scholar] [CrossRef]
- Lin, K.M. Research and analysis on biomass allometric equations of subtropical broad-leaved forest. J. Cent. South Univ. For. Technol. 2017, 37, 115–120+126. [Google Scholar] [CrossRef]
- Yuan, S.; Tang, T.; Wang, M.; Chen, H.; Zhang, A.; Yu, J. Regional Scale Determinants of Nutrient Content of Soil in a Cold-Temperate Forest. Forests 2018, 9, 177. [Google Scholar] [CrossRef]
- Sun, J.; Cheng, G.W.; Li, W.P. Meta-analysis of relationships between environmental factors and aboveground biomass in the alpine grassland on the Tibetan Plateau. Biogeosciences 2013, 10, 1707–1715. [Google Scholar] [CrossRef]
- Laurance, W.F.; Fearnside, P.M.; Laurance, S.G.; Delamonica, P.; Lovejoy, T.E.; Rankin-de Merona, J.M.; Chambers, J.Q.; Gascon, C. Relationship between soils and Amazon forest biomass: A landscape-scale study. For. Ecol. Manag. 1999, 118, 127–138. [Google Scholar] [CrossRef]
- Yang, Y.; Watanabe, M.; Li, F.D.; Zhang, J.Q.; Zhang, W.J.; Zhai, J.W. Factors affecting forest growth and possible effects of climate change in the Taihang Mountains, northern China. Forestry 2005, 79, 135–147. [Google Scholar] [CrossRef]
- Slik, J.F.; Paoli, G.; McGuire, K.; Amaral, I.; Barroso, J.; Bastian, M.; Blanc, L.; Bongers, F.; Boundja, P.; Clark, C.; et al. Large trees drive forest aboveground biomass variation in moist lowland forests across the tropics. Glob. Ecol. Biogeogr. 2013, 22, 1261–1271. [Google Scholar] [CrossRef]
- Stephenson, N.L.; Das, A.J.; Condit, R.; Russo, S.E.; Baker, P.J.; Beckman, N.G.; Coomes, D.A.; Lines, E.R.; Morris, W.K.; Rüger, N.; et al. Rate of tree carbon accumulation increases continuously with tree size. Nature 2014, 507, 90–93. [Google Scholar] [CrossRef]
- Legendre, P.; Mi, X.; Ren, H.; Ma, K.; Yu, M.; Sun, I.F.; He, F. Partitioning beta diversity in a subtropical broad-leaved forest of China. Ecology 2009, 90, 663–674. [Google Scholar] [CrossRef]
- Harms, K.E.; Condit, R.; Hubbell, S.P.; Foster, R.B. Habitat associations of trees and shrubs in a 50-ha neotropical forest plot. J. Ecol. 2001, 89, 947–959. [Google Scholar] [CrossRef]
- Behera, S.K.; Sahu, N.; Mishra, A.K.; Bargali, S.S.; Behera, M.D.; Tuli, R. Aboveground biomass andcarbon stock assessment in lndiantropical deciduous forest and relationship with stand structural attributes. Ecol. Eng. 2017, 99, 513–524. [Google Scholar] [CrossRef]
- Condit, R.; Ashton, P.S.; Baker, P.; Bunyavejchewin, S.; Gunatilleke, S.; Gunatilleke, N.; Hubbell, S.P.; Foster, R.B.; Itoh, A.; Lafrankie, J.V.; et al. Spatial patterns in the distribution of tropical tree species. Science 2000, 288, 1414–1418. [Google Scholar] [CrossRef]
- Kumar, A.; Kishore, B.S.P.C.; Saikia, P.; Deka, J.; Bharali, S.; Singha, L.B.; Tripathi, O.P.; Khan, M.L. Tree Diversity Assessment and Above Ground Forests Biomass Estimation using SAR Remote Sensing: A case study of Higher Altitude Vegetation of North-East Himalayas, India. Phys. Chem. Earth Parts A/B/C 2019, 111, 53–64. [Google Scholar] [CrossRef]
- Gregory, P.A.R.; Flint, H.; Timothy, A.V.; David, E.K.; TyKennedy, B. Environmentaland Biotic Controls over AbovegroundBiomass Throughout a Tropical RainForest. Ecosystems 2009, 12, 261–278. [Google Scholar] [CrossRef]
- Wang, G.; Guan, D.; Xiao, L.; Peart, M.R. Forest biomass-carbon variation affected by the climatic and topographic factors in Pearl River Delta, South China. J. Environ. Manag. 2019, 232, 781–788. [Google Scholar] [CrossRef]
- Saatchi, S.S.; Houghton, R.A.; Dos Santos Alvala, R.C.; Soares, J.V.; Yu, Y. Distribution of aboveground live biomass in the Amazon basin. Glob. Chang. Biol. 2007, 13, 816–837. [Google Scholar] [CrossRef]
- Girardin, C.A.J.; Malhi, Y.; Aragao, L.E.O.C.; Mamani, M.; Huaraca Huasco, W.; Durand, L.; Feeley, K.J.; Rapp, J.; Silva-espejo, J.E.; Silman, M.; et al. Net primary productivity allocation and cycling of carbon along a tropical forest elevational transect in the Peruvian Andes. Glob. Chang. Biol. 2010, 16, 3176–3192. [Google Scholar] [CrossRef]
- Hansen, A.J.; Rotella, J.J.; Kraska, M.P.; Brown, D. Spatial patterns of primary productivity in the Greater Yellowstone Ecosystem. Landsc. Ecol. 2000, 15, 505–522. [Google Scholar] [CrossRef]
- Ming, Q.Z.; Guo, S.R.; Jiao, Y.M. High Gradient Effects of Forest Biomass Energy in Mountainous Region-A Case of Meili Snow Mountain. Procedia Earth Planet. Sci. 2011, 2, 315–320. [Google Scholar] [CrossRef][Green Version]
- Zhang, L.; Du, H.; Yang, Z.; Song, T.; Zeng, F.; Peng, W.; Huang, G. Topography and Soil Properties Determine Biomass and Productivity Indirectly via Community Structural and Species Diversity in Karst Forest, Southwest China. Sustainability 2022, 14, 7644. [Google Scholar] [CrossRef]
- Lin, D.; Lai, J.; Muller-Landau, H.C.; Mi, X.; Ma, K. Topographic variation in aboveground biomass in a subtropical evergreen broad-leaved forest in China. PLoS ONE 2012, 7, e48244. [Google Scholar] [CrossRef]
- Chave, J.; Andalo, C.; Brown, S.; Cairns, M.A.; Chambers, J.Q.; Eamus, D.; Fölster, H.; Fromard, F.; Higuchi, N.; Puig, H.; et al. Tree allometry and improved estimation of carbon stocks and balance in tropical forests. Oecologia 2005, 145, 87–99. [Google Scholar] [CrossRef] [PubMed]
Disclaimer/Publisher’s Note: The statements, opinions and data contained in all publications are solely those of the individual author(s) and contributor(s) and not of MDPI and/or the editor(s). MDPI and/or the editor(s) disclaim responsibility for any injury to people or property resulting from any ideas, methods, instructions or products referred to in the content. |
© 2023 by the authors. Licensee MDPI, Basel, Switzerland. This article is an open access article distributed under the terms and conditions of the Creative Commons Attribution (CC BY) license (https://creativecommons.org/licenses/by/4.0/).