Article

Coupling Relationship between Soil Organic Carbon Storage and Soil Water Storage in Abandoned Economic Forests in the Loess Hilly Areas

1
College of Life Science, Yan’an University, Yan’an 716000, China
2
China Institute of Water Resources and Hydropower Research, Beijing 100038, China
*
Authors to whom correspondence should be addressed.
Forests 2023, 14(2), 221; https://doi.org/10.3390/f14020221
Submission received: 26 December 2022 / Revised: 19 January 2023 / Accepted: 20 January 2023 / Published: 24 January 2023

Abstract

:
The spatial distribution characteristics of soil organic carbon storage (SOCS) and soil water storage (SWS) and the factors that influence these parameters were compared and analyzed for different economic forests under varying land use practices in the study area with the same abandonment years. The widely distributed abandoned mountain jujube and apple forests at the Qijiashan jujube experimental demonstration base in Yanchuan County were the research field, and grassland was the control. The results show that (1) SOCS and SWS accumulated abundantly in the deep layer (below 100 cm) compared to the highest layer, accounting for 60.63% and 64.63%. (2) After abandonment, the SOCS and SWS were different across vegetation types and under different land preparation methods. In the study area, the SWS showed a comparative advantage compared to the SOCS. The trade-off for different vegetation types suggests that it was the highest for grassland (0.39), while the lowest for jujube (0.16). Under different land preparation methods, the RMSE values of the level terrace grassland and undisturbed slope with apple trees were the highest, while those of jujube trees were the lowest. (3) Environmental factors exerted a certain influence on different vegetation types and varying land preparation methods after abandonment. Apart from the interaction between SOCS and SWS, chemical indicators showed the greatest impact on the abandoned grassland and the SOCS of level terraces.

1. Introduction

The soil carbon pool, as the most important carbon source in terrestrial ecosystems, is twice as big as the atmospheric carbon pool and thrice that of the terrestrial vegetation carbon. Small changes in soil organic carbon (SOC) greatly affect the atmospheric CO2 concentration, and thus, impact the global carbon cycle [1,2]. Soil moisture is an important component of the terrestrial ecosystem and serves as an important link between the surface material and energy exchange [3,4]. In arid and semi-arid loess hilly areas, the climate is dry, precipitation is scarce, and the groundwater is stored deep. Soil moisture is the direct water source that maintains this ecosystem [5,6]. Studies have shown that soil water conservation and carbon sequestration are important ecosystem services, crucial to vegetation restoration and growth [7]. Therefore, understanding the spatial distribution of SOCS and SWS plays an important role in ecosystem management [8]. Many scholars have studied SOCS and SWS. Lan et al. [9] suggested that the implementation of the Grain for Green project in the Loess Plateau of China may exert a significant impact on shallow soil carbon accumulation and soil moisture balance. Afforestation does not significantly increase deep soil carbon storage but reduces water depletion. Yang et al. [10] showed that different vegetation types exert significant effects on deep SOCS and SWS compared to the surface due to the root action. Environmental factors are also important factors influencing SOCS and SWS. Guo et al. [11] showed that fertilization affects soil properties and microbial communities. Microbes are the main participants in soil biochemical processes, and their abundance, activity, and composition affect the SOCS and SWS. Zhang et al. [12] suggested that soil texture and porosity are important factors affecting the coupling of SOCS and SWS, which gradually weakens with vegetation succession.
Trade-off analysis is the determination of when a change in one factor causes a change in another factor. It has implications in national environmental management, social ecology, land use planning, ecosystem services, and other fields [13,14,15,16]. Studies have shown that soil water use is a necessary condition for vegetation restoration and carbon sequestration, and efficient carbon assimilation and accumulation contribute to the improvement of water use efficiency [17,18]. There is a close trade-off and synergy between soil water conservation and carbon sequestration in arid and semi-arid regions. Several studies on the trade-off occurring in the Loess Plateau have been conducted. For instance, Su et al. [19] studied the trade-off between plant biomass and soil moisture in the Loess Plateau and found relatively high benefits of the soil moisture content compared to the biomass in most precipitation areas, which has an important impact on the rational selection and allocation of plant species. Wang et al. [20] studied the trade-off between soil moisture and biodiversity in the Loess Plateau and reported the potential for coordination between soil moisture and biodiversity in semi-arid grasslands, especially for shady slopes and shrubs. Chen et al. [21] showed that, compared to SOCS, SWS had relatively higher benefits for most plant communities and ensured the sustainable restoration of vegetation. Jujube and apple economic forests not only meet the needs of vegetation restoration, but also yield economic benefits. These have been widely planted in the study area. It is known that the economic forest area in northern Shaanxi is up to 974,000 hm2 [22]. However, due to urbanization, many rural people have migrated to the city in search of work, resulting in a large area of abandoned economic forest land, including mountain jujube and apple forests, which has had a certain impact on the relationship between the soil water and carbon content in the forest land. Most studies on the relationship between soil water and carbon have mostly been focused on shallow soil profiles, a single ecosystem service [23,24], or on the response of soil carbon and nitrogen to vegetation types and growth years [25,26]. However, studies on the trade-off between the soil water and carbon and their benefits in abandoned economic forests are relatively scarce. Therefore, using trade-off analysis, we studied the coupling relationship between SOCS and SWS in abandoned economic forests of northern Shaanxi. Our findings have an important guiding significance for the future transformation of abandoned economic forests. In this study, the abandoned economic forests (mountain jujube and mountain apple) were widely found in the loess area of northern Shaanxi and were the experimental field; grassland was taken as the control. By sampling and assessing the SOCS and SWS distribution in the 0–340 cm soil layer in the study area, the driving factors (physical and chemical indicators and their interactions) affecting the changes were determined. The purpose of the study was (1) to reveal the vertical changes in the SOCS and SWS across different abandoned vegetation types; (2) to assess the trade-off between the SOCS and SWS across different types of abandoned vegetation and under different land preparation methods, and (3) to compare the effects of different environmental factors on the SOCS and SWS across different abandoned vegetation types and under different land preparation methods. The results provide theoretical support and a scientific basis for the transformation and sustainable management of abandoned economic forests in the study area and other similar areas.

2. Materials and Methods
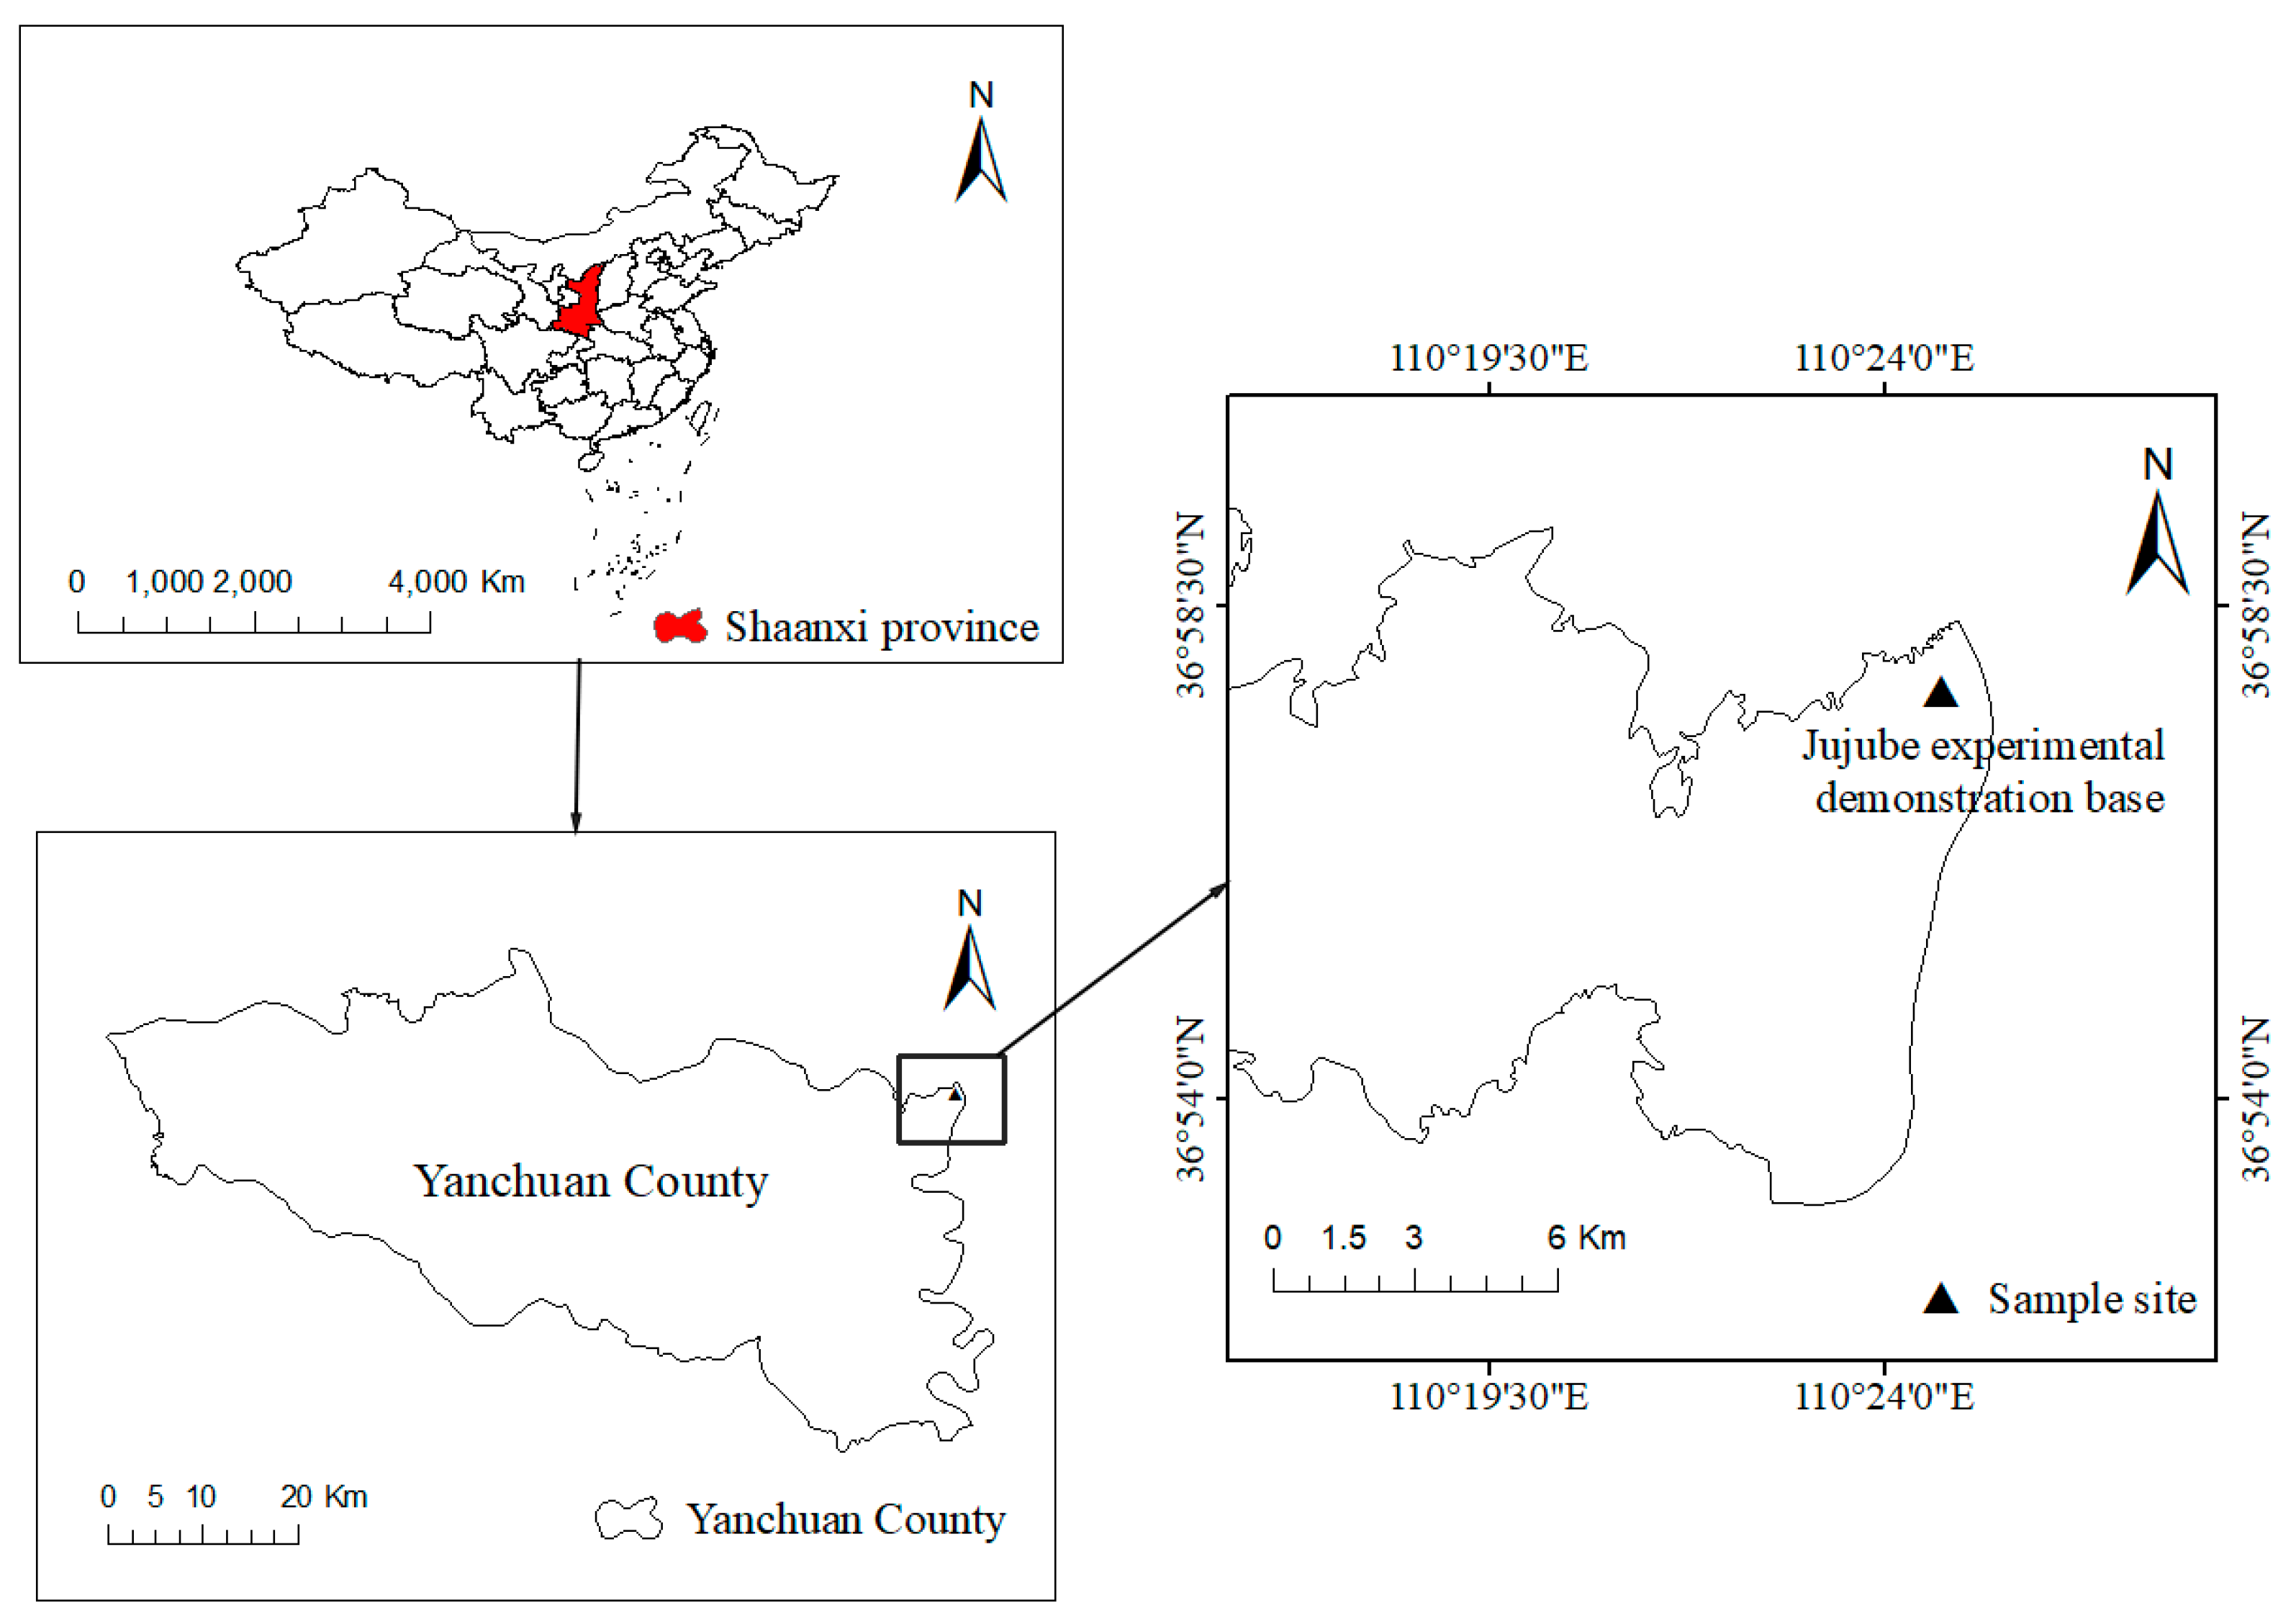
2.1. Study Area

The study area was at the Qijiashan jujube experimental demonstration base (36°57′ N, 110°29′ E) in Yanchuan County, Shaanxi Province, China (Figure 1). It is a loess hilly and gully region with an average altitude of 850 m. The annual average temperature was 10.8 °C, the average duration of sunlight was 2558 h, the mean frost-free period was 185 days, the annual average precipitation was 500 mm, and the rainfall was mainly concentrated between July and September, corresponding to the temperate continental monsoon climate. The vegetation in the study area mainly comprised Zizyphus jujube Mill, Malus pumila Mill, and Ziziphus jujuba Mill. var. spinosa. The herbs grown in the regions mainly comprised Artemisia sacrorum Ledeb. and Heteropappus hispidus (Thunb.) Less.

2.2. Plot Design and Soil Sampling

Through preliminary research and fieldwork, in 2019, the group selected mountain jujube forests and apple forests that were abandoned for the same number of years at the Qijia Mountain Jujube Experimental Demonstration Base in Yanchuan County; a grassland abandoned for the same number of years was used as the control. There were six standard sample plots in total, three undisturbed slope sample plots in an area of 20 m × 20 m, and three level terrace sample plots, which were set up by integrating the upper and lower two steps that had an area of about 10 m × 20 m. In each sample plot, three soil profiles (1 m deep) were excavated, and soil samples were collected by the ring knife method with a sampling interval of 20 cm. Simultaneously, the soil drill method was used. With a sampling interval of 20 cm as a layer, three soil drills were created in each sample plot. The soil samples between 0 and 340 cm in each sample plot were collected for determining the soil moisture, soil organic carbon, and other soil physical and chemical properties. Detailed information on the sample plots is provided in Table 1.

2.3. Determination of Soil Samples

The soil moisture content (SMC) was measured by the drying method, and the soil bulk density (BD), total capillary porosity (TCP), saturated water content (SWC), and capillary water holding capacity (CWHC) were measured by the ring knife immersion method [27]. The soil pH and electrical conductivity (EC) were assessed on the pHS-320 high precision intelligent acidity meter and DDS-608 multifunctional conductivity meter, respectively. The available nitrogen (AN) was determined using the alkaline hydrolysis diffusion–absorption method. The available potassium (AK) was determined by extraction with NH4OAc-flame photometry. The available phosphorus (AP) was determined by extraction with 0.5 mol⋅L−1 NaHCO3 and silica-molybdenum blue colorimetry. The soil organic matter was determined by the potassium dichromate volumetric–dilute heat method [28].

2.3.1. Soil Bulk Density

The soil bulk density for 100 cm was calculated. As it is difficult to measure the soil bulk density below 1 m, Equation (1), as shown below, was used [29].
P = 1.3370 × e 0.0084 c
where C represents the soil organic carbon (g kg−1) and P(BD) represents the soil bulk density (g/cm−3).

2.3.2. SOCS Was Calculated Using Equation (2) [30]

R = H × P × C × 10 1
where R is the soil organic carbon storage (t hm−2); H is the soil depth (cm); C is the soil organic carbon content (g kg −1).

2.3.3. Calculation of Soil Water Storage by Formula (3)

SWS = SMC × BD × H
where SWS is the soil water storage (mm); SMC is the soil moisture content (%); BD is the soil bulk density (g/cm−3); H is the soil depth (mm).

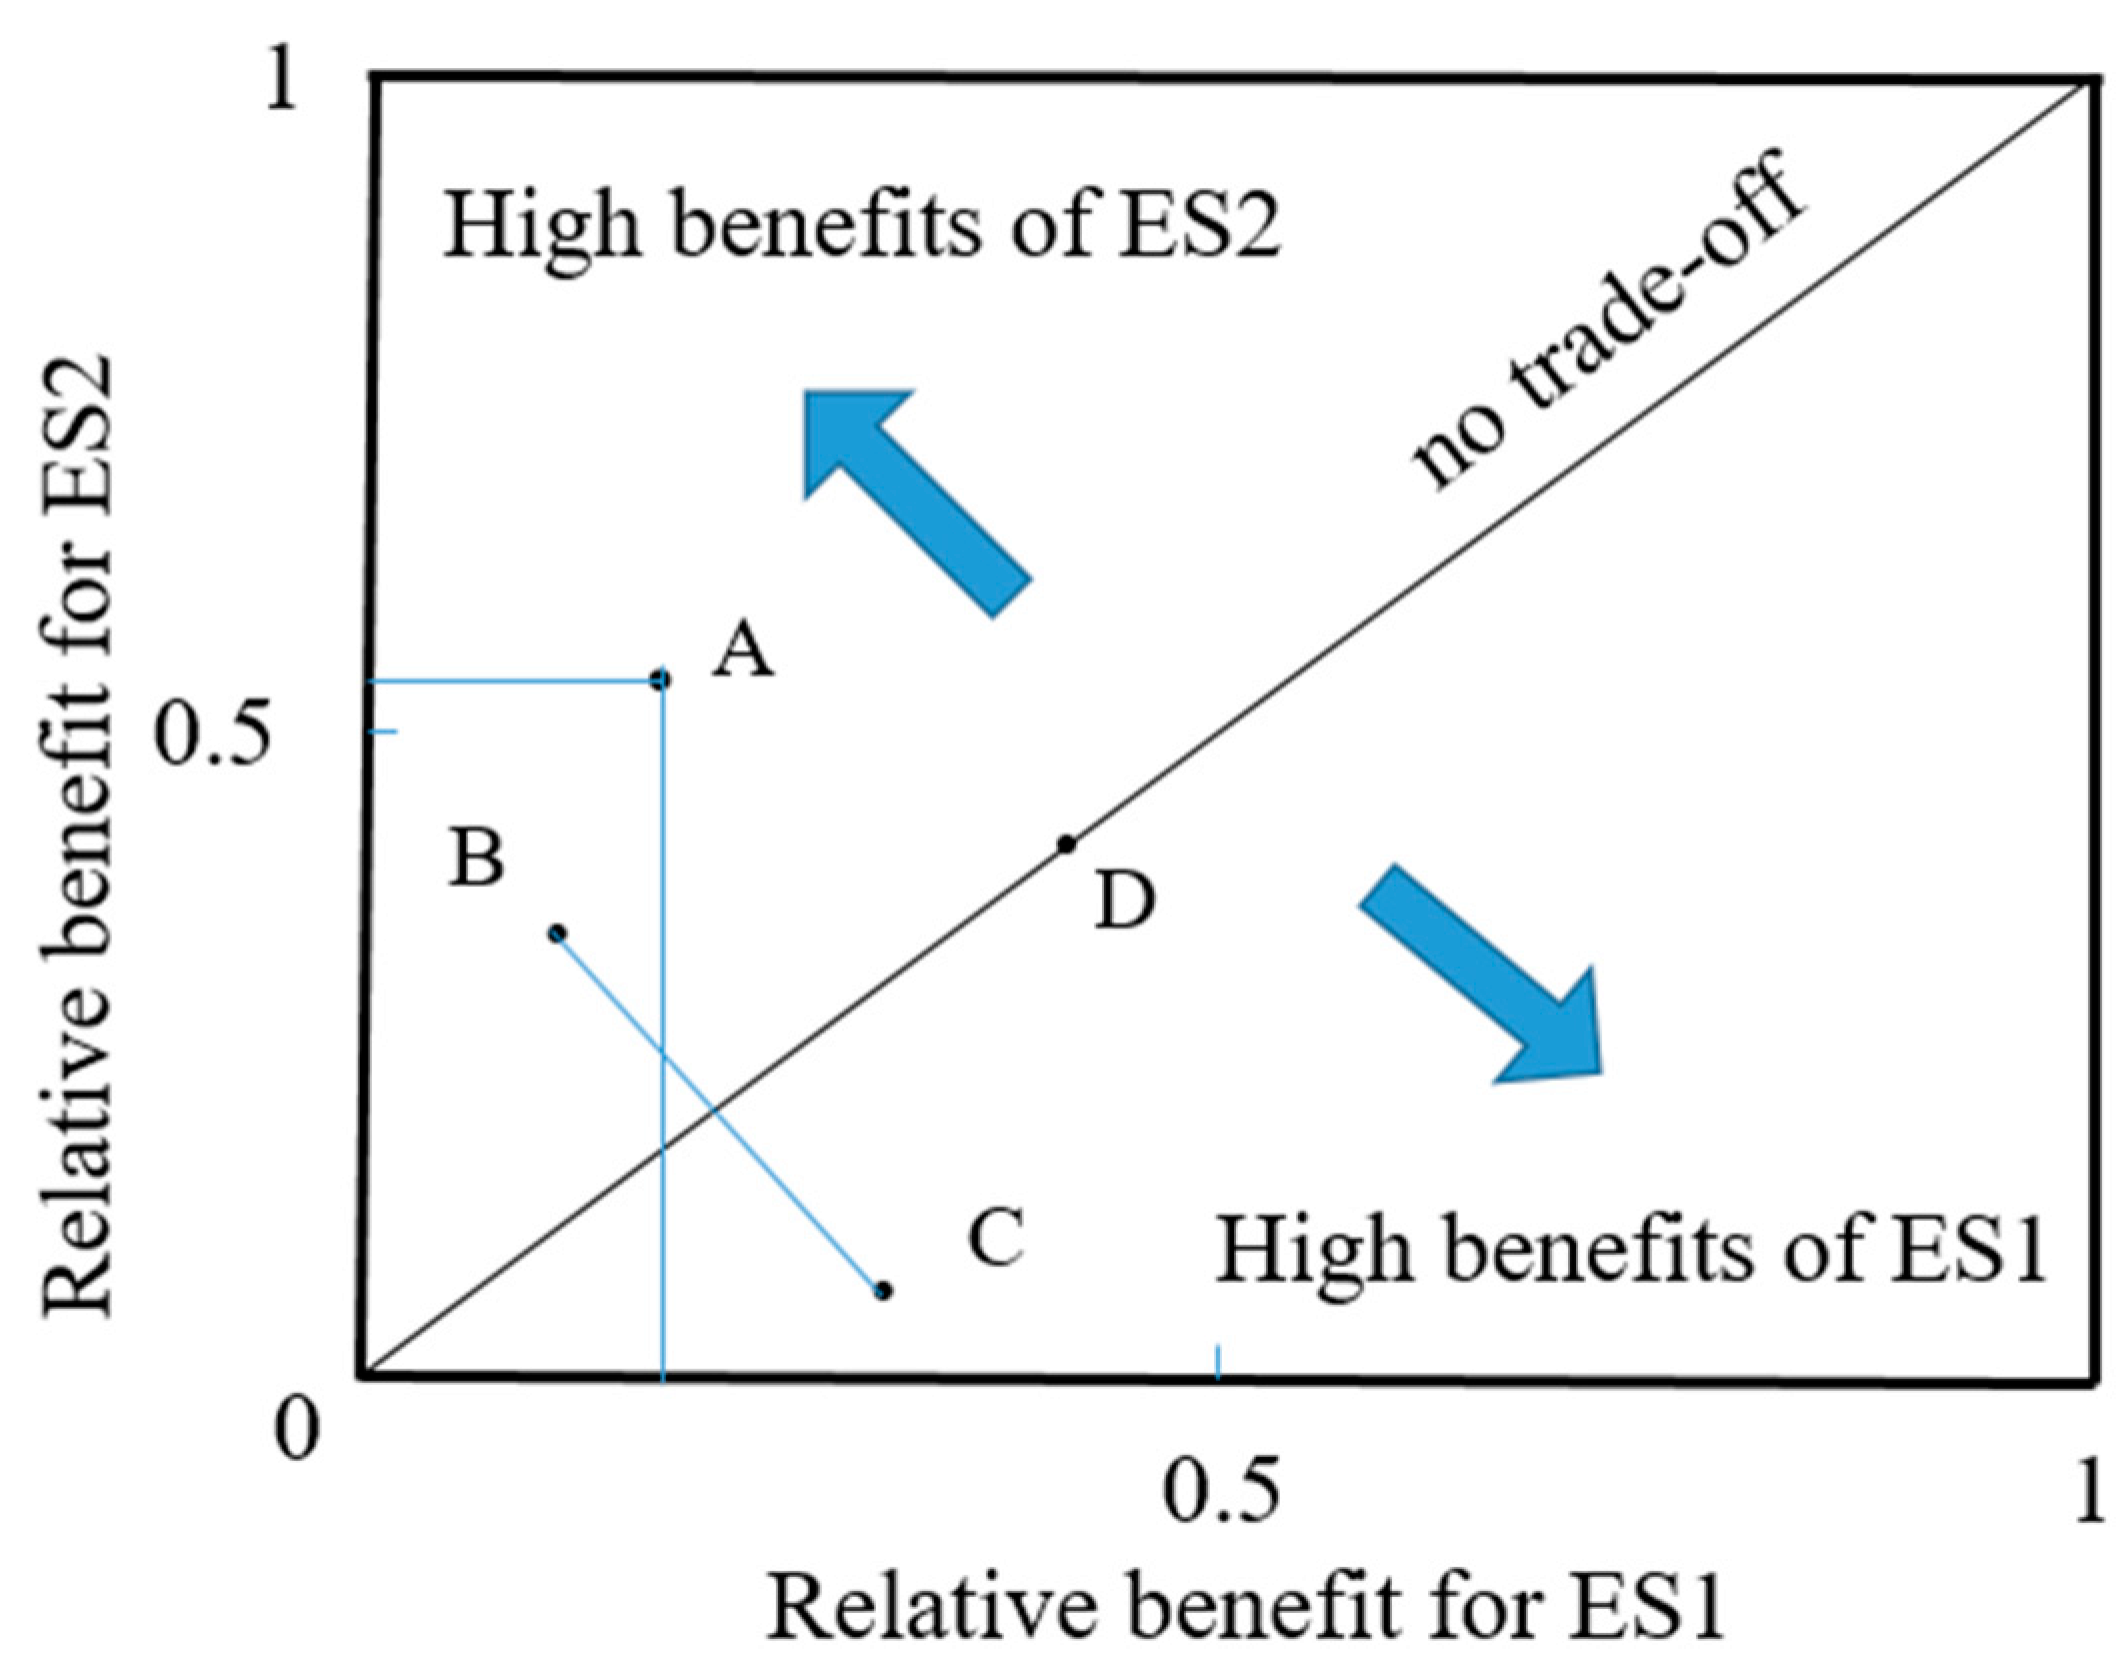
2.3.4. Trade-Off Analysis

A trade-off relationship is one in which a change in one service function causes a change in another service function and is intrinsically linked. It is necessary to measure the two factors in different places, construct a trade-off relationship diagram, and analyze which planting is more conducive to maximizing the SOCS and SWS simultaneously.
The RMSE represents the vertical distance of the midpoint of ES coordinates deviating from the 1:1 equilibrium line (Figure 2); the farther the distance, the greater the trade-off relationship, and vice versa, the stronger the synergistic relationship [19,21,31,32]. Before calculating the RMSE, the data are first standardized to eliminate the quantitative relationships among the variables. In the two-dimensional coordinate system, the x and y values of a point represent the relative benefits of ES1 and ES2, respectively. The more points above the trade-off balance line, the higher the ES2 benefit, and vice versa [19,32]. For the standardization of the ES relative benefits, ES was defined as:
ESstd = ( ESobs ESmin ) / ( ESmax ESmin )
where ESstd denotes the normalized value of ES, and ESobs, ESmax, and ESmin denote the ES representing the measured value and the maximum and minimum values, respectively. Therefore, the following equation was used for calculating the RMSE (5):
RMSE = 1 n 1 i = 1 n ( ES 1 ( i ) ES 2 ( i ) ) 2
where ES1(i) and ES2(i) represent the standard values of ES1 and ES2, respectively, and n is the number of observations.

2.3.5. Data Analysis

The data were processed and analyzed using Excel 2016 and SPSS 22.0, and graphs were plotted using Origin 2018 and ArcMap 10.2.

3. Results

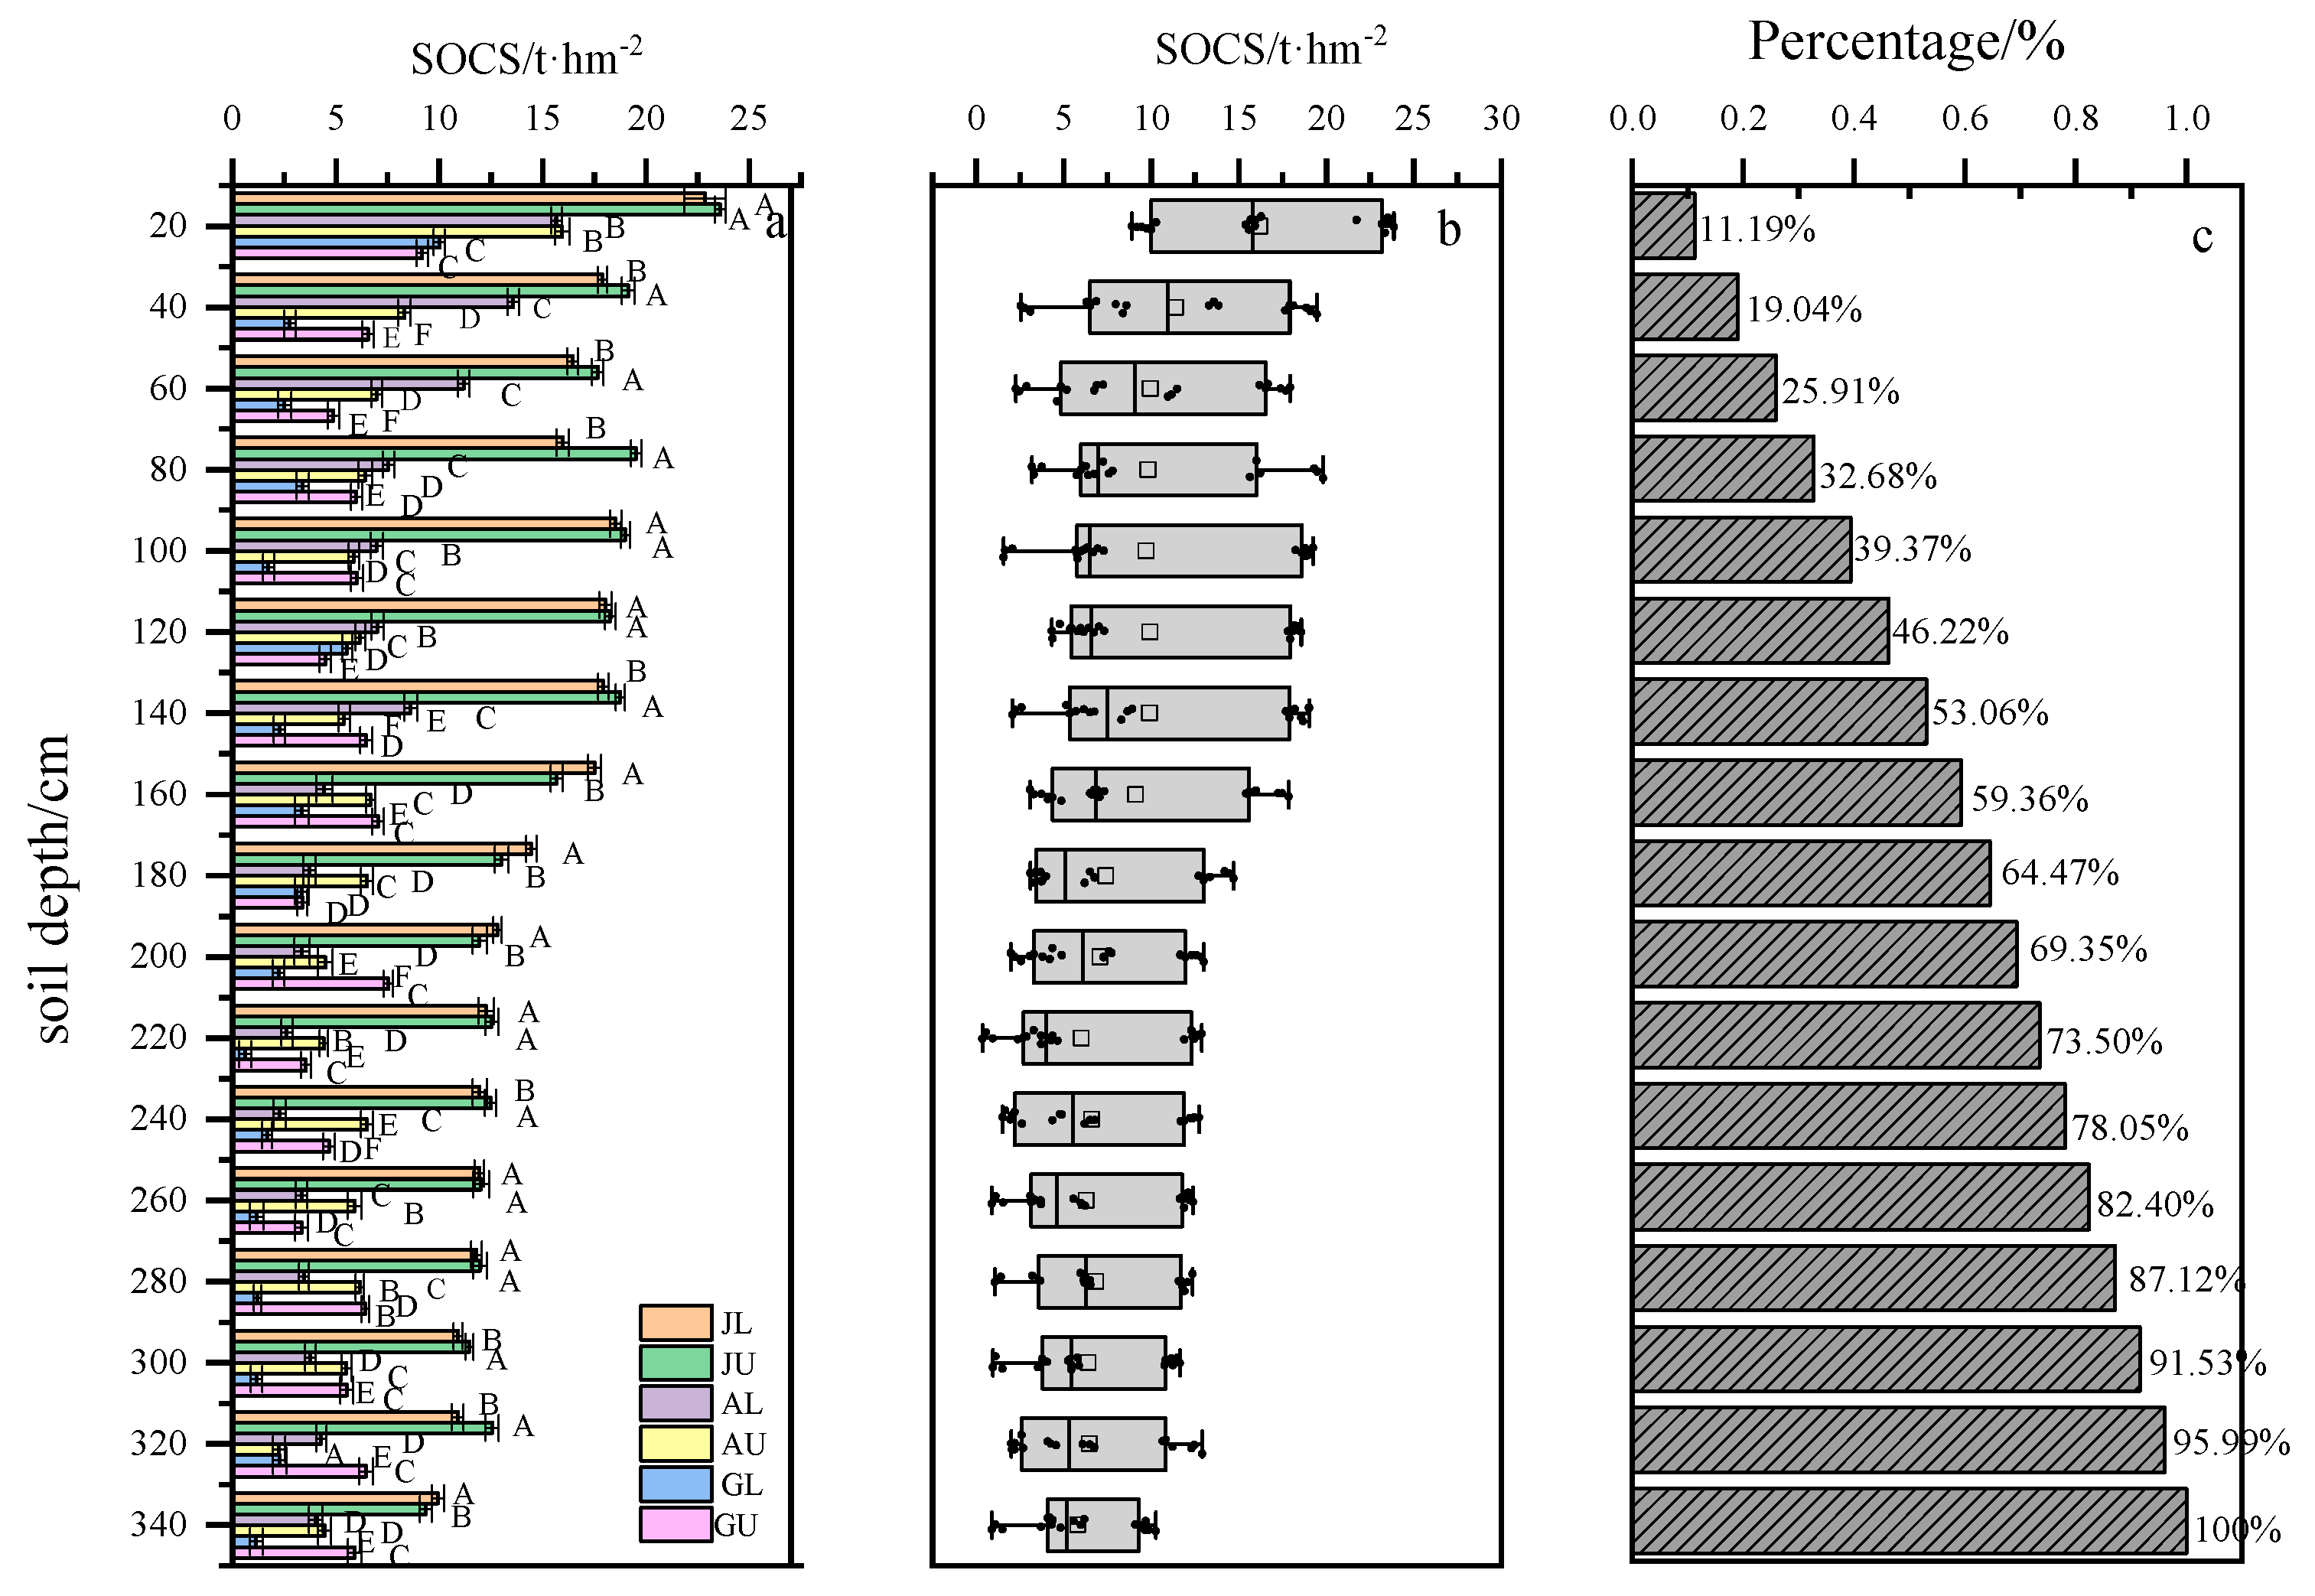
3.1. Spatial Distribution Characteristics of SOCS across Different Vegetation Types

After abandonment, the overall change in the SOCS in the study area ranged from 0.62 t hm−2 to 23.58 t hm−2, and the soil carbon storage was significantly different across the vegetation types (p < 0.05) (Figure 3a). The SOCS of the jujube economic forest was significantly higher than that of the apple economic forest and grassland. Upon comparing different land preparation methods, the effect of land preparation methods on the SOCS of forest land after abandonment was relatively small, and the difference between the level terrace and the undisturbed slope was statistically insignificant. However, the effect on abandoned grassland was larger, and in the undisturbed slope of grassland, it was significantly higher than that of the level terrace. Specifically, the trend was JU (259.05 t·hm−2) > JL (252.28 t·hm−2) > AU (108 t·hm−2) > AL (106.02 t·hm−2) > GU (97.47 t·hm−2) > GL (46.57 t·hm−2). After abandonment, the vertical distribution characteristics of the SOCS in the study area differed significantly, and the SOCS showed a downward trend with an increase in the soil depth (Figure 3b). In the 0–20 cm soil layer, the highest SOCS was 16.21 t hm−2, accounting for 11.19 % of the total storage (Figure 3c). In the 20–100 cm soil layer, SOCS showed a trend of first decrease and then increase, and SOCS accumulated to 40.84 t·hm−2, accounting for 28.12 % of the total storage. Under 100 cm soil layer, SOCS showed a decreasing trend with the increase of soil depth, and SOCS accumulated to 87.85 t·hm−2, accounting for 60.63% of the total storage.

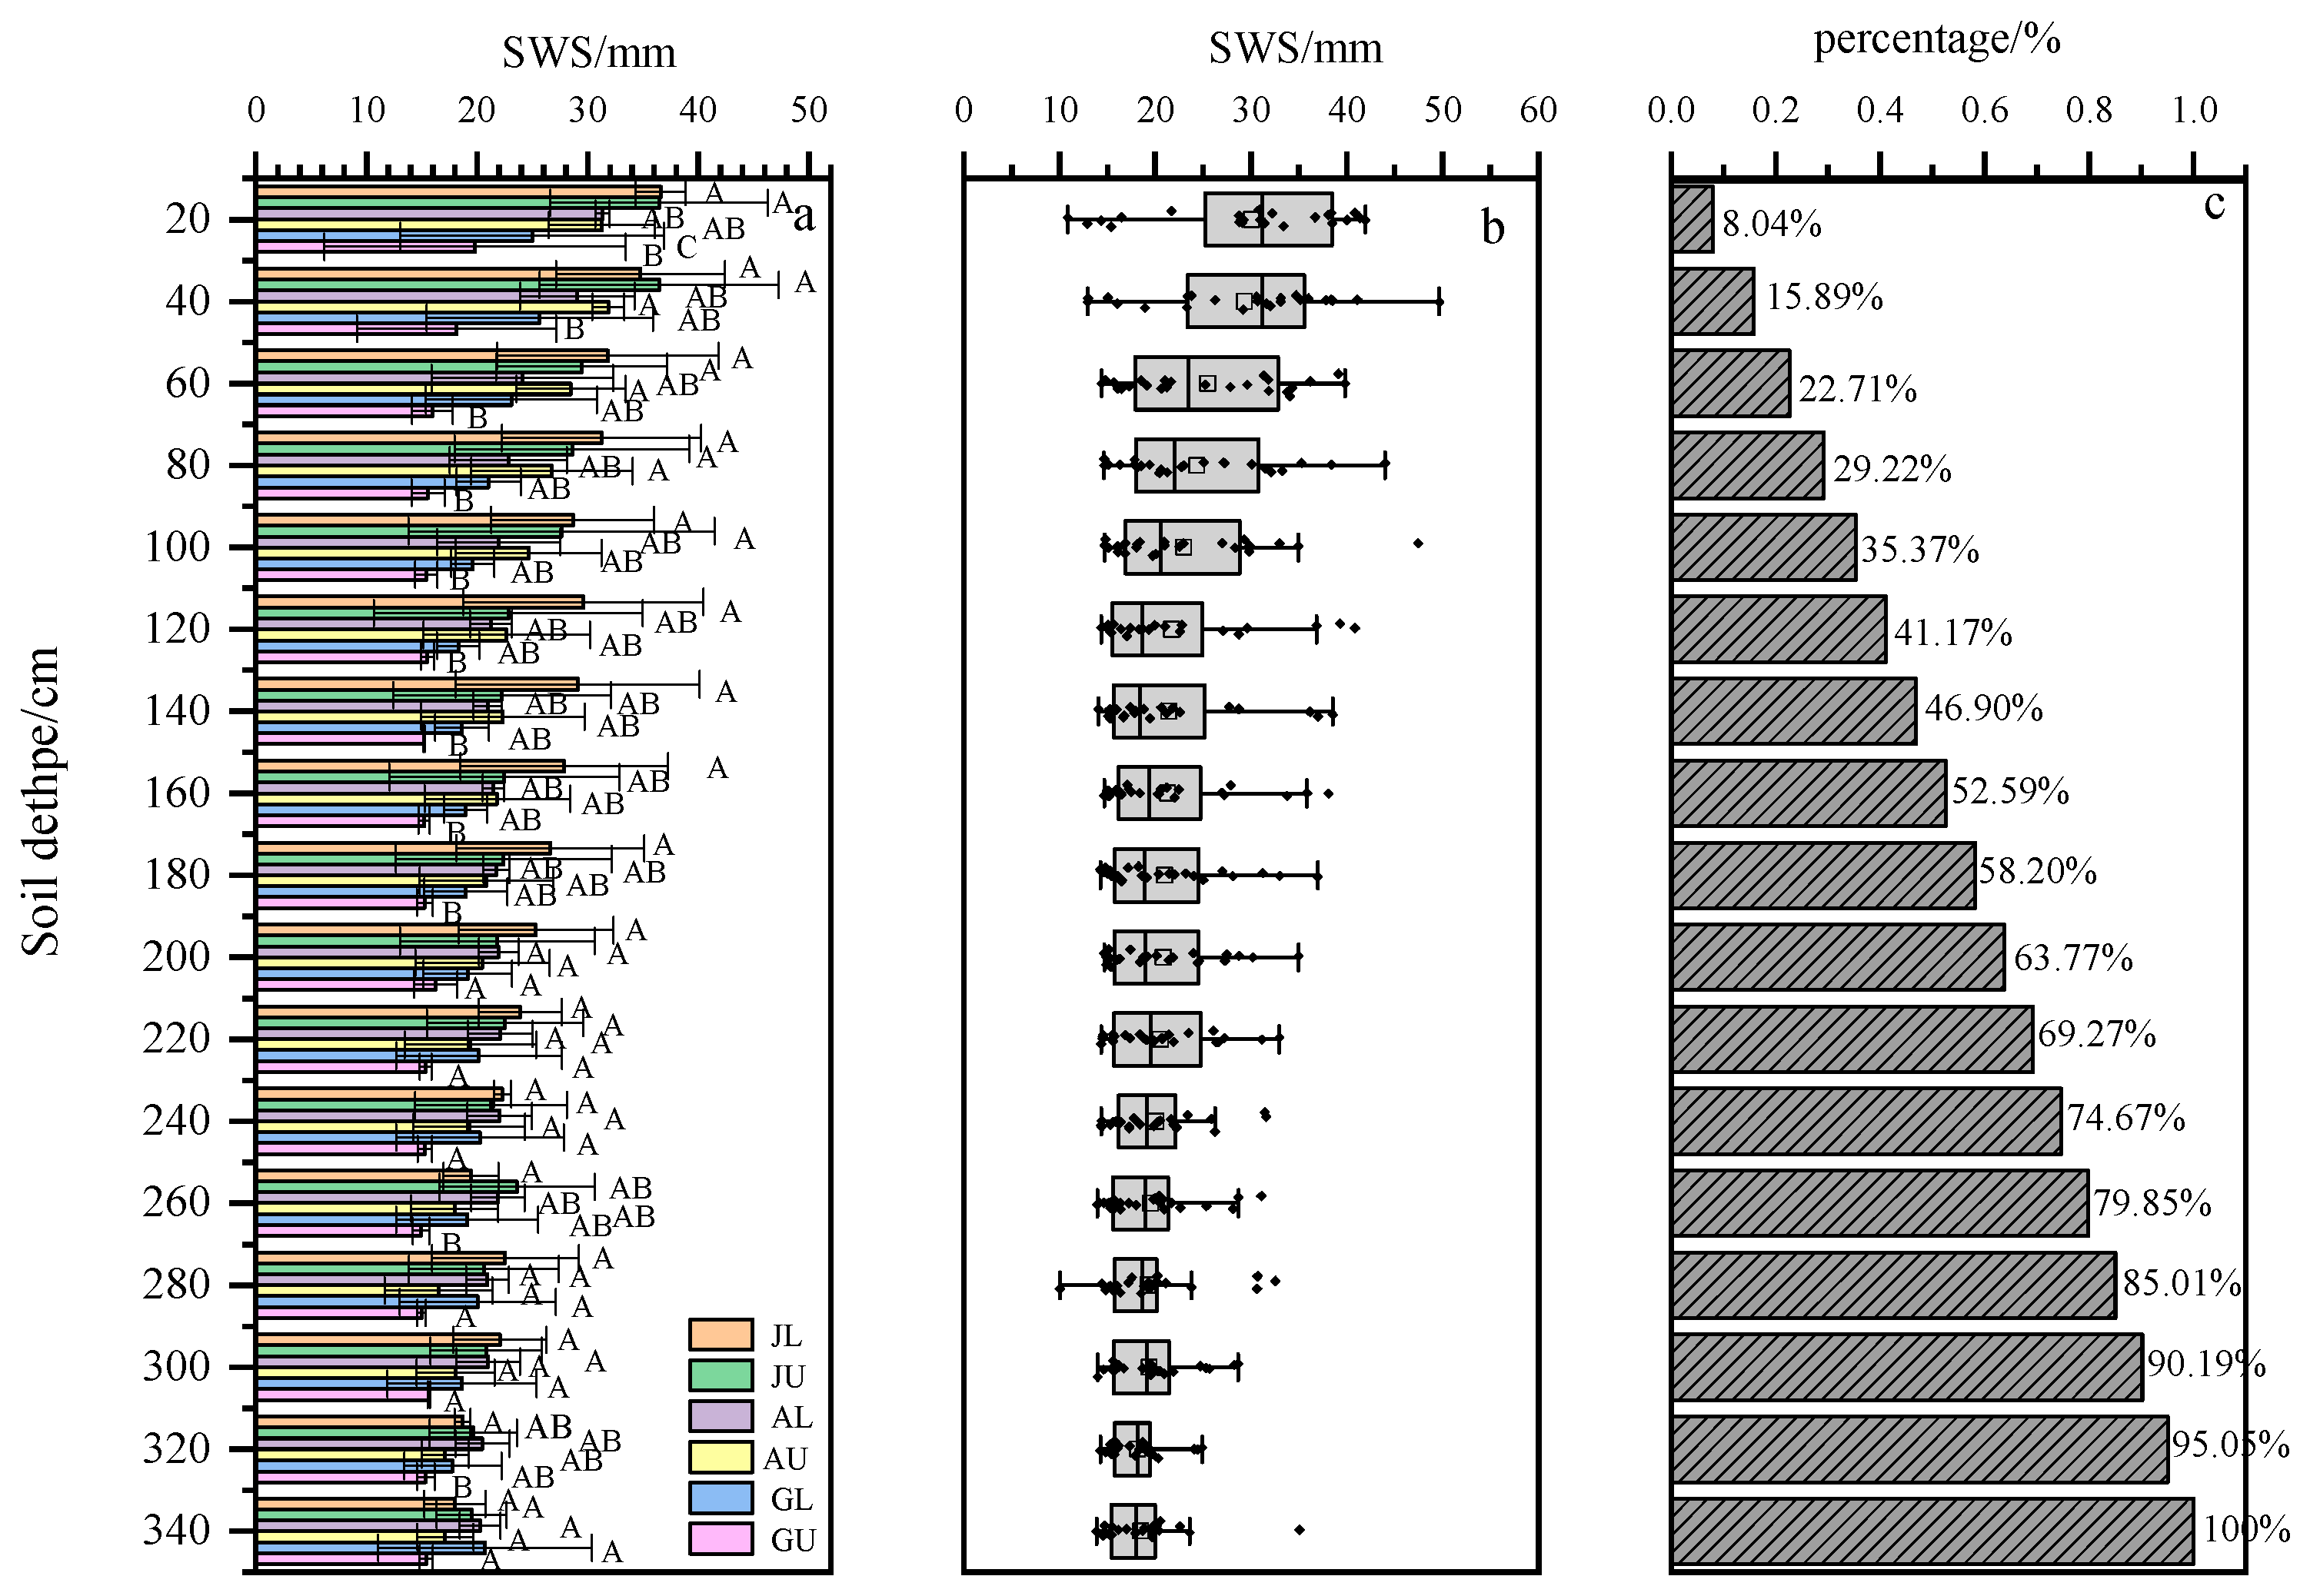
3.2. Spatial Distribution Characteristics of SWS across Different Vegetation Types

The overall range of SWS variation in the study area after abandonment was 10.02 mm~49.63 mm, and the SWS differed significantly (p < 0.05) between the abandoned economic forests and grassland (Figure 4a). The SWS in the abandoned economic forest was significantly higher than that in the grassland. Under the same vegetation, the SWS of a level terrace was higher than that of an undisturbed slope, and the trend was JL (448.71 mm)> JU (418.37 mm) > AL (385.40 mm) > AU (376.74 mm) > GL (345.21 mm) > GU (269.12 mm). After abandonment, the SWS showed an overall decrease with an increase in the soil depth (Figure 4b). The highest SWS content in the 0–20 cm soil layer was 30.08 mm, accounting for 8.04% of the total storage (Figure 4c). In the 20–100 cm soil layer, with an increase in the soil depth, the SWS had a decreased trend, accumulating up to 102.17 mm, which accounted for 27.33% of the total storage. When greater than 100 soil layers, the change in the SWS trend was stable, accumulating up to 241.68 mm, which accounted for 64.63% of the total storage.

3.3. The Relative Benefit and Trade-Off between SOCS and SWS

3.3.1. Relative Benefits Analysis of SOCS and SWS

After abandonment, the relative benefits of the SWS were generally greater than those of the SOCS in the study area, indicating that the SWS played a predominant role (Figure 5i). The relative benefits of the SOCS for JL and JU were higher than those of the SWS (Figure 5a,b), while opposite performance trends were observed for AL, AU, GL, and GU (Figure 5c–f). On comparing different land preparation methods, both the level terrace and undisturbed slope showed higher relative benefits of the SWS as compared to the SOCS (Figure 5g,h).

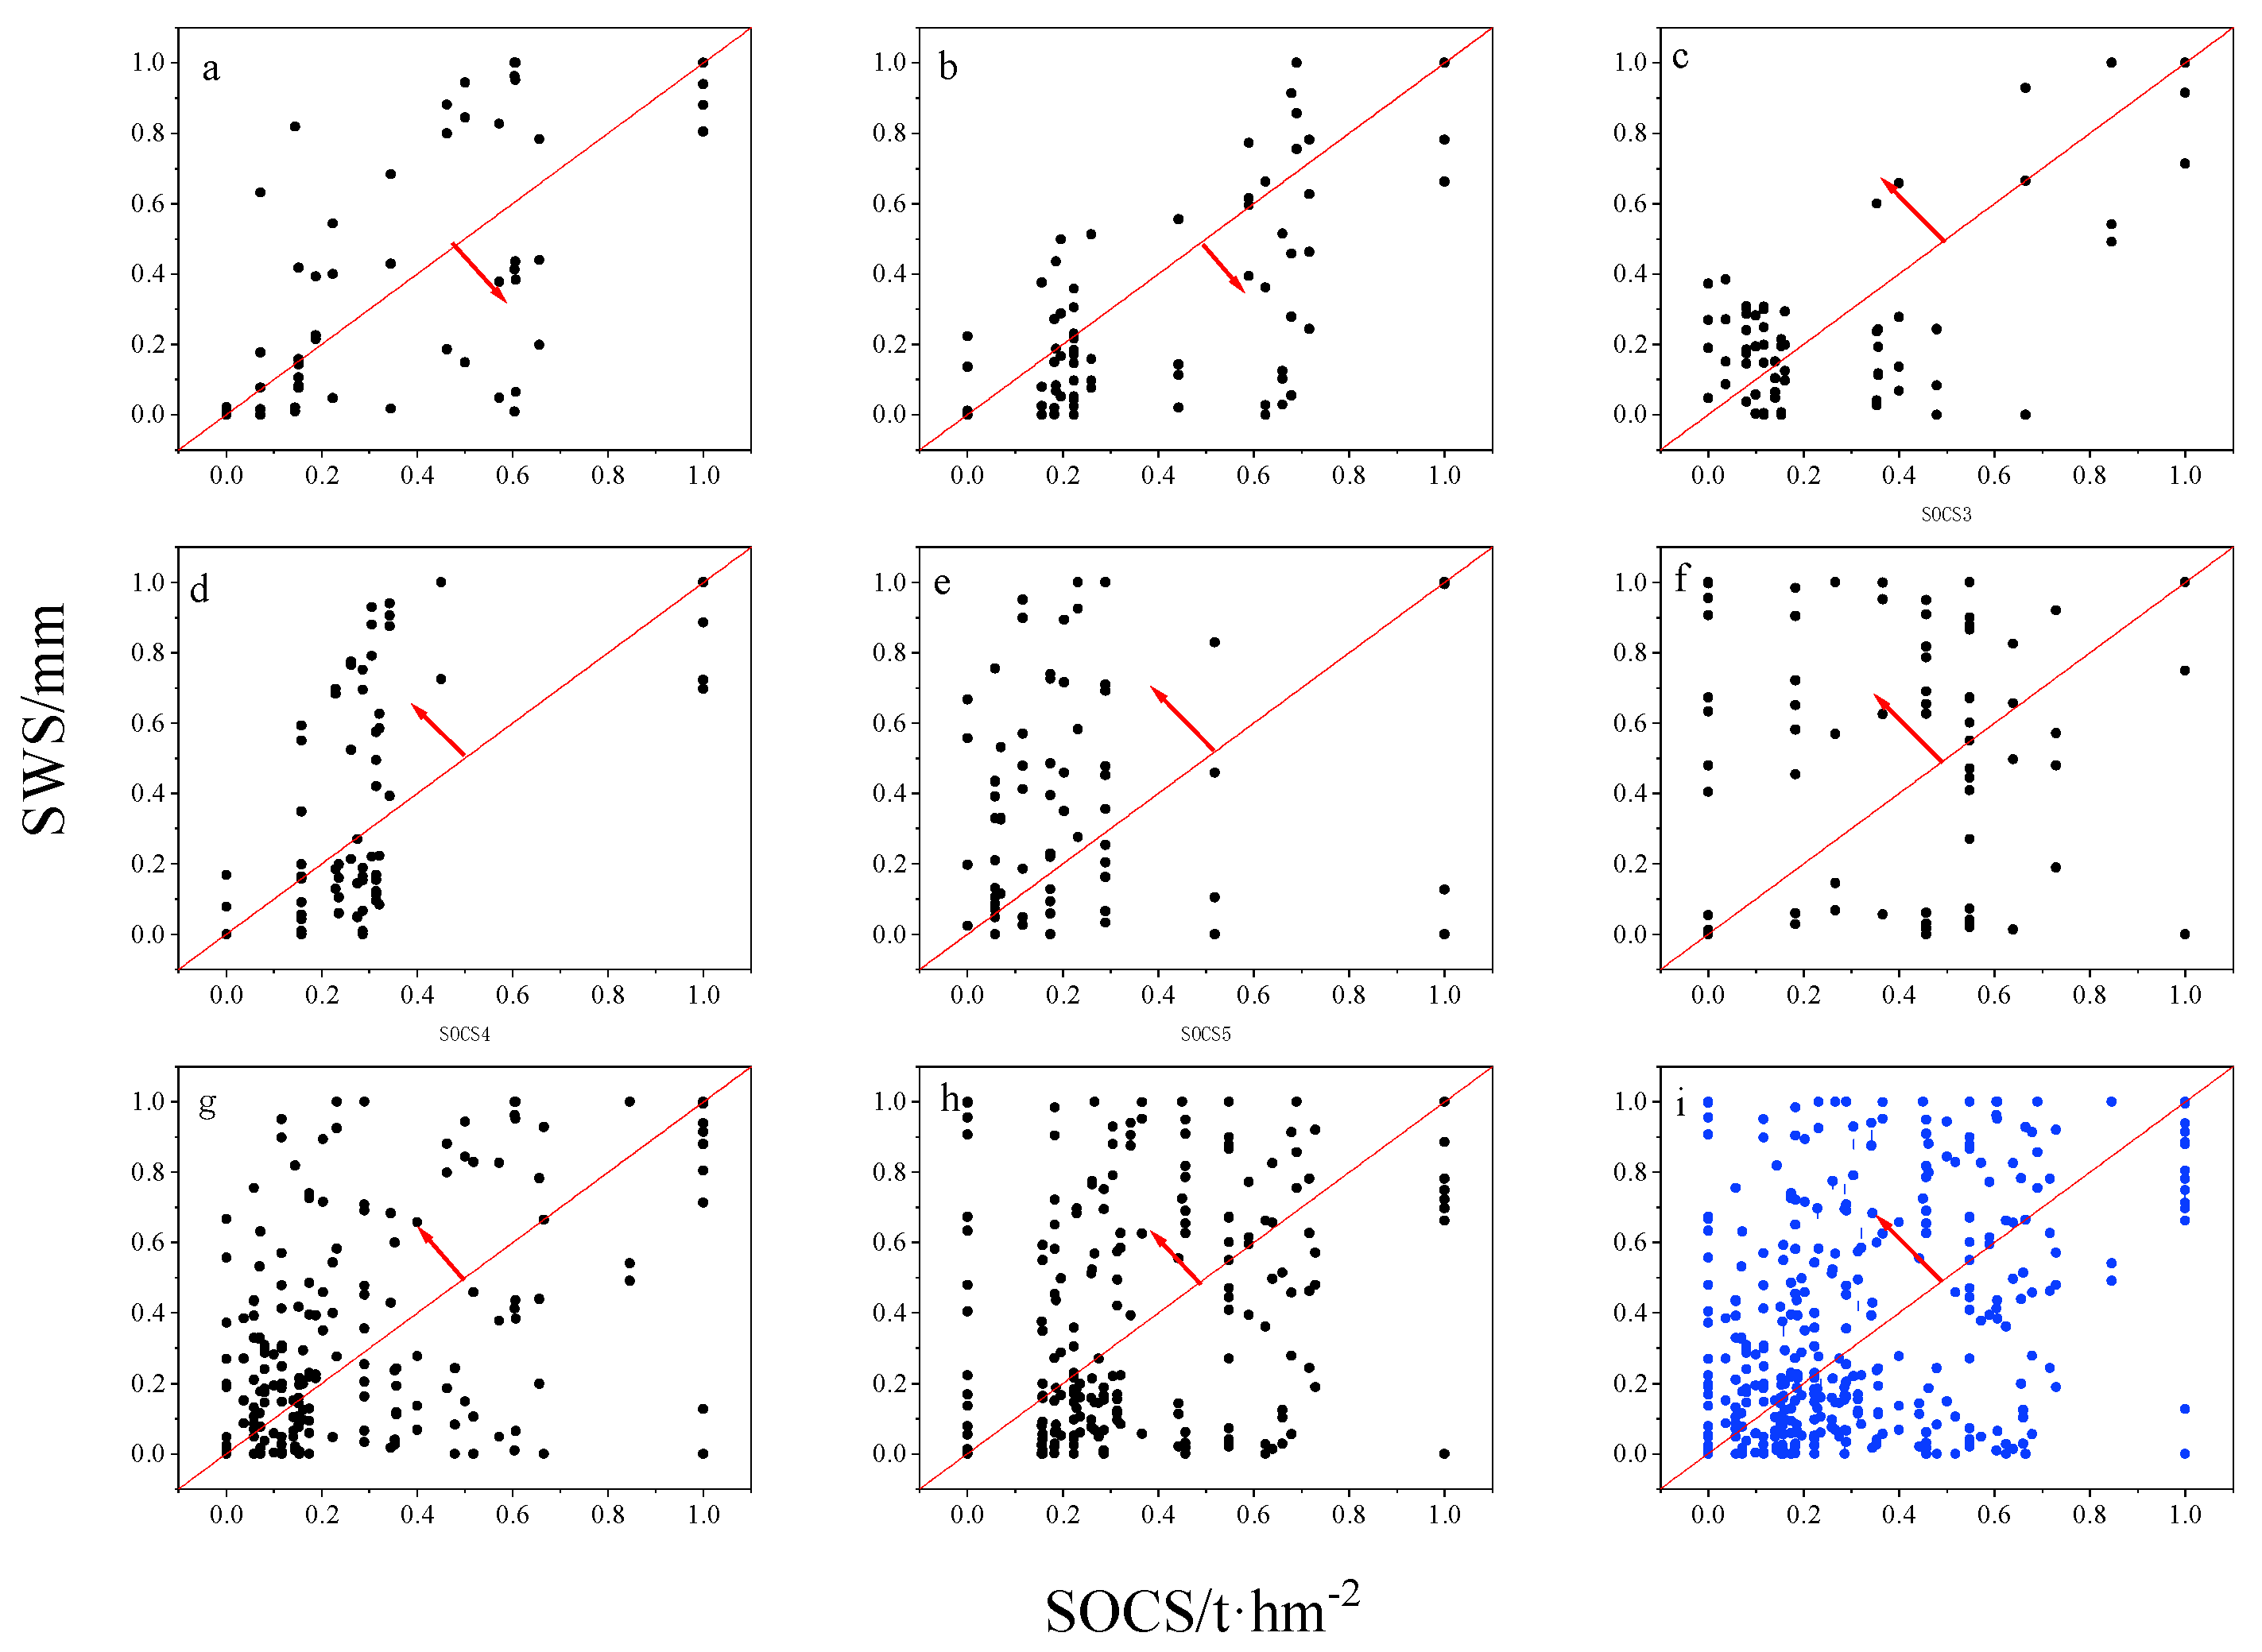
3.3.2. Trade-Off Analysis of SOCS and SWS

In the 0–340 cm soil layer, across different vegetation types, the trend was GL (0.39) > AU (0.32) > GU (0.30) > JU (0.24) > AL (0.19) > JL (0.16) (Table 2). Under different land preparation methods, GL showed the highest RMSE while JL showed the lowest value, and AU showed the highest RMSE while JU exhibited the lowest value. In the 0–20 cm soil layer, except for GU, the RMSE values were the smallest across different soil layers; in the 20–40 cm soil layer, the RMSE values were the largest, and with an increase in soil depth, the RMSE values decreased, and the RMSE of the undisturbed slope grassland showed greater fluctuations.

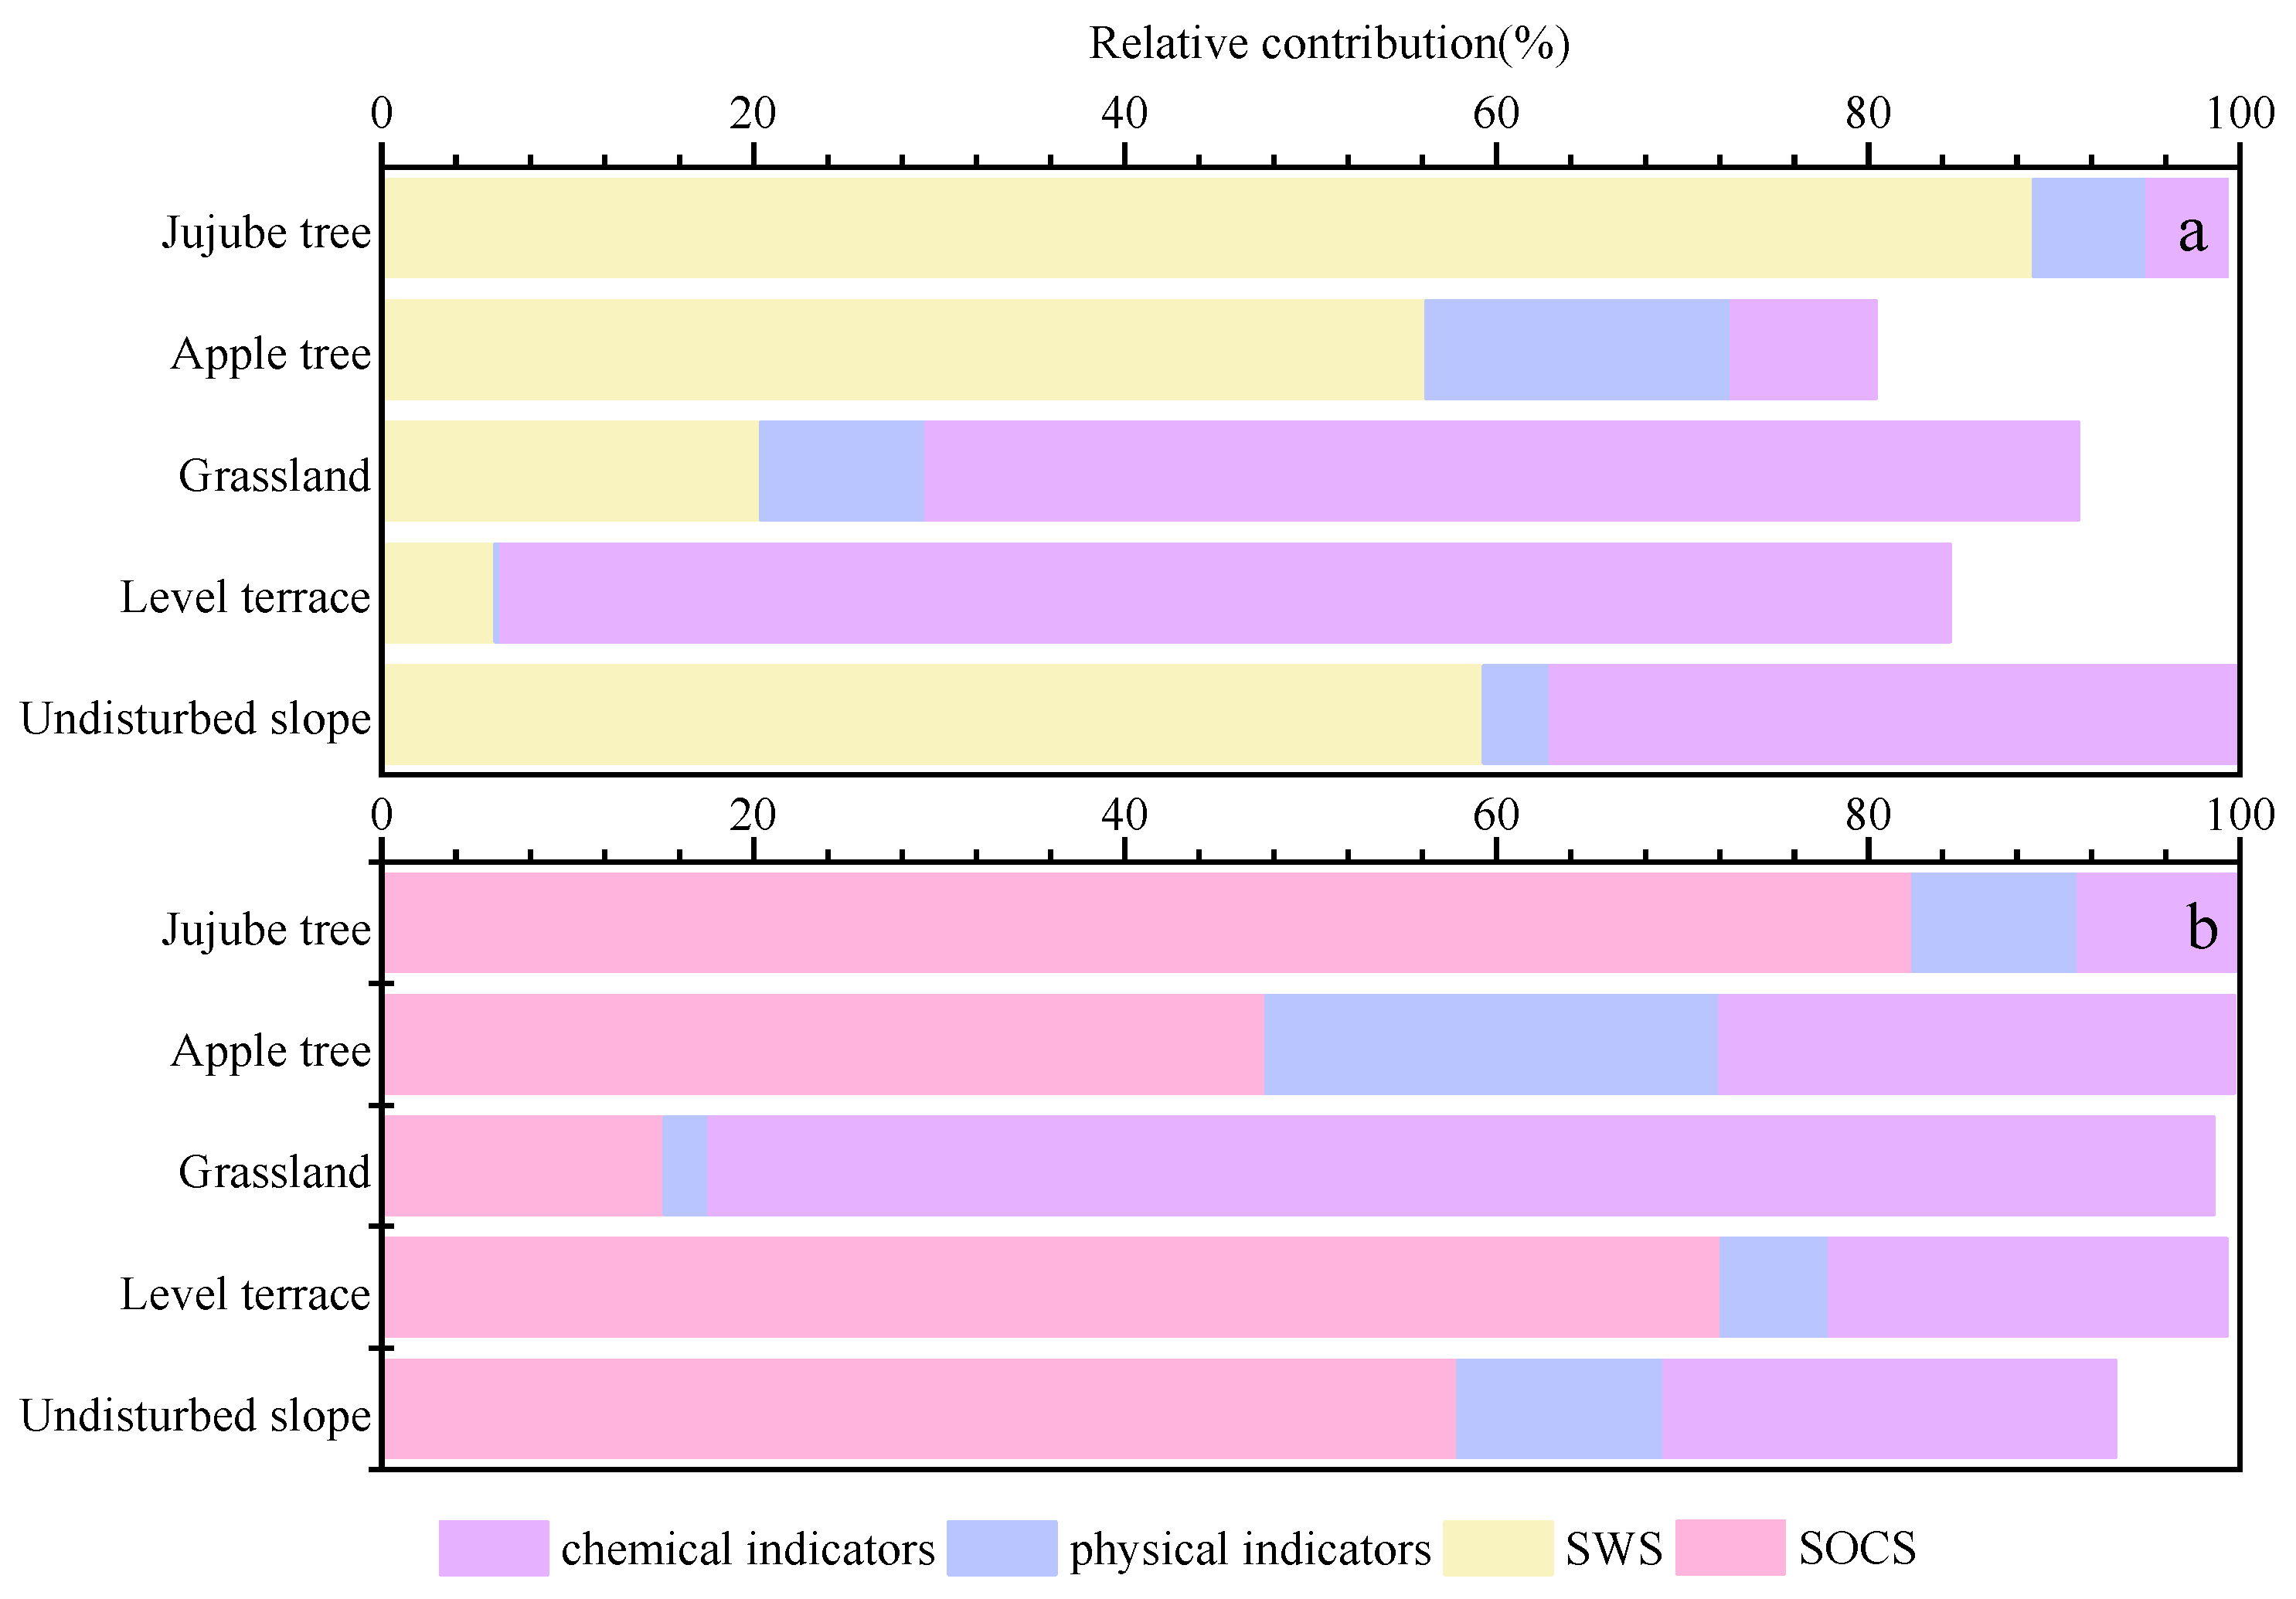
3.4. Analysis of Environmental Factors and Contribution of SOCS and SWS

Changes in the SOCS and SWS were influenced by several environmental factors, including physical indicators (BD, SMC, CWHC, and TCP), chemical indicators (AN, AP, AK, pH, and EC), and their interactions (Figure 6a,b). Among the different vegetation types, the SWS and SOCS in the abandoned jujube forest had the strongest interaction and the highest explanation rate, both at 71.6%. The SOCS and SWS in the abandoned apple forest had the strongest interaction and the highest explanation rate, both at 38%. The chemical factors in the abandoned grassland had the highest explanation rate for the SOCS and SWS, at 46.3% and 78.5%, respectively. Under different land preparation methods, the chemical factors showed the highest interpretation rate at 75.7% for the SOCS, and the SOCS showed the highest interpretation rate at 51.4% for the SWS. The mutual interpretation rate of the SWS and SOCS on undisturbed slopes was the highest at 49.8%.

4. Discussion

4.1. Response of SOCS to Vegetation

Vegetation is an important factor affecting the soil’s organic carbon content [33], as it changes the balance between the input and output of organic carbon through complex physical, chemical, and biological decomposition processes, thereby affecting the SOC distribution [34]. It was shown that the thickness of dead litter and root distribution in abandoned woodlands were more conducive to SOCS accumulation [35]. The results of this study also show that the SOCS in the abandoned economic forests was significantly higher than that in the grassland, and that the abandoned woodlands contributed more to the SOCS than the grassland. The SOCS of the abandoned jujube forest was higher than that of the apple forest, indicating that SOC sequestration in the abandoned jujube forest was better than that in the apple forest. This may be due to the more developed root system of jujube trees, the different microclimate zones formed on the underlying surface across different vegetation types, and a large accumulation of litter and rhizosphere sediments that affect the activity of soil microorganisms and change the carbon conversion rates [36,37,38] Land preparation methods exerted little effect on the SOCS of forest land following abandonment but had a great impact on the abandoned grassland. There was no significant difference in the SOCS between the jujube and apple forests on an undisturbed slope and a level terrace. Site conditions had little effect on the average organic carbon content, and the effects of vegetation growth on the soil organic carbon were stronger than those due to site conditions. However, the total organic carbon content in the undisturbed slope plots of the grassland was significantly higher than that in the level terrace plots. This may be attributed to the growing range of herbaceous plants, which have limited influence on the soil depth, and topographic changes are more likely to affect soil material migration and transformation [39].
The results show that after abandonment, the SOCS generally fluctuated and decreased with an increase in the soil depth. In the 0–20 cm soil layer, the SOCS was the highest, which could be attributed to the increase in the soil organic carbon accumulation due to the supply from surface vegetation consisting of the litter layer and dead root decomposition [40,41]. Water is deficient in deep layers of vegetation, and water stress reduces the return of organic matter [42], which may affect the accumulation of organic carbon. However, our findings show that the SOCS accounted for 60.63% of the carbon storage in the soil layer below 100 cm, suggesting a relatively large proportion of the total. Therefore, deep soil layers have great carbon sequestration potential, and future evaluation of SOCS is warranted.

4.2. Response of SWS to Vegetation

The vegetation mainly affects the soil moisture through canopy interception [43]. The feedback between vegetation and soil moisture plays an important role in improving the understanding of soil and water conservation and water use strategies. [44]. The study of soil water storage in the jujube forest, apple forest, and grassland under different land preparation methods after abandonment suggested that the SWS of the abandoned economic forest was higher than that of the grassland, indicating that the water retention effect of the grassland was lower than that of the woodland [45]. Under different land preparation methods, the SWS for the same vegetation on a level terrace was higher than that on an undisturbed slope, indicating that the land preparation method had a certain impact on the soil water content. The soil structure and soil water distribution patterns changed significantly, and the level terrace was more conducive to soil water retention [46].
The results of this study show that the SWS in the 0–20 cm soil layer was the highest, and below 100 cm, the SWS accounted for 64.63 % of the total storage. The plant canopy reduces the surface temperature and soil evaporation [44], while rainfall infiltration supplements moisture in the shallow soil, resulting in the highest surface soil water storage. Moreover, studies have shown that the permeability of arbor surface soil moisture is the best compared to shrubs and grasses, and the permeability potential of deep soil moisture is high with a high litter coating, thus preventing soil crust formation, increasing the soil organic matter content and porosity, and facilitating soil moisture infiltration [47], and thereby promoting the accumulation of deep soil water storage. Deep soil moisture can serve as a reserve water resource for plant utilization [48] and plays an important role in vegetation growth.

4.3. Relative Trade-Offs between SOCS and SWS and Their Benefits

Soil moisture, as a bridge between soil, vegetation, and atmosphere, is a key factor affecting vegetation growth, development, and ecological recovery [49,50]. According to the trade-off analysis, the SWS plays the dominant role in the study area. After abandonment, the relative benefits of the SWS were higher than those of the SOCS in the apple forest and grassland, while the trends were opposite in the jujube forest. Therefore, we suggest that for the future transformation of abandoned grasslands and mountainous apple woodlands, soil organic carbon content and fertility should be improved by planting carbon-fixing crops or green manure crops, such as legumes. Leguminous plants have a strong nitrogen fixation capacity, which increases the SOCS capacity by 30% and effectively improves the soil health and C content [51]. However, the transformation of abandoned jujube forests requires an increase in the allocation of water-retaining vegetation and water-retaining construction measures to improve the soil moisture benefits. Under different land preparation methods, the level terrace and undisturbed slope showed that the relative benefits of SWS were greater than those of SOCS, and the RMSE values were the lowest for the jujube forest. The mixed use of arbors, shrubs, and grasses is recommended [52]. Reasonable planting policies and land use contribute to economic, environmental, and social benefits [53]. Over time, under the influence of changing climatic conditions, environmental factors, complex topographic factors, and human disturbances [54,55], the soil organic carbon content and soil moisture are also altered. However, combined with the existing knowledge, the results of the trade-off analysis between different ESs can provide a reference for the transformation of abandoned forest land in other similar areas.

4.4. Environmental Influences on SOCS and SWS

Soil water content is one of the main factors affecting plant growth in arid areas. Changes in the soil water content can change the productivity of organisms, thereby promoting or inhibiting changes in the organic carbon content [56]. Studies have also shown that soil moisture is an indicator of soil organic matter accumulation [12], which determines the soil organic carbon content [57,58]. Our findings also suggest that the SOCS and SWS of the abandoned economic forests had the highest mutual interpretation rate and strong interaction. However, the chemical indicators showed the highest explanation rate for the SOCS and SWS in the abandoned grassland. This could be attributed to limited microbial decomposition due to the substrate quality in the abandoned grassland [59]; microbial decomposition is faster [60], soil nutrient levels are high, and the utilization of organic carbon is accelerated. A previous study showed that surface litter and animal and plant residues are the main sources of soil nutrients [61]. The decomposition of plant litter and animal and plant residues can increase the soil nutrient content, thus indirectly improving the soil structure, reducing the soil bulk density, increasing the soil porosity, and promoting soil moisture accumulation [62,63]. This study shows that under different land preparation methods, the chemical factors and SOCS of a level terrace had the highest interpretation rates for the SOCS and SWS, respectively, and the SOCS and SWS of an undisturbed slope had the highest mutual interpretation rate. This could be attributed to the strong capacity of the level terrace for storing runoff and litter, which strengthens the role of humification, thus enriching the nutrient elements in the surface layer. When the soil nutrient content is high, it affects the soil organic matter content [64]; when the runoff velocity and flow rate of an undisturbed slope are high, the rainfall interception effect is small, and thus, the soil moisture and nutrient loss affect the vegetation growth [65], in turn affecting the soil organic carbon accumulation.

5. Conclusions

In conclusion, the spatial distribution characteristics of the SOCS and SWS in a 0–340 cm deep soil layer of abandoned economic forest in the loess hilly areas were studied. The SOCS and SWS in the 0–20 cm deep soil layer were the highest and decreased with an increase in depth; however, the accumulation was high in deeper layers (below 100 cm), at 60.63% and 64.63%, respectively. The potential for water retention and carbon sequestration was high. After abandonment, the SOCS and SWS were different across different vegetation types and under various land preparation methods. In the study area, as compared to the SOCS, the SWS showed higher relative benefits, thus ensuring the prospect of sustainable development for vegetation restoration Across different vegetation types, the relative benefits of the SWS in the abandoned apple forest and grassland were higher than that of the SOCS, while these trends were the opposite for the jujube forest. According to previous findings, it is suggested that the abandoned mountain apple and grassland can be restored by planting carbon-fixing crops or green manure crops, and the mountain jujube forest can further improve the soil moisture benefits through water-retaining vegetation and the construction of water-retaining infrastructure. Under different land preparation methods, the relative benefits of the SWS in the study area were higher than those of the SOCS, and the RMSE was the lowest for the jujube forest. Therefore, we recommend the mixed use of arbors, shrubs, and grasses for transformation. In addition, environmental factors have an influence on different vegetation types and land preparation methods after abandonment. In addition to the interaction between SOCS and SWS, chemical indicators exerted the greatest impact on the abandoned grassland and SOCS of the level terrace.

Author Contributions

Conceptualization, T.X., R.G., N.A. and F.Q.; methodology, T.X., N.A., G.L. and C.L.;validation, T.X., N.A. and N.Y.; writing—original draft preparation, T.X.; writing—review and editing, N.A. and T.X.; supervision, N.A., G.L. and C.L. All authors have read and agreed to the published version of the manuscript.

Funding

This work was funded by the National Natural Science Foundation of China (U2243601, 32060297), the Shaanxi Natural Science Basic Research Project (2021JQ626), the China Institute of Water Resources and Hydropower Research (IWHR) R & D Support Programs (SC0145B012022 and SC0202A012018), and the Innovation and Entrepreneurship Training Program for College Students (S202210719031, S202210719133).

Institutional Review Board Statement

Not applicable.

Informed Consent Statement

Not applicable.

Data Availability Statement

Not applicable.

Acknowledgments

The authors greatly appreciate the assistance of Qiaoyu Zong, Zhiyong Zhang, Kangxuan Zang, and Yongwei Zhou.

Conflicts of Interest

The authors declare that they have no known competing financial interest or personal relationships that could have appeared to influence the work reported in this paper.

References

  1. Yu, H.; Zha, T.; Zhang, X.; Ma, L. Vertical distribution and influencing factors of soil organic carbon in the Loess Plateau, China. Sci. Total Environ. 2019, 693, 133632. [Google Scholar] [CrossRef] [PubMed]
  2. Murty, D.; Kirschbaum, M.U.; Mcmurtrie, R.E.; Mcgilvray, H. Does conversion of forest to agricultural land change soil carbon and nitrogen? A review of the literature. Glob. Chang. Biol. 2002, 8, 105–123. [Google Scholar] [CrossRef]
  3. Jin, T.; Fu, B.; Liu, G.; Wang, Z. Hydrologic feasibility of artificial forestation in the semi-arid Loess Plateau of China. Hydrol. Earth Syst. Sci. 2011, 15, 2519–2530. [Google Scholar] [CrossRef] [Green Version]
  4. Porporato, A.; D’odorico, P.; Laio, F.; Ridolfi, L.; Rodriguez-Iturbe, I. Ecohydrology of water-controlled ecosystems. Adv. Water Resour. 2002, 25, 1335–1348. [Google Scholar] [CrossRef]
  5. Chen, H.; Shao, M.; Li, Y. Soil desiccation in the Loess Plateau of China. Geoderma 2008, 143, 91–100. [Google Scholar] [CrossRef]
  6. Yang, L.; Zhang, H.; Chen, L. Identification on threshold and efficiency of rainfall replenishment to soil water in semi-arid loess hilly areas. Sci. China Earth Sci. 2018, 61, 292–301. [Google Scholar] [CrossRef]
  7. Lu, N.; Fu, B.; Jin, T.; Chang, R. Trade-off analyses of multiple ecosystem services by plantations along a precipitation gradient across Loess Plateau landscapes. Landsc. Ecol. 2014, 29, 1697–1708. [Google Scholar] [CrossRef]
  8. Zhao, F.; Wu, Y.; Qiu, L.; Sivakumar, B.; Zhang, F.; Sun, Y.; Sun, L.; Li, Q.; Voinov, A. Spatiotemporal features of the hydro-biogeochemical cycles in a typical loess gully watershed. Ecol. Indic. 2018, 91, 542–554. [Google Scholar] [CrossRef]
  9. Lan, Z.; Zhao, Y.; Zhang, J.; Jiao, R.; Khan, M.N.; Sial, T.A.; Si, B. Long-term vegetation restoration increases deep soil carbon storage in the Northern Loess Plateau. Sci. Rep. 2021, 11, 1–11. [Google Scholar] [CrossRef]
  10. Yang, F.; Huang, M.; Li, C.; Wu, X.; Guo, T.; Zhu, M. Changes in soil moisture and organic carbon under deep-rooted trees of different stand ages on the Chinese Loess Plateau. Agric. Ecosyst. Environ. 2022, 328, 107855. [Google Scholar] [CrossRef]
  11. Guo, Z.; Han, J.; Li, J.; Xu, Y.; Wang, X. Effects of long-term fertilization on soil organic carbon mineralization and microbial community structure. PLoS ONE 2019, 14, e0211163. [Google Scholar]
  12. Zhang, Y.-W.; Shangguan, Z.-P. The coupling interaction of soil water and organic carbon storage in the long vegetation restoration on the Loess Plateau. Ecol. Eng. 2016, 91, 574–581. [Google Scholar] [CrossRef]
  13. Xin, M.; Wang, J.; Xing, Z. Decline of virtual water inequality in China’s inter-provincial trade: An environmental economic trade-off analysis. Sci. Total Environ. 2022, 806, 150524. [Google Scholar] [CrossRef] [PubMed]
  14. Okamoto, D.K.; Poe, M.R.; Francis, T.B.; Punt, A.E.; Levin, P.S.; Shelton, A.O.; Armitage, D.R.; Cleary, J.S.; Dressell, S.C.; Jones, R. Attending to spatial social–ecological sensitivities to improve trade-off analysis in natural resource management. Fish Fish. 2020, 21, 1–12. [Google Scholar] [CrossRef]
  15. Luo, R.; Yang, S.; Wang, Z.; Zhang, T.; Gao, P. Impact and trade off analysis of land use change on spatial pattern of ecosystem services in Chishui River Basin. Environ. Sci. Pollut. Res. 2022, 29, 20234–20248. [Google Scholar] [CrossRef]
  16. García, A.M.; Santé, I.; Loureiro, X.; Miranda, D. Green infrastructure spatial planning considering ecosystem services assessment and trade-off analysis. Application at landscape scale in Galicia region (NW Spain). Ecosyst. Serv. 2020, 43, 101115. [Google Scholar] [CrossRef]
  17. Zhao, F.; Yu, G. A review on the coupled carbon and water cycles in the terrestrial ecosystems. Prog. Geogr. 2008, 27, 32–38. [Google Scholar]
  18. Zhao, F.; Yu, G.; Li, S.; Ren, C.; Sun, X.; Mi, N.; Li, J.; Ouyang, Z. Canopy water use efficiency of winter wheat in the North China Plain. Agric. Water Manag. 2007, 93, 99–108. [Google Scholar] [CrossRef]
  19. Su, B.; Su, Z.; Shangguan, Z. Trade-off analyses of plant biomass and soil moisture relations on the Loess Plateau. Catena 2021, 197, 104946. [Google Scholar] [CrossRef]
  20. Wang, L.; Wang, X.; Chen, L.; Song, N.P.; Yang, X.G. Trade-off between soil moisture and species diversity in semi-arid steppes in the Loess Plateau of China. Sci. Total Environ. 2021, 750, 141646. [Google Scholar] [CrossRef]
  21. Chen, Y.; Wei, T.; Ren, K.; Sha, G.; Guo, X.; Fu, Y.; Yu, H. The coupling interaction of soil organic carbon stock and water storage after vegetation restoration on the Loess Plateau, China. J. Environ. Manag. 2022, 306, 114481. [Google Scholar] [CrossRef] [PubMed]
  22. Ge, Y.; Ren, F. Spatial Distribution and Characteristics of Economic Forest Resources in Shaanxi Province. For. Inventory Plan. 2019, 44, 36–41. [Google Scholar]
  23. Deng, L.; Wang, G.; Liu, G.; Shangguan, Z. Effects of age and land-use changes on soil carbon and nitrogen sequestrations following cropland abandonment on the Loess Plateau, China. Ecol. Eng. 2016, 90, 105–112. [Google Scholar] [CrossRef]
  24. Zhang, H.; Liu, W.; Yuan, W.; Dong, W.; Xia, J.; Cao, Y.; Jia, Y. Loess Plateau check dams can potentially sequester eroded soil organic carbon. J. Geophys. Res. Biogeosciences 2016, 121, 1449–1455. [Google Scholar] [CrossRef]
  25. Chang, R.; Jin, T.; Lü, Y.; Liu, G.; Fu, B. Soil carbon and nitrogen changes following afforestation of marginal cropland across a precipitation gradient in Loess Plateau of China. PLoS ONE 2014, 9, e85426. [Google Scholar] [CrossRef] [Green Version]
  26. Li, Z.; Liu, C.; Dong, Y.; Chang, X.; Nie, X.; Liu, L.; Xiao, H.; Lu, Y.; Zeng, G. Response of soil organic carbon and nitrogen stocks to soil erosion and land use types in the Loess hilly–gully region of China. Soil Tillage Res. 2017, 166, 1–9. [Google Scholar] [CrossRef]
  27. Institute of Soil Science; Chinese Academy of Sciences. Soil Physical Properties Determination Method; Science Press: Beijing, China, 1978; Chapters 2, 4, 6. [Google Scholar]
  28. Bao, S. Soil Agrochemical Analysis; China Agriculture Press: Beijing, China, 2000; Chapters 2–10. [Google Scholar]
  29. Song, G.; Li, L.; Pan, G.; Zhang, Q. Topsoil organic carbon storage of China and its loss by cultivation. Biogeochemistry 2005, 74, 47–62. [Google Scholar] [CrossRef]
  30. Lijuan, Y.; Guang, L.; Jiangqi, W.; Weiwei, M.; Haiyan, W. Effects of four typical vegetations on soil active organic carbon and soil carbon in Loess Plateau. Acta Ecol. Sin. 2019, 39, 5546–5554. [Google Scholar]
  31. Feng, Q.; Zhao, W.; Hu, X.; Liu, Y.; Daryanto, S.; Cherubini, F. Trading-off ecosystem services for better ecological restoration: A case study in the Loess Plateau of China. J. Clean. Prod. 2020, 257, 120469. [Google Scholar] [CrossRef]
  32. Shumiao, X.; Hengrui, W.; Wei, Z.; Baojiang, Z.; Gang, D.; Haidong, Z. Effects of Different Grazing Methods on the Production and Ecological Functions of Mountain Meadows and their Trade-off Relationships. Acta Agrestia Sin. 2022, 030. [Google Scholar]
  33. Bätz, N.; Verrecchia, E.P.; Lane, S.N. Organic matter processing and soil evolution in a braided river system. Catena 2015, 126, 86–97. [Google Scholar] [CrossRef]
  34. Jobbágy, E.G.; Jackson, R.B. The vertical distribution of soil organic carbon and its relation to climate and vegetation. Ecol. Appl. 2000, 10, 423–436. [Google Scholar] [CrossRef]
  35. Sokol, N.W.; Kuebbing, S.E.; Karlsen-Ayala, E.; Bradford, M.A. Evidence for the primacy of living root inputs, not root or shoot litter, in forming soil organic carbon. New Phytol. 2019, 221, 233–246. [Google Scholar] [CrossRef] [PubMed] [Green Version]
  36. Deng, L.; Han, Q.S.; Zhang, C.; Tang, Z.S.; Shangguan, Z.P. Above-ground and below-ground ecosystem biomass accumulation and carbon sequestration with Caragana korshinskii Kom plantation development. Land Degrad. Dev. 2017, 28, 906–917. [Google Scholar] [CrossRef]
  37. Liang, C.; Schimel, J.P.; Jastrow, J.D. The importance of anabolism in microbial control over soil carbon storage. Nat. Microbiol. 2017, 2, 1–6. [Google Scholar] [CrossRef]
  38. Huang, Y.; Xin, Z.; Hou, J.; Li, Z.; Yang, L.; Yuan, H.; Majid, A. Soil organic carbon stocks in an investigated watershed transect linked to ecological restoration practices on the Loess Plateau. Land Degrad. Dev. 2021, 32, 1148–1163. [Google Scholar] [CrossRef]
  39. Gao, R.; Wang, Y.; Ai, N.; Liu, C.; Zong, Q.; Qiang, F. Characteristics and influencing factors of deep soil organic carbon in characteristic economic forest in Northern Shaanxi. J. For. Environ. 2021, 41, 464–470. [Google Scholar] [CrossRef]
  40. Deng, L.; Wang, K.; Zhu, G.; Liu, Y.; Chen, L.; Shangguan, Z. Changes of soil carbon in five land use stages following 10 years of vegetation succession on the Loess Plateau, China. Catena 2018, 171, 185–192. [Google Scholar] [CrossRef]
  41. Gao, X.; Li, H.; Zhao, X.; Ma, W.; Wu, P. Identifying a suitable revegetation technique for soil restoration on water-limited and degraded land: Considering both deep soil moisture deficit and soil organic carbon sequestration. Geoderma 2018, 319, 61–69. [Google Scholar] [CrossRef]
  42. Bowden, R.D.; Newkirk, K.M.; Rullo, G.M. Carbon dioxide and methane fluxes by a forest soil under laboratory-controlled moisture and temperature conditions. Soil Biol. Biochem. 1998, 30, 1591–1597. [Google Scholar] [CrossRef] [Green Version]
  43. Sala, O.; Lauenroth, W.; Parton, W. Long-term soil water dynamics in the shortgrass steppe. Ecology 1992, 73, 1175–1181. [Google Scholar] [CrossRef]
  44. Wei, X.; Huang, Q.; Huang, S.; Leng, G.; Qu, Y.; Deng, M.; Han, Z.; Zhao, J.; Liu, D.; Bai, Q. Assessing the feedback relationship between vegetation and soil moisture over the Loess Plateau, China. Ecol. Indic. 2022, 134, 108493. [Google Scholar] [CrossRef]
  45. Zhou, Y.; Wei, T.; Xie, J.; Shi, X.; Gen-Batu, G.; Dong, Z.; Cheng, Z. Different types of vegetation cover and water conservation benefits. J. Soil Water Conserv. 2011, 3, 12–21. [Google Scholar]
  46. Gu, L.; Pei, Y.; Zheng, K.; Kong, J.; Guo, Y.; Zhang, M. Influence of Different Site Preparation on Soil Water Content in Dry-hot Valley of Yuanmou County. J. West China For. Sci. 2017, 46, 71–76. [Google Scholar]
  47. Ge, F.; Xu, M. Comparison of Soil Hydrologic Properties Under Different Conversion Patterns in the Hilly-gully Region of the Loess Plateau. J. Soil Water Conserv. 2021, 35, 154–160. [Google Scholar] [CrossRef]
  48. Yang, F.; Feng, Z.; Wang, H.; Dai, X.; Fu, X. Deep soil water extraction helps to drought avoidance but shallow soil water uptake during dry season controls the inter-annual variation in tree growth in four subtropical plantations. Agric. For. Meteorol. 2017, 234, 106–114. [Google Scholar] [CrossRef]
  49. Srivastava, P.K.; Han, D.; Rico-Ramirez, M.A.; Bray, M.; Islam, T. Selection of classification techniques for land use/land cover change investigation. Adv. Space Res. 2012, 50, 1250–1265. [Google Scholar] [CrossRef]
  50. Tian, J.; Zhang, B.; He, C.; Han, Z.; Bogena, H.R.; Huisman, J.A. Dynamic response patterns of profile soil moisture wetting events under different land covers in the Mountainous area of the Heihe River Watershed, Northwest China. Agric. For. Meteorol. 2019, 271, 225–239. [Google Scholar] [CrossRef]
  51. Kumar, S.; Meena, R.S.; Lal, R.; Singh Yadav, G.; Mitran, T.; Meena, B.L.; Dotaniya, M.L.; El-Sabagh, A. Role of Legumes in Soil Carbon Sequestration. In Legumes for Soil Health and Sustainable Management; Springer: Singapore, 2018; pp. 109–138. [Google Scholar] [CrossRef]
  52. Gong, C.; Tan, Q.; Xu, M.; Liu, G. Mixed-species plantations can alleviate water stress on the Loess Plateau. For. Ecol. Manag. 2020, 458, 117767. [Google Scholar] [CrossRef]
  53. Zhang, D.; Jia, Q.; Xu, X.; Yao, S.; Chen, H.; Hou, X. Contribution of ecological policies to vegetation restoration: A case study from Wuqi County in Shaanxi Province, China. Land Use Policy 2018, 73, 400–411. [Google Scholar] [CrossRef]
  54. Zhao, F.; Wu, Y.; Yao, Y.; Sun, K.; Zhang, X.; Winowiecki, L.; Vågen, T.-G.; Xu, J.; Qiu, L.; Sun, P.; et al. Predicting the climate change impacts on water-carbon coupling cycles for a loess hilly-gully watershed. J. Hydrol. 2020, 581, 124388. [Google Scholar] [CrossRef]
  55. Liu, Z.; Shao, M.A.; Wang, Y. Effect of environmental factors on regional soil organic carbon stocks across the Loess Plateau region, China. Agric. Ecosyst. Environ. 2011, 142, 184–194. [Google Scholar] [CrossRef]
  56. Callesen, I.; Liski, J.; Raulund-Rasmussen, K.; Olsson, M.; Tau-Strand, L.; Vesterdal, L.; Westman, C. Soil carbon stores in Nordic well-drained forest soils—Relationships with climate and texture class. Glob. Chang. Biol. 2003, 9, 358–370. [Google Scholar] [CrossRef]
  57. Jangid, K.; Williams, M.A.; Franzluebbers, A.J.; Schmidt, T.M.; Coleman, D.C.; Whitman, W.B. Land-use history has a stronger impact on soil microbial community composition than aboveground vegetation and soil properties. Soil Biol. Biochem. 2011, 43, 2184–2193. [Google Scholar] [CrossRef]
  58. Smith, P. Land use change and soil organic carbon dynamics. Nutr. Cycl. Agroecosyst. 2008, 81, 169–178. [Google Scholar] [CrossRef]
  59. Zhang, Z.Y.; Qiang, F.F.; Liu, G.Q.; Liu, C.H.; Ai, N. Distribution characteristics of soil microbial communities and their responses to environmental factors in the sea buckthorn forest in the water-wind erosion crisscross region. Front. Microbiol. 2023, 13, 5256. [Google Scholar] [CrossRef]
  60. Gao, Y.; Zhou, J.; Wang, L.; Guo, J.; Feng, J.; Wu, H.; Lin, G. Distribution patterns and controlling factors for the soil organic carbon in four mangrove forests of China. Glob. Ecol. Conserv. 2019, 17, e00575. [Google Scholar] [CrossRef]
  61. Zhang, W.; Gao, D.; Chen, Z.; Li, H.; Deng, J.; Qiao, W.; Han, X.; Yang, G.; Feng, Y.; Huang, J. Substrate quality and soil environmental conditions predict litter decomposition and drive soil nutrient dynamics following afforestation on the Loess Plateau of China. Geoderma 2018, 325, 152–161. [Google Scholar] [CrossRef]
  62. Liu, H.; Zhang, S.; Jiao, F. Relationships between community characteristics and soil nutrients and moisture in abandoned hill country grassland. Acta Pratacult. Sin. 2016, 25, 31–39. [Google Scholar]
  63. Feng, T.; Wei, W.; Chen, L.; Yu, Y.; Yang, L.; Zhang, H. Effects of land preparations and vegetation types on soil chemical features in a loess hilly region. Acta Ecol. Sin. 2016, 36, 3216–3225. [Google Scholar]
  64. Wang, Z.; Duan, J.; Gao, W. Study on the benefits of slope runoff control afforestation in the gully area of Longdong Loess Plateau. Soil Water Conserv. China 2018, 58–61. [Google Scholar] [CrossRef]
  65. PuYang, X.; Gou, Q.; Zhao, Z.; Huang, J.; Yang, Y. Soil Desiccation Effects of Micro-Topographic in Different Precipitation Locations in the Loess Region of Northern Shaanxi Province. J. Sichuan Agric. Univ. 2020, 38, 734–741. [Google Scholar] [CrossRef]
Figure 1. Location of the sampling sites.
Forests 14 00221 g001
Figure 2. Describe the trade-off between two ecosystem services (ESs). Point B favors ES2 and point C favors ES1. Points B and C are at the same distance from the trade-off bisector and have equal trade-off values, but the trade-off value is less than point A. Point D has a zero trade-off value.
Forests 14 00221 g002
Figure 3. (a) Changes in soil organic carbon storage (SOCS) of different vegetation types; different capital letters indicate significant differences in SOCS of different vegetation types in the same soil layer (p < 0.05). (b) Distribution of total SOCS and (c) percentage of accumulated SOCS in different vegetation types. The center line and empty squares represent the median and mean values, respectively.
Forests 14 00221 g003
Figure 4. (a) Changes in soil water storage (SWS) of different vegetation types; different capital letters indicate significant differences in SWS of different vegetation types in the same soil layer (p < 0.05). (b) Distribution of total SWS and (c) percentage of accumulated SWS in different vegetation types. The center line and empty squares represent the median and mean values, respectively.
Forests 14 00221 g004
Figure 5. The trade-off between soil organic carbon storage (SOCS) and soil water storage (SWS). The relative benefits of SOCS and SWS in (a) JL, (b) JU, (c) AL, (d) AU, (e) GL, and (f) GU are expressed by black points. (g,h) The relative benefits of SOCS and SWS in level terraces and undisturbed slopes. (i) The relative benefits throughout the region are expressed by blue points. The vertical distance between the point and the 1:1 line represents the degree of compromise, and the direction of the arrow indicates which ES is more efficient.
Forests 14 00221 g005
Figure 6. Soil layer: 0–340 cm. (a) The relative contribution of soil water storage (SWS), physical indicators (soil bulk density, saturated water content, capillary water holding capacity, total porosity), and chemical indicators (available nitrogen, available phosphorus, available potassium, soil pH, electrical conductivity) to soil organic carbon storage (SOCS), and (b) the relative contribution of SOCS, physical indicators, and chemical indicators to SWS.
Forests 14 00221 g006
Table 1. Basic information of sample plot.
Sample NumberPlot TypeAltitude (m)Slope Gradient (°)Slope AspectVegetation Coverage (%)Land Preparation MethodAge of the Plantation (a)Abandoned Years (a)
1JL8360Shady 40Level terrace306
2JU86025Shady43Undisturbed slope306
3AL9000Shady50Level terrace306
4AU90328Shady52Undisturbed slope306
5GL9050Shady82Level terrace 6
6GU90430Shady80Undisturbed slope 6
Notes: JL, JU, AL, AU, GL, GU represent jujube tree (level terrace), jujube tree (undisturbed slope), apple tree (level terrace), apple tree (undisturbed slope), grassland (level terrace), grassland (undisturbed slope).
Table 2. RMSEs of SOCS and SWS of different vegetation types.
Soil Depth (cm)JLJUALAUGLGU
0–200.09000.040.090.56
20–400.250.310.050.550.770.60
40–600.220.220.230.50.640.19
60–800.220.210.210.460.530.16
80–1000.190.180.210.420.460.14
100–1200.170.270.220.380.460.21
120–1400.160.320.270.350.420.19
140–1600.150.310.250.320.390.18
160–1800.140.290.230.30.370.26
180–2000.150.280.220.290.350.26
200–2200.140.260.210.270.350.31
220–2400.140.250.210.260.330.32
240–2600.130.240.200.260.320.35
260–2800.130.240.190.260.310.33
280–3000.130.230.190.250.300.33
300–3200.130.230.180.250.300.32
320–3400.120.220.180.240.300.31
average0.160.240.190.320.390.30
Notes: JL, JU, AL, AU, GL, GU represent jujube tree (level terrace), jujube tree (undisturbed slope), apple tree (level terrace), apple tree (undisturbed slope), grassland (Level terrace), grassland (undisturbed slope). SOCS, SWS, and RMSE represent soil organic carbon storage, soil water storage, and root mean square error, respectively.
Disclaimer/Publisher’s Note: The statements, opinions and data contained in all publications are solely those of the individual author(s) and contributor(s) and not of MDPI and/or the editor(s). MDPI and/or the editor(s) disclaim responsibility for any injury to people or property resulting from any ideas, methods, instructions or products referred to in the content.

