Abstract
The policy of payments for environmental services is implemented in public policies in Brazil, and there are many efforts to increase projects that subsidize rural producers, combining payments with incentives for good agricultural practices that promote these services. Thinking about ways to add these values in projects to restore degraded areas is an opportunity to generate monetary benefits for producers and attractiveness for stakeholders, aiming to increase investments in projects of this nature and gain scale in the restoration of these areas. In this way, this study evaluated the financial viability of a project to implement 16.9 hectares of agroforestry systems in agrarian reform settlements located in the Descoberto HydrographicBasin near Brasília, Federal District, and the proposition of a scenario of payment for environmental services associated with adoption of this agricultural practice by producers. The results were promising for both investors and farmers, as demonstrated by the financial analysis criteria (NPV: USD 63,097.49, IRR: 71%, simple payback: 3 years). The PES scenario was even more attractive, proving to be an encouraging increase for the adoption of this practice by producers.
1. Introduction
Soil management, along with declines in its quality and productivity due to natural factors or human activity, hashad negative impacts on food production, provision of ecosystem services, and livelihoods on a global scale [1]. By 2030, demand for food is expected to increase by at least 50%, requiring the conservation and restoration of agricultural land productivity. It is estimated that an increase of between 46% and 70% in agricultural productivity will be necessary by 2050 to combat hunger and food insecurity [2,3].
In Brazil, agroforestry systems have assumed the role of uniting agricultural production with various ecosystem services, such as carbon sequestration, increase in water stock and quality, soil conservation, and reduction of erosion, in addition to increasing the biodiversity of productive systems, complementing government policies that aim to encourage socioeconomic development in the context of environmental protection and sustainability [4,5].
According to the Millennium Ecosystem Assessment [6], ecosystem services are defined as the benefits that human beings obtain from ecosystems. Ecosystems, in turn, are defined as a set of living beings and abiotic factors and their interrelationships [7]. In this context, there is much talk about paying for these services, to compensate the maintainers of these areas, encouraging appropriate management and consequently the conservation of biodiversity.
Payment for Environmental Services (PES) is a market-based conservation financing mechanism that is guided by the principles of user-pays and provider–receiver [8,9,10,11,12]. In practice, those who benefit from environmental services must bear the costs associated with these services. On the other hand, those who contribute to the generation of these services, such as land users who conserve their resources, must be compensated for conserving and making them available for the good of society at large.
In January 2021 in Brazil, the concept of Payment for Environmental Services (PES) was formally established with the promulgation of Law N° 14,119/2021, which constitutes the National Policy for Payment for Environmental Services (NPPES) and the Federal Program for Payment for Environmental Services (FPPES). The new law was created with the aim of providing standardized national guidelines to meet the demand for more comprehensive guidance and regulations under the PES.
Searching for appropriate practices that can contribute to the application of this policy is a necessity, and much has been seen in the development of techniques and projects in the rural context that combine production with conservation, such as agroforestry systems. This agricultural practice aims to restore ecosystem functions, producing, in addition to goods such as forestry and agricultural products from the species used, services for the environment. The use of this technique has increased significantly in Brazil, in large part by family farmers who have been using its principles on their properties since the 1980s [13].
The use of agroforestry systems as a technique for conserving natural resources has been introduced in the context of socio-environmental projects by several institutions, NGOs, and governments around the world, as they aim to propose measures for the environmental restoration of properties with environmental liabilities in degraded areas. These systems are said to offer the opportunity to increase income and generate attractive revenues for the producer [14,15,16] when analyzing theirfinancial viability.
One of the bottlenecks for the adoption of agroforestry systems by farmers and stakeholders, with a view to the massive expansion of agroforests, is the lack of investment inlarge-scale production. Considering ways of attracting investment by both parties so that it is scalable at the level of rural development projects is a difficult task, but is extremely important, since Brazil has objectives of increasing the restoration of degraded areas due to international agreements that include financial resources for the restoration of these areas.
The financial viability of projects using large-scale agroforestry systems is little studied, with studies being more common in small areas and never at the level of larger projects. Thus, the objective of this study was to financially evaluate an agroforestry project in which 16.9 hectares were implemented in the Descoberto Hydrographic Basin, also estimating, through the methodological proposal for the valuation of environmental services for soil conservation, an amount paid to the farmers who adopted the technique on their properties.
2. Materials and Methods
2.1. Description of the Study Area
The Rio Descoberto Hydrographic Basin (BHRD) covers an area of 895.9 km2, extending between latitudes 15°36′00″ S and 16°05′00″ S, and longitudes 48°18′00″ W and 48°06′00″ W, located in the western portion of the Federal District (DF) (Figure 1). The area covered by the Descoberto Reservoir encompasses approximately 437 km2, of which around 70% are in the Federal District and the other 30% in the State of Goiás, in the municipalities of Águas Lindas and Padre Bernardo.
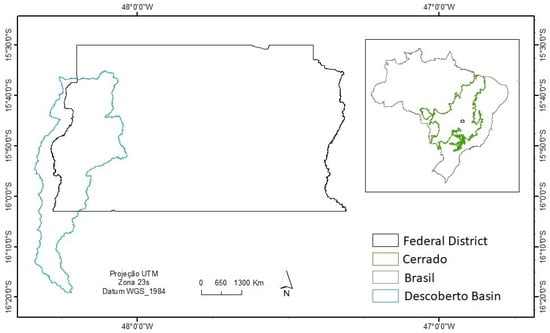
Figure 1.
Location of the study area. Source: prepared by the authors.
Within the area belonging to the Federal District, the management of water resources is the responsibility of the Water, Energy and Basic Sanitation Regulatory Agency of the Federal District (ADASA) and six sub-basins are adopted as the most representative for the flow of water towards to the reservoir. These sub-basins are: Chapadinha, Rio Descoberto, Olaria, Ribeirão Redeador, Capão Comprido, and Ribeirão Pedras [17]. It plays a fundamental role in supplying approximately 66% of the water consumed in the Federal District, holding the largest water reservoir of the Federal District [18].
The characteristic climate, according to [19], is tropical, with a cold and dry season (winter) and a hot and rainy season (summer). According to the Köppen classification, the climate is tropical (Aw) and high-altitude tropical (Cwa, Cwb). The Aw climate type is predominant in areas with altitudes below 1000 m, covering the basins of the São Bartolomeu, Preto, Descoberto, and Maranhão rivers.
The average temperature in the coldest month is 18 °C. The Cwa climate type is predominant in areas with altitudes between 1000 m and 1200 m. The average temperature in the hottest month is below 22 degrees. Type Cwb occurs in areas above 1200 m. Precipitation varies between 1500 mm and 2000 mm annually, with an average of around 1600 mm. The month of January records the highest rainfall, reaching around 320 mm, while in the months of June, July, and August, the total monthly average is approximately 50 mm [19].
2.2. Agroforestry Systems
The agroforestry systems evaluated were implemented within the scope of the GEF project—CITinova Project—Integrated Planning and Technologies for Sustainable Cities, developed by the Federal District’s Environment Secretariat, together with local NGOs and financed by the Global Fund for the Environment (GEF). With national coverage and specific activities in Recife and Brasília, CITinova is a multilateral project, carried out by the Ministry of Science, Technology, Innovations and Communications (MSTIC), with financing from the Global Fund for the Environment (GEF), managed by the UN Environment Program, and executed by co-executing institutions. The main objectives are to develop innovative technological solutions and offer integrated urban planning methodologies and tools to support public managers, encourage social participation, and promote fairer and more sustainable cities.
The project included the planting of a total area of 16.9 hectares of agroforestry systems in areas characterized as degraded. There are 22 producer beneficiaries, the majority of whom are settled under the agrarian reform of the Landless Movement (MST) settlements located in the river basin. Agrarian reform movements have been widely recognized in the last decade as a way of generating work and income for the less-favored classes, and a way of promoting food security not only in the countryside, but also in urban centers.
2.3. Agroforestry Arrangements
The project’s agroforestry model was composed of interspersed species with regular distribution per unit area, with a general spacing of 1.5 m, 3 m, and 6 m between plants and 8 m between lines (Figure 2). The planted plots were of 3 sizes (1 ha, 5000 m2, or 2500 m2) depending on the producer’s availability of land and labor, occupying a total basin area equivalent to 16.9 ha. The agroforestry model was composed of several commercial fruit trees (Table 1), interspersing tree beds (timber/fertilizer trees, banana trees, fruit trees, and annual crops) with different plantings between these lines of trees, which could be vegetables (for self-sustenance and farmers’ income), production of green manure (brachiaria grass or mombaça), or annual crops (“roça”: cassava, beans, corn). In addition to these species, eucalyptus entered the system together with mutamba (Guazuma ulmifolia) to supply organic matter and, in the future, wood.
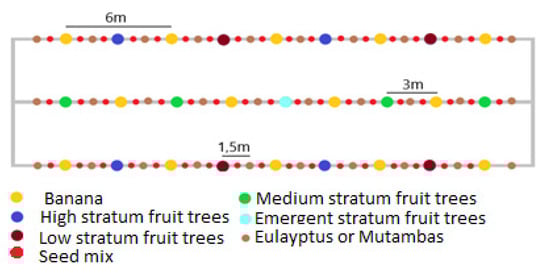
Figure 2.
Reference sketch used in the planning of agroforestry systems.

Table 1.
Relationship between fruit species and strata.
Fruit species (Table 1) are income alternatives in the medium and long terms, as they have greater added value than other species, such as banana or cassava. The latter are suggested for the plansfor the initial years 1 and 2, in addition to the vegetables planted by farmers, being the system that best optimizes the area with the diversity of crops. The project outlined agroforestry systems with the participation of farmers, seeking to form consortia with the same species.
The agroforestry system presented was guided in accordance with [20]. It followed the premises in which the plantations aim to market and contribute to food security, using available production technologies and without the use of fire, thus being able to develop the productive potential of the selected species. Furthermore, according to the authors, to create the database for financial analysis, it was necessary to plan the system based on the identification of the technical coefficients of the species used, with the aim of making decisions regarding the investment.
2.4. Data Collect
2.4.1. Costs and Revenue
Data collection was based on monitoring the amounts spent throughout the implementation and development of the project that lasted 2 years. These data were organized into electronic spreadsheets in Microsoft Excel®. All costs were accounted for: the labor of technicians and managers, inputs, tools, safety materials, fuel for take-offs, and freight, leaving out the cost of land.
Revenue values for the first two years were obtained by averaging the revenues of the 22 project beneficiaries, through periodic interviews with farmers throughout the evaluated period. And for future revenues, a projection of the productivity of the planted species was carried out over a 10-year time horizon usinga bibliographic review and the market value of the products that could be sold over that time. A loss rate of 10% in total productivity was attributed to losses in seedlings that may occur over time.
Future costs and revenues were corrected for the year 2023 using the General Price Index (IGPDI).
2.4.2. Financial Analysis
The financial analysis methodology was applied to the total area planted in the project (16.9 hectares), to analyze whether the return from agroforestry systems could remunerate the capital invested in the project.
The analysis of financial viability considered the calculations of costs and revenues for implementing the project. The data and calculations were processed in Microsoft Excel software version 2007, and based on the operating cash flow (OCF) values it was possible to calculate the economic-financial viability indicators.
2.4.3. Net Present Value—NPV
The economic viability of a project, assessed using the net present value (NPV), is determined by the positive difference between updated revenues and costs, considering a certain discount rate [21,22].
where:
- Rj = revenue in period j;
- Cj = costs in period j;
- i = discount rate;
- j = period of occurrence of Rj and Cj; and
- n = project duration, in years, or number of time periods.
2.4.4. Benefit/Cost Ratio—B/C
This method consists of calculating the relationship between the present value of benefits and the present value of costs, using a certain interest or discount rate (Equation (2)).
where:
- Rj = revenue at the end of year j;
- Cj = cost at the end of year j; and
- n = project duration, in years.
A project is considered economically viable when the B/C (benefits/costs) ratio is greater than 1. When there is a comparison between two or more projects, the one with the highest B/C value is considered more viable, as mentioned by [21]. In the case where B/C equals 1, the net present value (NPV) of B/C equals 0. In this scenario, the internal rate of return (IRR) associated with a project can also be determined as the rate thatmakes B/C equal to 1.
2.4.5. Internal Rate of Return—IRR
The internal rate of return (IRR) is the discount rate that makes the present value of future revenues equal to the present value of the project’s future costs. It represents a relative measure that reflects the growth in the value of the investment over time, considering the resources necessary to generate the revenue flow, as mentioned by [21,22].
where:
- IRR = internal rate of return;
- NPV = net present value;
- n = number of periods;
- FC = cash flow.
In this financial analysis, as advised by [23,24], the application of real discount rates of 6% per year (i = 6% p.a.) was considered.
2.4.6. Payback Simple
The payback method verifies the period necessary for total revenues to equal total costs, representing the return on capital. This approach does not consider the variation in capital over time. It is easy to apply and is recommended for projects with high risk involved [22].
A project is considered economically viable when the payback period is shorter than the established planning horizon. The best project is the one with the shortest payback period, indicating a faster return on the initial investment [22].
The interest rate used, considered as an opportunity cost to compensate for the invested capital, was 5% per year, which is the rate adopted by the National Program for Strengthening Family Agriculture (PRONAF).
2.4.7. Valuation of Environmental Services
The valuation of environmental services is important for implementing public policies that encourage the conservation of natural resources. As it cannot be carried out in a trivial way, it is essential to obtain metrics for its evaluation in qualitative and quantitative terms and touse methods for valuing the indices arising from these metrics.
Many authors detailed that developing these methods is not always an easy task [20,25,26] and many parameters must be taken into account, such as availability of resources for payment, the techniques applied, the sizes of the areas that must be considered for the application of the techniques, which in turn impact in the area, the scale of the project and how the benefits can be measured at the landscape level, and finally and perhaps most importantly, what service is intended to be generated with the use of a given technique.
Therefore, the present study analyzed the different forms of valuation for payment of environmental services implemented in projects in Brazil, evaluating their components, metrics, and values that gave rise to government programs to encourage conservation techniques [9,20,26,27]. In the context of this study, the methodology of the Water Producer program [18], described below, was used, as it is a method that is based on soil conservation.
2.4.8. Estimation of Erosion and Sedimentation Abatement
The environmental service evaluated was the control of erosion, and consequently sedimentation, using agroforestry systems. The estimate of soil erosion and sedimentation reduction was made using the following calculations [18].
The level of erosion A0 (ton/ha.year) was estimated at the initial stage on the land, that is, before the implementation of agroforestry systems. The same estimate was made after the implementation of the conservation project, obtaining A1.
Thus, the percentage of erosion and sedimentation reduction (P.E.R) obtained with the use of agroforestry, on each property, was given by the following equation:
where:
- P.E.R. (%) is the percentage of erosion and sedimentation reduction;
- (ton/ha.year) is the level of erosion before the implementation of agroforests;
- (ton/ha.year) is the level of erosion after the implementation of agroforests.
However, as advised by [18], the quantification of average erosion values measured in the conditions before the project and after its implementation, that is, A0 and A1, requires the application of erosion-prediction models. Thus, the authors suggest the use of the universal soil loss equation (USLE), as it presents the availability of local data and parameters, the accuracy of predictions, and the robustness of the model and its ease of use, giving USLE the necessary criteria for proper model selection. The USLE, in turn, is given by the following equation [28]:
where:
- A (ton/ha·year) is the average annual soil loss on the plot of interest;
- R (MJ mm/ha h) is the erosivity of rain and runoff;
- K (t·ha·h/ha·MJ·mm) is the erodibility of the soil;
- L (dimensionless) is the ramp length factor;
- S (dimensionless) is the slope factor of the ramp;
- C (dimensionless) is the soil use and management factor; and
- P (dimensionless) is the conservation practices factor.
As guided in the methodological proposal, due to the evaluated areas being in the same region, where their biophysical conditions are similar, we can consider the parameters R, K, L, and S to be constant before and after the project, which allows them to be canceled. The methodology proposes that the product of C∗P is equal to Z; thus, after dividing the soil loss under the proposed condition (A1) by the loss in the initial condition (A0), and canceling the common terms in Equation (7), we have:
Substituting Equation (7) into Equation (5), we finally have:
The method proposal is based on the advantage of this simplification, where knowing only two of the six original factors (C and P) of the USLE, it becomes possible to calculate the reduction in soil loss, in relation to the initial situation, without loss of generality or model robustness [18]. According to the authors, a complication in using this formula would be if there was the introduction of level terracing, which is a practice used to combat erosion based on the construction of terraces that aims to regulate the volume of rainwater runoff, which would change the L and S factors. However, this was not the case in our study areas.
To determine the Z values, we chose to use Table 2, proposed in [18], as it is already being applied in payment projects for environmental services within the scope of the Federal District.
Table 2.
Z values for conventional (Z0) and conservation (Z1) uses and management.
As the land uses on the land that the study evaluated were under degraded pastures, to calculate the erosion reduction, we used factor number 7 (degraded pasture) for the value of Z0 and, due to the high density of plants in the systems implemented agroforestry, to obtain the Z1 value, the reference values of items 36 (fruitculture and agroforestry) and 37 (reforestation and eucalyptus) were added together.
2.4.9. Estimation of Financial Incentive Values for Participating Producers
Obtaining the P.E.R. value (Equation (8) and Table 2) for agroforests, we created an index with percentage values for reducing erosion (Table 3) as proposed in the methodology of [18]. In this project, as the majority of agroforests are composed of fruit trees, we validated the index in addition to the mix of species used, which we considered to be of medium density. The idea of Table 3 is that agroforests added to other conservation practices in Table 2 can obtain values above 75%, agroforests with fruit trees and medium density follow values (CTInova Project) between 50 and 75%, and simpler and less dense agroforests have values below 50%.
Table 3.
Table of indices for valuing payment for environmental services related to soil conservation.
The method usedto value these indices was through one of the methodologies for valuing environmental services proposed by thereplacement cost method in [29]. This method assigns a value to certain environmental services that previously existed or may be provided in the future, according to the market price for the restoration and/or replacement of that good, which in turn generates an environmental service and in the case of this study are agroforestry systems. In this study, a cost table was organized with the values for implementing an area of one hectare of agroforestry (Table 4). Input values were obtained using average market prices.
Table 4.
Cost of implementing a hectare of agroforestry.
The table indicates the cost per hectare of an agroforestry system implemented using family labor, using a tractor only for the initial harrowing of the area.
2.4.10. Payment Values for Environmental Services
The values referring to the payment for the environmental service were calculated by multiplying the reference index of the percentage reduction in erosion that the agroforestry can provide in the control (Table 3), obtained by calculating the P.A.E., by the value of the cost of inputs for the planting of a one-hectare area of agroforestry (Table 4). The value of this multiplication was divided by 12 months since the payment proposal is monthly.
Based on this criterion, incentive payment values (IPV) were defined as shown in Table 5.
Table 5.
Suggested values for incentive payments (IPV), depending on erosion abatement percentage (EAP).
3. Results and Discussion
The agroforestry systems implemented by the GEF’s CITinova Project played afundamental role in increasing the income of the producers and of the basin, making it a financially viable project in the time horizon of 10 years. The results of the financial indicators obtained in the analysis of the study (NPV, IRR, payback) (Table 6) demonstrated positive values, validating the practice of this technique of recomposition of degraded areas in the Descoberto Basin.
Table 6.
Financial viability indicators of the project.
The NPV representing the net values updated at the initial moment, based on a cash flow formed by a series of revenues and costs, discounting the initial project investment, was USD 63,097.49. The authors of [21] state that the project is viable when the NPV exceeds 1. The examples in the following discussion show large fluctuations in the NPV of agroforestry projects.
The internal rate of return found was 71%, and the payback is 3 years, confirming that the arrangement of the agroforestry system proposed by the technicians of the project implemented in the Descoberto Basin was applied well to the context and reality of the beneficiaries.
Studies confirm the viability of agroforestry systems, such as that of [20], which foundanIRR of 30.6% in equal periods of ten years. The NPV was USD 20,372.75 in their analyses, much lower than in this study. This is related to the difference in the species used in the composition of the systems. In the case of these authors, vegetables were not used, which provided products with greater added value than grains and return in the first few months.
Analyses such as [30] identified an NPV of USD 1,533,261.01/ha in systems similar to our project but analyzed with different periods. In a recent study, ref. [31] found an NPV of USD 52,941.09/ha for AFS composed of annual crops and vegetables in the Cerrado. Ref. [32], evaluating two AFS models in the Brazilian Midwest, obtained anet present value of the analyzed AFS 1 of USD 11,018.24/ha, and the AFS 2 was USD 40,377.04/ha.
The payback criterion study by [32] demonstrated a longer return on invested capital than in our analyses, with theirs being 9 and 10 years for each AFS analyzed. It is known that the production of vegetables in the first periods confers on agroforestry production the return on invested capital in the first months [30].
Comparing the NPV, IRR, and payback parameters with other studies is not always a practice adopted by researchers, since agroforestry arrangements are very diverse in species composition, and consequently different harvest times, resulting in different revenues and costs throughout the year. Therefore, the information presented must be considered for the evaluation of projects considering the criteria established in their theories, as described in the methodology, translating the financial dynamics of the production system over the planned time and return on invested capital.
According to estimates of eucalyptus production in the project, around 7750 seedlings were planted, that is, approximately 8 hectares were planted, with a spacing of 3.5 × 3.0 to 3.5 m between roads × 3.0 m between plants, meaning that around 2217 m3 would be produced in the first cycle and 1940 m3 in the second cycle, already considering a loss of 1% of seedlings [33]. According to the average price of m3 of eucalyptus in 2023 (USD 12.89/m3), the project would be able to financially return USD 28,589.96 in the first cycle, and USD 25,017.83 in the second cycle if it were not replaced by more profitable species after the 10-year project duration.On average, productivity per hectare would be in the order of USD 3537.74/ha·year and USD 3127.22/ha·year, in the first and second cycles, respectively.
Wood production offers long-term returns and self-sufficiency for building infrastructure on the property. The use of eucalyptus in agroforestry systems is a widespread practice, since its rapid growth and production of leaf biomass provide material for soil cover and short-cycle forestry products, which can be used from year 5 of the agroforestry project [34,35]. Planting eucalyptus on the boundaries of properties and crops also serves as a windbreak, reducing the risk of damage by pests or the effects of strong winds.
The average monthly income from the sale of products harvested in agroforestry systems in the first two years of the project varied between USD 320.00/ha/month and USD 390.00/ha/month in the first two years of the project.Interviews with farmers regarding monthly income showedthat 80% of farmers benefiting from the project obtained their income only from these plantations, and previously made a living as service providers in the city.The use of the agroforestry systems technique is thus proven as a way of producing income for rural families, making it possible forpeopleto remain in the field and work within the family. In 70% of the interviews, the labor used on the properties wasbasically family, where children, fathers, and mothers worked together.
The P.E.R value obtained with the Water Producer Program methodology was 60%. This value characterized the agroforestry of the CTInova Project as an average contribution to the percentage of erosion reduction. The monetary value of the PSA found with the replacement cost methodology was USD 3211.22/ha/year, or USD 267.60/ha/month, already updated for the year 2023. We opted for the replacement cost method because we believe it is possible to achieve real and attractive values so that the beneficiary, upon receiving the incentive, can apply it to the expansion of plantations, which will consequently allow them to receive the benefit again by increasing their areas, generating chain processes in increasing revegetated areas, and offer ecosystem services, expanding plantations and services. Furthermore, increased plantations result in increased production revenues if designed and managed well over time.
In the first two years, the value of the PES paid to farmers wasequivalent to the revenue from the sale of agroforestry products (Figure 3).
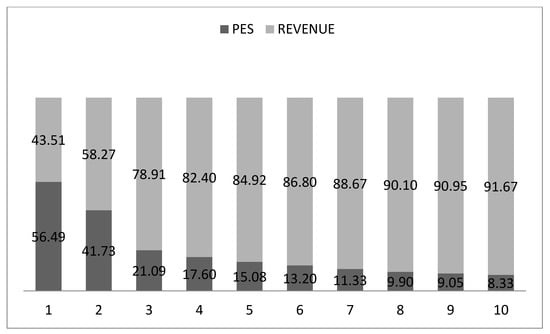
Figure 3.
Annual percentage of the contribution of payment for invironmental services to producers’ revenues.
This value represents an important subsidy for maintaining farmers’ family income, since in the first year of production, costs are greater than revenues (Figure 4).
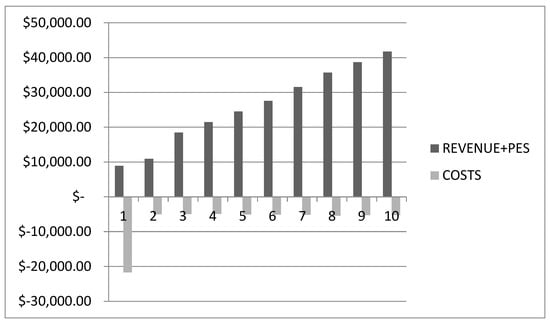
Figure 4.
Annual revenue with the addition of payments for environmental services and annual costs.
In general, the study found a much higher value when compared to PES values from other studies. The value of PES in the Riparian Forest Program of the São Paulo State Secretariat for the Environment, in conjunction with the National Water Agency, estimated, based on the average costs of soil conservation practices, that the value of the control ecosystem service of erosion was up to USD 64.72/ha/yearalready with updated values for 2023 [9]. Another study carried out by [9] using the same methodology as this study found values around USD 67.31/ha/year in the Manancial Vivo Program, in the Guariroba river basin, located in Campo Grande in the state of Mato Grasso do Sul.
This value represented a portion of the financial benefit that producers would have when using agroforestry systems to restore degraded areas, increasing their income due to the conservation/ecological management of the soil in these areas. The chosen method proved to be efficient in obtaining real values to pay for ecosystem services in the basin.
The comparison of values between PES implemented in Brazil demonstrates that public policies surrounding incentives for the implementation of good agricultural practices favor large landowners, since the amounts paid are small and to obtain a satisfactory benefit it is necessary to grid areas. The current study is a proposal for payment policies for environmental services to be reviewed and reformulated, thus making the scenario more favorable to family farmers who own small areas (up to fourfiscal modules) and contribute to food production and maintenance of biodiversity, services that are important for the well-being of society.
The advantages of using the reduction of erosion within the property as an indicator of the basin’s ecosystem services are many, since its application uses only parameters related to land use before the project and after its implementation. This considerably facilitates the estimation of the environmental benefit generated by the practice adopted, using already established metrics.
The economic valuation of environmental resources raises the question of which method is most appropriate. This concern is expected, as there is no consensus regarding the methodologies used and their effectiveness in achieving the intended objective. Assessment methods can be classified as direct and indirect, using techniques that allow assigning a monetary value to the assessed environmental goods and services [36].
Ecological economics involve assigning monetary values to services provided by the environment and environmental losses, aiming to correct externalities and address flaws in macroeconomic accounting [37]. The economic value of a good (service) is constituted by the interaction of the perceptions of all subjects considering its utility, whether they are consumers or producers, determining prices as markers of this utility, resulting from the offer and demand for the goods and equilibrium quantities [38].
One of the challenges faced in payment for environmental services (PES) policies is the difficulty of capturing all the environmental benefits offered, since market mechanisms often do not reflect the full value of these benefits [38]. It is difficult to quantify the value of the clean air we breathe or the clean water we drink, since their value is intrinsically linked to their availability in nature.
The adequacy of payments for ecosystem services (PES) offers a warning to think about the real reliability of payments for these services as an efficient conservation tool [39]. The authorsmake the criticism that declared “win–win” interventions commonly fail, being based on weak and often imaginary assumptions.
Some authors criticize PES as a policy where some environmental results are achieved, while any impacts of poverty reduction are beneficial effects of a transversal nature, not being the main focus [10,11]. Thus, the authors of [40] advise that in PES formulation, it is necessary to consider situations where it is possible to achieve an objective, safeguarding that others’ situations are not worsened by it.
The authors in [11] comment that while producer-funded PES programs focus on their environmental objectives, government-funded programs are often politically oriented towards win–win spheres of multiple cross-cutting objectives, such as poverty reduction, regional development, or electoral reasons.
The case presented in this work represent the action of the Federal District government in prioritizing conservation actions in areas of interest that safeguard the availability of water resources in Brasília and neighboring cities. These areas are characterized as rural areas that most often have the presence of agrarian reform settlements, resulting in practices that also favor food security, poverty eradication, and job and income generation in the basin.
In general, it is possible to identify other gains in addition to economic ones when we analyze projects that combine conservation practices in river basins through the encouragement of sustainable production and payment for environmental services. These gains are then associated with the sustainable development of the entire area covered by the project, where different organizations are mobilized for execution, offering technical assistance, research, and a more accurate look at local needs by the technicians and researchers involved in the project.
Examples such as the project evaluated in the study should serve as a model for the advancement of public policies for the conservation of river basins, as they shelter, in addition to ahigh diversity of natural resources such as water and biodiversity, the human component, which in turn can organize the occupation of the landscape, ensuring the good management of the resources necessary for life. If, on the one hand, PES is the incentive for producers to adopt sustainable agricultural practices, agroforestry systems stand out as the practice that combines the requirements for gaining the incentive, combining conservation with economic return.
4. Conclusions
The study found that the useof the policy of payments for environmental services, combined with good agricultural practices with the use of agroforestry systems, can present a possibility in the construction of watershed conservation projects.
Financial feasibility analyses demonstrated that the project is viable, thus opening an opportunity for investors and organizations to increasingly adopt practices of this type in their projects.
Agroforestry arrangements also proved to be viable for producers, offering satisfactory income for rural communities that, for the most part, have restricted access to income and work in the city.
The methodology used to value the PES validated the practice of agroforestry in reducing erosion processes in the basin, allowing its use by technicians from inspection organizations.
Finally, thinking about payments for those who adopt good production practices can be a reality, since public policies are already moving in this direction. This study refers to a pilot project that can be replicated by organizations in the construction of their actions, joining efforts between government, organizations, and rural producers towards a common objective, the defense and conservation of biodiversity.
Author Contributions
Conceptualization: L.F.d.D., Á.N.d.S. and J.F.R.; Methodology: L.F.d.D., Á.N.d.S., M.S.J. and J.B.C.N.A.; Software: L.F.d.D.and P.P.d.S.; Validation: M.S.J. and P.P.d.S.; Formal analysis: L.F.d.D. and J.B.C.N.A.; Investigation: L.F.d.D.; Resources: L.F.d.D.; Data curation: L.F.d.D.; Writing—original draft preparation: L.F.d.D., M.S.J., Á.N.d.S. and L.M.C.J.; Writing—review and editing: L.F.d.D. and M.d.F.d.B.L.; Visualization: L.F.d.D., M.d.F.d.B.L. and Á.N.d.S.; Supervision: L.F.d.D., M.d.F.d.B.L., Á.N.d.S. and J.F.R.; Project administration: L.F.d.D.; Funding acquisition: Á.N.d.S. and M.S.J. All authors have read and agreed to the published version of the manuscript.
Funding
The financing was provided by Capes through the doctoral scholarship. The Coordination for the Improvement of Higher Education Personnel (CAPES) is a foundation linked to the Brazilian Ministry of Education (MEC) that works to expand and consolidate stricto sensu postgraduate studies (master’s and doctorate) in all Brazilian states. Therefore, there was no other financing or financiers. And for the publication we had the assistance of the Fundação Universidade de Brasília—CNPJ: 00.038.174/0001-43.
Data Availability Statement
The data presented in this study are available upon request from the corresponding author. The data is not publicly available as it is part of author Lucas Francisco de Domincis’ doctoral thesis. They will be available at https://repositorio.unb.br/ from December.
Acknowledgments
We acknowledge the Coordenação de Aperfeiçoamento de Pessoal de Nível Superior—CAPES and the University of Brasília, Brazil for awarding scholarships to the author Lucas Francisco Dominicis and contributing authors.
Conflicts of Interest
The authors declare no conflict of interest.
References
- Brainich, A.; Erpul, G.; Huang, Y.; Roué, M.; Guan Saw, L.; Zabid Oglu Allahverdiyev, R.; Goodman Mketeni, F. The Assessment Report on Land Degradation and Restoration Summary for Policymakers. Bonn, Germany. 2018. Available online: www.ipbes.net (accessed on 23 May 2023).
- FAO. Future of Food and Agriculture—Trends and Challenges; FAO: Rome, Italy, 2017. [Google Scholar]
- Gouel, C.; Guimbard, H. Nutrition Transition and the Structure of Global Food Demand. Am. J. Agric. Econ. 2019, 101, 383–403. [Google Scholar] [CrossRef]
- Ribaski, J. As vantagens dos sistemas agroflorestais. Cultivar 2009. Available online: http://www.grupocultivar.com.br/noticias/artigo-as-vantagens-dos-sistemas-agroflorestais (accessed on 21 March 2023).
- Gnonlonfoun, I.; Assogbadjo, A.; Gnanglè, C. Novos indicadores de vulnerabilidade e resiliência dos sistemas agroflorestais às alterações climáticas na África Ocidental. Agro Sustentar. 2019, 39, 23. [Google Scholar] [CrossRef]
- Mea, M.E.A. Ecosystem and Human WellBeing: Synthesis; Island Press: Washington, DC, USA, 2005. [Google Scholar]
- Odum, E.; Barret, G. Fundamentos de Ecologia, 5th ed.; Cengage Learning: São Paulo, Spain, 2011. [Google Scholar]
- Wunder, S. Payments for environmental services and the poor: Concepts and preliminary evidence. Environ. Dev. Econ. 2008, 13, 279–297. [Google Scholar] [CrossRef]
- Pagiola, S.; Glehn, H.C.v.; Taffarello, D. Experiências de Pagamentos por Serviços Ambientais no Brasil; São Paulo (Estado); Secretaria do Meio Ambiente/Coordenadoria de Biodiversidade e Recursos Naturais: São Paulo, Brazil, 2013.
- Pagiola, S.; Arcenas, A.; Platais, G. Can Payments for Environmental Services Help Reduce Poverty? An Exploration of the Issues and the Evidence to Date from Latin America. World Dev. 2005, 33, 237–253. [Google Scholar] [CrossRef]
- Engel, S.; Pagiola, S.; Wunder, S. Designing payments for environmental services in theory and practice: An overview of the issues. Ecol. Econ. 2008, 65, 663–674. [Google Scholar] [CrossRef]
- Canova, M.; Lapola, D.; Pinho, P.; Dick, J.; Patrício, G.; Priess, J. Different ecosystem services, same (dis)satisfaction with compensation: A critical comparison between farmers’ perception in Scotland and Brazil. Ecosyst. Serv. 2019, 35, 164–172. [Google Scholar] [CrossRef]
- Schembergue, A.; Cunha, D.; Carlos, S.; Pires, M.; Faria, R. Sistemas Agroflorestais como Estratégia de Adaptação aos Desafios das Mudanças Climáticas no Brasil. Rev. Econ. Sociol. Rural 2017, 55, 9–30. [Google Scholar] [CrossRef]
- Arco-Verde, M.F.; Amaro, G.C. Análise Financeira de Sistemas Agroflorestais, 1st ed.; Embrapa Florestas, Embrapa Roraima: Brasilia, Brazil, 2021. [Google Scholar]
- Terasawa, V.d.P.P.; Gonçales Filho, M.; Almeida, A.P.d. Viabilidade econômico-financeira de sistema agroflorestal no Pará-Brasil: Estudo de caso em Concórdia do Pará. Res. Soc. Dev. 2022, 11, e190111032341. [Google Scholar] [CrossRef]
- Seoane, C.E.S.; Bim, O.J.B.; Lima, A.D.; Froufe, L.C.M. Restauração ecológica em sistemas agroflorestais sucessionais do Vale do Ribeira, São Paulo. Pesqui. Florest. Bras. 2023, 43, e202102179. [Google Scholar] [CrossRef]
- ADASA. Plano de Gerenciamento Integrado de Recursos Hídricos do Distrito Federal.Governo do Distrito Federal. 2018. Available online: http://www.adasa.df.gov.br/regulacao/planos (accessed on 7 May 2018).
- ADASA. Edital de Chamamento Público n° 01/2021. Pagamento por Serviços Ambientais a Produtores Rurais. Projeto Produtor de água no Pipiripau; ADASA: Brasília, Brazil, 2021. [Google Scholar]
- Martins, E.S.; Baptista, G.M.M. Compartimentação Geomorfológica do Distrito Federal. Inventário Hidrogeológico e Dos Recursos Hídricos Superficiais do DF; Embrapa Cerrados: Brasilia, Brazil, 1999. [Google Scholar]
- Arco-Verde, M.F.; Amaro, G.C. Metodologia para análise da viabilidade financeira e valorização de serviços ambientais em sistemas agroflorestais. In Serviços Ambientais em Sistemas Agrícolas e Florestais do Bioma Mata Atlântica; Parron, L.M., Garcia, J.R., Oliveira, E.B.d., Brown, G.G., Prado, R.B., Eds.; Embrapa: Brasilia, Brazil, 2015; pp. 335–346. [Google Scholar]
- Rezende, J.L.P.d. Análise Econômica e Social de Projetos Florestais, 3rd ed.; Editora UFV: Viçosa, Brazil, 2013. [Google Scholar]
- Silva, M.L.d.; Jacovine, L.A.G.; Valverde, S.R. Economia Florestal; Editora UFV: Viçosa, Brazil, 2005; 178p. [Google Scholar]
- Oliveira, S.J.d.M.; Vosti, S.A. Aspectos Econômicos de Sistemas Agroflorestais em Ouro Preto do Oeste, Rondônia, 1st ed.; EMBRAPA-CPAF: Rondônia, Porto Velho, Brazil, 1997. [Google Scholar]
- Sá, C.P.d.; Santos, J.C.d.; Bergo, C.L.; Nascimento, G.C.d.; Gomes, F.C.d.R. Coeficientes Técnicos e Custo de Implantação da Pupunha Para Palmito no Acre; Embrapa Acre: Rio Branco, Brazil, 2001. [Google Scholar]
- Andrade, D.C. Modelagem e Valoração de Serviços Ecossistêmicos: Uma Contribuição da Economia Ecológica; Universidade Estadual de Campinas: São Paulo, Brazil, 2010. [Google Scholar] [CrossRef]
- Tôsto, S.; Belarmino, L.; Romeiro, A.; Rodrigues, C. Valoração de Serviços Ecossistêmicos: Metodologias e Estudos de Caso; Embrapa Monitoramento por Satélite: Brasília, Brazil, 2015. [Google Scholar]
- Chaves, H.M.; Braga, B.; Domingues, A.; Santos, D. Quantificação dos Benefícios Ambientais e Compensações Financeiras do “Programa do Produtor de Água”. Rev. Bras. Recur. Hidr. 2004, 9, 5–21. [Google Scholar]
- Wischmeier, W.H. Use and misuse of the Universal Soil Loss Equation. J. Soil Water Conserv. 1976, 31, 5–9. [Google Scholar]
- Nogueira, J.; Medeiros, M.; Arruda, F. Valoração Econômica do Meio Ambiente: Ciência ou Empiricismo? Cadernos de Ciência e Tecnologia: Brasília, Brazil, 2000; pp. 81–115. [Google Scholar]
- Araújo, J.B.C.N. Análise Financeira e de Custos de um Sistema Agroflorestal Sucessional: Estudo de Caso no Distrito Federal; Universidade de Brasília: Brasilia, Brazil, 2017. [Google Scholar]
- Costa, E.A.; Junqueira, A.M.R.; Leite, E.J.; Souza, Á.N. Financial analysis of grains and vegetables in succession under an organic agroforestry system. Peer Rev. 2023, 5, 152–169. [Google Scholar] [CrossRef]
- Garcia, L.T.; Paulus, L.A.R.; Fernandes, S.S.L.; Arco-Verde, M.F.; Padovan, M.P.; Pereira, Z.V. Viabilidade financeira de sistemas agroflorestais biodiversos no Centro Oeste Brasileiro. Res. Soc. Dev. 2021, 10, e47210413682. [Google Scholar] [CrossRef]
- Santarosa, E.; Penteado Júnior, J.F.; Goulart, I.C.G.d.R. Transferência de Tecnologia Florestal: Cultivo de Eucalipto em Propriedades Rurais: Diversificação da Produção e Renda; Embrapa Florestas: Colombo, Brazil, 2014. [Google Scholar]
- Miccolis, A.; Peneireiro, F.M.; Marques, H.R.; Vieira, D.L.M.; Arco-Verde, M.F.; Hoffmann, M.R.; Rehder, T.; Pereira, A.V.B. Restauração Ecológica Com Sistemas Agroflorestais: Como Conciliar Conservação Com Produção: Opções Para Cerrado e Caatinga; Instituto Sociedade, População e Natureza—ISPN/Centro Internacional de Pesquisa Agorflorestal—ICRAF: Brasília, Brazil, 2016. [Google Scholar]
- Corrêa Neto, N.E.; Messerschmidt, N.M.; Steenbock, W.; Monnerat, P.F. Agroflorestando o Mundo de Facão a Trator: Gerando Práxis Agroflorestal em Rede; Associação dos Agricultores Agroflorestais de Barra do Turvo e Adrianópolis, Cooperafloresta: Barra do Turvo, Brazil, 2016. [Google Scholar]
- Siqueira, C.A.; Uliana, M.R.; Arana, A.R.A. Qualidade ambiental urbana: Um estudo sobre valoração econômica de áreas verdes urbanas no parque do povo em Presidente Prudente. Rev. Adm. Ciências ContábeisSustentabilidade 2023, 13, 1. [Google Scholar]
- Pavan, B.S.; Melloni, R.; Alvarenga, M.I.N.; Ferreira, G.M.d.R. Sistema agroflorestal cafeeiro-abacateiro e seus efeitos na qualidade do solo. Rev. Bras. Geogr. Física 2018, 11, 1917–1925. [Google Scholar] [CrossRef]
- Foleto, E.M.; Leite, M.B. Perspectivas do pagamento por serviços ambientais e exemplos de caso no brasil. Rev. Estud. Ambient. 2011, 13, 6–17. [Google Scholar]
- Muradian, R.; Arsel, M.; Pellegrini, L.; Adaman, F.; Aguilar, B.; Agarwal, B.; Corbera, E.; Ezzine de Blas, D.; Farley, J.; Froger, G.; et al. Payments for ecosystem services and the fatal attraction of win-win solutions. Conserv. Lett. 2013, 6, 274–279. [Google Scholar] [CrossRef]
- Barrett, C.B.; Travis, A.J.; Dasgupta, P. On biodiversity conservation and poverty traps. Proc. Natl. Acad. Sci. USA 2011, 108, 13907–13912. [Google Scholar] [CrossRef] [PubMed]
Disclaimer/Publisher’s Note: The statements, opinions and data contained in all publications are solely those of the individual author(s) and contributor(s) and not of MDPI and/or the editor(s). MDPI and/or the editor(s) disclaim responsibility for any injury to people or property resulting from any ideas, methods, instructions or products referred to in the content. |
© 2023 by the authors. Licensee MDPI, Basel, Switzerland. This article is an open access article distributed under the terms and conditions of the Creative Commons Attribution (CC BY) license (https://creativecommons.org/licenses/by/4.0/).