Article

Effects of Intercropping between Morus alba and Nitrogen Fixing Species on Soil Microbial Community Structure and Diversity

1
College of Forestry, Shenyang Agricultural University, Shenyang 110866, China
2
Institute of Modern Agricultural Research, Dalian University, Dalian 116622, China
3
Research Station of Liaohe-River Plain Forest Ecosystem, Chinese Forest Ecosystem Research Network (CFERN), Shenyang Agricultural University, Tieling 112000, China
4
Life Science and Technology College, Dalian University, Dalian 116622, China
*
Author to whom correspondence should be addressed.
Forests 2022, 13(9), 1345; https://doi.org/10.3390/f13091345
Submission received: 30 June 2022 / Revised: 20 August 2022 / Accepted: 22 August 2022 / Published: 24 August 2022
(This article belongs to the Special Issue Chemical Ecology in Forests)

Abstract

:
The intercropping of nitrogen-fixing and non-nitrogen-fixing tree species changed the availability of soil nitrogen and soil microbial community structure and then affected the regulation process of soil carbon and nitrogen cycle by microorganisms in an artificial forest. However, there is no consensus on the effect of soil nitrogen on soil microorganisms. In this study, the intercropping of mulberry and twigs was completed through pot experiments. Total carbon, total nitrogen, and total phosphorus in the rhizosphere soil were determined, and the composition and structure of the soil microbial community were visualized by PCR amplification and 16S rRNA ITS sequencing. The analysis found that the intercropping of Morus alba L. and Lespedeza bicolor Turcz. had no significant effect on soil pH but significantly increased the contents of total carbon, total nitrogen, and total phosphorus in the soil. The effect on the alpha diversity of the bacterial community was not significant, but the effect on the evenness and diversity of the fungal community was significant (p < 0.05). It was also found that soil nutrients had no significant effect on bacterial community composition but had a significant effect on the diversity within the fungal community. This study added theoretical support for the effects of intercropping between non-nitrogen-fixing tree species and nitrogen-fixing tree species on soil nutrients and microbial community diversity.

1. Introduction

Soil microorganisms are a kind of significant link between the aboveground vegetation community and the underground ecological process [1,2]. They are involved in soil organic matter decomposition, adjusting the forest ecosystem circulation process of material circulation, and energy flow in soil. It is the most momentous driver of ecosystem function and the “engine” of soil nutrient cycling [3,4]. Changes in the utilization pattern and utilization efficiency of soil organic carbon by microbial communities may affect forest ecosystems in organic matter decomposition, the emission of greenhouse gases (CO2 and CH4), and the carbon sequestration [5]. Soil phosphorus and nitrogen are mainly in the shape of an organic state, which cannot be directly absorbed and utilized by plants. The nutrients that must be transformed, absorbed, and “temporarily” preserved by soil microorganisms are the “effective reservoirs” for plants to absorb nutrients. Soil microbial community composition (bacteria and fungi) affects soil nutrient transformation and availability [6]. The intercropping between nitrogen-fixing plants and non-nitrogen-fixing plants changes the availability of soil nitrogen and microbial community structure and then affects the regulation process of soil carbon and nitrogen cycling by artificial forest microorganisms. [7]. However, there is still no consensus on the relationship between soil nitrogen and soil microorganisms. It has been found that increasing soil nitrogen content can increase microbial biomass [8]. Some studies have also found that an increase in soil nitrogen can sometimes harm soil microbial biomass, and sometimes this impact is negligible [9,10].
Nitrogen-fixing plants remarkably increased soil organic matter and nitrogen content [11,12]. The results of Wang et al. showed that the soil organic matter and nitrogen content in the surface layer of nitrogen fixation artificial forests were 40%–50% and 20%–50% higher than that of non-nitrogen fixation plantations, respectively [13]. The increase of soil nitrogen not only affects plant growth but also changes soil physicochemical properties and affects the structure and function of soil microorganisms, thereby affecting the activity of soil enzymes and their stoichiometric ratios. Wang et al. have shown that increases in soil nitrogen (such as nitrogen addition) can change the stoichiometric ratio of soil nutrients, such as carbon to nitrogen ratio (C/N), carbon to phosphorus ratio (C/P), and nitrogen to phosphorus ratio (N/P) [14]. Using five years of nitrogen addition experiments, Zeng et al. found that nitrogen application reduced the N requirement of soil microorganisms in Phyllostachys pubescens forest [15]. However, in a three-year nitrogen addition experiment in the mid-subtropical Castanopsis carlesii natural forest, it was found that nitrogen treatment could significantly accelerate the soil C cycle [16]. In addition to directly affecting the soil due to their nitrogen-fixing ability, nitrogen-fixing plants can also affect other plants through their interaction with the soil. Nitrogen-fixing plants can provide abundantly available nitrogen for other plants through root secretion or litter decomposition [17,18,19], which in turn promotes the growth of those [20], improves productivity [21], and promotes secondary growth of vegetation [22]. They have important ecological functions in the ecosystem. The roots of nitrogen-fixing plants can coexist with nitrogen-fixing bacteria, and the nitrogen-fixing effect of nitrogen-fixing bacteria can continuously increase the content and effectiveness of soil nitrogen, thereby improving plant productivity.
The intercropping compound system is a typical resource-efficient planting model, which can not only effectively utilize resources through the complementation of species vegetative niche and spatial niche but also increase species diversity and improve soil quality, thereby achieving high yield [23,24]. Intercropping can change soil physicochemical properties, further cause changes in soil microbial communities, and affect soil health and quality [25]. Legume crops have the function of biological nitrogen fixation, which can effectively supplement nitrogen in the soil, and their advantages in intercropping with non-legume crops are very prominent. Previous studies have shown that interbreeding with nitrogen-fixing plants has positive effects on increasing soil nitrogen content and nitrogen availability [26,27], thus increasing the organic carbon storage in ecosystems [28]. More importantly, the competition of intercropping species for soil nitrogen stimulates legume crops to rely more on symbiotic nitrogen fixation, broadening the nitrogen nutrient niche and further improving the nitrogen use efficiency of the intercropping system [29,30]. Soil nitrogen and atmospheric nitrogen fastened by legume crops are the main sources of nitrogen for low-input legume and non-legume intercropping. Legume crops show strong nitrogen dominance when participating in intercropping.
Lespedeza bicolor Turcz. belongs to the legume family and is an erect shrub of the genus Lespedeza, with good resistance and strong soil adaptability, and can grow on barren, newly cultivated land. It is a common species in the habitats of different desertification ecosystems and is suitable for constructing desertification control projects [31]. It is also a typical case of nitrogen fixation plants. M. alba L., which belongs to the Moraceae, is an excellent local plant in China. It has the characteristics of strong flexibility, wide geographical distribution, a high survival rate of afforestation, and a large crown, and can be used for ecological afforestation. At present, many scholars have found that M. alba and L. bicolor belong to the legume family and are erect shrubs of the genus Lespedeza that have the same strong resistance to various adverse site environments; that is, they have excellent salinity resistance, barren resistance, and drought resistance [32,33]. This lays the foundation for the possibility and extension of the intercropping of M. alba and L. bicolor. In this study, the native tree species L. bicolor in Zhangwu County area of Liaoning Province and “Shen Sang No.1” cultivated by the Forestry College of Shenyang Agricultural University were selected for intercropping experiments to investigate the effects of introducing nitrogen-fixing plants on soil nutrients and microbial community diversity in M. alba plantations and the effects of nitrogen-fixing plants on soil nutrients and microbial community diversity in M. alba plantation. The correlation between soil nutrients and microbial community diversity after the introduction of nitrogen-fixing plants was analyzed.

2. Materials and Methods

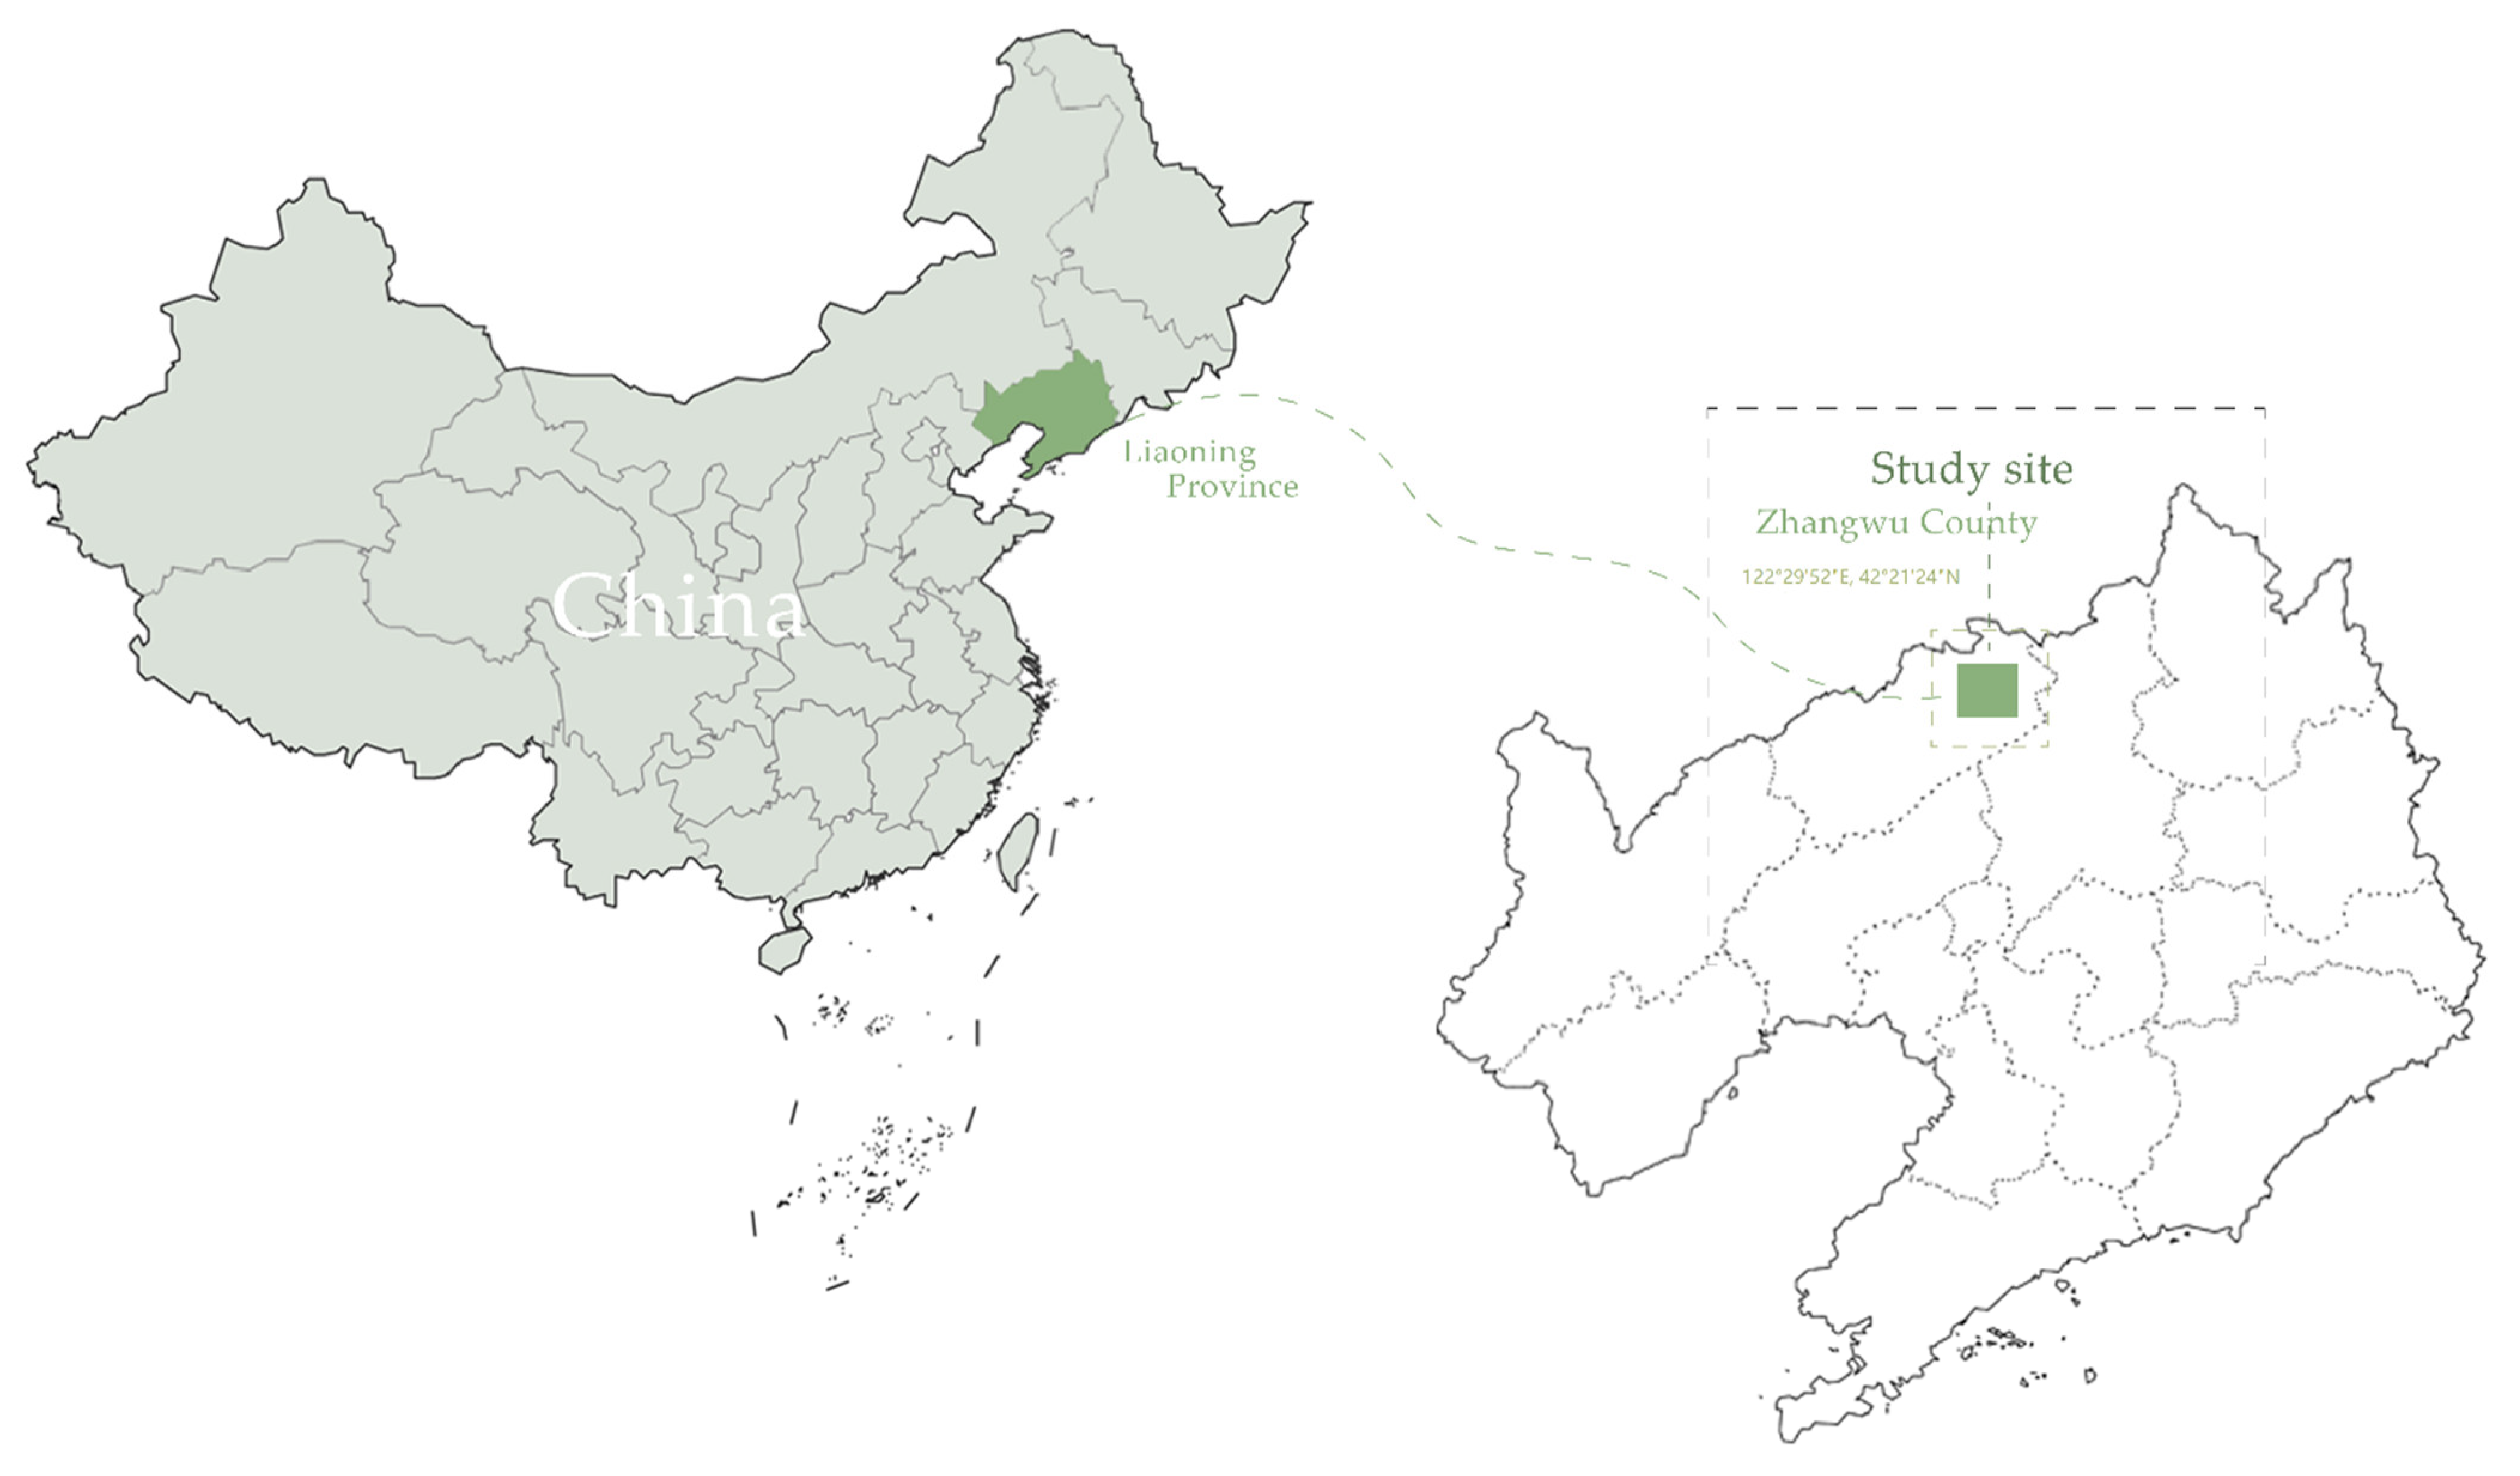
2.1. Tested Varieties and Planting Patterns

Planting experiments began in March 2021 in Zhangwu County, Fuxin City, Liaoning Province, China (122°29′52″ E, 42°21′24″ N) (Figure 1). It is located on the southern edge of the Horqin Sandy Land, which has a north temperate monsoon continental climate and is a typical sandy land in northwestern Liaoning. A total of three planting patterns were arranged in the pot experiment, namely M. alba pure planting (Ma), L. bicolor pure planting (Lb), and intercropping of M. alba-L. bicolor planting (MaLb). Pure forest samples were planted with four plants per pot, and MaLb was planted with two M. alba and two L. bicolor per pot. A total of four replicates were set up in the experiment, and each replicate was randomly placed.

2.2. Gathered Soil Samples and Admeasurement of Physicochemical Properties

The soil around the roots of each potted plant was obtained using the root shaking method. Twelve groups of samples were put into sterile ziplock bags and numbered in August 2021. They were put in an ice box and returned to the lab for further manipulation. In the laboratory, plant residues, roots, stones, and other garbage were removed from the sample, and samples were sieved by a 100-mesh (the pore size of 0.015 mm) sieve. The sieved sample was divided into two parts. A part was air-dried and stored in a refrigerator at 4 °C for the determination of soil chemical properties (total soil carbon, total nitrogen, and total phosphorus). Another part of the samples was stored in centrifuge tubes according to the numbers and stored in a −80 °C refrigerator until they were used for the determination of soil microorganisms.
The soil pH value was extracted with CO2-free water and determined by the potentiometric method (Mettler Toledo pH (FE20), and the water-soil ratio was 2.5:1. Soil total carbon and soil nitrogen contents were determined by the elemental analyzer (Elementar Vario EL III Germany). Total phosphorus in soil was determined by the molybdenum–antimony anti-colorimetric method.

2.3. DNA Extraction and Sequencing of Soil Microorganisms

The OMEGA Mag-bind Soil DNA Kit (Omega M5636-02) (Omega Bio-Tek, Norcross, GA, USA) was used to extract total DNA and based on the kit-specific extraction, procedures for each sample weighing 0.5 g sample. The quantity and quality of the extracted DNA were determined by a NanoDrop ND-1000 spectrophotometer (Thermo Fisher Scientific, Waltham, MA, USA). Primers 338F (5′-ACTCCTACGGGAGGCAGCA-3′) and 806R (5′-CGGACTACHVGGGTWTCTAAT-3′) amplified the V3-V4 region of bacterial 16S rRNA gene [34]; the fungal ITS region was amplified with primers ITS5 (5′-GGAAGTAAAAGTCGTAACAAGG-3′) and ITS2 (5′-GCTGCGTTCTTCATCGATGC-3′). 2 μL DNA template [35], 1 μL upstream and downstream primers (10 µmol/L), 5 μL buffer (×5), 5 μL Q5 high-fidelity buffer (×5), high-fidelity DNA polymerase (5 U/μL) 0.25 μL, 2 μL dNTP (2.5 mmol/L), 8.75 μL ultrapure water (ddH2O) constitute the PCR reaction system. PCR amplification was first pre-denatured at 98 °C for 2 min, then repeated 25 times in a cycle of 98 °C for 15 s, 55 °C for 30 s, and 72 °C for 30 s, and finally extended at 72 °C for 5 min. The PCR-amplified products were checked by 2% agarose gel electrophoresis. Then the target fragments were recovered by gel cutting and then by AXYGEN’s gel recovery kit with Axygen Axy Prep DNA Gel Extraction kit (AP-GX-500). The final concentrations obtained were 0.63–5.29 ng/μL for bacteria and 0.58–11 ng/μL for fungi. After the individual quantification step, amplicons were pooled in equal amounts, and pair-end 2 × 250 bp sequencing was performed using the Illumina NovaSeq platform with NovaSeq 6000 SP Reagent Kit (500 cycles) at Shanghai Personal Biotechnology Co., Ltd. (Shanghai, China). TruSeq Nano DNA LT Library Prep Kit (Illumina) was used in the sequencing library. In total, 1μL of the library was taken, and the Agilent High Sensitivity DNA Kit was used for 2100 quality inspections of the library on the Agilent Bioanalyzer machine. Qualified libraries were sequenced at 2 × 300 bp paired-end using the MiSeq Reagent Kit V3 (600 cycles) on the MiSeq machine.

2.4. Statistical Analysis

Raw sequence data were demultiplexed using the demux plugin, followed by primers cutting with the cutadapt plugin [36]. Sequences were then quality filtered, denoised, merged, and chimera removed using the DADA2 plugin [37]. Non-singleton amplicon sequence variants (ASVs) were aligned with mafft [38] and used to construct a phylogeny with fasttree2 [39].
Excel Office 2019 and IBM SPSS Statistics 26.0.0 (Chicago, USA) were used for data processing and statistical analysis. All the data in Table 1 were mean ± standard deviation of 4 replicates. The one-way ANOVA method (LSD) was used to compare the different soil physical and chemical properties and the significant differences of soil microbial communities. Differences in soil β-diversity were analyzed based on the Operational Taxonomic Units (OTU) table, and APE package in R (R v.3.4.4) (New Zealand). Common and unique OTUs of soil microbial communities in each sample were analyzed in R (R v.3.4.4). Venn diagrams were generated using the “Venn diagram” package [40]. Stacked histograms of species composition were the most commonly used means of characterizing the species composition of multiple samples. By statistical analysis of the feature table after removing Singleton, the visualization of the component distribution of each sample at different classification levels was realized, and the bar chart was drawn by QIIME2 (2019.4). Data were normalized during α-diversity analysis. The leveling rule adopts the qiime feature table refinement function, and the leveling depth is set to 95% of the minimum sample sequence size. Abundance is represented by the Chao1 index and observed_species index, while the Shannon and Simpson index represents diversity. The uniformity was characterized by the Pielou_e index, and the coverage was characterized by the Good_coverage index. Boxplots were produced using the ggplot2 package in R (R v.3.4.4) [41]. Non-metric multidimensional scaling analysis (NMDS) was done with R (R v.3.4.4)’s “vegan” package. It simplified the data structure by reducing the dimension of the sample distance matrix to trace the distribution characteristics of the sample under a specific distance scale. By rank ordering the sample distance, ordering the samples in the low-dimensional space was as close as possible to the similar distance relationship between each other (rather than the exact distance value). The smaller the stress value (Stress) of the NMDS results, the better. It is generally believed that when the value is less than 0.2, the NMDS analysis’s results are more reliable [42]. Cluster analysis was performed to identify discontinuities in the data. Hierarchical clustering was often used in Beta diversity clustering analysis, which is in the form of a hierarchy tree according to the similarity between samples. Through the clustering tree branch, length measures the quality of the clustering effect. Using the “uclust” function of the R (R v.3.4.4)’s “stat” package, the Bray–Curtis distance matrix was clustered by the UPGMA algorithm (the clustering method was average) by default, and the “ggtree” package of R (R v.3.4.4) was used for visualization.

3. Results

3.1. Soil Physicochemical Properties of Different Planting Types

As can be seen from Table 1, there are significant differences in total carbon (total C), total nitrogen (total N), total phosphorus (total P), and total carbon/total nitrogen (total C/total N) of different tree species (p < 0.01). At the same time, the pH value differences between them were not significant (p > 0.0). The soil chemical indexes were the lowest in Ma and the highest in Lb, including total C, total N, total P, and total C/total N. Unlike soil chemical indicators, the pH of MaLb was higher than Lb (Table 1).

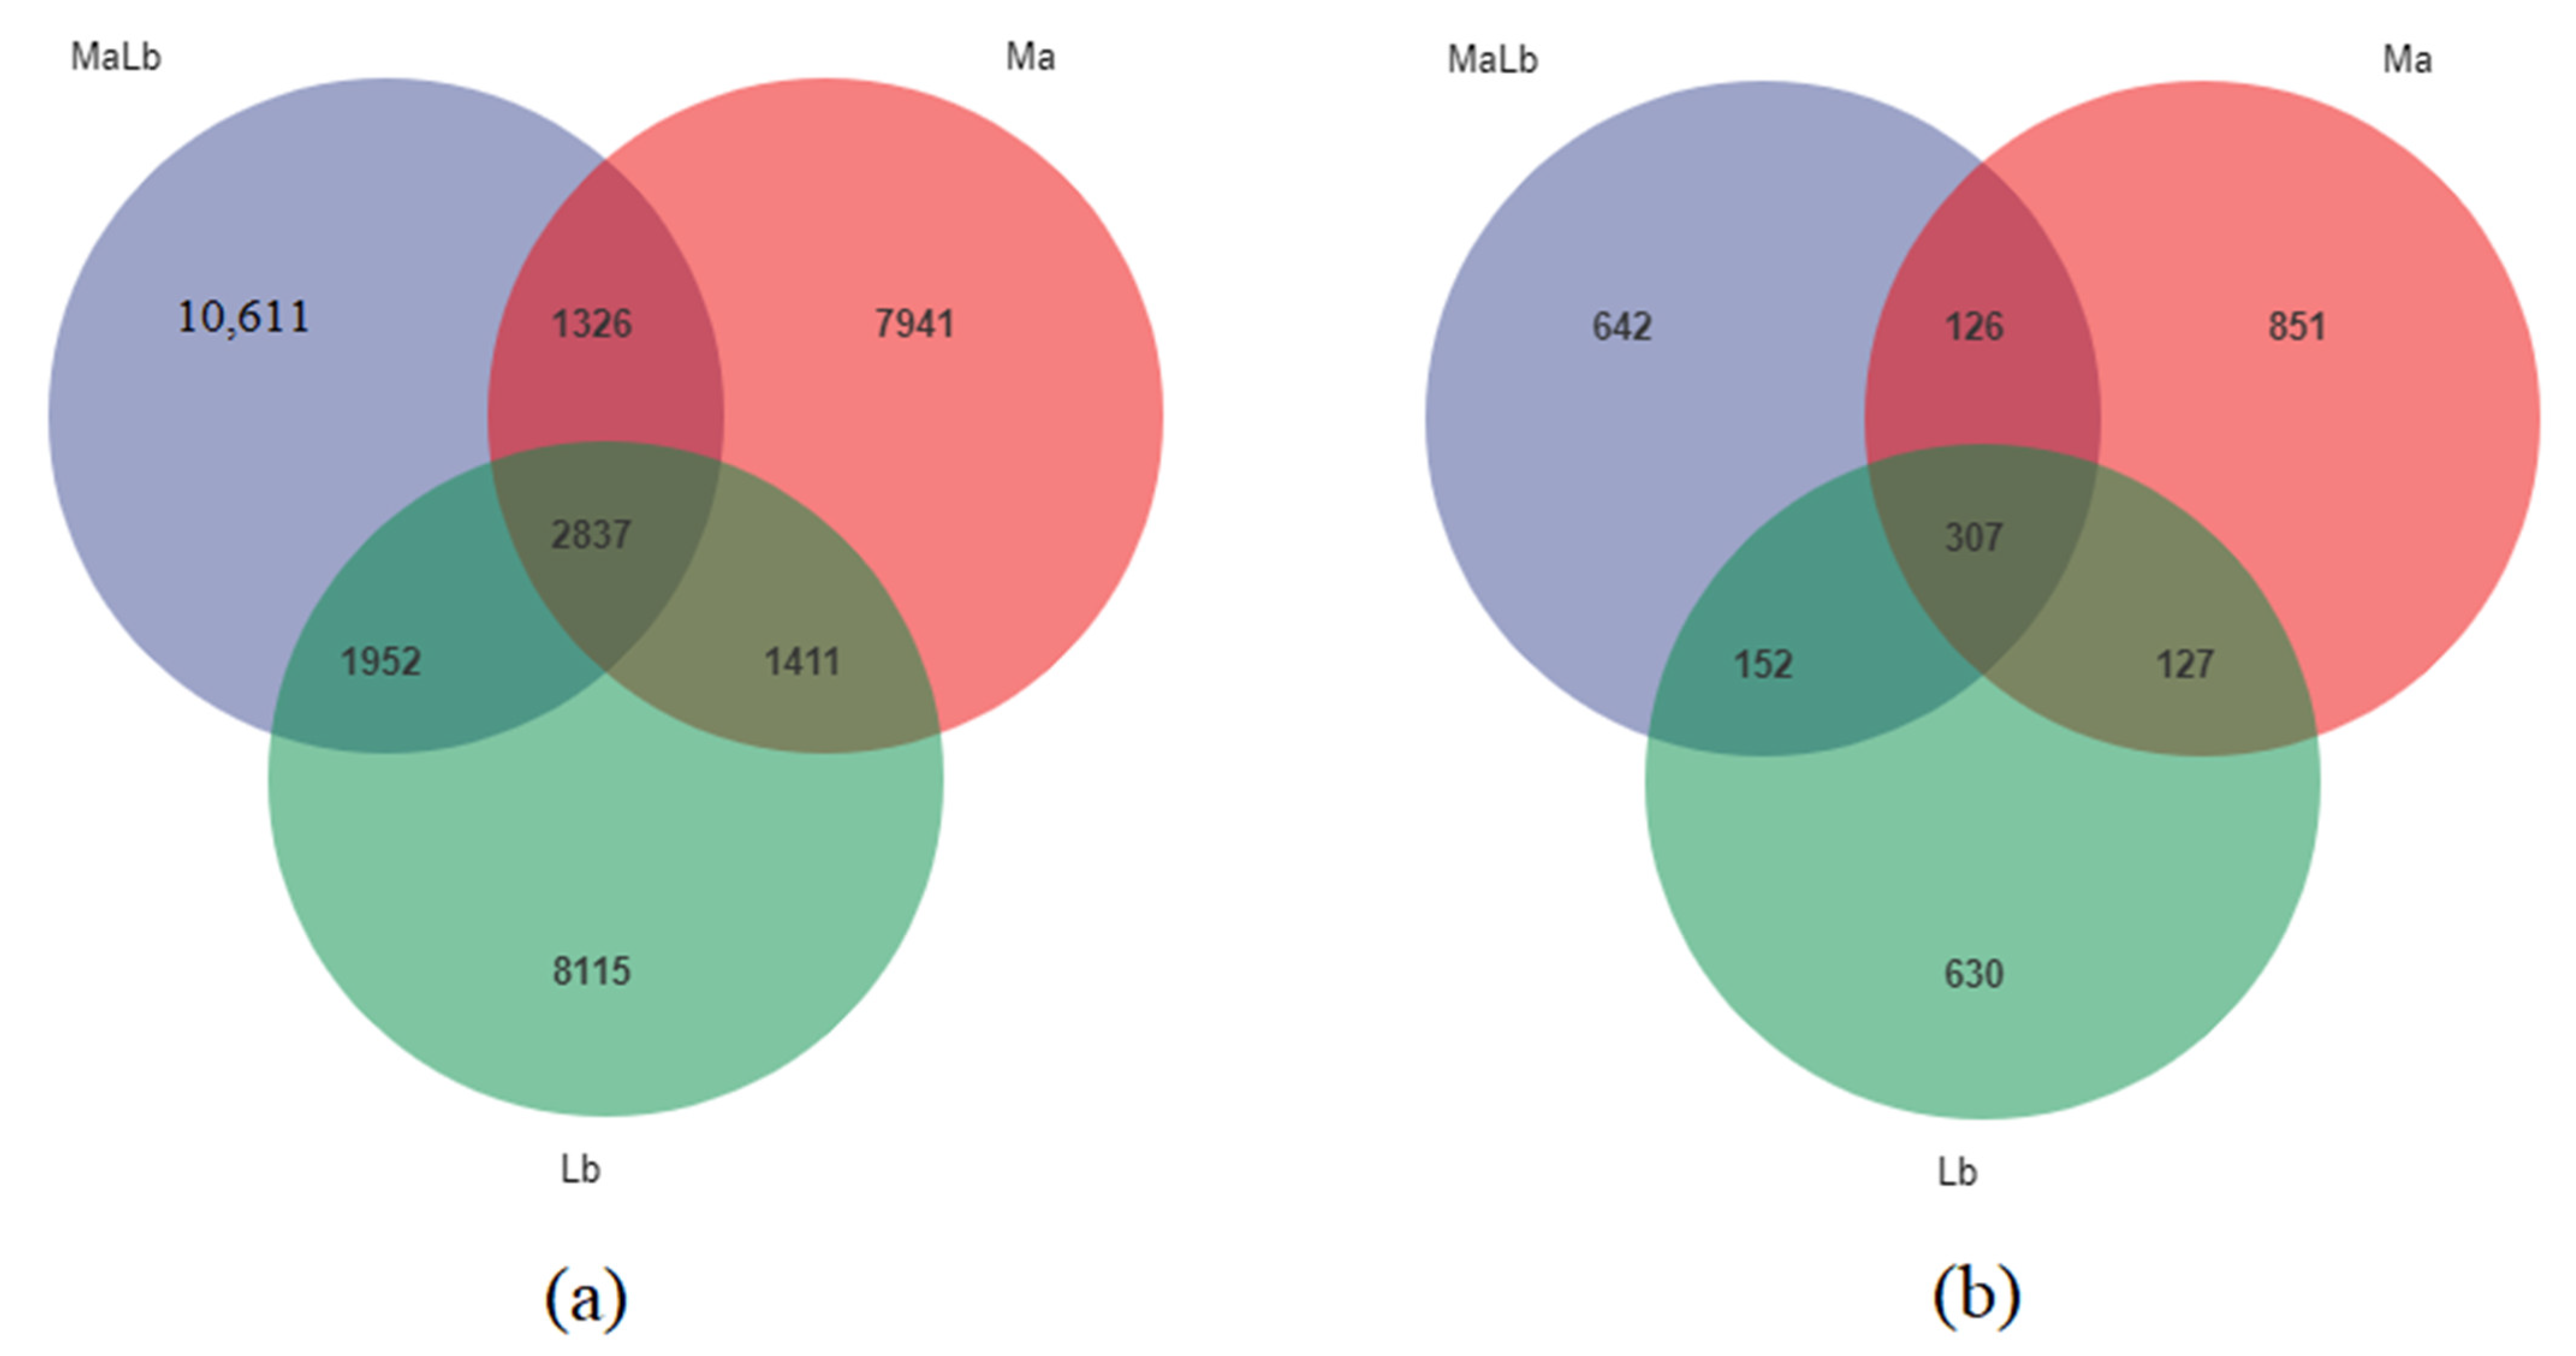
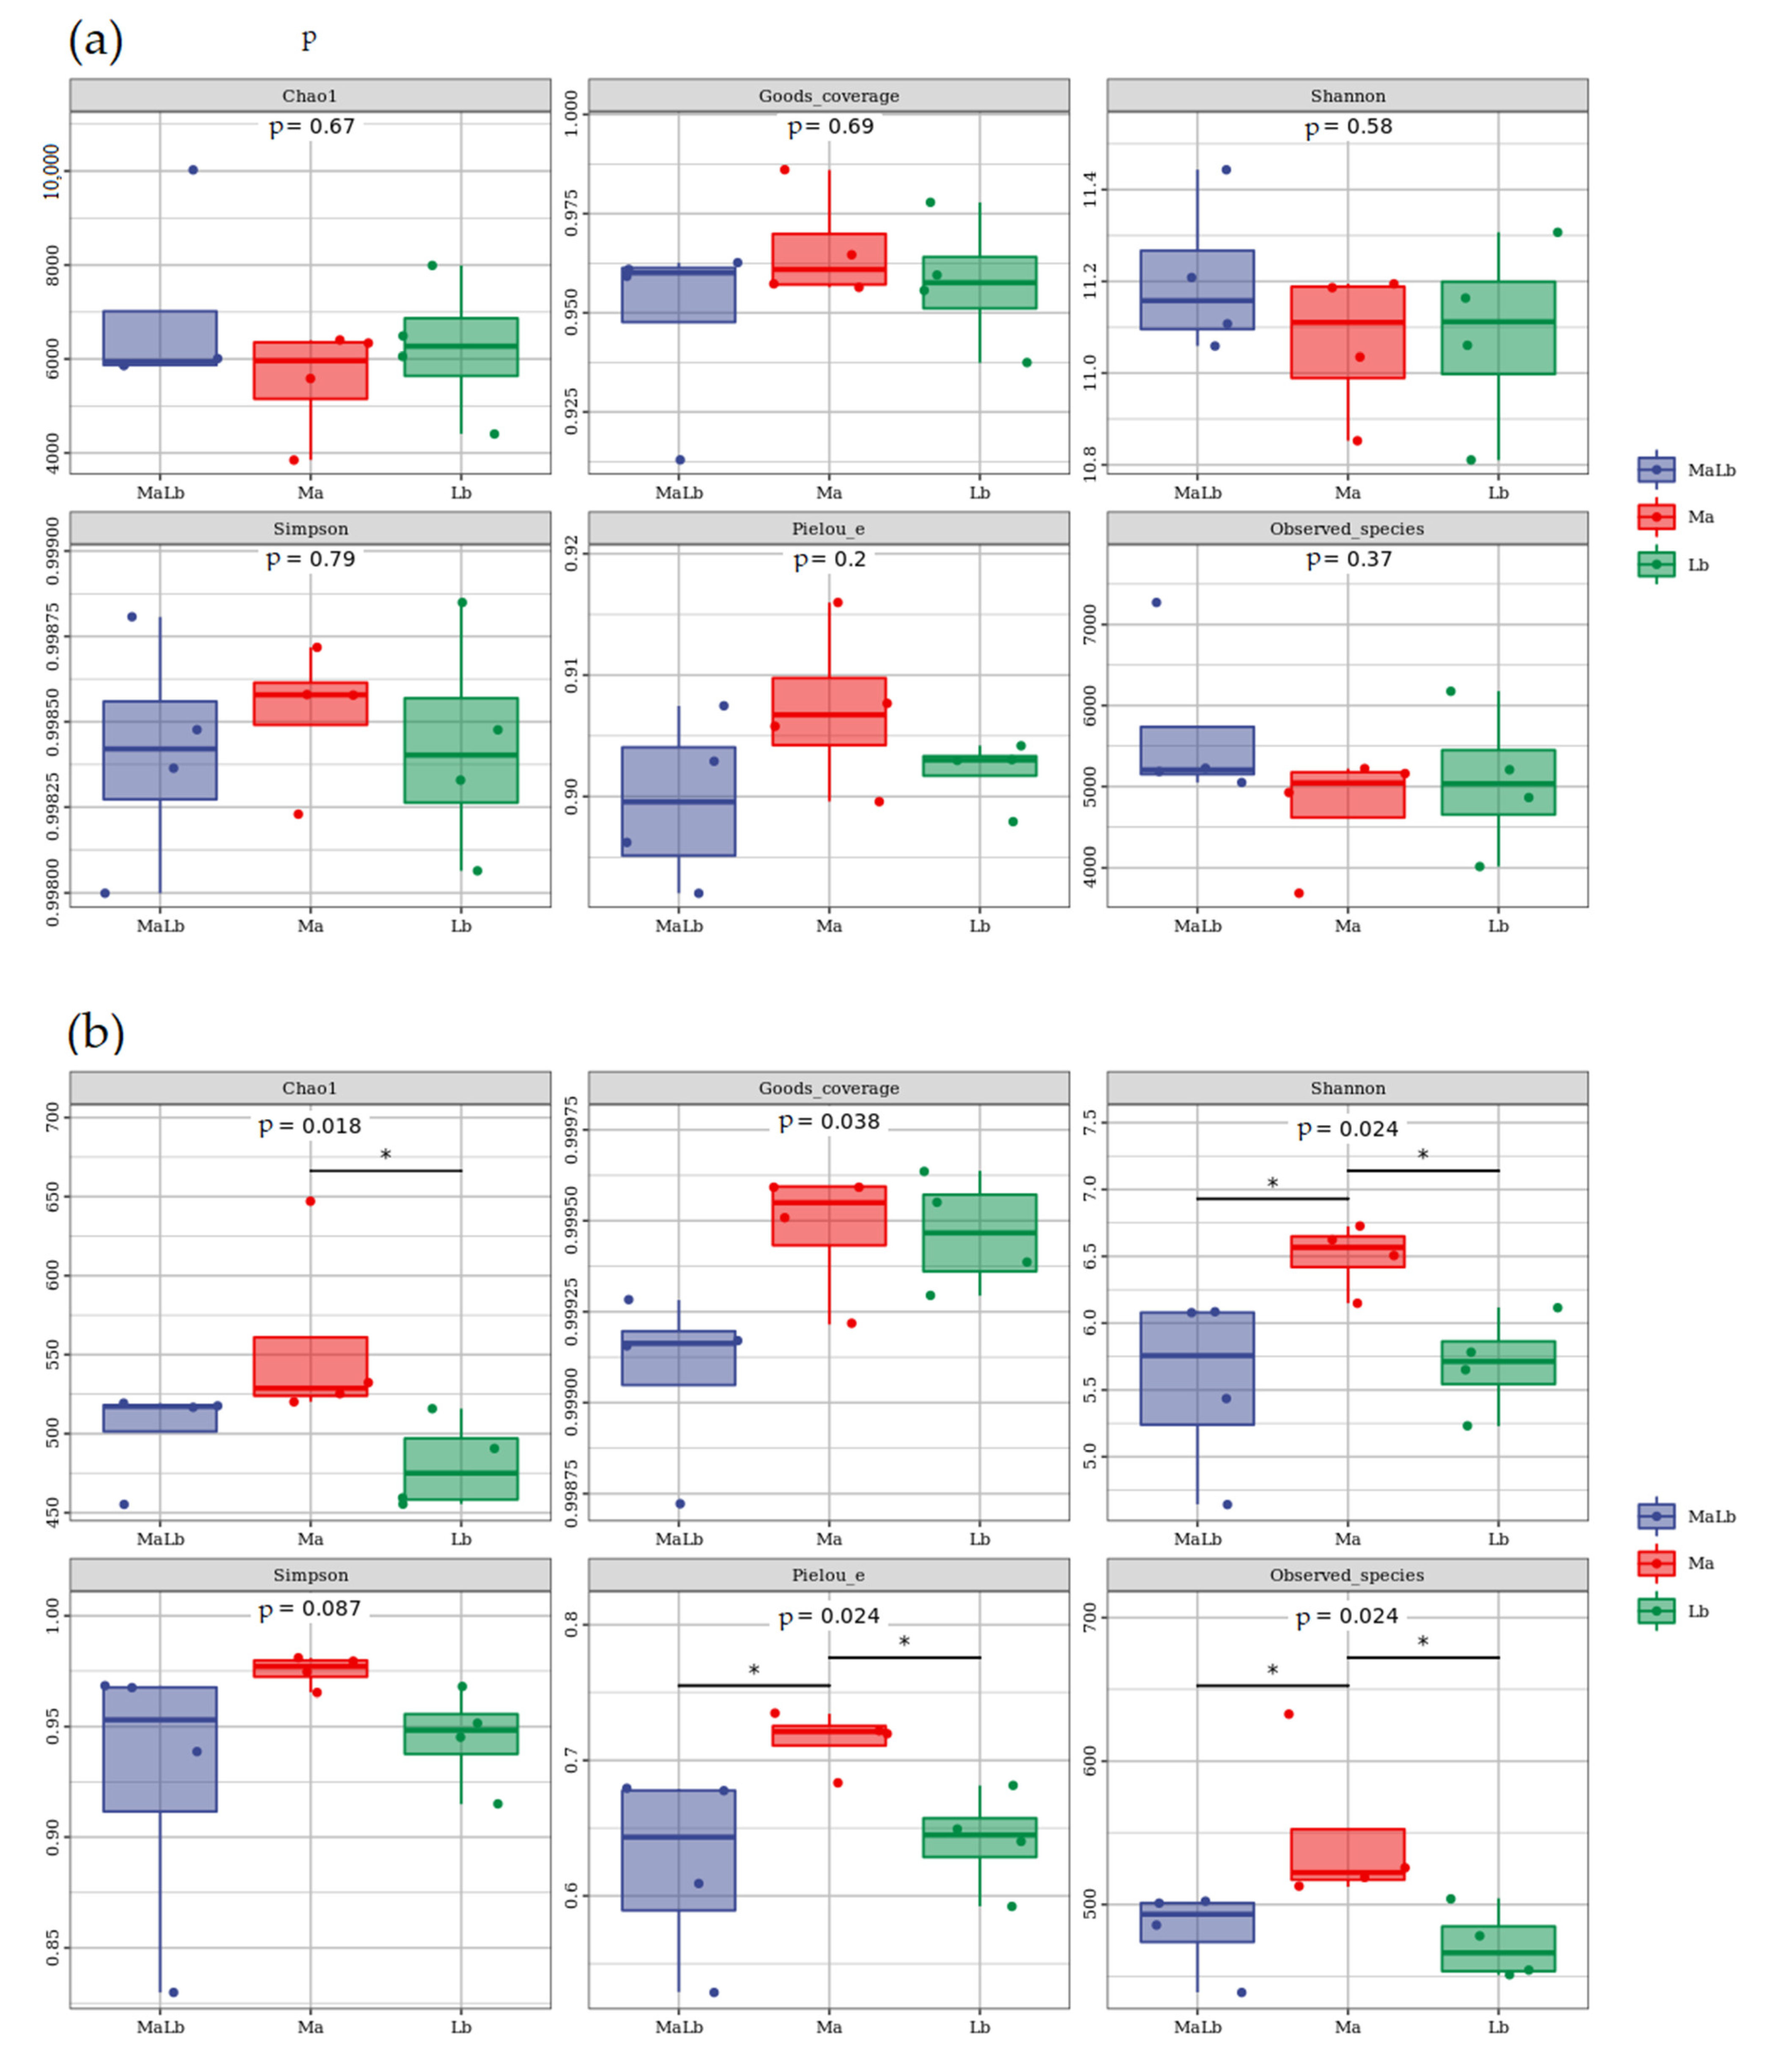
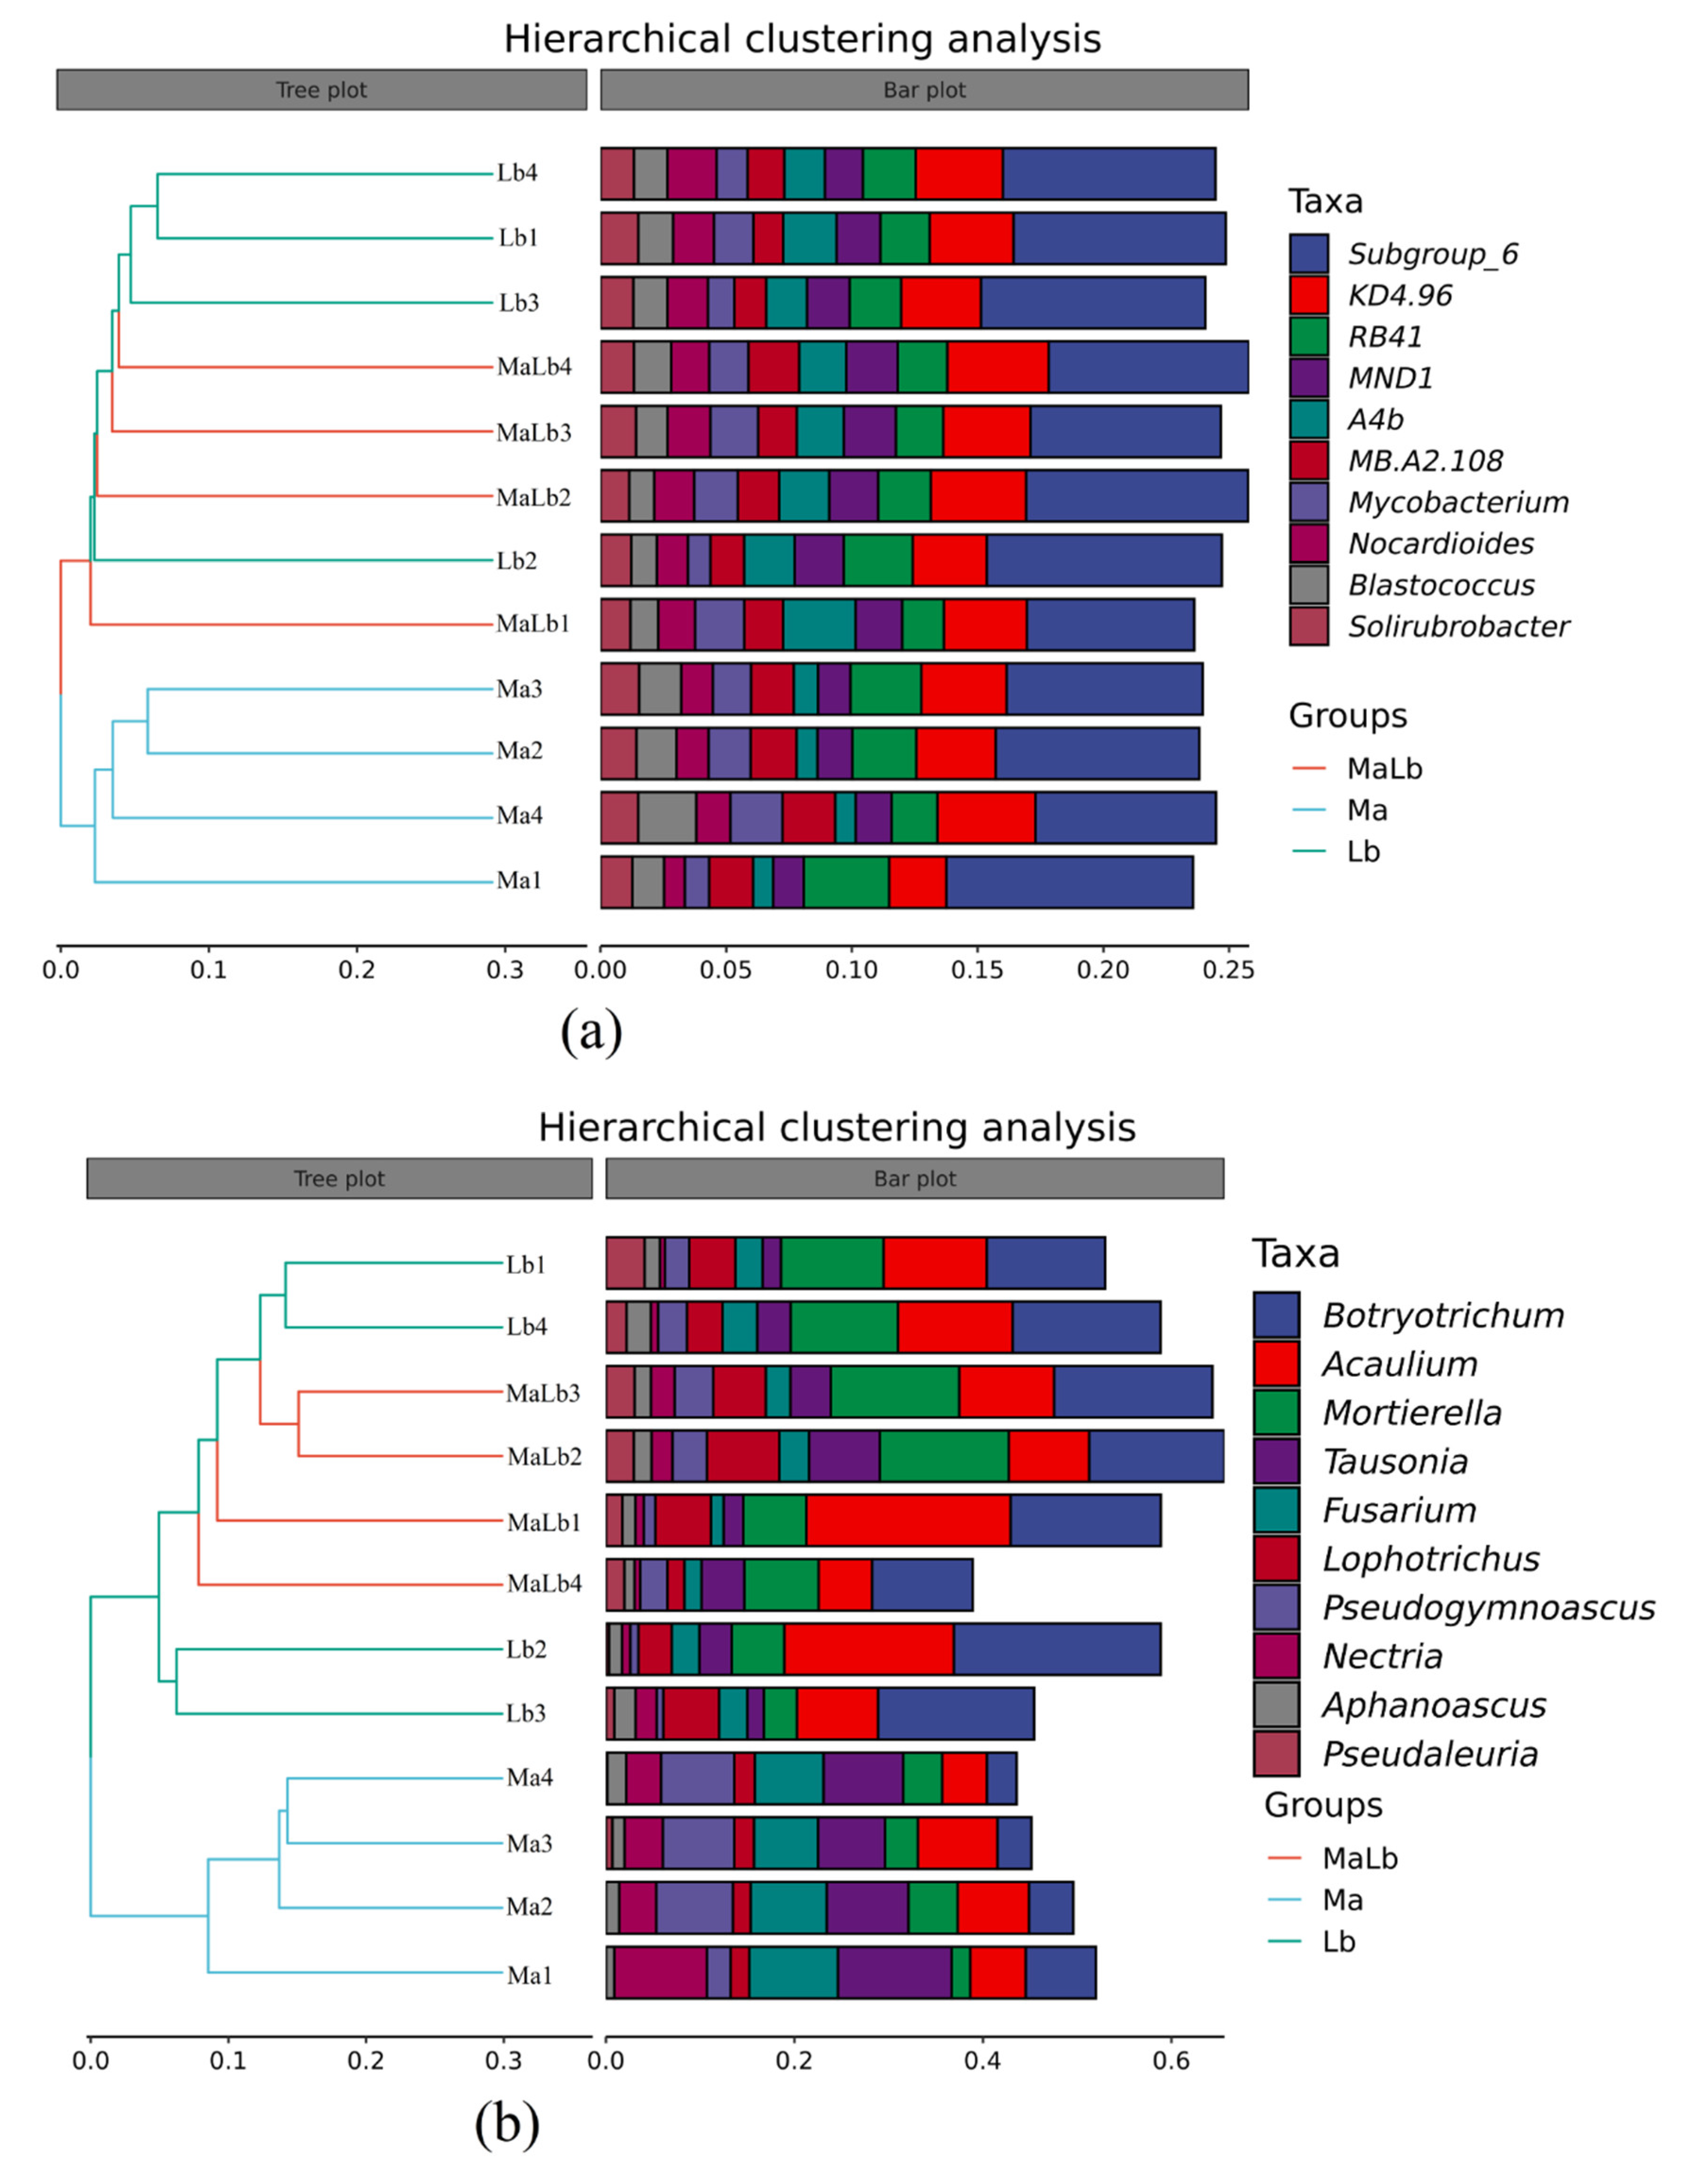
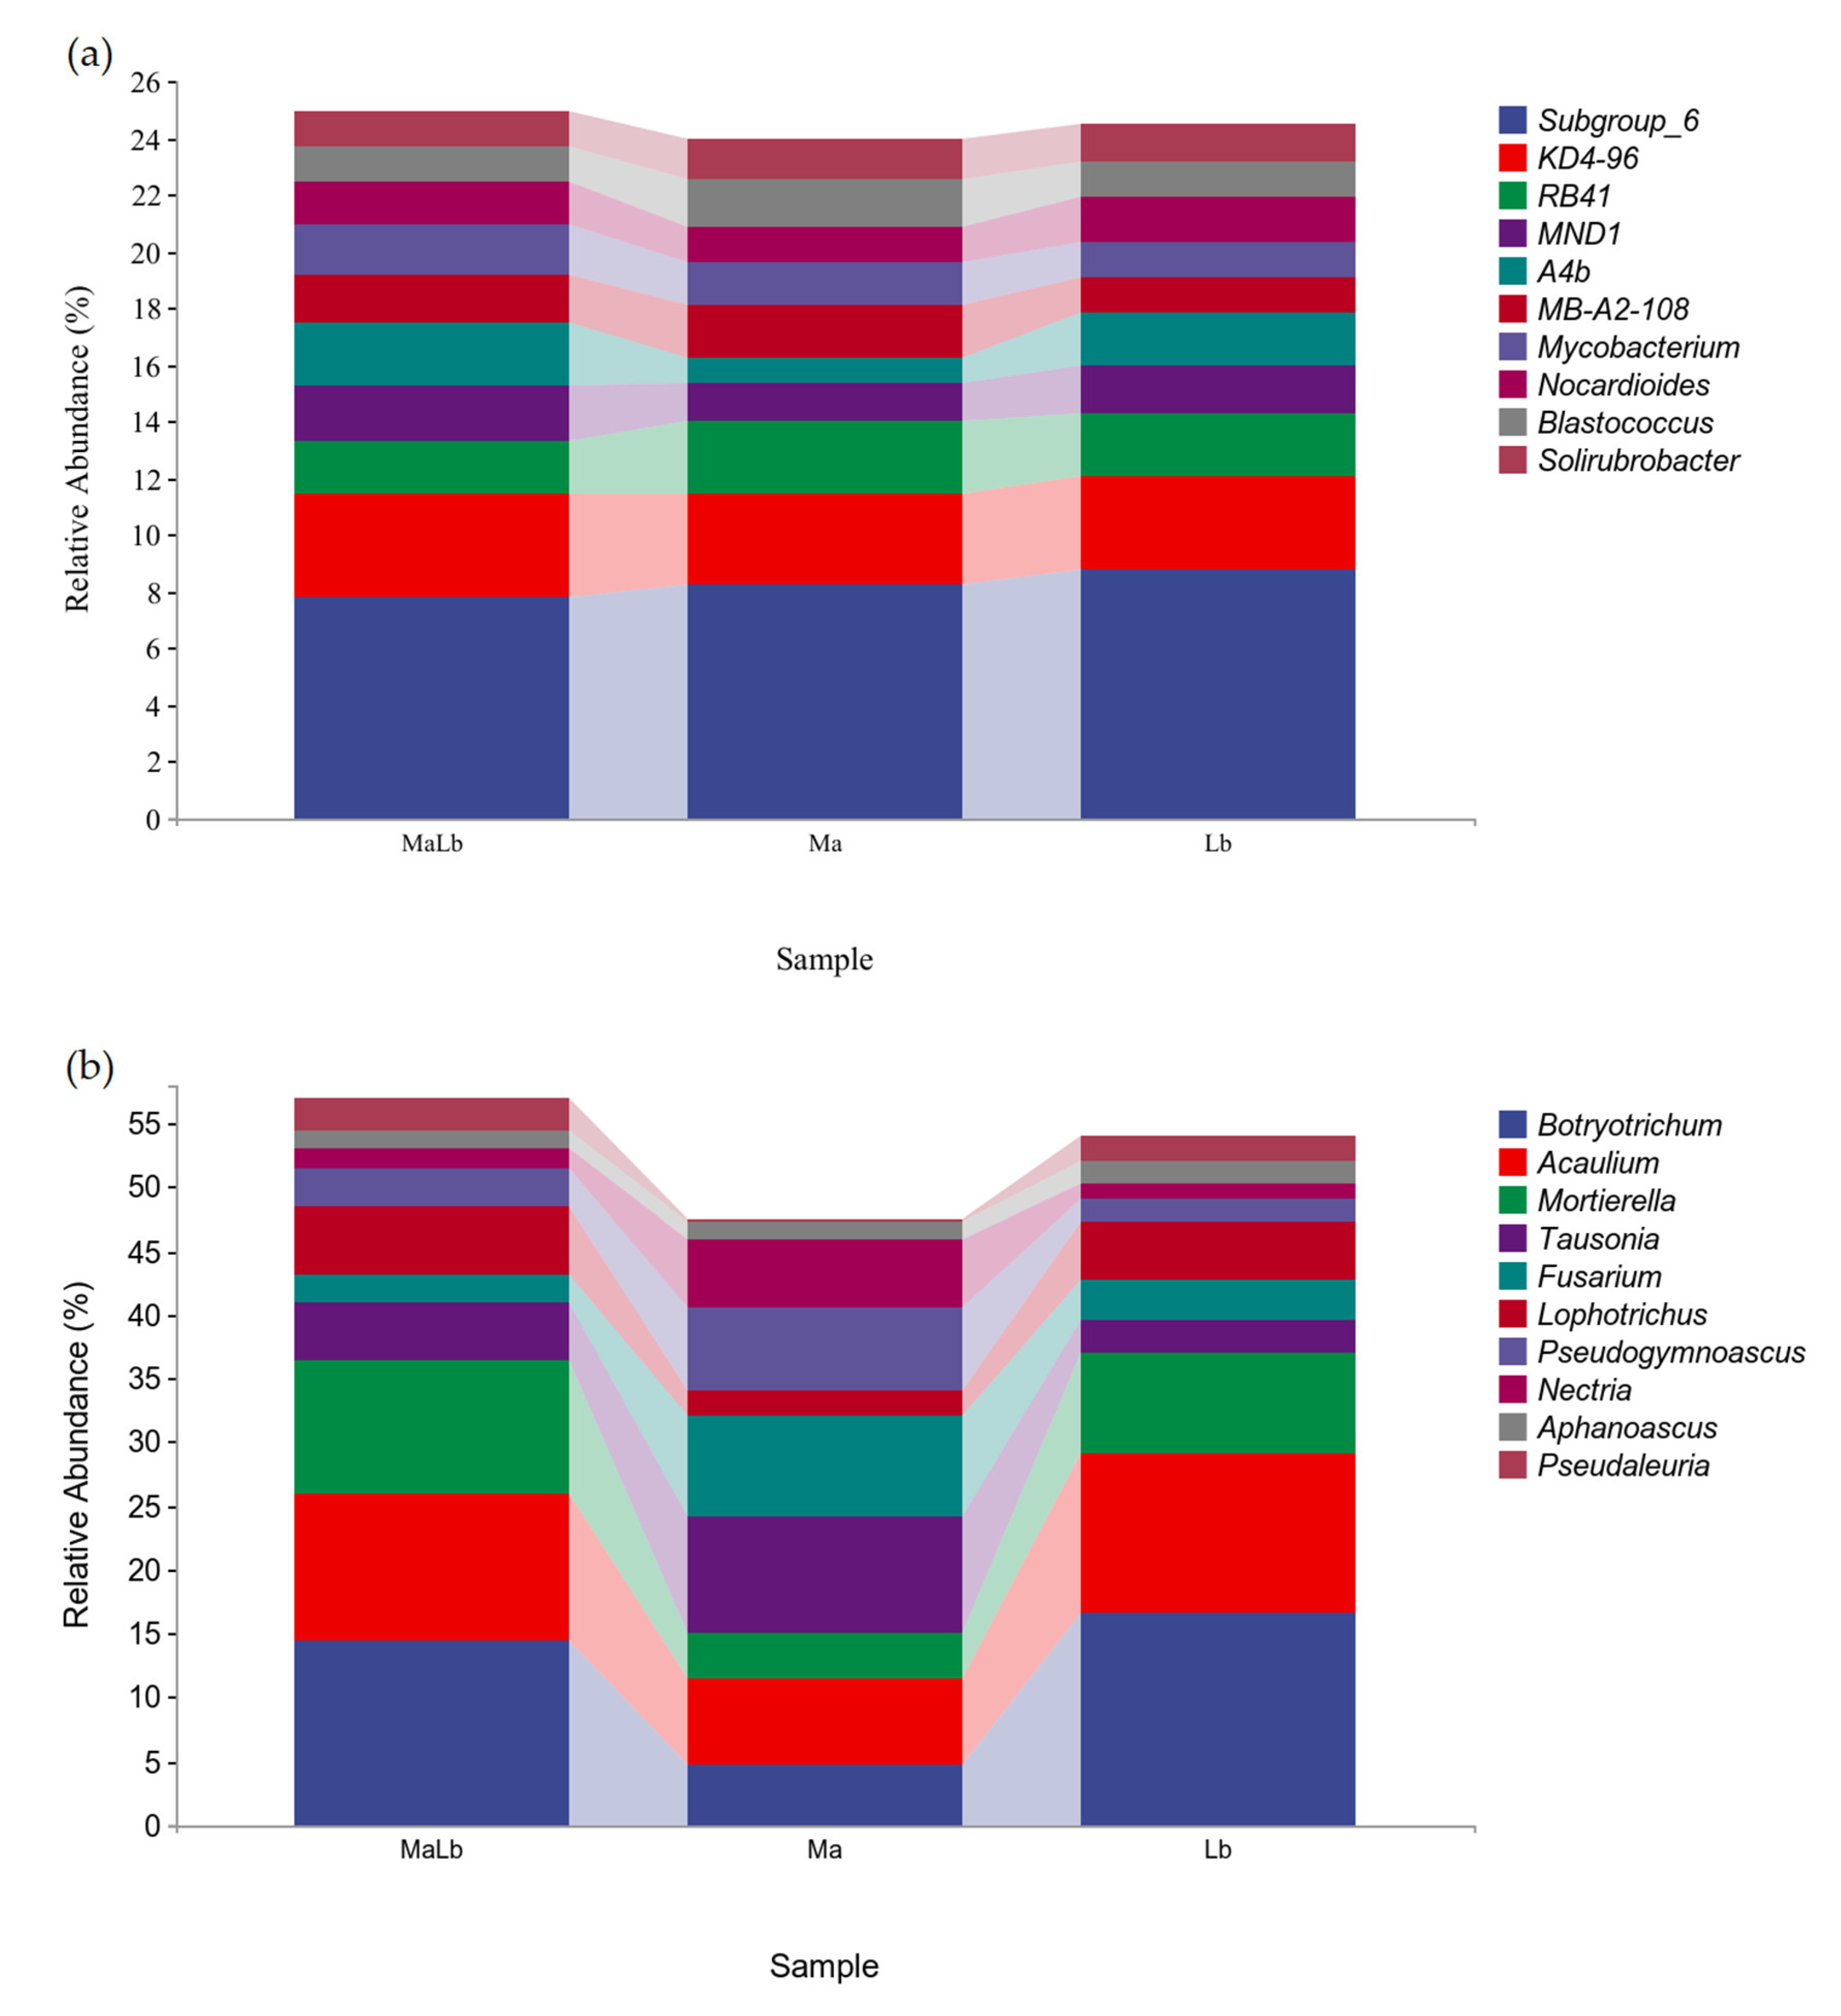
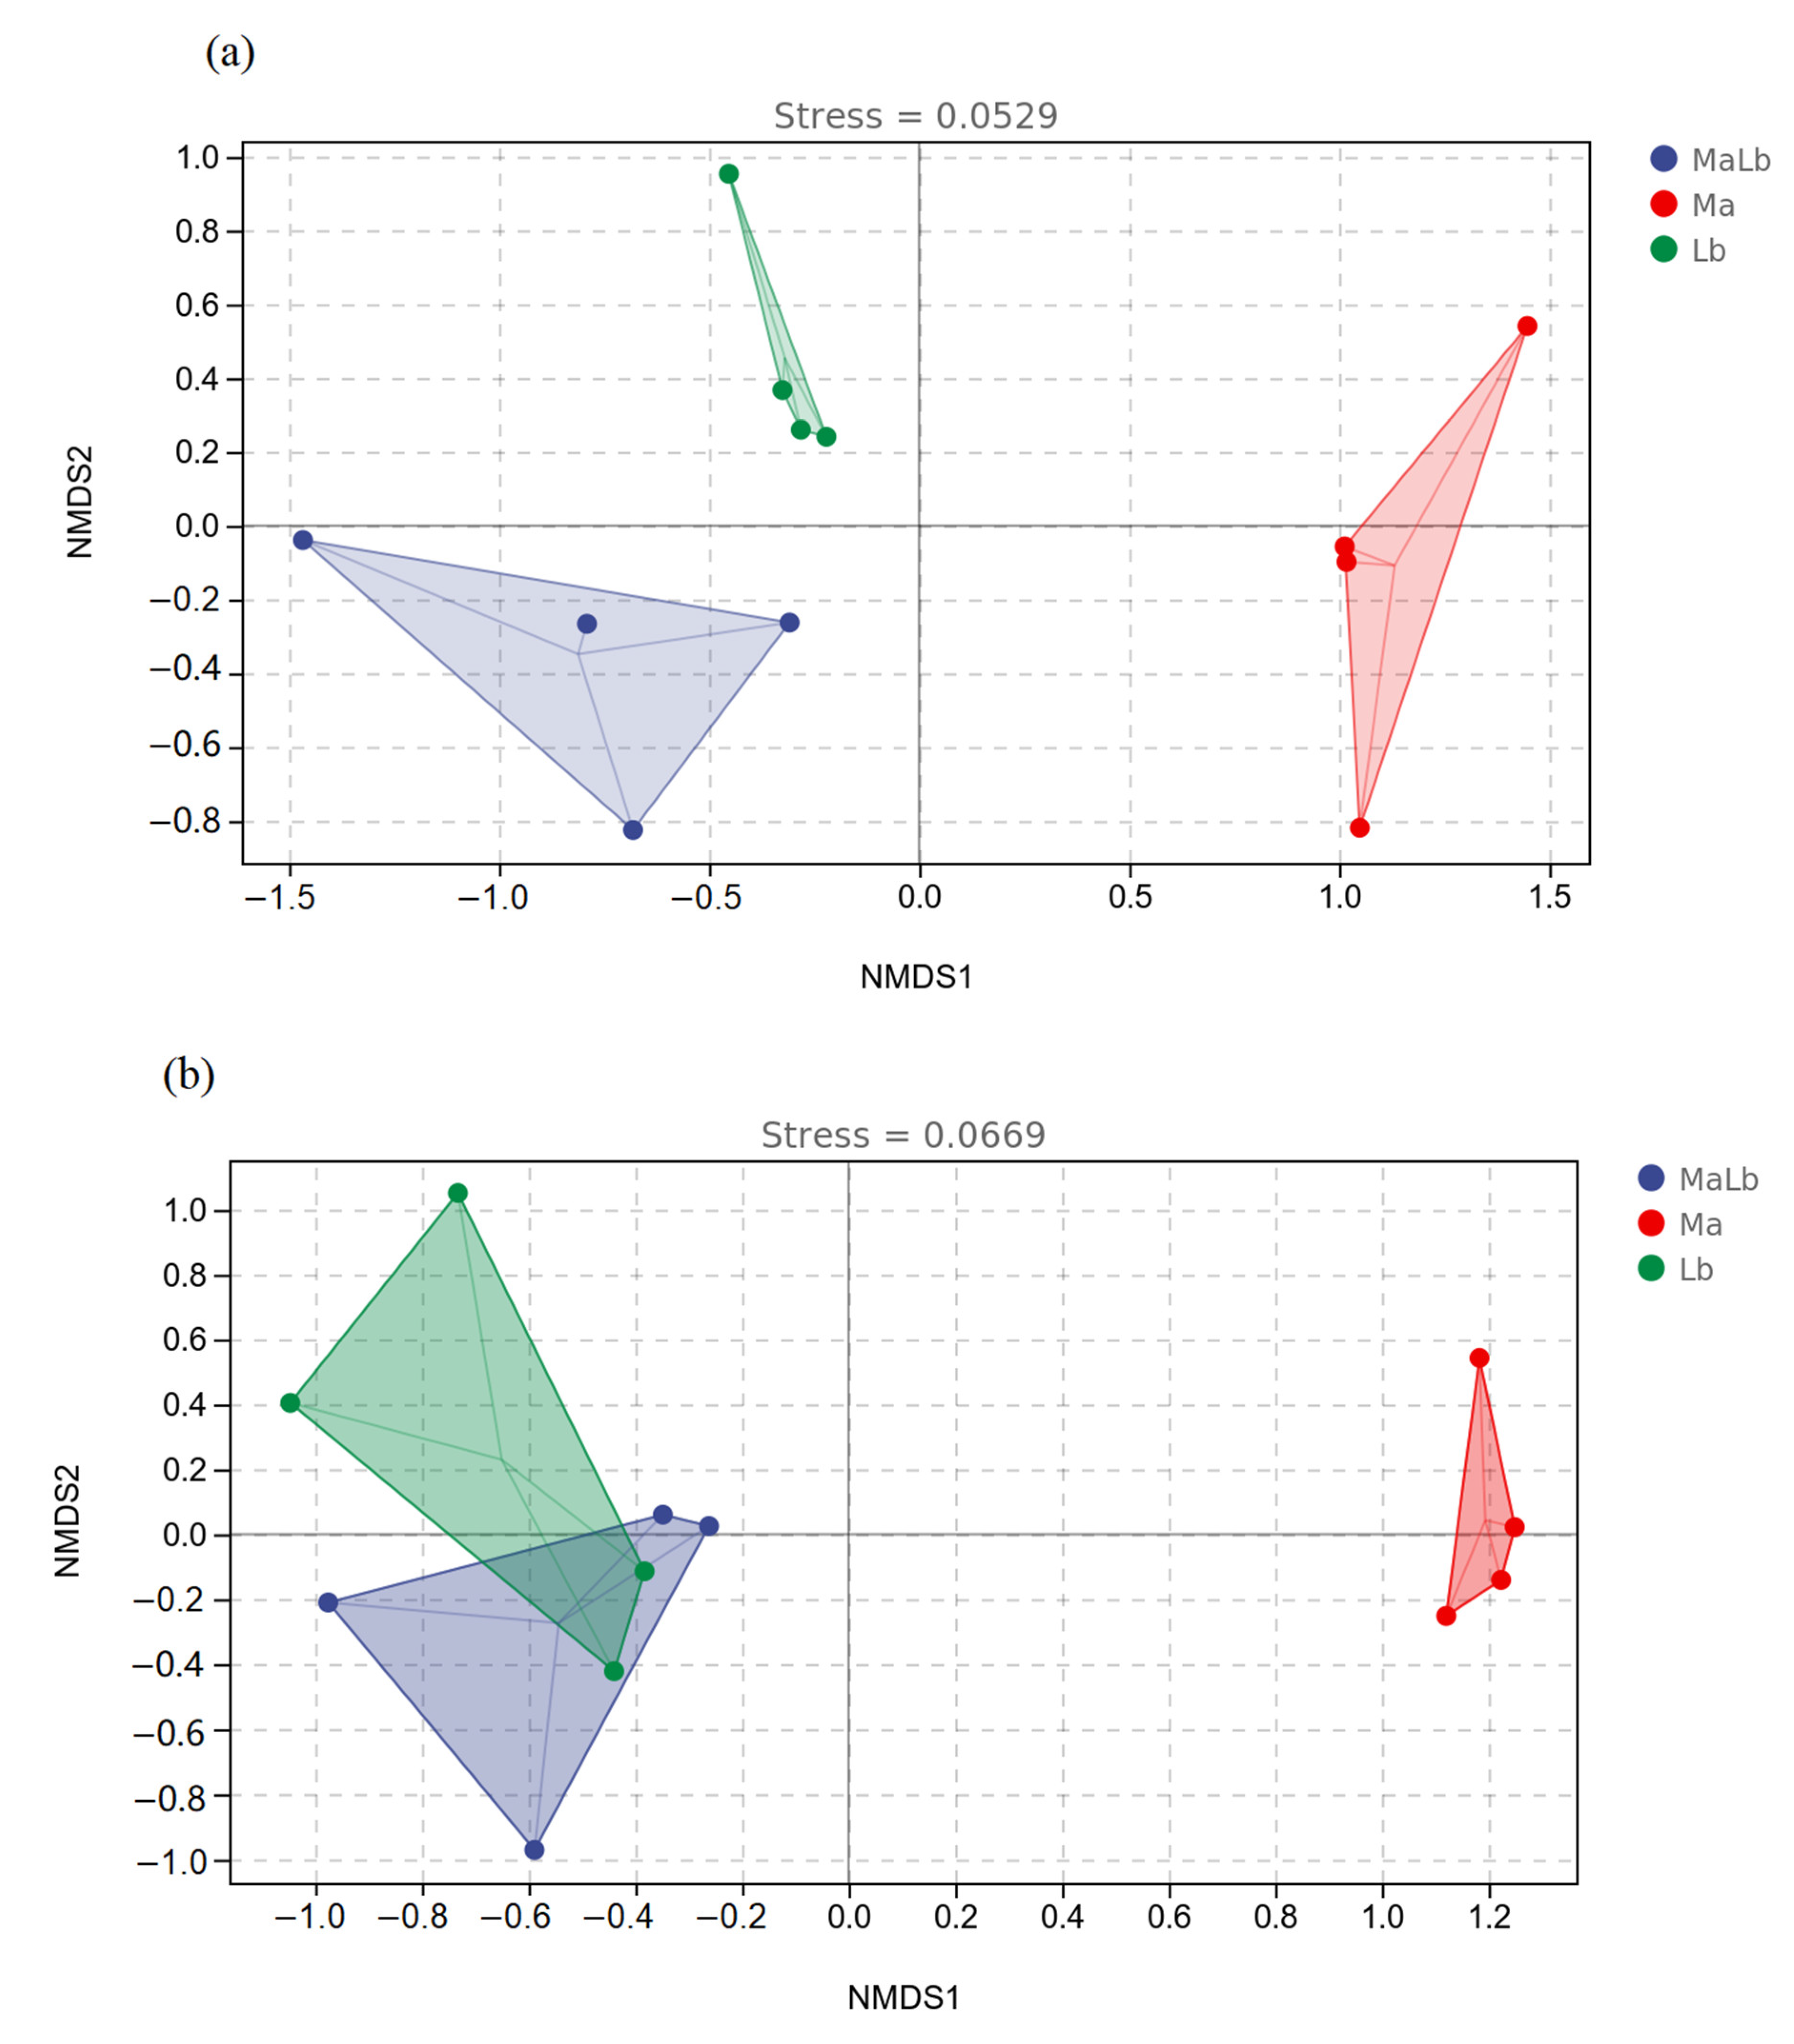
3.2. Soil Microbial Community Composition and Structural Diversity under Different Planting Methods

A total of 34,193 OTUs were detected in the presence of unique OTUs and shared OTUs in the three sample bacteria. OTUs of Ma, MaLb, and Lb were 13,515, 167,206, and 14,315, respectively. Among them, the number of OTUs in Ma, MaLb, and Lb was 2837, among which the unique OTUs in Ma, MaLb, and Lb respectively were 7941, 10,611, and 8115, (Figure 2a). 2035 OTUs were aggregated in the three sample fungi. Ma, MaLb, and Lb had 1411, 1227, and 1216 OTUs, respectively. Among them, 307 OTUs were shared by Ma, MaLb, and Lb, and only Ma, MaLb, and Lb shared 851, 642, and 630 OTUs, respectively (Figure 2b).
The samples with different soil ratios were analyzed by the α–diversity index, and boxplots were drawn. The soil bacterial diversity indices, including the Chao 1 index (F = 0.751, p = 0.015), Pielou_e index (F = 1.802, p = 0.2), Goods_coverage (F = 0.849, p = 0.69), Shannon index (F = 0.677, p = 0.58), Simpson index (F = 0.174, p = 0.79), and Observed_species (F = 1.108, p = 0.37), showed no significant differences among Ma, MaLb, and Lb. MaLb had the highest Chao 1 index, Observed_species index, and Shannon index, which were 6942.935, 5682.775, and 11.205, respectively, followed by Lb, while Ma had the lowest. Ma had the highest abundance, diversity, and evenness (Figure 3a). MaLb had the lowest Goods_coverage index, Pielou_e index, and Simpson index, which were 0.949, 0.900, and 0.99841, followed by Lb, while Ma had the highest.
However, the results for fungi were different from those for bacteria. The soil bacterial diversity index, including Chao 1 index (F = 3.333, p = 0.018), Goods_coverage (F = 5.149, p = 0.038), Pielou_e index (F = 4.124, p = 0.024), Shannon index (F = 4.682, p = 0.024), Simpson index (F = 1.516, p = 0.087), and Observed_species (F = 4.237, p = 0.024), exhibited differences among Ma, MaLb as well as Lb. Ma had the highest Chao 1 index, Goods_coverage index, Observed_species index, Pielou_e index, Shannon index, and Simpson index, which were 556.214, 0.99947, 547.475, 0.715, 6.502, and 0.975, respectively. Lb had the lowest Chao 1 index (was 480.340) and Observed_species index (was 471.950). The Goods_coverage, Pielou_e index, Shannon index, and Simpson index of MaLb were the lowest, which were 0.99908, 0.624, 5.562, and 0.926, respectively (Figure 3b).
The relative abundance of microorganisms at the phylum level (others were shown) in the three soil samples was counted, as shown in Figure 4. At the bacterium phylum level, the top 10 relative abundances were Actinobacteria, Proteobacteria, Acidobacteria, Chloroflexi, Firmicutes, Gemmatimonadetes, Bacteroidetes, Rokubacteria, Nitrospirae, and Patescibacteria. Among them, Actinobacteria was the most abundant phylum in the three samples. Only Actinobacteria had the highest content in MaLb, which was 35.85%. Proteobacteria and Acidobacteria were Lb > Ma > MaLb (Figure 4a). At the level of fungal phylum, the top 10 contents were Ascomycota, Mortierellomycota, Basidiomycota, Zoopagomycota, Basidiobolomycota, Blastocladiomycota, Glomeromycota, Olpidiomycota, Chytridiomycota, and Mucoromycota. Only Ascomycota, Mortierellomycota, Basidiomycota, and Zoopagomycota had a relative content of more than 1%. Ascomycota was the dominant phyla in the three soil samples, and Lb (82.35%) > MaLb (78.33%) > Ma (74.67%). Mortierellomycota had the highest content in MaLb at 10.48%, while Basidiomycota had it in Ma and Zoopagomycota in Lb (Figure 4b).
Hierarchical clustering analysis at the genus level of soil microbial community showed that bacterial and fungal communities exhibit the same regularity. Whether at the bacterial genus level or fungi, Ma clustered into one class, Ma and MaLb into the class. This indicated that the similarity between Ma and MaLb is high at the genus level, and the similarity to Ma was low. The inlay on the right showed that the genus-level abundance of the microbial community was not the same, and although the species composition of each treatment was similar, the abundance difference was obvious (Figure 5).
The relative abundances of microorganisms at the genus level (others were not shown) in the three soil samples were calculated, as shown in Figure 6. At the bacterial genus level, the relative contents of Subgroup_6, KD4-96, RB41, MND1, A4b, MB-A2-108, Mycobacterium, Nocardioides, Blastococcus, and Solirubrobacter were in the top 10, but their relative contents did not exceed 10%. Subgroup_6 was the genus with the highest content in the three soil samples, with Lb of 8.79%, Ma of 8.22%, and MaLb of 7.75%, respectively. The KD4-96 content of MaLb was higher than that of Ma and Lb, which was 3.65%, and the content of RB41 was the highest in Ma (Figure 6a). At the fungal genus level, the top 10 relative contents are Botryotrichum, Acaulium, Mortierella, Tausonia, Fusarium, Lophotrichus, Pseudogymnoascus, Nectria, Aphanoascus, Pseudaleuria. The genus with the highest Ma content was Tausonia, accounting for 9.08%, while Botryotrichum had the highest Lb and MaLb content, accounting for 16.68% and 14.44%, respectively (Figure 6b).
As can be seen from the NMDS analysis chart, based on the Bray-Curtis algorithm, the population structures of three different soil microorganisms were significantly different. The degree of similarity in sample microbial population composition was indicated by the distance between samples in the figure. For soil bacterial communities, Ma was distributed in the first four quadrants, Lb was distributed in the second quadrant, and MaLb was distributed in the third quadrant (Figure 7a). Soil fungal communities differed from bacteria in that both MaLb and Lb were located in the second and third quadrants. Both Lb and MaLb were distributed on the negative semi-axis of the NMDS1 axis, while Ma was distributed on the positive NMDS1 axis. It could be seen that Lb and MaLb had great similarities in soil microbial structure and were quite different from Ma (Figure 7b).

3.3. Different Types of Planting Soil Physicochemical Properties and Microbial Community Diversity

As shown in Table 2, bacterial community alpha diversity had no significant relationship with the soil’s physical and chemical properties. For the fungal community, soil pH was inversely related to the Goods_coverage index (p < 0.01), Pielou_e index, and Shannon index (p < 0.05). The soil total N, total C, and total C/total N were significantly negatively correlated with Chao 1 index, Observed_species index, Pielou_e index, and Shannon index (p < 0.05). Soil total P index was negatively correlated with Chao 1 index and Observed_species index (p < 0.05) (Table 3).
At the phylum level, the bacterial phyla and soil physicochemical properties with the content of bacterial phyla in the top 10 and the fungal phylum content of >1% were compared for significance analysis. Firmicutes and Basidiomycota were significantly negatively correlated with soil total N, total C, total C/total N, and total P (p < 0.01). Nitrospirae was a notable negative correlation between total N (p < 0.01), total C, total C/total N, and total P (p < 0.05). Bacteroidetes was significantly positively correlated with soil total P (p < 0.05). Ascomycota was significantly positively correlated with total N, total C, total C/total N, and total P (p < 0.05). Zoopagomycota was significantly positively correlated with total C and total C/total N (p < 0.05). Other phyla had no correlation with the soil ’s biological and biological properties. (Table 4).

4. Discussion

Many early studies have shown that intercropping of nitrogen-fixing plants and other species can improve productivity [43,44]. Studies also found that intercropping with nitrogen-fixing plants can increase soil nitrogen content [45,46], thereby enhancing the accumulation of organic carbon and nitrogen in the ecosystem [28]. As a nitrogen fertilizer crop, the nitrogen content in Lb was significantly higher than in Ma. However, there were no significant changes between it and MaLb, which might be due to the apparent effect of L. bicolor in the intercropping of M. alba and L. bicolor. This study found that nitrogen-fixing and M. alba intercropping could significantly increase the soil total N, P, and K of M. alba, but had no significant impact on the soil pH. This indicated that nitrogen-fixing plants could not only enhance soil nutrients in pure M. alba forests but also have the potential to increase their soil carbon interception potential, similar to previous studies that concluded that those could significantly reduce soil carbon loss and increase soil carbon sequestration [47,48]. Nitrogen-fixing plants and M. alba were mixed to improve soil nitrogen availability and nutrients. The increase in available nitrogen content in soil was an important factor in significantly improving the net productivity of plants [49]. These results suggest that nitrogen-fixing plants enhance ground plant productivity by increasing the availability of soil nutrients, especially nitrogen, and provide essential basal metabolites for more microbial growth. In turn, the soil microbial biomass was increased, and to a certain extent, it was possible to increase the source of soil organic carbon.
Several recent studies have shown that soil nutrient quality (e.g., total soil nitrogen, total carbon, and total carbon/total nitrogen) is also a major factor driving changes in soil microbial communities [50,51], which is similar to the results of the present study. The introduction of nitrogen-fixing plants increases soil nitrogen content and reduces soil carbon-nitrogen ratio, which inhibits the growth of soil fungal communities to a certain extent [52]. The present study found that intercropping of M. alba and L. bicolor significantly increased soil nutrient content (total N, total C, total P). These changes significantly increased the biomass of soil bacterial communities but significantly decreased the proportion of fungal communities. This study was also supported by many studies that suggest that bacterial communities tend to be dominant in fertile soils [53,54].
Soil has a strong metabolic capacity due to the presence of soil microorganisms [55]. Soil microbes are the link between soil and plants, which drives plant growth [56,57]. Changes in pH have the greatest impact on soil bacteria [58,59], and higher pH increases the activity of soil microorganisms such as Nitrospira [60]. In this study, the pH value of MaLb was the highest. Still, there was no significant difference among the three treatments, so pH value was not the dominant factor affecting the soil microbial community in this experiment. After intercropping with M. alba, nitrogen fixed by rhizobia was available to mulberries, and this level of nitrogen addition increased the complexity of rhizosphere bacteria [61]. In this experiment, the top three bacteria in soil content of three treatments were Actinobacteria, Proteobacteria, and Acidobacteria. The abundance of actinomycetes is associated with fast-acting nutrients [62]. There are many reasons for the high abundance of actinomycetes in MaLb. One is because of nitrogen, and the other is because of the high content of organic matter, which can also be found from higher C/N [63]. In harsh environments such as salinity, Proteobacteria dominate the soil and have a certain resistance to such extreme environments [64]. In this experiment, the content of Proteobacteria showed Lb > Ma > MaLb, so it was speculated that the resistance of M. alba and L. bicolor to the harsh environment was higher, and the resistance was still retained after intercropping.
In addition, Fungi play an important role in soil, some of which promote crop growth and development, and some cause crop diseases [65]. Most soil fungi belong to the Ascomycetes or Basidiomycetes. In this study, Ascomycetes were significantly positively correlated with soil nutrients (p < 0.05), while Basidiomycetes were negatively correlated with those (p < 0.01). After the intercropping of L. bicolor and M. alba, the abundance of the bacterial community decreased. Basidiomycetes are abundant decomposing fungi in soil, and their abundance increases the decomposition of organic matter in the soil faster efficiently. Ascomycete fungi can be parasites, symbiotic, saprophytic, or facultative saprophytic, while Basidiomycete fungi are mostly saprophytic. Since plants have different life forms, their properties vary at the phylum level. The proportion of unclassified plants in the rhizosphere flora was low, indicating that more research is needed into the rhizosphere flora plants of M. alba and L. bicolor.
Nitrogen is an important nutrient in the soil and often acts as a soil factor limiting plant growth. Recent studies have shown that nitrogen-fixing plants are capable of increasing soil nitrogen content, increasing soil organic matter, and also enhancing soil [66,67,68,69,70]. Up to now, it has not been possible to establish a uniform conclusion on the mechanisms by which soil nitrogen content and its availability affect soil microbial biomass. Some studies have found that the increase of soil nitrogen content is beneficial to the reproduction and growth of soil microorganisms [71,72]. However, some studies have found that increasing soil nitrogen content sometimes inhibits their reproduction and growth, and sometimes this effect is minimal [73,74]. This also explained to a certain extent why the bacterial community structure and composition of different treatments in this study were not significantly different. In contrast, the fungal community structure and composition were significantly different. The past state of understanding the key abiotic and biotic factors that underlie the structural variations in soil microbial communities exists very uncertain [75,76].

5. Conclusions

In this study, the nutrient content, microbial community, and structural composition of the rhizosphere soil of different samples were measured in the pot experiments of M. alba-L. bicolor intercropping and pure breeding of M. alba and L. bicolor, respectively. We found that in terms of soil nutrients, the intercropping of M. alba and nitrogen-fixing tree species L. bicolor had no significant effect on soil pH but significantly increased the content of total C, total N, and total P in the soil and improved soil nutrients. Microbial community composition and structure were visualized by PCR amplification and 16S rRNA and ITS sequencing of corresponding primers for soil microbes in different samples. It was found that the intercropping of M. alba and L. bicolor had no significant effect on the alpha diversity of the bacterial community but did have a significant effect on the evenness and diversity of the fungal community (p < 0.05). The intercropping of M. alba and nitrogen-fixing species increased the relative abundance of Actinobacteria in the rhizosphere soil. Mortierellomycota was more abundant in MaLb than in the other two. According to NMDS analysis, the similarity between MaLb microbial community and Lb was higher than that of Ma. The study also found that soil nutrients had no significant effect on bacterial community composition (p > 0.05) but did have a significant effect on fungal community richness, diversity, and uniformity (p < 0.05). This study enriched our understanding of the effects of the introduction of nitrogen-fixing tree species on soil nutrients and microbial community diversity in M. alba plantations through the intercropping of mulberry and nitrogen-fixing tree species—L. bicolor. Add a theoretical basis for our understanding of the impact of soil nitrogen content on soil nutrients and microorganisms in the future.

Author Contributions

Conceptualization, Y.Y.; methodology, Y.W.; software, H.D.; validation, H.D., W.Z., and Y.Y.; formal analysis, J.L.; investigation, J.L., Y.W., W.Z., and Y.Z.; resources, H.D.; data curation, J.L.; writing—original draft preparation, J.L.; writing—review and editing, Y.Y.; visualization, Y.W.; supervision, J.L.; project administration, Y.Y.; funding acquisition, Y.Y. All authors have read and agreed to the published version of the manuscript.

Funding

This research was funded by Liaoning Province Scientific Research Funding Project, grant numbers LSNZD202002 and LSNQN202012, and the Science and Technology Program of Liaoning Province, grant number 2020020287-JH1/103-05-02.

Institutional Review Board Statement

Not applicable.

Informed Consent Statement

Not applicable.

Data Availability Statement

The data presented in this study are available on request from the corresponding author. The data are not publicly available due to the policy of the institute.

Conflicts of Interest

The authors declare no conflict of interest.

References

  1. Hossain, M.; Okubo, A.; Sugiyama, S. Effects of grassland species on decomposition of litter and soil microbial communities. Ecol. Res. 2009, 25, 255–261. [Google Scholar] [CrossRef]
  2. You, Y.M.; Wang, J.; Huang, X.M.; Tang, Z.X.; Liu, S.M.; Osbert, J.S. Relating microbial community structure to functioning in forest soil organic carbon transformation and turnover. Ecol. Evol. 2014, 4, 633–647. [Google Scholar] [CrossRef] [PubMed]
  3. Xu, Z.W.; Yu, G.R.; Zhang, X.Y.; Ge, J.P.; He, N.P.; Wang, Q.F.; Wang, D. The variations in soil microbial communities, enzyme activities and their relationships with soil organic matter decomposition along the northern slope of changbai mountain. Appl. Soil Ecol. 2015, 86, 19–29. [Google Scholar] [CrossRef]
  4. Maillard, F.; Leduc, V.; Bach, C.; Reichard, A.; Buée, M. Soil microbial functions are affected by organic matter removal in temperate deciduous forest. Soil Biol. Biochem. 2019, 133, 28–36. [Google Scholar] [CrossRef]
  5. Heijden, M.G.A.V.D.; Bardgett, R.D.; Straalen, N.M.V. The unseen majority: Soil microbes as drivers of plant diversity and productivity in terrestrial ecosystems. Ecol. Lett. 2008, 11, 296–310. [Google Scholar] [CrossRef]
  6. Urbanová, M.; Šnajdr, J.; Baldrian, P. Composition of fungal and bacterial communities in forest litter and soil is largely determined by dominant trees. Soil Biol. Biochem. 2015, 84, 53–64. [Google Scholar] [CrossRef]
  7. Doran, R. Soil microbiology and biochemistry. J. Range Manag. 2014, 51, 254. [Google Scholar] [CrossRef]
  8. Gutknecht, J.; Henry, H.; Balser, T.C. Inter-annual variation in soil extra-cellular enzyme activity in response to simulated global change and fire disturbance. Pedobiologia 2010, 53, 283–293. [Google Scholar] [CrossRef]
  9. Wallenstein, M.D.; Mcnulty, S.; Fernandez, I.J.; Boggs, J.; Schlesinger, W.H. Nitrogen fertilization decreases forest soil fungal and bacterial biomass in three long-term experiments. For. Ecol. Manag. 2006, 222, 459–468. [Google Scholar] [CrossRef]
  10. Treseder, K.K. Nitrogen additions and microbial biomass: A meta-analysis of ecosystem studies. Ecol. Lett. 2008, 11, 1111–1120. [Google Scholar] [CrossRef] [Green Version]
  11. Hoogmoed, M.; Cunningham, S.C.; Baker, P.; Beringer, J.; Cavagnaro, T.R. N-fixing trees in restoration plantings: Effects on nitrogen supply and soil microbial communities. Soil Biol. Biochem. 2014, 77, 203–212. [Google Scholar] [CrossRef]
  12. Curtis, P.S. A meta-analysis of leaf gas exchange and nitrogen in trees grown under elevated carbon dioxide. Plant Cell Environ. 2010, 19, 127–137. [Google Scholar] [CrossRef]
  13. Wang, F.M.; Li, Z.A.; Xia, H.P.; Zou, B.; Li, N.Y.; Liu, J.; Zhu, W.X. Effects of nitrogen-fixing and non-nitrogen-fixing tree species on soil properties and nitrogen transformation during forest restoration in southern China. J. Soil Sci. Plant Nutr. 2010, 56, 297–306. [Google Scholar] [CrossRef]
  14. Le, J.J.; Su, Y.; Luo, Y.; Geng, F.Z.; Liu, X.J. Effects of enclosure on leaves of four plants and soil stoichiometry in an alpine grassland of Tianshan mountains. Acta Ecol. Sin. 2020, 40, 1621–1628. [Google Scholar]
  15. Zeng, Q.X.; Zhang, Q.F.; Lin, K.M.; Zhou, J.C.; Yuan, X.C.; Mei, K.C.; Wu, Y.; Cui, J.Y.; Xu, J.G.; Chen, Y.M. Enzyme stoichiometry evidence revealed that fiveyears nitrogen addition exacerbated the carbon and phosphorus limitation of soil microorganismsin a Phyllostachys pubescens forest. Chin. J. Appl. Ecol. 2021, 32, 521–528. [Google Scholar]
  16. Zhou, J.C.; Liu, X.F.; Zheng, Y.; Ji, Y.; Li, X.F.; Xu, P.C.; Chen, Y.M.; Yang, Y.C. Effects of nitrogen deposition on soil microbial biomassand enzyme activities in Castanopsis carlesii natural forests in subtropical regions. Acta Ecol. Sin. 2017, 37, 127–135. [Google Scholar]
  17. Bellingham, P.J.; Walker, L.R.; Wardle, D.A. Differential facilitation by a nitrogen-fixing shrub during primary succession influences relative performance of canopy tree species. J. Ecol. 2010, 89, 861–875. [Google Scholar] [CrossRef]
  18. He, X.H.; Xu, M.G.; Qiu, G.Y.; Zhou, J.B. Use of 15N stable isotope to quantify nitrogen transfer between mycorrhizal plants. J. Plant Ecol. 2009, 2, 107–118. [Google Scholar] [CrossRef]
  19. Schipanski, M.E.; Drinkwater, L.E. Nitrogen fixation in annual and perennial legume-grass mixtures across a fertility gradient. Plant Soil 2012, 357, 147–159. [Google Scholar] [CrossRef]
  20. Png, G.K.; Lambers, H.; Kardol, P.; Turner, B.L.; Wardle, D.A.; Laliberté, E. Biotic and abiotic plant–soil feedback depends on nitrogen-acquisition strategy and shifts during long-term ecosystem development. J. Ecol. 2019, 107, 142–153. [Google Scholar] [CrossRef]
  21. Olsen, S.L.; Sandvik, S.M.; Totland, O. Influence of two n-fixing legumes on plant community properties and soil nutrient levels in an alpine. Arct. Antarct. Alp. Res. 2013, 45, 363–371. [Google Scholar] [CrossRef]
  22. Titus, J.H.; Bishop, J.G.; Moral, R.D. Propagule limitation and competition with nitrogen fixers limit conifer colonization during primary succession. J. Veg. Sci. 2014, 25, 990–1003. [Google Scholar] [CrossRef]
  23. Tang, X.M.; Zhong, R.C.; Jiang, J.; He, L.Q.; Huang, Z.P.; Shi, G.Y.; Wu, H.N.; Liu, J.; Xiong, F.Q.; Han, Z.Q.; et al. Cassava/peanut intercropping improves soil quality via rhizospheric microbes increased available nitrogen contents. BMC Biotechnol. 2020, 28, 20. [Google Scholar] [CrossRef] [PubMed] [Green Version]
  24. Li, H.; Zhu, N.; Wang, S.; Gao, M.; Wu, Y. Dual benefits of long-term ecological agricultural engineering: Mitigation of nutrient losses and improvement of soil quality. Sci. Total Environ. 2020, 721, 137848. [Google Scholar] [CrossRef] [PubMed]
  25. Fu, Z.; Zhou, L.; Chen, P.; Du, Q.; Pang, T.; Song, C.; Wang, X.; Liu, W.; Yang, W.; Yong, T. Effects of maize-soybean relay intercropping on crop nutrient uptake and soil bacterial community. J. Integr. Agr. 2019, 18, 2006–2018. [Google Scholar] [CrossRef]
  26. Forrester, D.I.; Bauhus, J.; Cowie, A.L. Growth dynamics in a mixed-species plantation of Eucalyptus globulus and Acacia mearnsii. For. Ecol. Manag. 2004, 193, 81–95. [Google Scholar] [CrossRef]
  27. Kelty, M. The role of species mixture in plantation forestry. For. Ecol. Manag. 2006, 233, 195–204. [Google Scholar] [CrossRef]
  28. Garcias-Bonet, N.; Arrieta, J.M.; Duarte, C.M.; Marbà, N. Nitrogen-fixing bacteria in mediterranean seagrass (posidonia oceanica) roots. Aquat. Bot. 2016, 131, 57–60. [Google Scholar] [CrossRef]
  29. Zhan, X.; Clab, C.; Cza, C.; Yang, Y.; Wvdwb, C.; Fza, C. Intercropping maize and soybean increases efficiency of land and fertilizer nitrogen use; a meta-analysis. Field Crop Res. 2020, 246, 107661. [Google Scholar]
  30. Cong, W.F.; Hoffland, E.; Li, L.; Six, J.; Sun, J.H.; Bao, X.G.; Zhang, F.S.; Werf, V.D.W. Intercropping enhances soil carbon and nitrogen. Glob. Chang. Biol. 2015, 21, 1715–1726. [Google Scholar] [CrossRef]
  31. Hu, Y.L.; Mgelwa, A.S.; Singh, A.N.; Zeng, D.H. Differential responses of the soil nutrient status, biomass production, and nutrient uptake for three plant species to organic amendments of placer gold mine-tailing soils. Land Degrad. Dev. 2018, 29, 2836–2845. [Google Scholar] [CrossRef]
  32. Wang, L.; Wang, N.; Ji, G. Responses of biomass allocation and photosynthesis in mulberry to Pb-contaminated soil. Acta Physiol. Plant 2022, 44, 1–9. [Google Scholar] [CrossRef]
  33. Xu, H.Y.; Gao, S.; Song, G.L.; Han, L.B. Effect of rocky slopes gradient on root growth and pull-out resistance of Lespedeza bicolor Turcz plants. In Proceedings of the Beijing International Symposium Land Reclamation & Ecological Restoration, Beijing, China, 16–19 October 2014. [Google Scholar]
  34. Claesson, M.J.; O’Sullivan, O.; Wang, Q.; Nikkilä, J.; Marchesi, J.R.; Smidt, H.; De Vos, W.M.; Paul Ross, R.; O’Toole, P.W. Comparative Analysis of Pyrosequencing and a Phylogenetic Microarray for Exploring Microbial Community Structures in the Human Distal Intestine. PLoS ONE 2009, 4, e6669. [Google Scholar] [CrossRef] [PubMed]
  35. White, T.J.; Bruns, T.; Lee, S.; Taylor, J. Amplification and direct sequencing of fungal ribosomal RNA genes for phylogenetics. In PCR Protocols: A Guide to Methods and Applications; Innis, M.A., Gelfand, D.H., Sninsky, J.J., White, T.J., Eds.; Academic Press: San Diego, CA, USA, 1994; pp. 315–322. [Google Scholar]
  36. Martin, M. Cutadapt removes adapter sequences from high-throughput sequencing reads. EMBnet 2011, 17, 1. [Google Scholar] [CrossRef]
  37. Callahan, B.J.; Mcmurdie, P.J.; Rosen, M.J.; Han, A.W.; Johnson, A.J.; Holmes, S.P. Dada2: High-resolution sample inference from illumina amplicon data. Nat. Methods 2016, 13, 581–583. [Google Scholar] [CrossRef]
  38. Katoh, K. Mafft: A novel method for rapid multiple sequence alignment based on fast fourier transform. Nucleic Acids Res. 2002, 30, 3059–3066. [Google Scholar] [CrossRef]
  39. Price, M.N.; Dehal, P.S.; Arkin, A.P. FastTree: Computing large minimum evolution trees with profiles instead of a distance matrix. Mol. Biol. Evol. 2009, 26, 1641–1650. [Google Scholar] [CrossRef]
  40. Zaura, E.; Keijser, B.J.F.; Huse, S.M.; Crielaard, W. Defining the healthy “core microbiome” of oral microbial communities. BMC Microbiol. 2009, 9, 1–12. [Google Scholar] [CrossRef]
  41. Liu, J.; Wei, Y.; Yin, Y.; Zhu, K.; Liu, Y.; Ding, H.; Lei, J.; Zhu, W.; Zhou, Y. Effects of Mixed Decomposition of Pinus sylvestris var. mongolica and Morus alba Litter on Microbial Diversity. Microorganisms 2022, 10, 1117. [Google Scholar] [CrossRef]
  42. Erwin, D.H.; Laflamme, M.; Tweedt, S.M.; Sperling, E.A.; Pisani, D.; Peterson, K.J. The Cambrian conundrum: Early divergence and later ecological success in the early history of animals. Science 2011, 334, 1091–1097. [Google Scholar] [CrossRef]
  43. Binkley, D.; Senock, R.; Bird, S.; Cole, T.G. Twenty years of stand development in pure and mixed stands of Eucalyptus saligna and nitrogen-fixing Facaltaria moluccana. For. Ecol. Manag. 2003, 182, 93–102. [Google Scholar] [CrossRef]
  44. Forrester, D.I.; Bauhus, J.; Cowie, A.L.; Vanclay, J.K. Mixed-species plantations of eucalyptus with nitrogen-fixing trees: A review. For. Ecol. Manag. 2006, 233, 211–230. [Google Scholar] [CrossRef]
  45. Soares, G.M.; Silva, L.D.; Higa, A.; Simon, A.A.; José, J.S. Artificial Neural Networks (Ann) For Height Estimation in A Mixed-Species Plantation of Eucalyptus Globulus Labill and Acacia Mearnsii De Wild. Rev. Arvore 2021, 45, e4512. [Google Scholar] [CrossRef]
  46. Crowther, J.; Zimmer, H.; Thi, H.L.; Quang, T.L.; Nichols, J.D. Forestry in vietnam: The potential role for native timber species. For. Policy Econ. 2020, 116, 102182. [Google Scholar] [CrossRef]
  47. Aosaar, J.; Varik, M.; Lõhmus, K.; Ostonen, I.; Becker, H.; Uri, V. Long-term study of above- and below-ground biomass production in relation to nitrogen and carbon accumulation dynamics in a grey alder (Alnus incana (L.) moench) plantation on former agricultural land. Eur. J. For. Res. 2013, 132, 737–749. [Google Scholar] [CrossRef]
  48. Resh, S.C.; Binkley, D.; Parrotta, J.A. Greater soil carbon sequestration under nitrogen-fixing trees compared with eucalyptus species. Ecosystems 2002, 5, 217–231. [Google Scholar] [CrossRef]
  49. Vitousek, P. Ecosystem science and human-environment interactions in the Hawaiian archipelago. J. Ecol. 2006, 94, 510–521. [Google Scholar] [CrossRef]
  50. Yokobe, T.; Hyodo, F.; Tokuchi, N. Volcanic deposits affect soil nitrogen dynamics and fungal–bacterial dominance in temperate forests. Soil Biol. Biochem. 2020, 150, 108011. [Google Scholar] [CrossRef]
  51. Wan, X.H.; Huang, Z.Q.; He, Z.M.; Yu, Z.P.; Wang, M.H.; Davis, M.R.; Yang, Y.S. Soil C:N ratio is the major determinant of soil microbial community structure in subtropical coniferous and broadleaf forest plantations. Plant Soil 2015, 387, 103–116. [Google Scholar] [CrossRef]
  52. Huang, X.M.; Liu, S.R.; Wang, Z.D.; You, Y.M. Changes of soil microbial biomass carbon and community composition through mixing nitrogen-fixing species with Eucalyptus urophylla in subtropical China. Soil Biol. Biochem. 2014, 73, 42–48. [Google Scholar] [CrossRef]
  53. Wu, J.P.; Liu, Z.F.; Wang, X.L.; Sun, Y.X.; Zhou, L.X.; Lin, Y.B.; Fu, S.L. Effects of understory removal and tree girdling on soil microbial community composition and litter decomposition in two Eucalyptus plantations in South China. Funct. Ecol. 2011, 25, 921–931. [Google Scholar] [CrossRef]
  54. Caracciolo, A.B.; Bustamante, M.A.; Nogues, I.; Lenola, M.D.; Luprano, M.L.; Grenni, P. Changes in microbial community structure and functioning of a semiarid soil due to the use of anaerobic digestate derived composts and rosemary plants. Geoderma 2015, 245–246, 89–97. [Google Scholar] [CrossRef]
  55. Zou, Y.; Liang, N.; Zhang, X.; Han, C.; Nan, X. Functional differentiation related to decomposing complex carbohydrates of intestinal microbes between two wild zokor species based on 16srrna sequences. BMC Vet. Res. 2021, 17, 2–12. [Google Scholar] [CrossRef] [PubMed]
  56. Bardgett, R.D.; Van, D.P. Belowground biodiversity and ecosystem functioning. Nature 2014, 515, 505–511. [Google Scholar] [CrossRef]
  57. Fierer, N. Embracing the unknown: Disentangling the complexities of the soil microbiome. Nat. Rev. Microbiol. 2017, 15, 579–590. [Google Scholar] [CrossRef]
  58. Zhao, C.; Zhang, Y.; Liu, X.; Ma, X.; Wang, H. Comparing the effects of biochar and straw amendment on soil carbon pools and bacterial community structure in degraded soil. J. Soil Sci. Plant Nutr. 2019, 20, 751–760. [Google Scholar] [CrossRef]
  59. Xun, W.B.; Huang, T.; Zhao, J.; Ran, W.; Wang, B.R.; Shen, Q.R.; Zhang, R.F. Environmental conditions rather than microbial inoculum composition determine the bacterial composition, microbial biomass and enzymatic activity of reconstructed soil microbial communities. Soil Biol. Biochem. 2015, 90, 10–18. [Google Scholar] [CrossRef]
  60. Cao, Y.; Yan, X.; Luo, H.; Jia, Z.; Jiang, X. Nitrification activity and microbial community structure in purple soils with different pH. Acta Pedol. Sin. 2018, 1, 194–202. [Google Scholar]
  61. Wang, J.; Liao, L.R.; Ye, Z.C.; Liu, H.F.; Zhang, C.; Zhang, L.; Liu, G.B.; Wang, G.L. Different bacterial co-occurrence patterns and community assembly between rhizosphere and bulk soils under N addition in the plant-soil system. Plant Soil 2020, 471, 697–713. [Google Scholar] [CrossRef]
  62. Zeng, J.; Liu, X.; Song, L.; Lin, X.; Chu, H. Nitrogen fertilization directly affects soil bacterial diversity and indirectly affects bacterial community composition. Soil Biol. Biochem. 2016, 92, 41–49. [Google Scholar] [CrossRef]
  63. Zeng, J.; Liu, X.J.; Song, L.; Lin, X.G.; Zhang, H.Y.; Shen, C.C.; Chu, H.Y. Effects of changes in straw chemical properties and alkaline soils on bacterial communities engaged in straw decomposition at different temperatures. Sci. Rep. 2016, 6, 1–12. [Google Scholar]
  64. Yang, Y.L.; Xu, M.; Zou, X.; Chen, J.; Zhang, J. Effects of different vegetation types on soil bacterial community characteristics in the hilly area of Qianzhong Mountai. J. Ecol. Rural. Environ. 2021, 37, 518–525. [Google Scholar]
  65. Kazerooni, E.A.; Rethinasamy, V.; Al-Sadi, A.M. Talaromyces pinophilus inhibits Pythium and Rhizoctonia-induced damping-off of cucumber. J. Plant Pathol. 2018, 101, 377–383. [Google Scholar] [CrossRef]
  66. Chen, X.P.; Yang, J.N.; Zhu, X.; Liang, X.; Lei, Y.R.; He, C.Q. N-fixing trees in wetland restoration plantings: Effects on nitrogensupply and soil microbial communities. Environ. Sci. Pollut. R 2016, 23, 24749–24757. [Google Scholar] [CrossRef]
  67. Zuazo, V.; Pleguezuelo, C.; Tavira, S.C.; Martínez, J.R.F. Linking soil organic carbon stocks to land-use types in a Mediterranean agroforestry landscape. J. Agr. Sci. Tech. 2014, 16, 667–679. [Google Scholar]
  68. Varma, V.; Iyengar, S.B.; Sankaran, M. Effects of nutrient addition and soil drainage on germination of n-fixing and non-n-fixing tropical dry forest tree species. Plant Ecol. 2016, 217, 1–12. [Google Scholar] [CrossRef]
  69. Cech, P.G.; Venterink, H.O.; Edwards, P.J. N and P cycling in tanzanian humid savanna: Influence of herbivores, fire, and N2-fixation. Ecosystems 2010, 13, 1079–1096. [Google Scholar] [CrossRef]
  70. Macedo, M.O.; Resende, A.S.; Garcia, P.C.; Boddey, R.M.; Jantalia, C.P.; Urquiaga, S.; Campello, E.F.C.; Franco, A.A. Changes in soil C and N stocks and nutrient dynamics 13 years after recovery of degraded land using leguminous nitrogen-fixing trees. For. Ecol. Manag. 2008, 255, 1516–1524. [Google Scholar] [CrossRef]
  71. Waldrop, M.P.; Zak, D.R.; Sinsabaugh, R.L.; Gallo, M.; Lauber, C. Nitrogen deposition modifies soil carbon storage through changes in microbial enzymatic activity. Ecol. Appl. 2004, 14, 1172–1177. [Google Scholar] [CrossRef]
  72. Zeglin, L.H.; Stursova, M.; Sinsabaugh, R.L.; Collins, S.L. Microbial responses to nitrogen addition in three contrasting grassland ecosystems. Oecologia 2007, 154, 349–359. [Google Scholar] [CrossRef]
  73. Deforest, J.L.; Zak, D.R.; Pregitzer, K.S.; Burton, A.J. Atmospheric nitrate deposition, microbial community composition, and enzyme activity in northern hardwood forests. Soil Sci. Soc. Am. J. 2004, 68, 132–138. [Google Scholar] [CrossRef]
  74. Gao, S.; Deluca, T.H.; Cleveland, C.C. Biochar additions alter phosphorus and nitrogen availability in agricultural ecosystems: A meta-analysis. Sci. Total Environ. 2019, 654, 463–472. [Google Scholar] [CrossRef] [PubMed]
  75. Brockett, B.F.T.; Prescott, C.E.; Grayston, S.J. Soil moisture is the major factor influencing microbial community structure and enzyme activities across seven biogeoclimatic zones in western Canada. Soil Biol. Biochem. 2012, 44, 9–20. [Google Scholar] [CrossRef]
  76. Li, Y.; Zhou, C.; Qiu, Y.; Tigabu, M.; Ma, X. Effects of biochar and litter on carbon and nitrogen mineralization and soil microbial community structure in a china fir plantation. J. For. Res. 2019, 30, 1913–1923. [Google Scholar] [CrossRef]
Figure 1. The specific location of the pot experiment.
Forests 13 01345 g001
Figure 2. Venn diagram shows three different samples of unique and shared OTUs soil microorganisms. (a): Endemic and shared OTUs of soil bacteria from three different samples; (b): Endemic and shared OTUs of soil fungi from three different samples. Ma: Morus alba; Lb: Lespedeza bicolor; MaLb: Morus alba-Lespedeza bicolor.
Forests 13 01345 g002
Figure 3. Soil microbial alpha diversity index in Ma, MaLb, and Lb. (a): Analysis of α diversity of soil bacterial community; (b): Analysis of α diversity of soil fungal community. Ma: Morus alba; Lb: Lespedeza bicolor; MaLb: Morus alba-Lespedeza bicolor. * indicates significant difference at 0.05 level.
Forests 13 01345 g003
Figure 4. The relative content of species composition at the soil microbial phylum-level in different planting types (others were shown). (a): Relative content of bacterial phylum-level species composition; (b): Relative content of fungal phylum-level species composition. Ma: Morus alba; Lb: Lespedeza bicolor; MaLb: Morus alba-Lespedeza bicolor.
Forests 13 01345 g004
Figure 5. Hierarchical clustering analysis of soil microbial composition of different planting types at the genus level. (a): Hierarchical cluster analysis at genus level of bacteria; (b): Hierarchical cluster analysis at genus level of fungi. Ma: Morus alba; Lb: Lespedeza bicolor; MaLb: Morus alba-Lespedeza bicolor.
Forests 13 01345 g005
Figure 6. The relative content of species composition at the soil microbial genus level in different planting types (others were not shown). (a): Relative content of bacterial genus-level species composition; (b): Relative content of fungal genus-level species composition. Ma: Morus alba; Lb: Lespedeza bicolor; MaLb: Morus alba-Lespedeza bicolor.
Forests 13 01345 g006
Figure 7. Nonmetric multidimensional scale analysis (NMDS) of microbial community structure in different soil samples. (a): soil bacterial communities; (b): soil fungal communities. Ma: Morus alba; Lb: Lespedeza bicolor; MaLb: Morus alba-Lespedeza bicolor.
Forests 13 01345 g007
Table 1. Physical and chemical properties of soil under different planting methods.
Tree SpeciespH ValueTotal N/g kg−1Total C/g kg−1Total C/Total NTotal P/mg kg−1
MaLb7.94 ± 0.017 aA0.53 ± 0.003 aA7.60 ± 0.142 bB14.43 ± 0.350 bA4.93 ± 0.268 bB
Ma7.88 ± 0.023 aA0.46 ± 0.009 bB4.38 ± 0.123 cC9.80 ± 0.030 cB2.23 ± 0.074 cC
Lb7.89 ± 0.003 aA0.54 ± 0.006 aA8.30 ± 0.047 aA15.38 ± 0.249 aA7.12 ± 0.352 aA
Data was expressed as mean ± standard deviation (n = 4). Capital letters in the same row represent a significant difference (p < 0.01), and lower-case letters mean significant differences (p < 0.05). Ma: Morus alba; Lb: Lespedeza bicolor; MaLb: Morus alba-Lespedeza bicolor.
Table 2. The relationship between soil physicochemical properties and α-diversity of the bacterial community in different planting types.
Chao1Goods_CoverageObserved_SpeciesPielou_eShannonSimpson
pH value0.281−0.3050.308−0.3900.133−0.200
Total N0.253−0.2700.258−0.4940.146−0.282
Total C0.334−0.3500.326−0.5150.197−0.190
Total C/total N0.376−0.3920.365−0.5310.234−0.158
Total P0.132−0.1430.111−0.3510.006−0.189
Table 3. The relationship between soil physicochemical properties and α-diversity of the fungal community in different planting types.
Chao1Goods_CoverageObserved_SpeciesPielou_eShannonSimpson
pH value−0.230−0.760 **−0.350−0.614 *−0.595 *−0.444
Total N−0.630 *−0.253−0.675 *−0.616 *−0.649 *−0.426
Total C−0.647 *−0.286−0.697 *−0.656 *−0.688 *−0.430
Total C/total N−0.638 *−0.307−0.691 *−0.669 *−0.698 *−0.436
Total P−0.613 *−0.046−0.624 *−0.487−0.528−0.281
** indicates a significant difference at the 0.01 level. * indicates significant difference at 0.05 level.
Table 4. Correlation between soil physicochemical properties and bacterial phyla levels in different planting types.
pH ValueTotal NTotal CTotal C/Total NTotal P
Actinobacteria0.2460.2450.1470.133−0.025
Proteobacteria−0.013−0.0780.0570.0750.172
Acidobacteria−0.234−0.128−0.064−0.0640.116
Chloroflexi0.0930.5750.4930.4910.452
Firmicutes−0.525−0.852 **−0.921 **−0.935 **−0.855 **
Gemmatimonadetes0.138−0.452−0.339−0.313−0.313
Bacteroidetes−0.0230.4030.5200.5340.663 *
Rokubacteria−0.450−0.454−0.521−0.548−0.367
Nitrospirae−0.185−0.788 **−0.700 *−0.658 *−0.625 *
Patescibacteria−0.2880.1950.2020.2020.273
Ascomycota0.0850.652 *0.604 *0.588 *0.613 *
Mortierellomycota0.2720.633 *0.586 *0.5650.451
Basidiomycota−0.284−0.848 **−0.853 **−0.853 **−0.810 **
Zoopagomycota0.3640.4990.602 *0.634 *0.572
The bacterial phylum level listed the top 10 relative content, and the fungal phylum level listed the relative content >1%. ** indicates a significant difference at the 0.01 level. * indicates significant difference at 0.05 level.
Publisher’s Note: MDPI stays neutral with regard to jurisdictional claims in published maps and institutional affiliations.

