Abstract
The NAC gene family is of great value for plant stress resistance and development. In this study, five NAC genes with a typical NAM domain were isolated from Salix psammophila, which is a stress-resistant willow endemic to western China. Two hundred sixty-two NAC genes from Salix psammophila, Salix purpurea, and Arabidopsis were used to construct the phylogenetic tree to examine the phylogenetic relationship. Five NAC genes in Salix psammophila were the focus of bioinformatics analysis and conserved structural domain analysis. The SpsNAC005 gene was overexpressed in Populus hopeiensis, and the transgenic lines were subjected to salt and simulated drought stress to analyze their phenotype changes and tolerance to stress. The results showed that transgenic poplar height and leaf area increased by 29.73% and 76.36%, respectively, compared with those of wild-type plants. Under stress treatment, the height growth rates and ground diameter growth rates of the transgenic lines were significantly higher than those of the wild-type, whereas their fresh weight and dry weight were decreased compared to those of the wild-type. The SOD activities, POD activities, and Pro contents of the transgenic plants were significantly increased, and the accumulation of MDA was significantly lower than that in the wild-type, and the transgenic lines showed clear tolerance to salt and drought. The expressions of the SOS1, MPK6, HKT1, and P5CS1 genes were downregulated in the transgenic lines. The expression of the PRODH1 gene was downregulated in the transgenic lines. These results indicate that overexpression of the SpsNAC005 gene in transgenic plants can promote plant growth and development and improve tolerance to salt and drought.
1. Introduction
NAC (No apical meristem (NAM), Arabidopsis transcription activation factor (ATAF), Cup-shaped cotyledon (CUC)) transcription factors have an important regulatory role in the processes of plant growth, development and defensive responses. The first genes identified in the NAC family were ATAF1 and ATAF2 in 1993 [1]. NAM was cloned from petunia in 1996 [2], followed by the discovery of the CUC2 genes in Arabidopsis [3]. The NAC structural domain is a sequence structure unique to the NAC transcription factor family; it consists of approximately 160 amino acids and is a highly conserved structural domain located at the N-terminal end with the function of binding to DNA or proteins [4]. The NAC structural domains are generally composed of five structural subdomains, A, B, C, D, and E; three substructural domains, A, C, and D, are highly conserved, whereas the B and E substructural domains are less conserved [5].The C-terminus of NAC protein also has a highly differentiated transcriptional regulatory region with transcriptional activation or repression activity, which determines its functional differences, enabling NAC transcription factors to regulate plant growth and development, the formation of meristems and border organs, lateral root development, plant senescence, biotic and abiotic stress responses [6], cell wall formation, and apoptosis [7]. The NAC transcription factor family in several species, including Arabidopsis thaliana, Oryza sativa, and Populus trichocarpa, has been systematically analyzed. Functional differences among NAC gene family members were assessed using comprehensive expression profiling [8,9].
Responding to abiotic stress is one of the important functions of NAC transcription factors. Ectopic expression of the HaNAC1 gene in Arabidopsis resulted in a significant increase in proline content and enhanced drought resistance [10]. The transcriptional regulator ANAC032 positively regulates leaf senescence by regulating the production of reactive oxygen species and can promote the production of H2O2 under auxin and salt stress [11]. In addition, ANAC032 negatively regulates the expression of anthocyanin biosynthesis genes in Arabidopsis in response to abiotic stresses such as high light, salinity, and oxidative stress [12]. The CaNAC23 gene cloned from Capsicum annuum was significantly induced to express under drought and salt stress [13]. The expression of the MfNAC37 gene in Medicago falcata under salt stress was increased in three tissue parts of roots, stems, and leaves [14]. Overexpression of the MdNAC1 gene in apple (Malus domestica) enhances the activity of plant photosynthesis and ROS scavenging enzymes, making apple plants tolerant to drought stress [15]. In rice, overexpression of the SNAC1 gene increased seed setting by 21–34% under drought conditions and also improved salt tolerance in rice [16].
Salix psammophila C. Wang et Chang Y. Yang is an important wind break and sand fixation shrub species in western China, and it has a wide range of adaptation and strong resistance to adversity [17]. S. psammophila plays a vital role in vegetation restoration and afforestation, especially in sandy areas of northwest China. S. psammophila is not only an excellent tree species for wind prevention and sand fixation in western China, but also a pioneer tree species in arid and saline areas of northwest China, which is of great significance to maintaining the stability of the ecosystem and improving the regional ecological environment [18]. Consistently, S. psammophila interlaced through underground roots to form a strong sand-stabilizing barrier and built a protective forest belt in a short time, which improved the overall level of land desertification control [19]. Populus hopeiensis is one of the common tree species in northern China [20]. It is tolerant of soil conditions and has good adaptability. It is a tree species for soil and water conservation or timber forests. Our research group established the genetic transformation system of P. hopeiensis in the early stage. On the one hand, it is intended to be used as a model woody plant to study the gene function of woody plants. On the other hand, it is also intended to obtain transgenic lines of P. hopeiensis with stronger adaptability for future application.
2. Materials and Methods
2.1. Salix NAC Gene Family Analysis and Functional Prediction of SpsNAC005 Gene
2.1.1. Bioinformatics Analysis of Genes in Salix
The tolerance of S. psammophila to harsh environments directly proved that there were excellent resistance genes in S. psammophila. Therefore, five potential stress resistance genes, SpsNAC005, SpsNAC034, SpsNAC041, SpsNAC042, and SpsNAC120, were screened separately from S. psammophila. We obtained the sequence information on the SpsNAC005, SpsNAC034, SpsNAC041, SpsNAC042, and SpsNAC120 genes from Salix psammophila. Prosite ExPASy server (http://web.expasy.org/protparam/, accessed on 20 March 2022) was used to analyze the amino acids, molecular weight (kD), theoretical pI, instability index, and aliphatic index. Hydrophobicity was analyzed by https://web.expasy.org/protscale/, accessed on 20 March 2022) and used to predict physicochemical characteristics of the SpsNAC proteins. iLoc-LncRNA (http://lin-group.cn/server/iLoc-LncRNA/predictor.php, accessed on 22 March 2022) was used to predict subcellular localization. SignalP-5.0 (https://services.healthtech.dtu.dk/service.php?SignalP-5.0, accessed on 22 March 2022) was used to predict signal peptides. The open reading frames (ORF) of SpsNACs were determined by ORF Finder (https://www.ncbi.nlm.nih.gov/orffinder/, accessed on 24 March 2022). Clustal Omega (https://www.ebi.ac.uk/Tools/msa/clustalo/, accessed on 24 March 2022) was used for amino acid multiple sequence alignment. MEME (http://meme-suite.org/, accessed on 24 March 2022) was used for base-sequence analysis of SpsNACs by (maximum number of motifs = 7).
2.1.2. Evolutionary Tree Construction of Genes in Salix and Arabidopsis
The complete genome annotation information and sequences of Salix and Arabidopsis were obtained from the phytozome database (https://phytozome-next.jgi.doe.gov/, accessed on 26 March 2022). The Pfam database (http://pfam.xfam.org, accessed on 26 March 2022) Hidden Markov Model (HMM) was used to obtain the NAC specific structural domain and HMMER (https://www.ebi.ac.uk/Tools/hmmer/, accessed on 26 March 2022) was used to identify the NAC genes of Salix purpurea. The genes containing NAC specific structural domains were further identified using the protein conserved structural domain prediction tool SMART (http://smart.embl-heidelberg.de/, accessed on 26 March 2022), and redundant Salix purpurea NAC gene family members were manually removed. Multiple sequence alignment of NAC proteins was carried out using MAFFT online website (version 7 https://mafft.cbrc.jp/alignment/software/, accessed on 20 March 2022). The phylogenetic tree was constructed with MEGA X (MEGA X 10.2.5) using the neighbor-joining (NJ) method with 1000 bootstrap test replicates.
2.1.3. Subfamilies Analysis and Functional Prediction of SpsNAC005
The protein structural domains of SpsNAC005 sequences were analyzed using Pfam online software, and homologous genes of Salix purpurea, Populus trichocarpa, Populus deltoides, Citrus sinensis, Arabidopsis, Oryza sativa, Zea mays, and Glycine max were obtained from the phytozome database. These were compared with SpsNAC005 cloned fragments (Figure 1d) using MAFFT online software for sequence alignment using MEGA X to construct a phylogenetic tree for family analysis of SpsNAC005. The homologous structural domains of SpsNAC005, Salix purpurea (Sapur.005G052900.1), and Populus trichocarpa (Potri.005G069500.1) homologous genes were compared by MEME with the structural domain parameter of 7. The structural domain differences between them were analyzed and compared to further predict the function of SpsNAC005.
2.2. Experimental Materials and Vector Construction
Salix psammophila used in this experiment was sampled from the Germplasm Resources gene bank of S. psammophila in Ordos Dalad, the Inner Mongolia Autonomous Region of China (E 110°38′59.1″, N 40°14′15.5″). The branches of 1-year-old S.psammophila clone (11–30) were collected as experimental materials for cloning of SpsNAC005 gene. The tissue culture seedlings of P. hopeiensis were preserved by the forest genetics and breeding department of Forestry College, Inner Mongolia Agricultural University. The SpsNAC005 gene was cloned in overexpression vector pMDC32 driven by 2 × 35s promoter and transformed into P. hopeiensis [21]. Agrobacterium tumefaciens strain GV3101 carrying CaMV 35S::SpsNAC005 plasmid was stored in a refrigerator at −80 °C.
2.3. Agrobacterium-Mediated Transformation of P. hopeiensis Leaf Discs and PCR Assay
Agrobacterium tumefaciens containing the 35S::SpsNAC005 recombinant plasmid was activated and transformed into wild-type P. hopeiensis via leaf disc transformation [22].
The total DNA of resistant P. hopeiensis was extracted using the CTAB method [23], and the target gene fragments were amplified using PCR with the primers SpsNAC005-F1 (5′-ATGAAGGGAAATGGATCGGC-3′) and SpsNAC005-R1 (5′-CACCATACAGTGCCATTTCTGG-3′). The PCR amplification procedure was 94 °C for 5 min; 35 cycles of 94 °C for 30 s, 62 °C for 30 s, and 72 °C for 1 min; and then 72 °C for 7 min followed by 1% agarose gel detection after amplification. The specific primers were designed by Primer Version 5.00 (PREMIER Biosoft International, Palo Alto, CA, USA) and Primer 3 input (v. 0.4.0) (Whitehead Institute for Biomedical Research, Cambridge, MA, USA, https://bioinfo.ut.ee/primer3-0.4.0/ accessed on 26 March 2022).
2.4. Tissue Expression Specificity of SpsNAC005 in Salix psammophila and Relative Expression Level of SpsNAC005 in Overexpression Lines
RNA (TIABGEN RNA prep pure, Tiangen Biotech Co., Ltd., Beijing, China) was extracted from six different tissues of S. psammophila (leaves, roots, shoots, soft stems, semi-lignified stems, and mature stems) and reverse transcribed into cDNA (SuperScript IV First-Strand Synthesis System, Tiangen Biotech Co., Ltd., Beijing, China). The relative expression of the SpsNAC005 gene in different tissues of S. psammophila was detected by qRT-PCR. The primers were UBQ-F (5′-AAGCCCAAGAAGATCAAGCA-3′) and UBQ -R (5′-ACCACCAGCCTTCTGGTAAA-3′) [24]. The primers for SpsNAC005 gene expression analysis were SpsNAC005-F1 (5′-ATGAAGGGAAATGGATCGGC-3′) and SpsNAC005-R1 (5′-CACCATACAGTGCCATTTCTGG-3′). They were identical to the primer sequence mentioned in Section 2.3. The qRT-PCR was conducted with three replicates on a Roche Light Cycler 480 II (Roche, Shanghai, China), and the relative gene expression levels were calculated using the 2−ΔΔCt method [25].
RNA was extracted from the leaves of different overexpression lines and reverse transcribed to cDNA, and qRT-PCR was performed to detect expression of the SpsNAC005 gene in the positive lines. The primers for the quantitative detection of the SpsNAC005 gene were SpsNAC005-F1 and SpsNAC005-R1, and the primers for the internal reference gene of P. hopeiensis were PtrActin-F (5′-AAACTGTAATGGTCCTCCCTCCG-3′) and PtrActin-R (5′-AGCATCATCACAATCACTCTCCGA-3′) [24]. The PtrActin gene was used as an internal control to normalize the data, and the relative gene expression levels were calculated using the 2−ΔΔCt method.
2.5. Determination of Salt and Drought Stress and Related Indices in Overexpression Lines
2.5.1. Transplanting before Stress and Determination of Related Growth Indices
Transgenic seedlings with the same growth vigor and wild-type tissue culture seedlings of P. hopeiensis were selected for seedling refining, and a mixture of grass charcoal soil and vermiculite (2:1) was used as the substrate. The temperature of the culture chamber was 25 °C, and the light/dark cycle was 16 h/8 h. After 2 weeks, the seedlings were transferred to the greenhouse.
The plant height and ground diameter were measured by ruler and Vernier calipers on the 30th day of seedling refining, and the leaf area was measured by CAD [26] (four and five internode leaf measurements). On the 1st day before stress treatment and the 5th day after stress treatment, the plant height and ground diameter of P. hopeiensis were measured. Each treatment was repeated in three pots, and each pot was measured three times. The relative growth rates of plant height and ground diameter of P. hopeiensis during the stress period were calculated. On the 5th day of stress treatment, the fresh weight of the plant was measured with a balance, and then the plant was dried to a constant weight in a 50 °C oven.
The relative growth rates of plant height (%) = (H1 − H0)/H0 × 100%
H1: Plant height on day 5 of stress (cm)
H0: Plant height one day before stress (cm)
The relative growth rates of ground diameter (%) = (D1 − D0)/D0 × 100%
D1: Ground diameter on day 5 of stress (cm)
D0: Ground diameter one day before stress (cm)
2.5.2. Salt and Drought Treatments and Determination of SOD, POD, MDA, and Pro
The wild-type P. hopeiensis and three lines (OE-4, OE-3, and OE-1) of transgenic P. hopeiensis were each treated with one of three solutions (water, a 0.9% NaCl solution, or 10% PEG) at 30 d and 35 d, with three biological replicates of each treatment [27]. Stress was stopped when the treated plants showed signs of leaf yellowing and wilting. On day 40, mixed samples of functional leaves (3–6 leaves) with normal growth were collected, snap-frozen in liquid nitrogen, and stored at −80 °C for the subsequent determination of superoxide dismutase (SOD), peroxidase (POD), malondialdehyde (MDA), and proline (Pro); three replicate measures were made. These physiological parameters were measured using Solarbio biochemical kits (Beijing Solarbio Science & Technology Co., Ltd. Beijing, China, item numbers in order: BC0170, BC0090, BC0020, BC0290).
2.5.3. Expression Analysis of the SOS1, MPK6, HKT1, P5CS1, and PRODH1 Genes under Drought and Salt Stress
The expression of the SOS1, MPK6, HKT1, P5CS1, and PRODH1 genes under different treatments was detected via qRT-PCR using cDNA obtained by the method described in Section 2.4. The primers for gene quantification were SOS1-F1 (5′-GGCTGTTGTTGCTCTGTTGA-3′), SOS1-R1 (5′-TTATGGCACCCGAGGTAAAG-3′), MPK6-F1 (5′-CTGCAAACGTCCTGCATAGA-3′), MPK6-R1 (5′-AACACACAACCCACTGACCA-3′), HKT1-F1 (5′-TGGTTCAGTGCCTGTTGTTC-3′), and HKT1-R1 (5′-CATCCTTGCACGAGCTATCA-3′), P5CS1-F1 (5′-GTGTTGGCACCCTCTTTCAT-3′), P5CS1-R1 (5′-CATCAGCTACGTCCAGCAAA-3′), PRODH1-F1 (5′-ATGGCACGATTCAAGCCTAC-3′), PRODH1-R1 (5′-TTCAAGCATGAACGAAGCAC-3′), and the internal reference primer of P. hopeiensis genes was PtrActin. The primer sequences of the SOS1, MPK6, HKT1, P5CS1, and PRODH1 genes were designed by Primer 3 input (Whitehead Institute for Biomedical Research, MA, USA, https://bioinfo.ut.ee/primer3-0.4.0/ accessed on 26 March 2022).
2.6. Statistical Analysis
All experiments were conducted at least three times independently, and statistical significance level analysis of the data was performed using Excel 2019 (Microsoft Office, Washington, Redmond, WA, USA), F-test (two-sample ANOVA), t-test (two-sample equal/heteroskedasticity hypothesis), and one-way ANOVA for randomized block design [28]. The results of one-way ANOVA for randomized block design were labeled using lowercase letters. Other significance was designated as follows: *** p < 0.001, extremely significant; ** 0.001 ≤ p < 0.01, very significant; * 0.01 ≤ p < 0.05, significant. The tissue expression of SpsNAC005 in S. psammophila and the relative gene expression of SpsNAC005 positive lines were analyzed by one-way ANOVA for randomized block design. Data on P. hopeiensis height and leaf area, plant height growth rate, ground diameter growth rate, fresh weight, dry weight, SOD activities, POD activities, MDA contents, and Pro contents, and relative expression level of SOS1, MPK6, HKT1, P5CS1, and PRODH1 genes were tested for equality of variance with F-test before t-test.
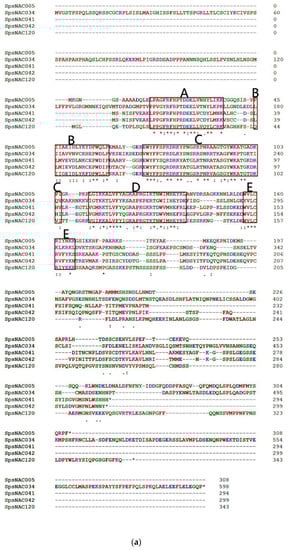
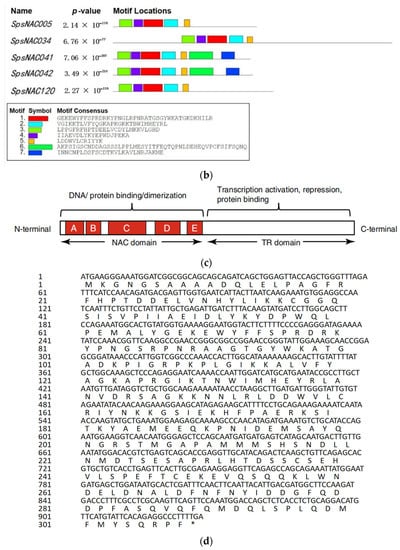
Figure 1.
The five NAC genes was highly conserved in Salix psammophila. (a) Amino acid sequence alignment of SpsNAC005, SpsNAC034, SpsNAC041, SpsNAC042, and SpsNAC120. (b) Motif analysis of five S.psammophila NAC proteins. (c) Schematic diagram of NAC transcription factor structure [29]. (d) SpsNAC005 gene sequence and its translated amino acid sequence.

3. Results
3.1. Identification of NAC Genes Obtained by Cloning in Salix psammophila
The five NAC family genes SpsNAC005, SpsNAC034, SpsNAC041, SpsNAC042, and SpsNAC120 were isolated from S. psammophila and named after the classification of NAC genes in Populus trichocarpa because of the close genetic relationship between poplar and willow [9].
These five NACs encode proteins ranging from 294 amino acids (33.09 kD) to 598 amino acids (65.82 kD), and the predicted isoelectric points varied widely from 5.32 to 8.56. The predicted aliphatic index ranged from 60.91 to 71.92. The results of the predicted subcellular localizations revealed that SpsNAC005, SpsNAC034, and SpsNAC120 all were localized in the nucleolus, nucleus, and nucleoplasm. SpsNAC041 and SpsNAC042 were localized in cytoplasm and cytosol. All five NAC sequences are unstable proteins, and all are hydrophilic proteins without signal peptides (Table 1).

Table 1.
Basic information on SpsNAC005, SpsNAC034, SpsNAC041, SpsNAC042, SpsNAC120 proteins in Salix psammophila.
Multiple sequence alignment of the five S. psammophila NAC genes revealed that the NAC proteins all contained the complete NAM structural domain (A–E) (Figure 1a). To further analyze the diversity of NAC proteins in S. psammophila, the conserved motif analysis of five SpsNAC proteins was mapped using the MEME tool (Figure 1b). The NAC transcription factor N-terminal has a NAC structural domain consisting of approximately 150 amino acid residues, and the NAC domain can be divided into five sub-structural domains [29] (Figure 1c). The highly conserved positively charged subdomains C and D bind to DNA, while subdomain A may be involved in functional dimer formation, whereas the divergent subdomains B and E may be responsible for the functional diversity of NAC genes [5]. The results showed that motif 3 (subdomain A), motif 4 (subdomain B), motif 1 (subdomain C), motif 2 (subdomain D), and motif 5 (subdomain E) were the typical structural domains of NAC proteins with highly conserved NAM structural domains. In addition, the motif 7 is the characteristic domain in SpsNAC041 and SpsNAC042.
3.2. Classification of Salix NAC Gene Family Members and Phylogenetic Tree Analysis
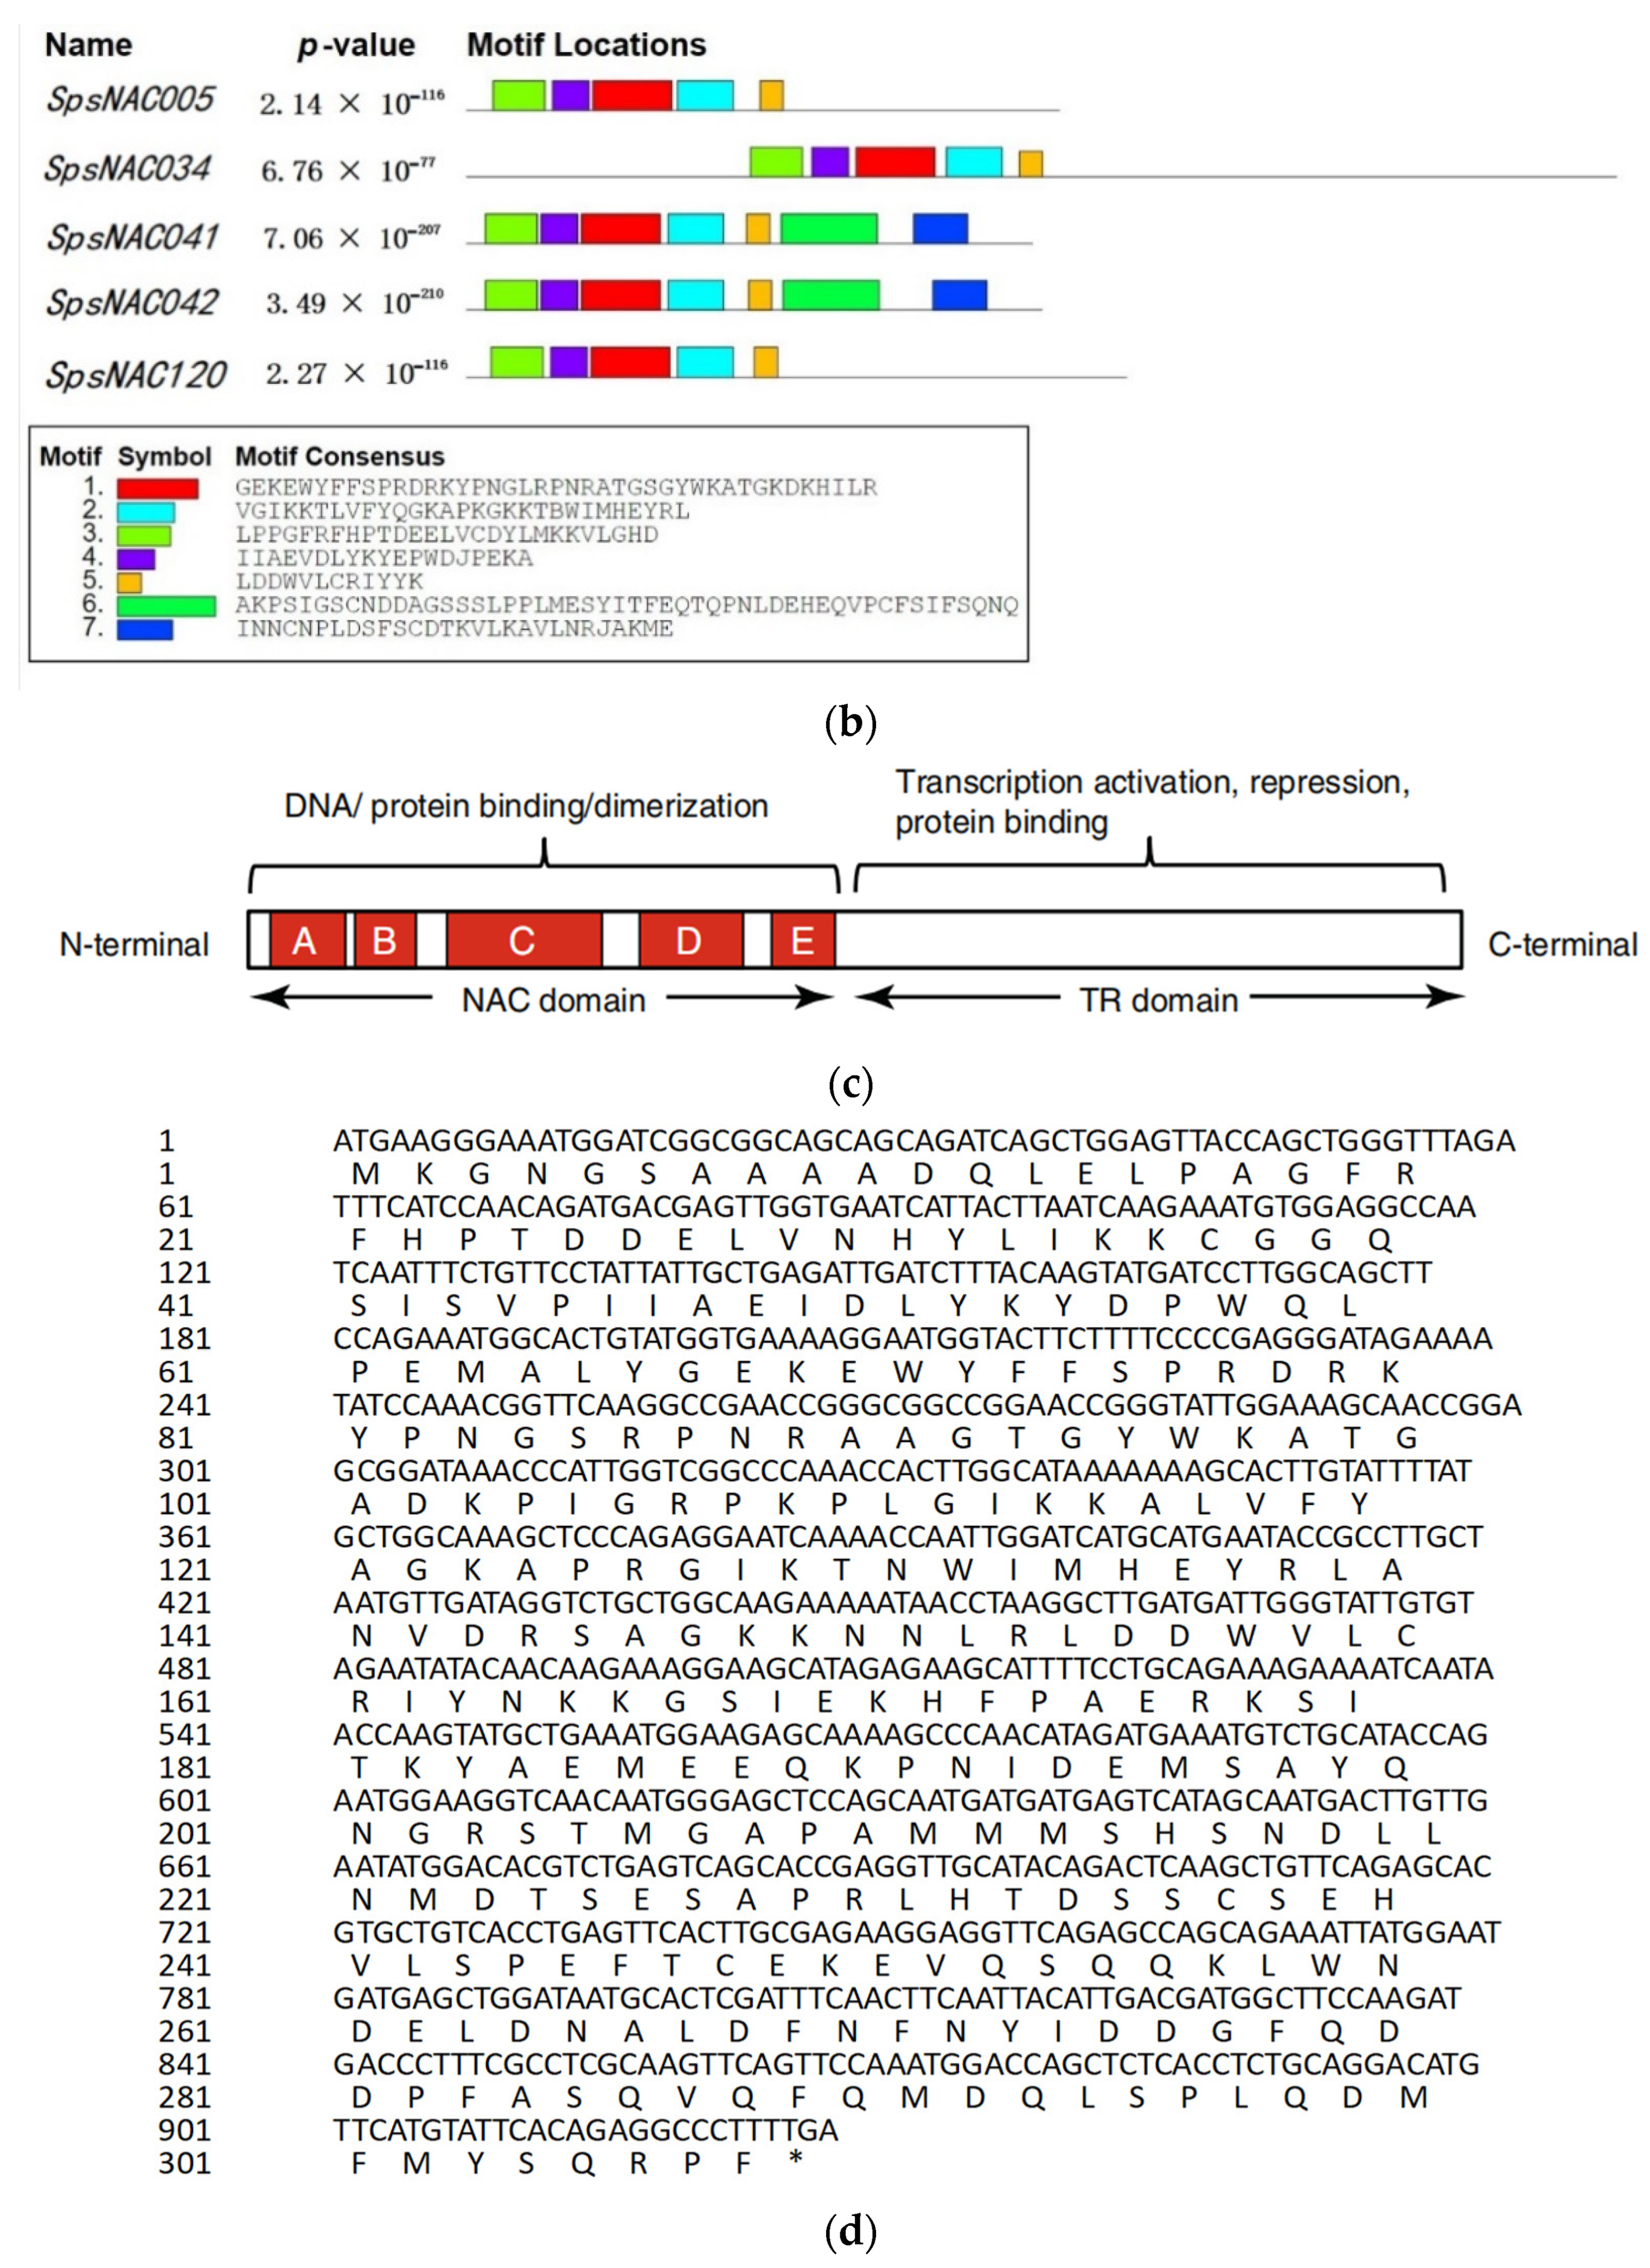
To examine the phylogenetic relationship between NAC proteins in Arabidopsis and Salix, a phylogenetic tree was constructed by sequence alignment of full-length NAC proteins (Figure 2). The phylogenetic tree divided NAC family proteins into 21 subfamilies. Among them, Sapur.014G031200.1 was distinguished from other NAC members and formed an individual clade. For simplicity, subfamily names are based on the tree topology alphabet letter series (NAC-a to NAC-r).
Figure 2.
Phylogenetic analysis of NAC proteins from Salix and Arabidopsis thaliana.
NAC members are distributed in most subfamilies, but NAC genes with the same function showed a tendency to belong to one subfamily [9,30]. The NAC-a subfamily contains 21 NAC genes of Salix. Related studies have shown that this subfamily is mainly involved in the regulation of bud organ boundary division. Arabidopsis CUC1/NAC054 and CUC2/NAC098 genes play an indispensable role in the development of bud tip meristem [3,31]. The NAC proteins associated with secondary wall formation during fiber and vascular vessel development are divided into three independent subfamilies: NAC-b, NAC-n and NAC-e. The three subfamilies contain 18, 9 and 10 Salix NAC genes, respectively. All NSTs (NST1, NST2, NST3/SND1) and VNDs (VND1–VND7) were classified as NAC-b subfamily, while SND2 and SND3 were classified as NAC-n [32,33]. Another well-characterized member, XND1 in secondary wall formation process, was assigned to the NAC-e subfamily. At5g64530 (ANAC104) encodes NAC structural domain 1 (XND1) of xylem, which negatively regulates the synthesis of secondary cell wall and programmed cell death, so as to antagonize differentiation of xylem [34]. NAC-d(I) and NAC-d(II) subfamilies play a role in the establishment of shoot apical meristem (SAM). The two subfamilies contain a total of 17 NAC genes in Salix. ATAF in NAC-d(II) subfamilies may be related to abiotic stress, and the ANAC019, ANAC055, and ANAC072 genes, are induced by abiotic stresses (ABA, drought, and salinity) and enhance tolerance to drought when ectopically overexpressed [35]. NAP is involved in regulation of leaf senescence in NAC-d(I) [36]. Membrane-associated NAC proteins that mediate cytokinin signaling or endoplasmic reticulum stress responses during cell division cluster into the NAC-i(I), NAC-i(II), and NAC-k subfamilies. A total of six NAC genes were found from NAC-i(I) and NAC-i(II) subfamilies in Salix. The NAC members named NTLs in these subfamilies were bound by membrane to ensure that plants respond to developmental changes and environmental stimuli rapidly. Related studies have shown that the plasma membrane-associated transcription factor ANAC062 (NTL6) is another important unfolded protein response (UPR) mediator in Arabidopsis plants. ANAC062 transfers endoplasmic reticulum (ER) stress signals from plasma membrane to nucleus and plays an important role in regulating the expression of UPR downstream genes [37]. The NAC-k subfamily has 15 NAC genes from Salix and NTM from Arabidopsis thaliana. Studies have shown that ANAC069 (NTM2) responds to abiotic stress physiology and regulation. At the same time, during Arabidopsis seed germination, NTM2 integrates auxin signal into salt stress signaling, which can regulate seed germination under high salinity [38]. Additionally, the NAC-f and NAC-j subfamilies only contain NAC proteins from Salix, indicating that they may be lost in Arabidopsis, but from the other side they can be acquired de novo in Salix. These gene differences may also be due to the perennial woody habit of Salix. Phylogenetic analysis also revealed NAC-1, NAC-p, and NAC-q subfamilies, which only contain Arabidopsis NAC sequences, indicating that NAC members in these subgroups were different in herbs and woody plants.
3.3. Functional Prediction of SpsNAC005
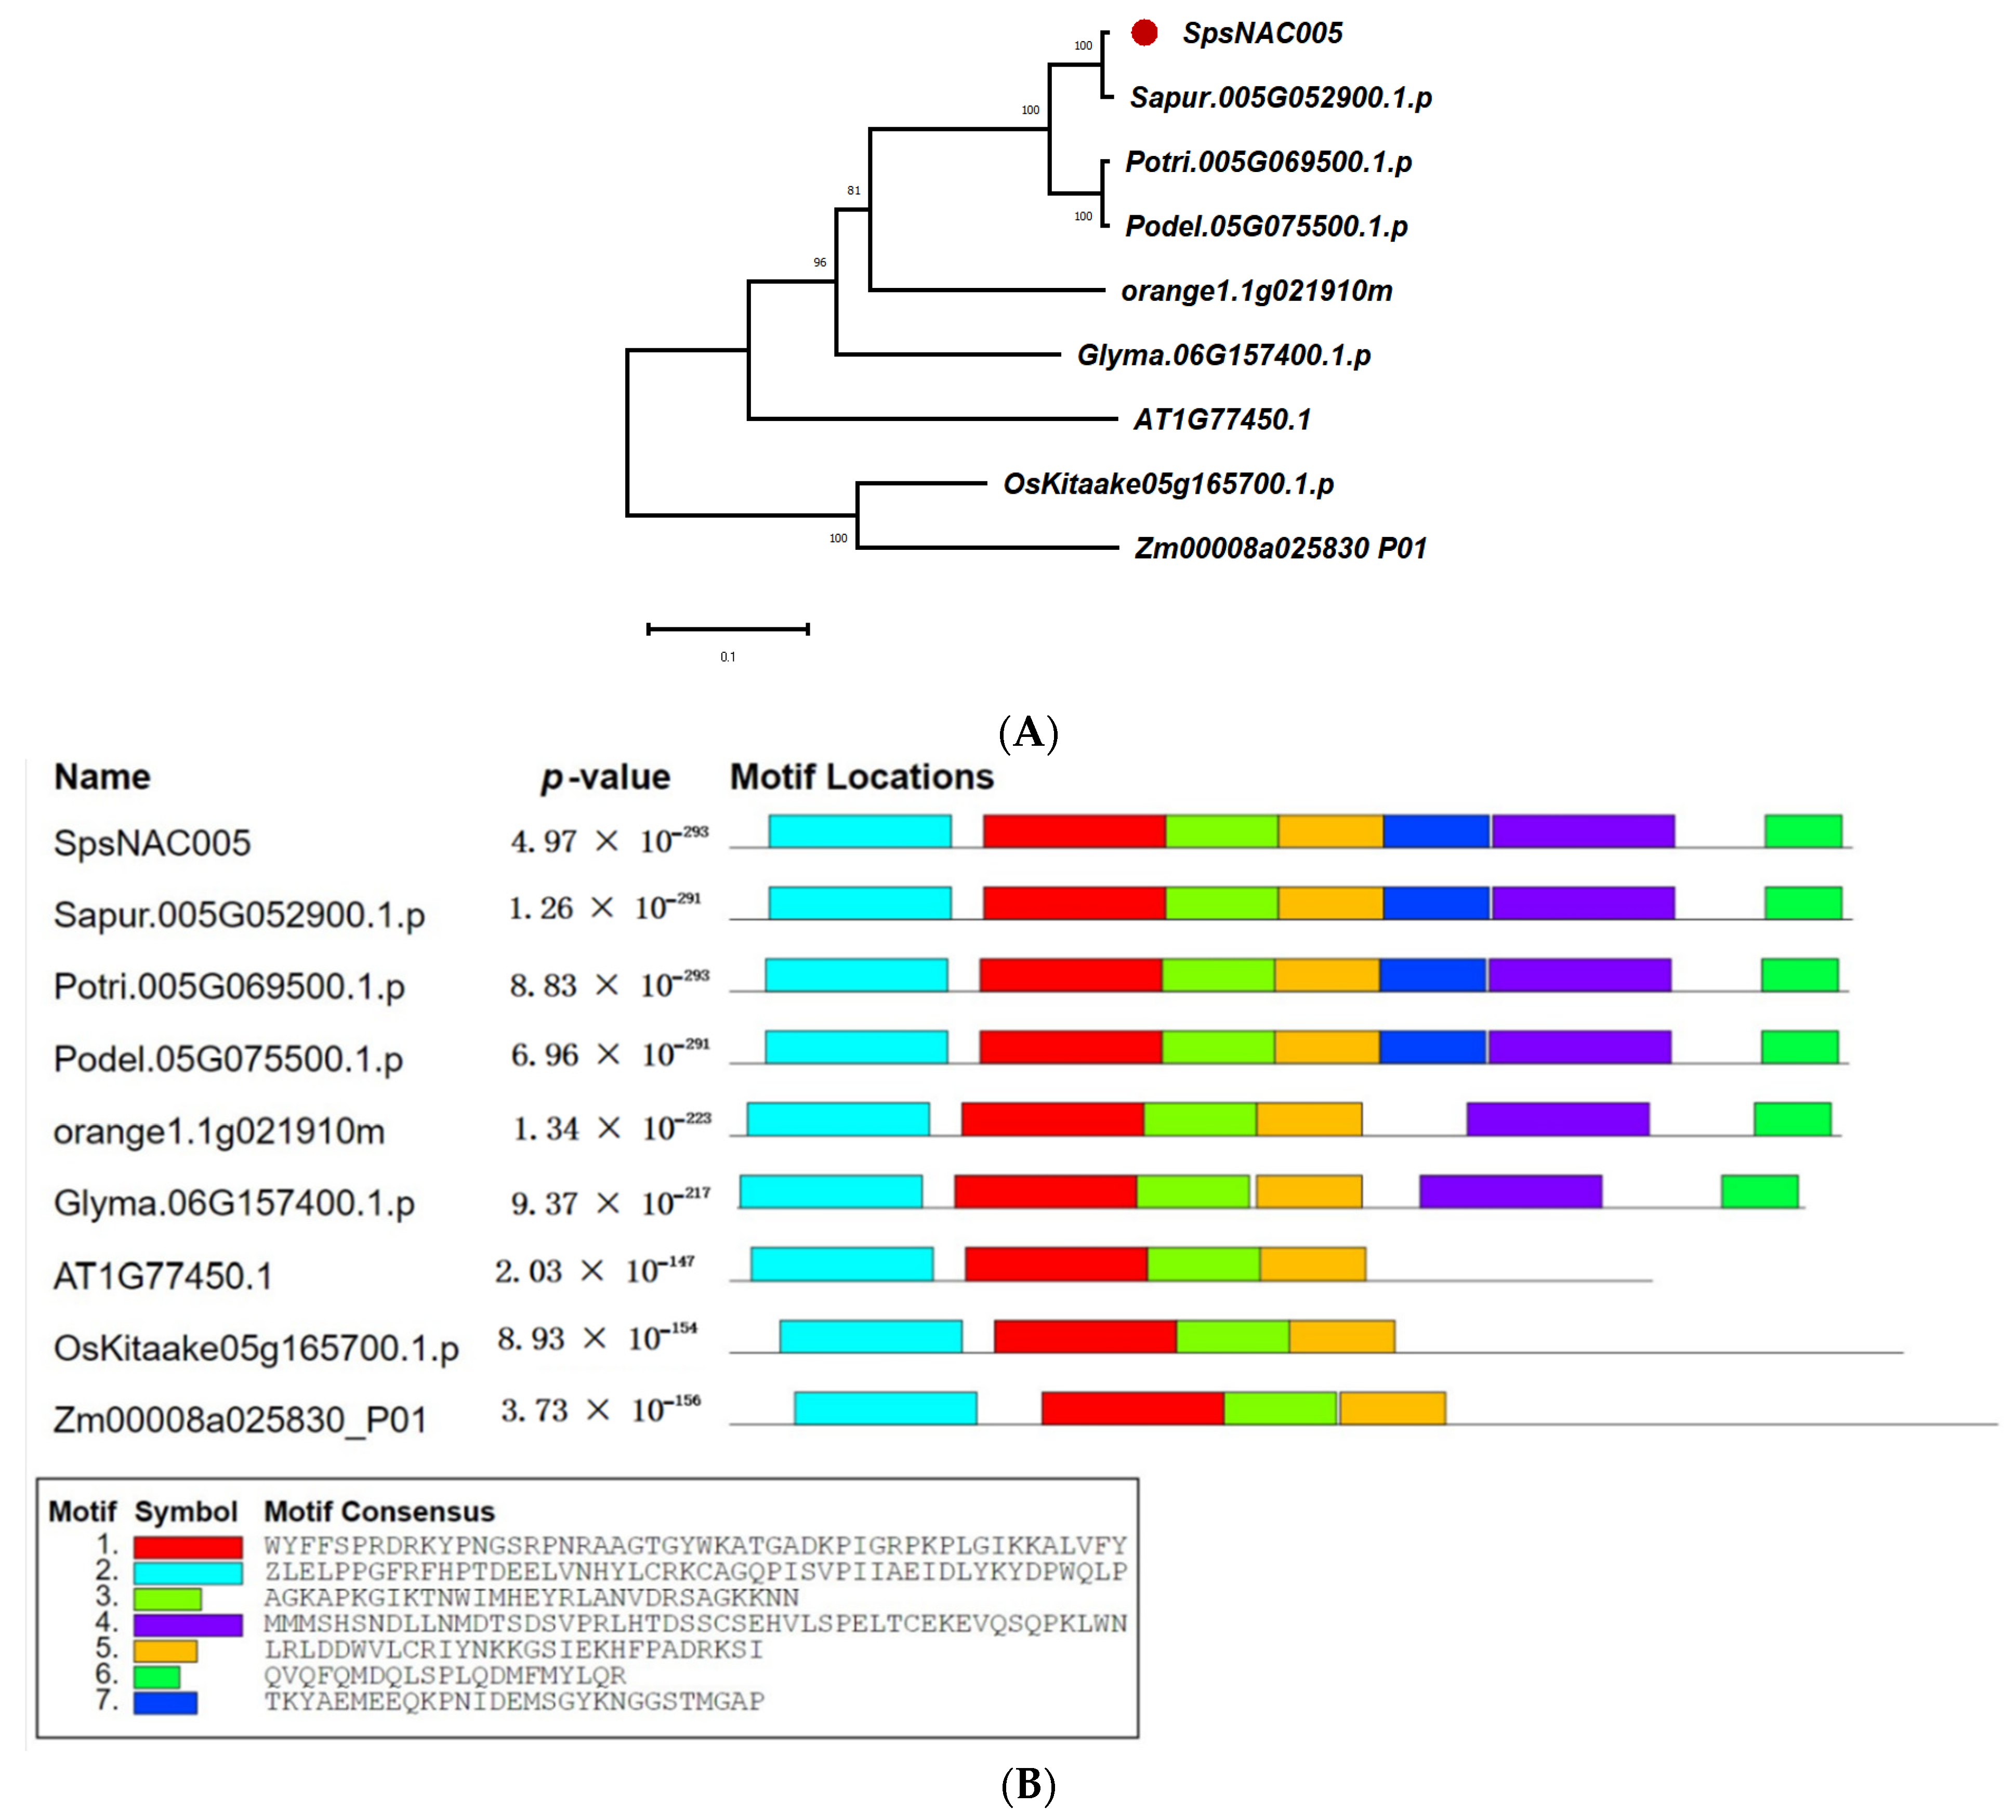
To clarify the evolutionary relationship and possible function of SpsNAC005 gene in woody plants, the homologous genes from S. psammophila, Salix purpurea, Populus trichocarpa, Populus deltoides, Citrus sinensis, Arabidopsis, Oryza sativa, Zea mays, and Glycine max were compared to construct an evolutionary tree (Figure 3A). The results showed that S. psammophila, S. purpurea, P. trichocarpa, P. deltoides, and C. sinensis were in the same evolutionary branch, G.max was in one branch, and Arabidopsis was in one branch, indicating that the homologous gene of SpsNAC005 was differentiated in woody and herbaceous plants. The comparison results for homologous structural domains indicated that the NAC protein sequences of SpsNAC005, Sapur.005G052900.1, Potri.005G069500.1 (PNAC005), and Podel.05G075500.1 have the same structural domain and the gene functions may be extremely similar (Figure 3B). Sapur.005G052900.1 is a member of the NAC-d(II) subfamily in the family evolutionary tree (Figure 2). Previous studies have shown that expression of the Arabidopsis ATAF1 gene, which is also in the NAC-d(II) subfamily, was significantly induced by high salinity and abscisic acid (ABA) [39]; furthermore, ATAF1 transgenic rice had significantly increased salt tolerance and was more insensitive to ABA, both of which could verify that ATAF1 plays an important role in response to salt stress. Through the functional analysis of related genes, it was predicted that SpsNAC005 may enhance drought and salt stress tolerance in Salix.
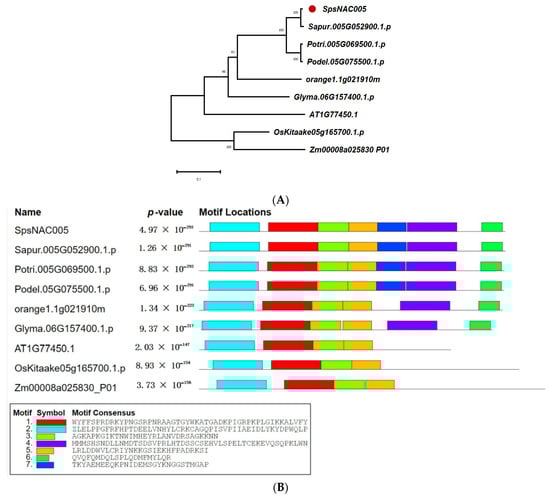
Figure 3.
Evolution and protein structure of SpsNAC005 homologous gene. (A) Phylogenetic analysis of SpsNAC005 in monocotyledonous and dicotyledonous plants. The phylogenetic trees were constructed with MEGA X software using the neighbor-joining (NJ) method with 1000 bootstrap test replicates. Bar = 0.1 substitutions per site. (B) The homology structure domain alignment of amino acid sequence of NAC-like gene family.
3.4. Tissue-Specific Expression of the SpsNAC005 Gene in Salix psammophila
The expression of the SpsNAC005 gene was analyzed using qRT-PCR in the tissues of leaves, roots, shoots, soft stems, semi-lignified stems, and mature stems of S. psammophila. The results showed that the relative expression of the SpsNAC005 gene was highest in soft stems, followed by leaves, shoots, semi-lignified stems, and mature stems, with the lowest expression in roots (Figure 4). Data analysis showed there were significant differences in SpsNAC005 relative expression (p < 0.05) in leaves, roots, shoots, and soft stems, but it was not significant between semi-lignified stems, shoots, and mature stems.
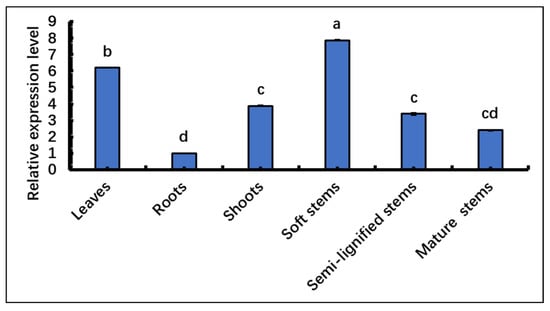
Figure 4.
Tissue expression patterns of SpsNAC005 in S. psammophila. qRT-PCR was used to analyze the relative expression level of SpsNAC005 in different tissues. Error bars represent ± SD from three biological repeats. These samples used the One-way ANOVA for randomized block design, as long as there was one same marked letter, the difference was not significant, and the difference was significant if there is a different marked letter. Generally, lowercase letters indicate the significant level α = 0.05.
3.5. PCR Identification and Expression Analysis of Transgenic P. hopeiensis
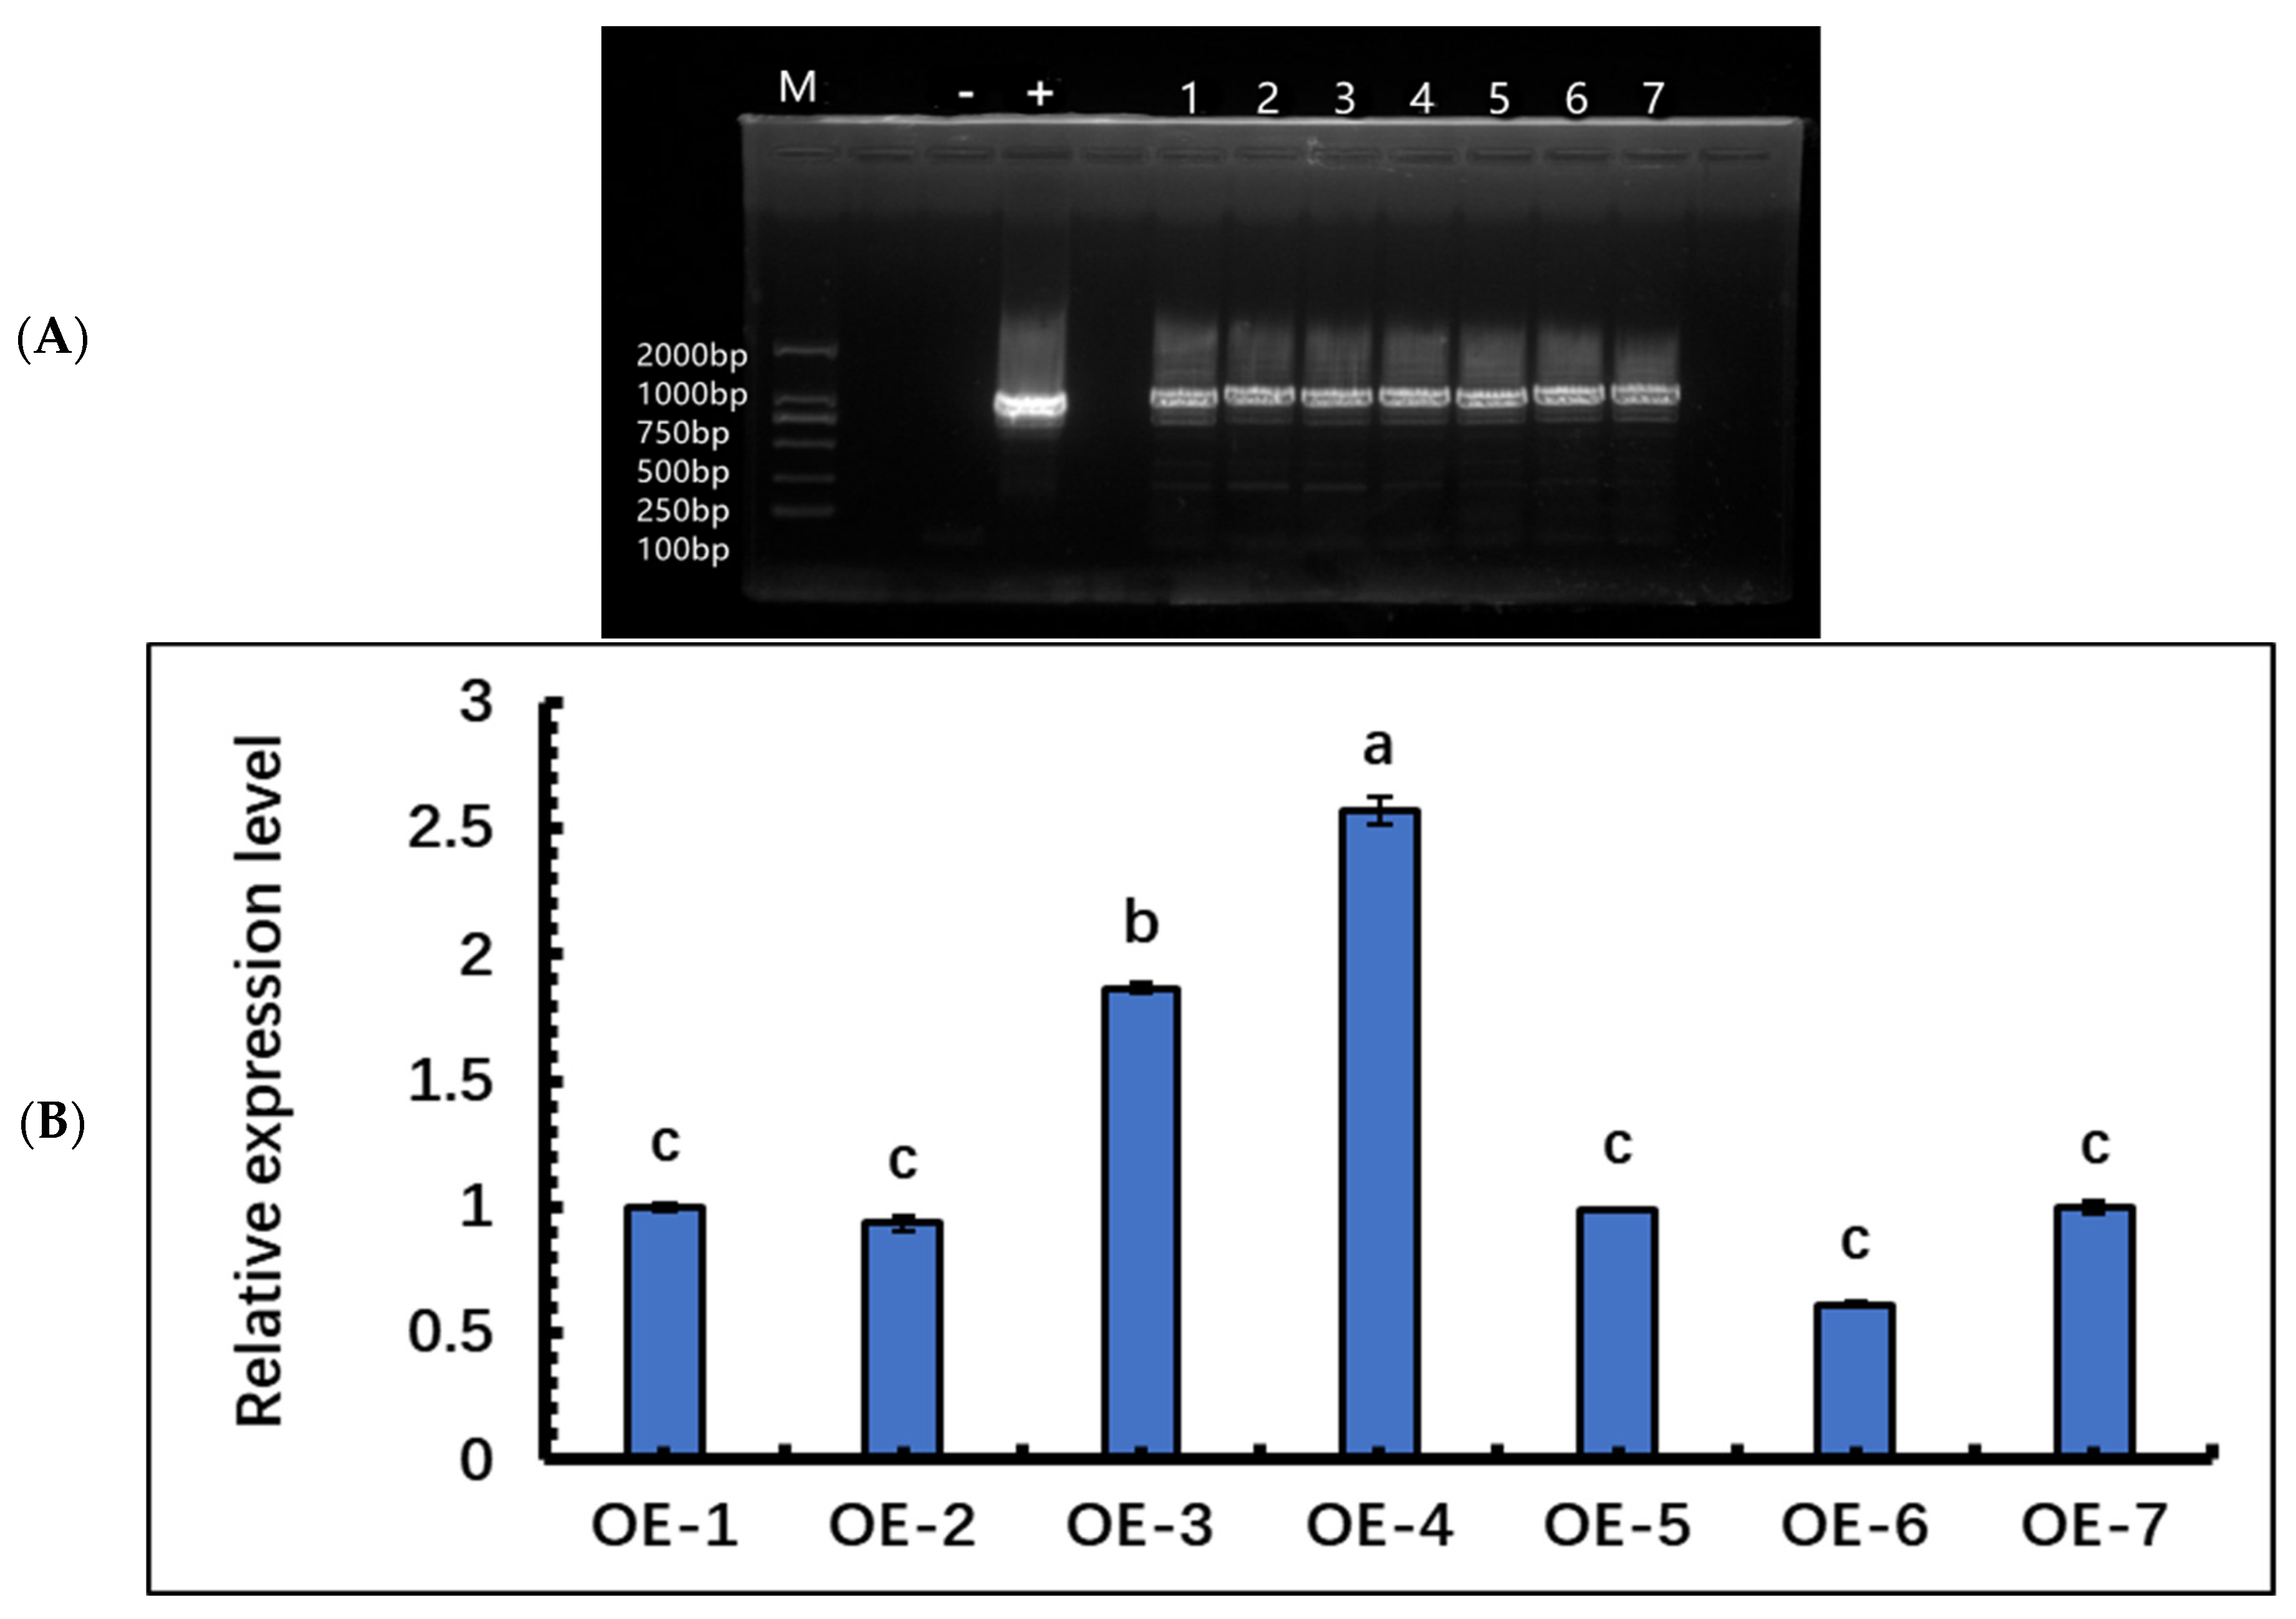
The PCR identification of P. hopeiensis transgenic lines showed that seven lines were positive, and the size of the identified target bands was 1049 bp (Figure 5A), which was consistent with the expected band size.

Figure 5.
Identification of transgenic lines of P. hopeiensis. (A) Agarose gel assay of PCR amplified target genes from P. hopeiensis overexpression lines. (B) Determination of relative gene expression in SpsNAC005 positive lines. These samples used the One-way ANOVA for randomized block design, as long as there was one same marked letter, the difference was not significant, and the difference was significant if there is a different marked letter. Generally, lowercase letters indicate the significant level α = 0.05.
qRT-PCR expression analysis of SpsNAC005 gene was performed on the seven transgenic lines of P. hopeiensis. The relative expression levels of OE-3 and OE-4 were significantly higher than those of all other overexpression lines. This results indicated that all seven lines obtained in this study expressed the target gene (Figure 5B); the three lines with the high expression, OE-4, OE-3, and OE-1, were selected for subsequent stress treatment and related data measurements.
3.6. Phenotypic Analysis of Transgenic P. hopeiensis Lines
3.6.1. Changes in Plant Height in SpsNAC005 Overexpression Lines
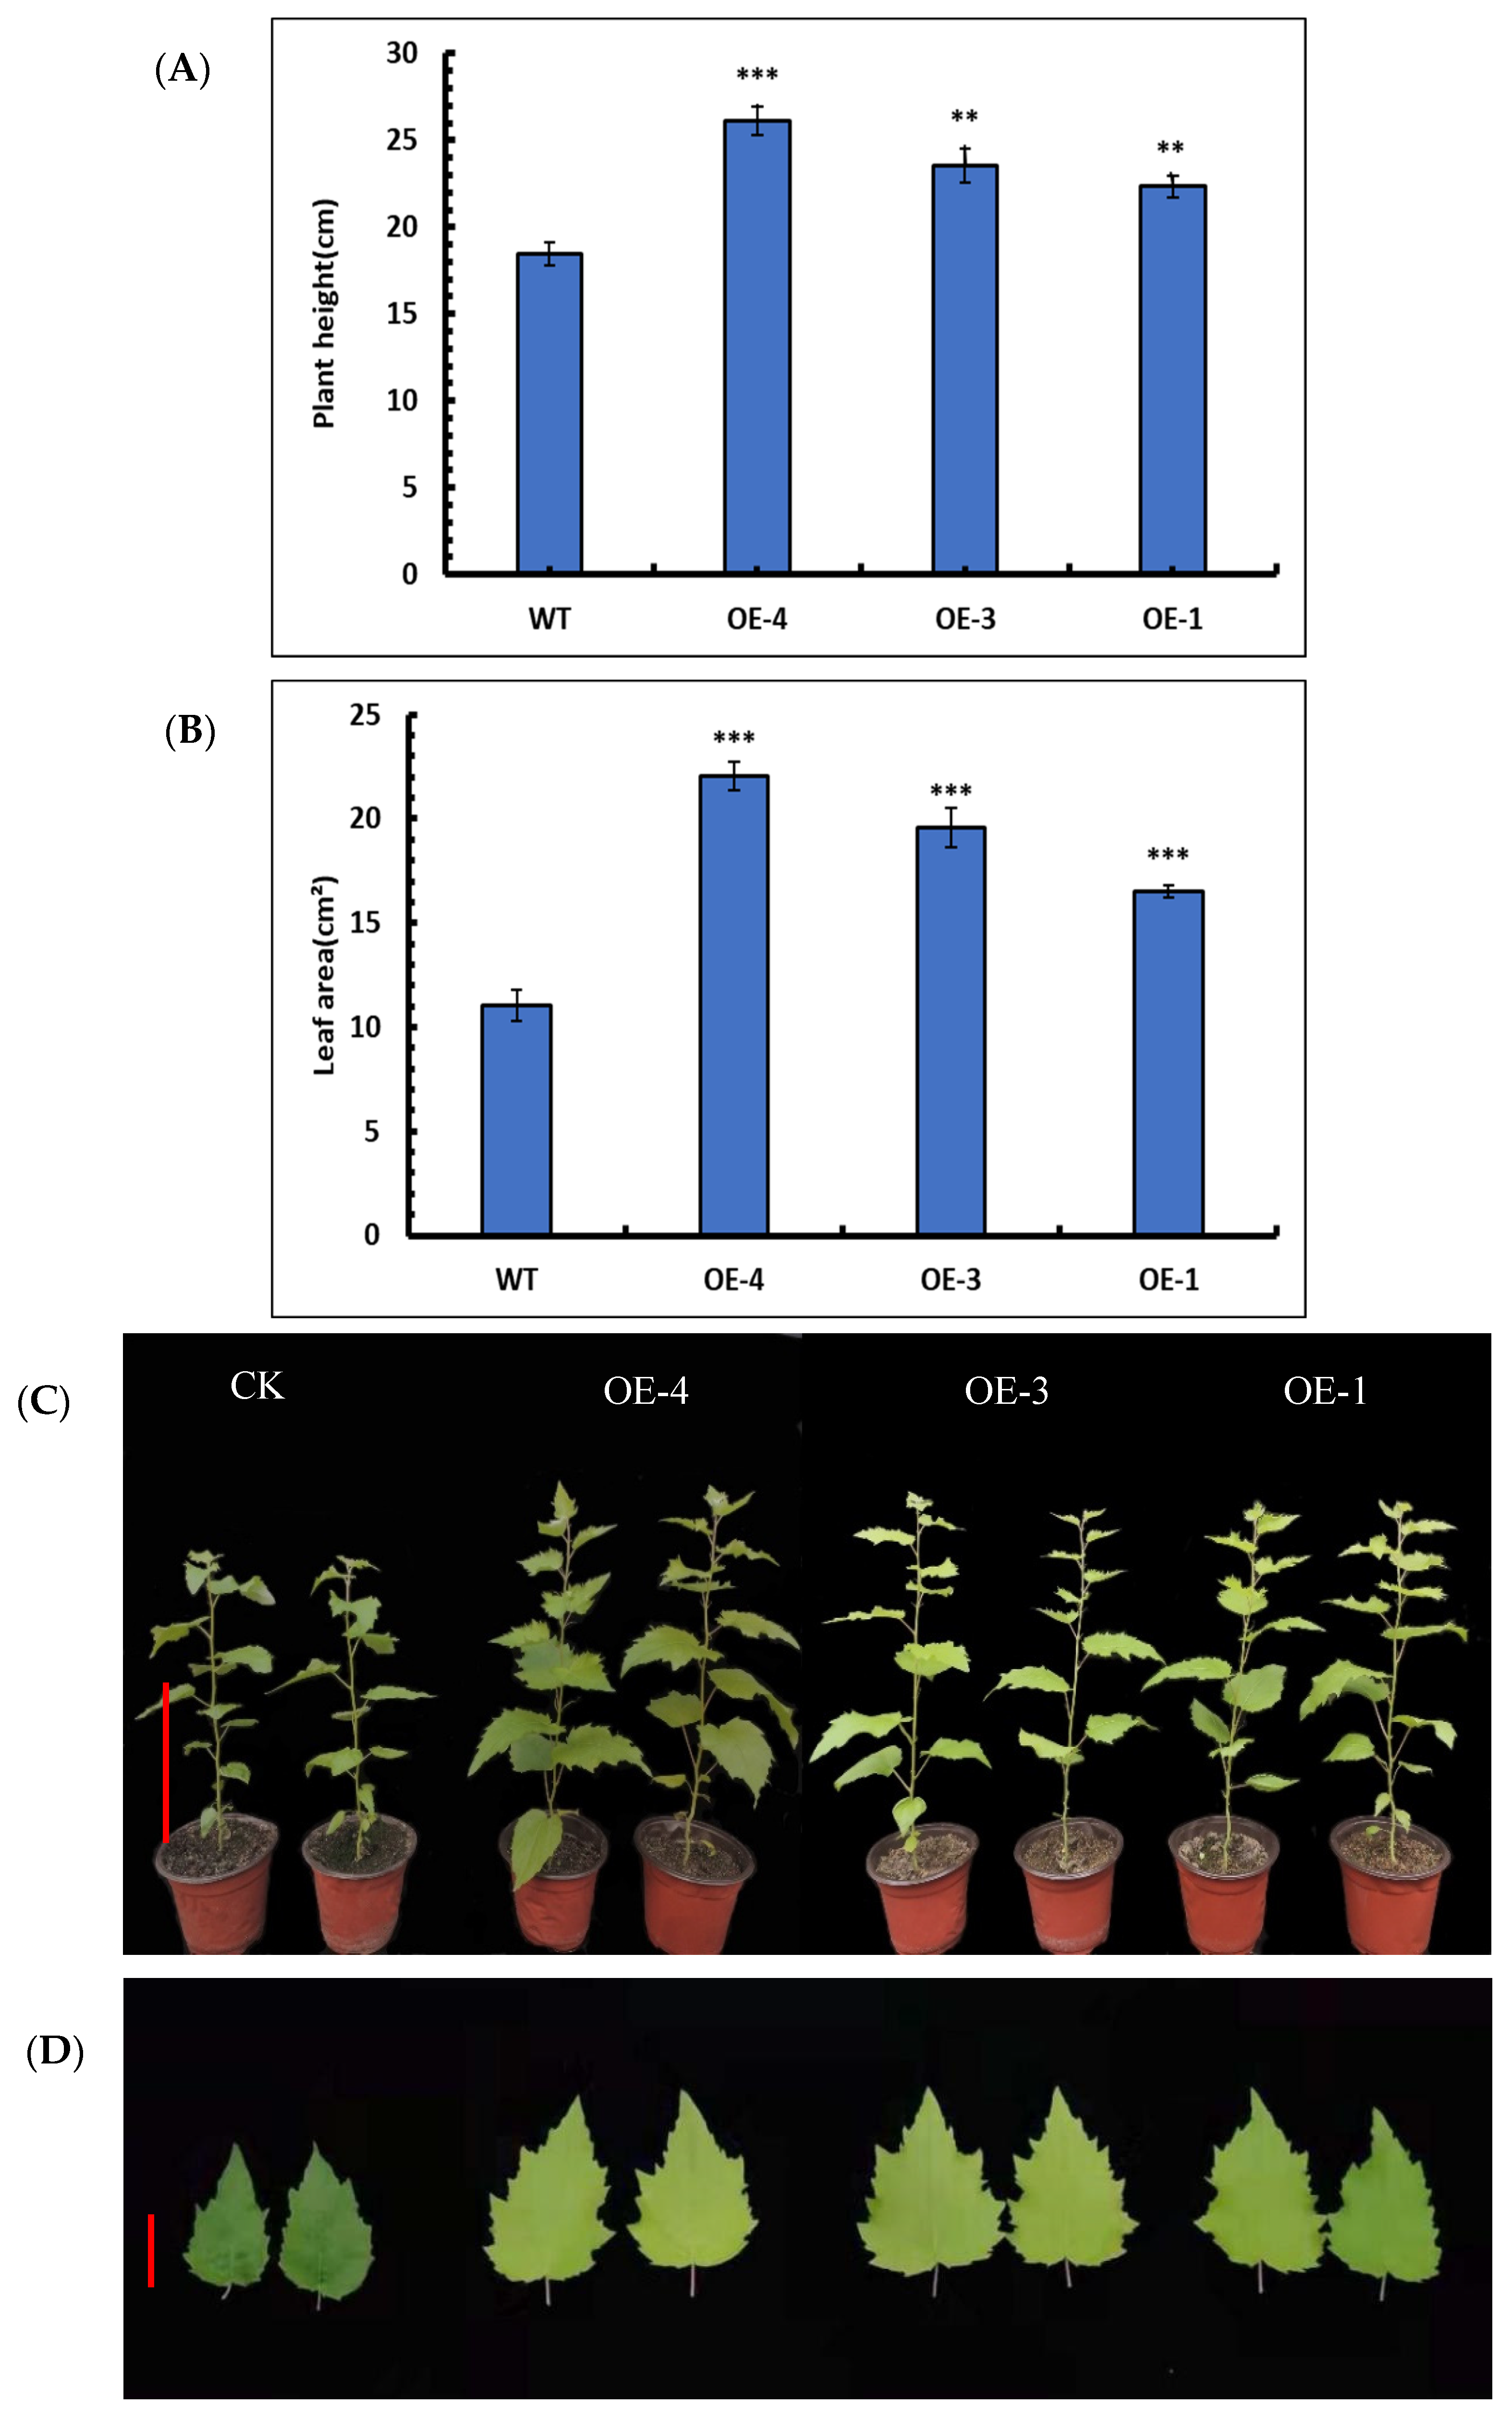
Statistical comparisons of height were performed for the OE-4, OE-3, and OE-1 lines. The results showed that the average plant heights of OE-4, OE-3, and OE-1 lines were 26.1 ± 0.81 cm, 23.6 ± 0.97 cm, and 22.3 ± 0.61 cm, respectively, and the average plant height of the wild-type was 18.5 ± 0.65 cm (Figure 6A). Based on these results, the plant heights of three overexpression lines were significantly higher than that of the wild-type (Figure 6B), indicating that SpsNAC005 gene can enhance the height of the transgenic lines.

Figure 6.
Phenotypic analysis of transgenic P. hopeiensis. (A) Plant height of WT and SpsNAC005 overexpression lines of P. hopeiensis. (B) Leaf areas of wild-type and SpsNAC005 overexpression lines of P. hopeiensis. (C) The 30-day-old wild-type and overexpression lines of P. hopeiensis without stress. (D) Leaf areas of 30-day-old wild-type and overexpression lines of P. hopeiensis without stress. Whole plant scale = 10 cm, leaf scale = 3 cm. (Means ± S.D.) These averages are the average of three individual measurements. The significance of differences was determined based on t-test and F-test. *** p < 0.001, extremely significant; ** 0.001 ≤ p < 0.01, very significant.
3.6.2. Leaf Area Changes in SpsNAC005 Overexpression Lines
The leaf areas of OE-4, OE-3, and OE-1 were measured. The average leaf areas of OE-4, OE-3, and OE-1 were 22.1 ± 0.68 cm2, 19.6 ± 0.96 cm2, and 16.5 ± 0.27 cm2, respectively, whereas the average leaf area of the wild-type was 11.0 ± 0.75 cm2 (Figure 6C). The results showed that the average leaf area was significantly increased in overexpression lines (Figure 6D). Consequently, the SpsNAC005 gene may play a role by positively regulating the leaf growth of P. hopeiensis.
3.7. Morphological Changes in Transgenic P. hopeiensis under Stress Treatment
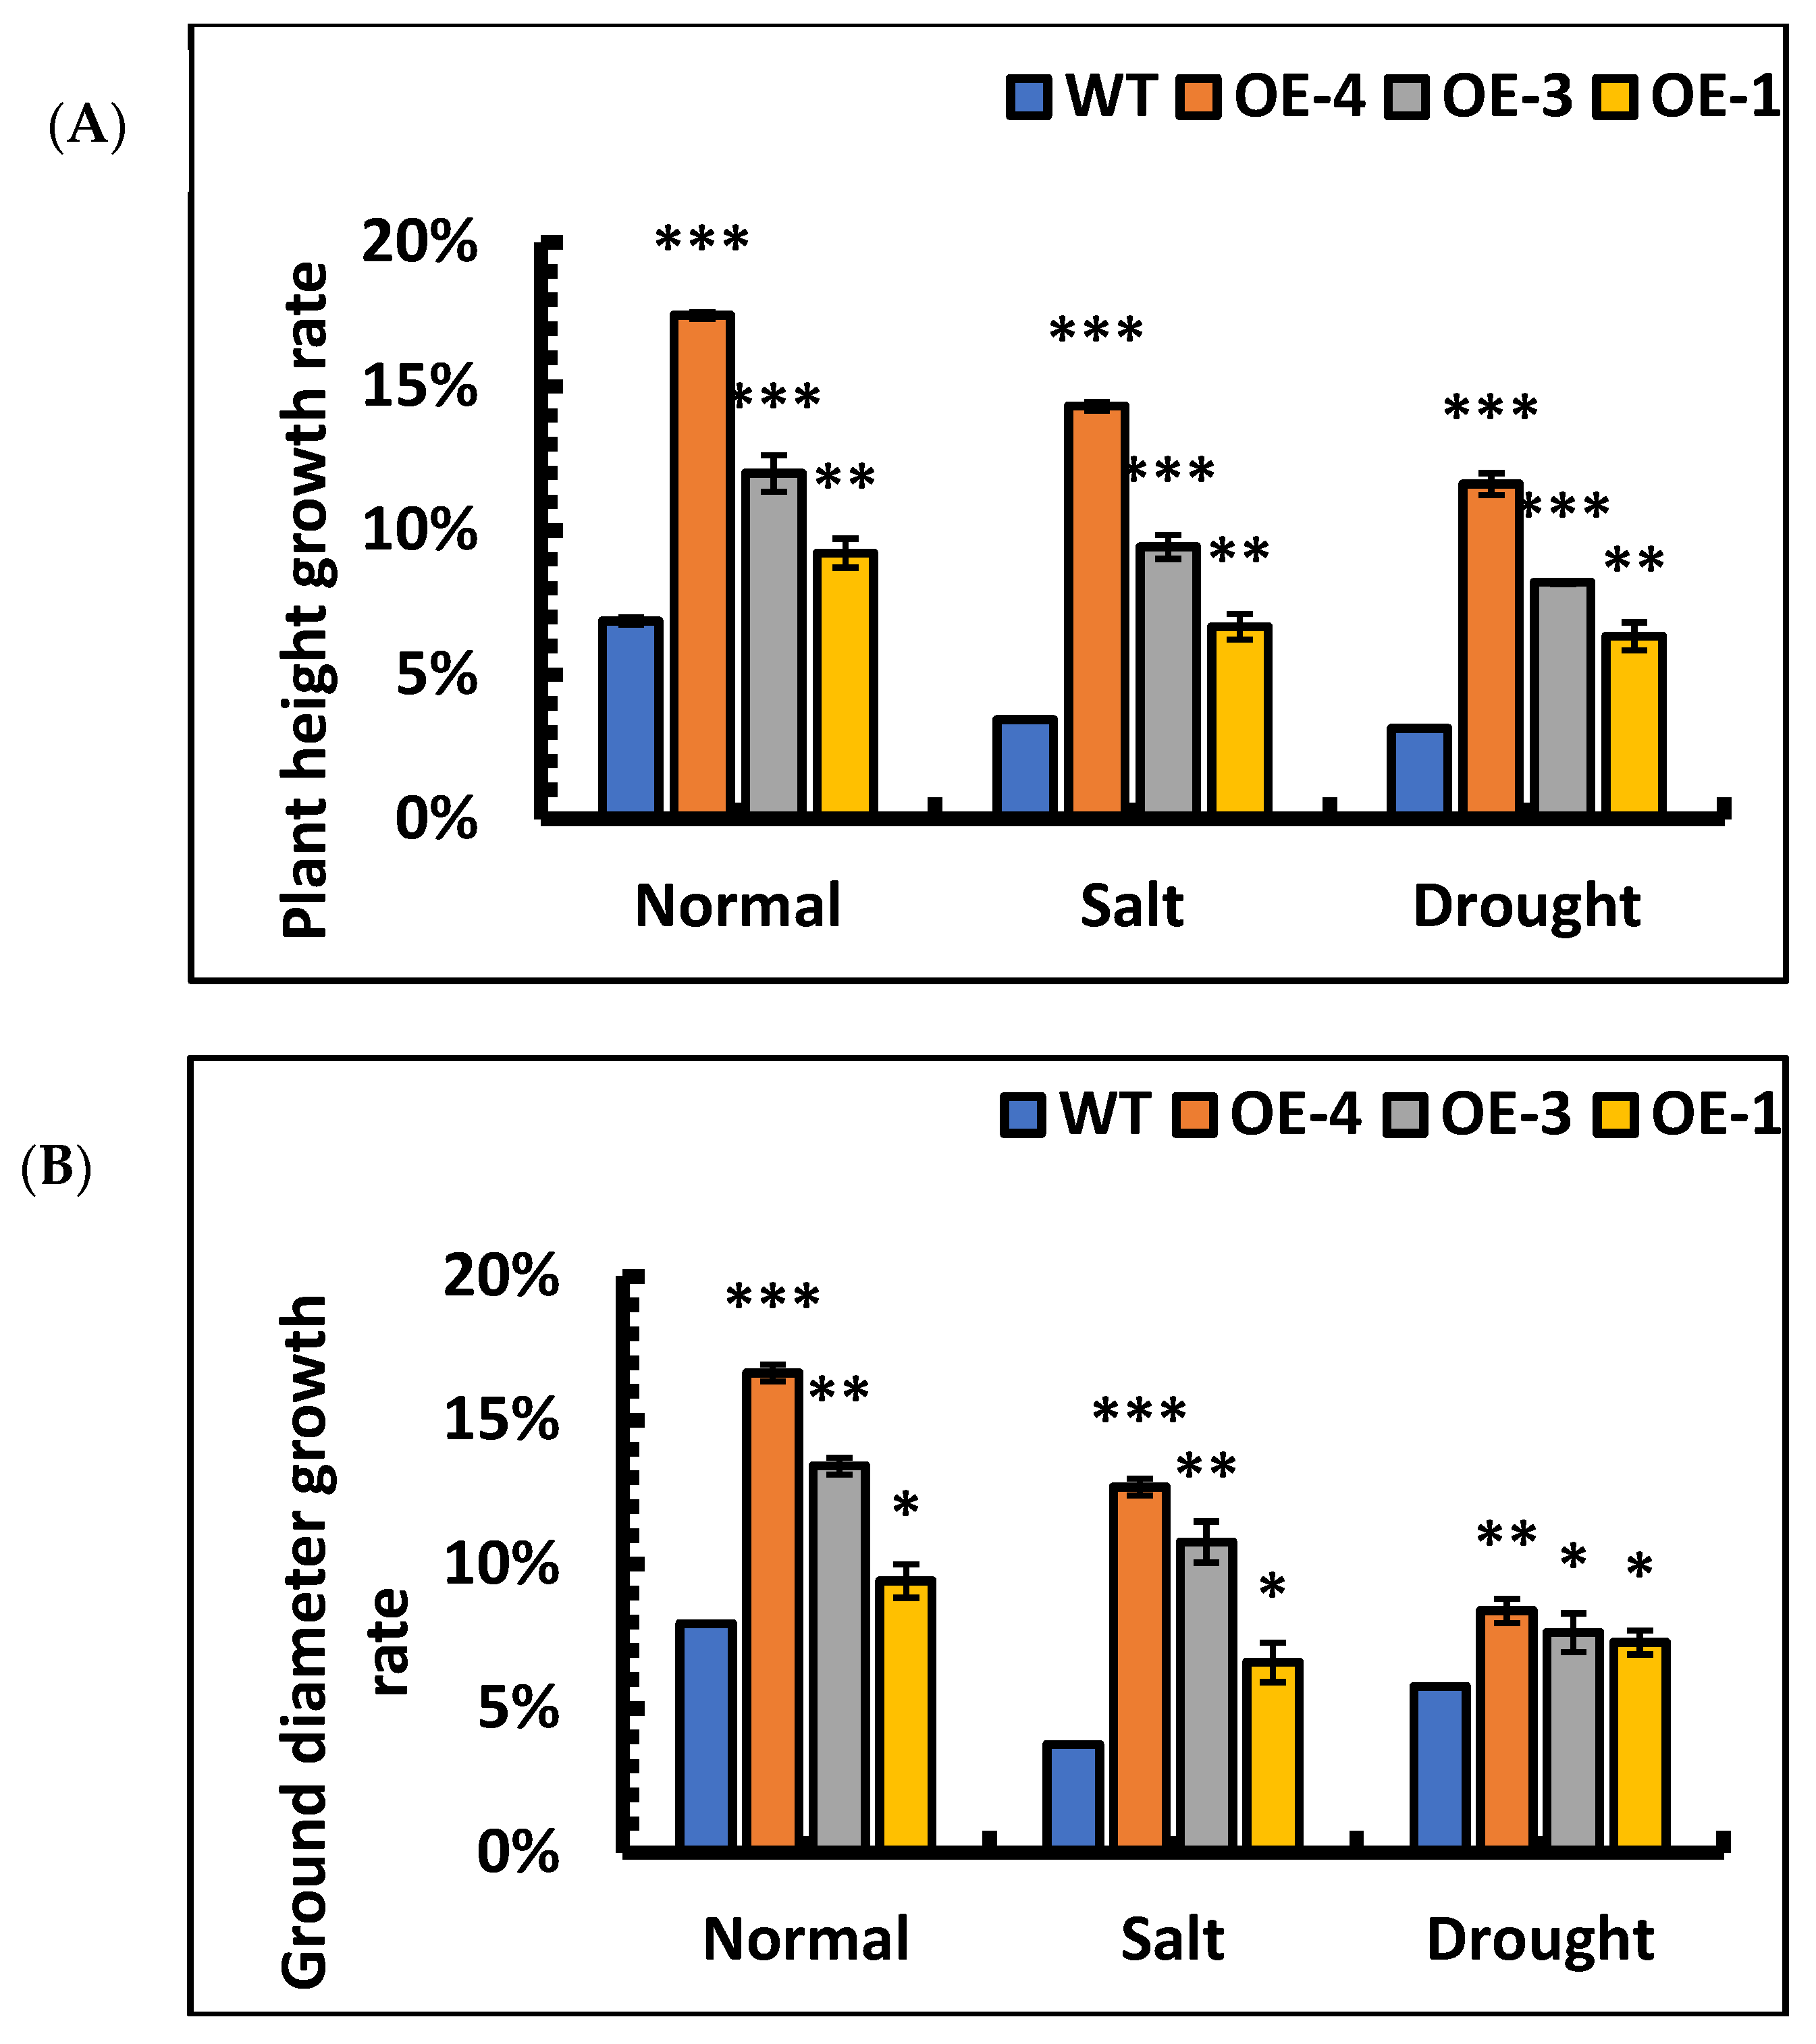
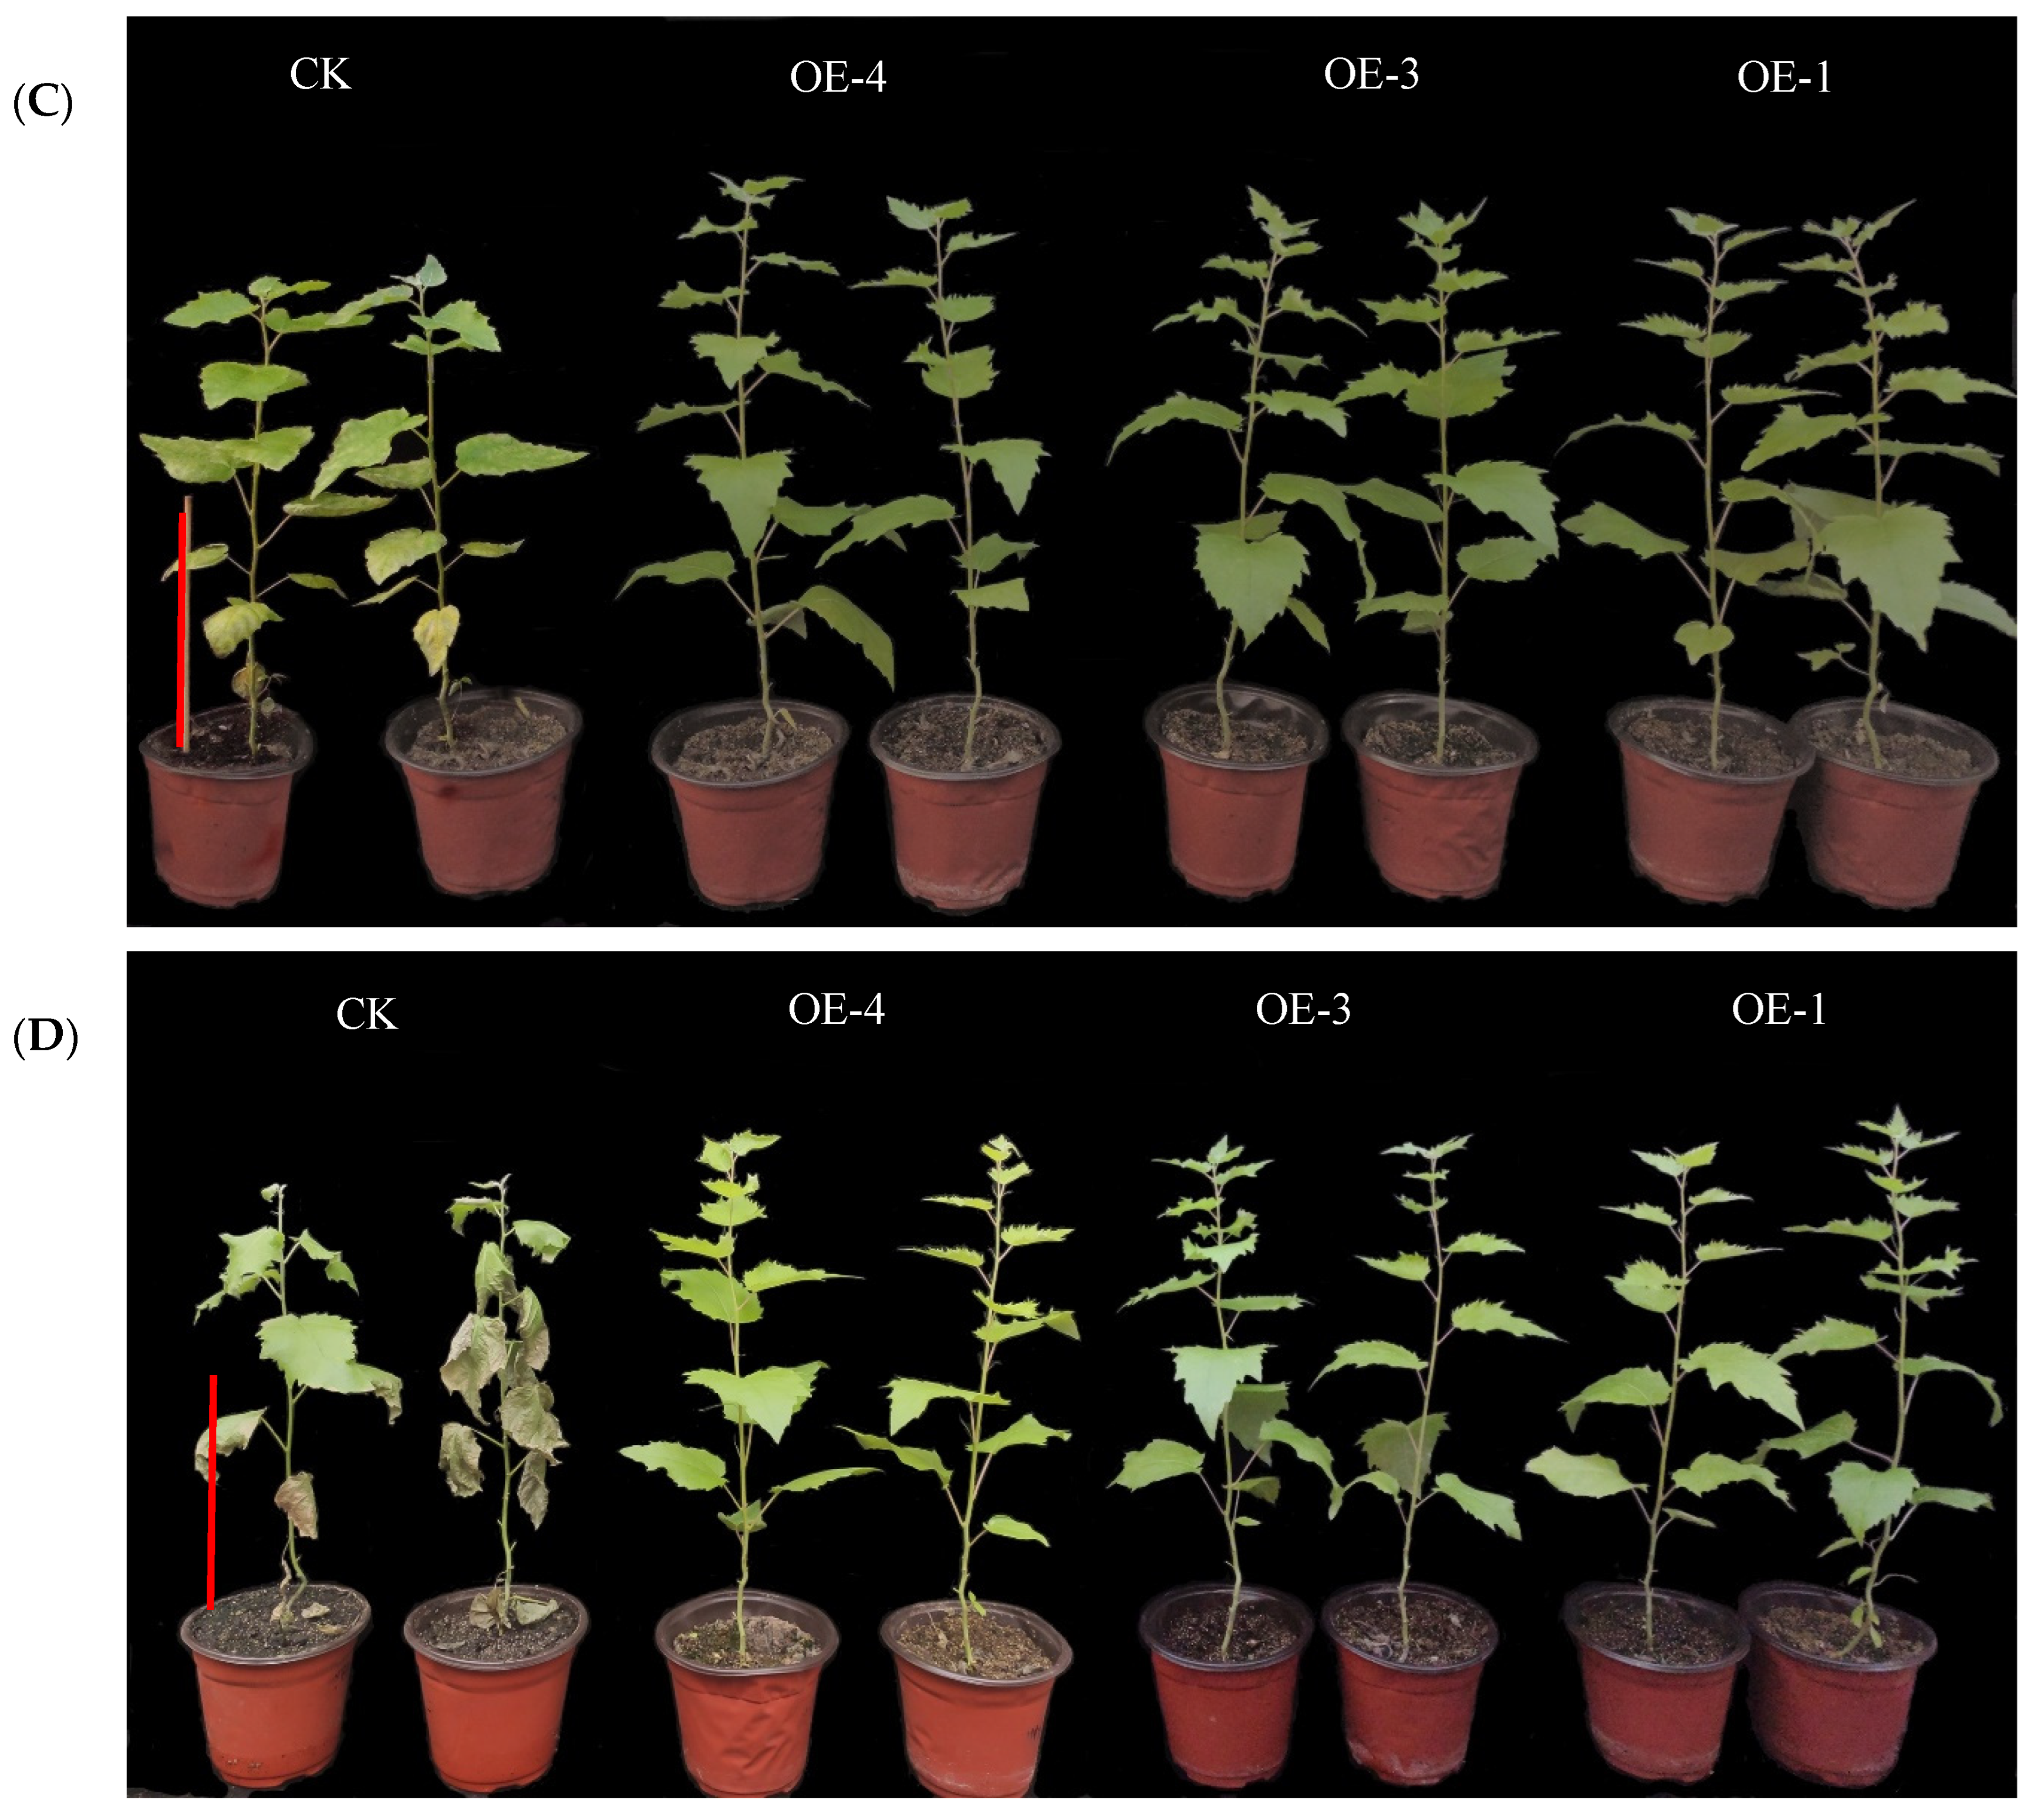
The overexpression lines, OE-4, OE-3, and OE-1 were treated with 0.9% NaCl and 10% PEG to evaluate the tolerance of OE lines for salt and drought stress. The relative growth rates of height and ground diameter in wild-type and overexpression lines were calculated under salt and simulated drought separately. The results showed that the height and ground diameter growth rates of wild-type and overexpression lines were decreased under stress. However, the height and ground diameter growth in overexpression lines were significantly faster than those in the wild-type under stresses (Figure 7A,B). After 5 d of salt stress, the basal leaves of the WT turned yellow, while most of the overexpression lines remained green and fresh (Figure 7C). After 5 d of drought stress, most of the leaves of WT died due to water loss (Figure 7D), whereas most of the transgenic poplar leaves were still fresh and alive. These results showed that under stress, the relative growth rate of height and ground diameter of SpsNAC005 overexpression lines was significantly higher than that of wild-type, and overexpression lines had resistance to stress.
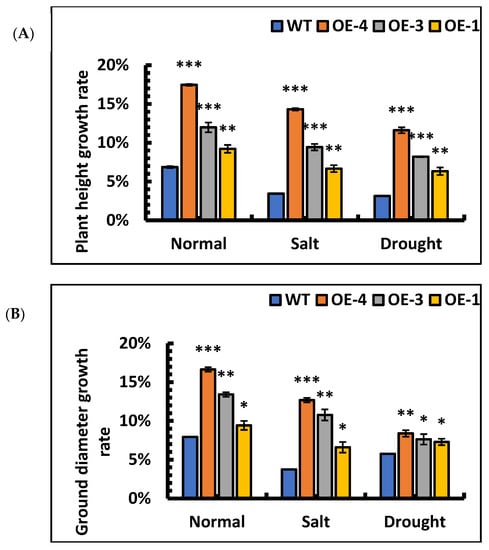

Figure 7.
Morphological changes in transgenic P. hopeiensis under stress. (A) The relative growth rate of height of P. hopeiensis under stress. (B) The relative growth rate of the ground diameter of P. hopeiensis under stress. (C) Morphological changes under salt stress. (D) Morphological changes under simulated drought stress. Phenotypes of natural leaf growth of overexpressed and wild-type lines after 30 days of seedling refinement. Whole plant scale = 10 cm. (Means ± S.D.) These averages are the average of three individual measurements. The significance of differences was determined using the t-test and F-test. *** p < 0.001, extremely significant; ** 0.001 ≤ p < 0.01, very significant; * 0.01 ≤ p < 0.05, significant.
3.8. The Fresh Weight and Dry Weight of P. hopeiensis under Stress Treatment
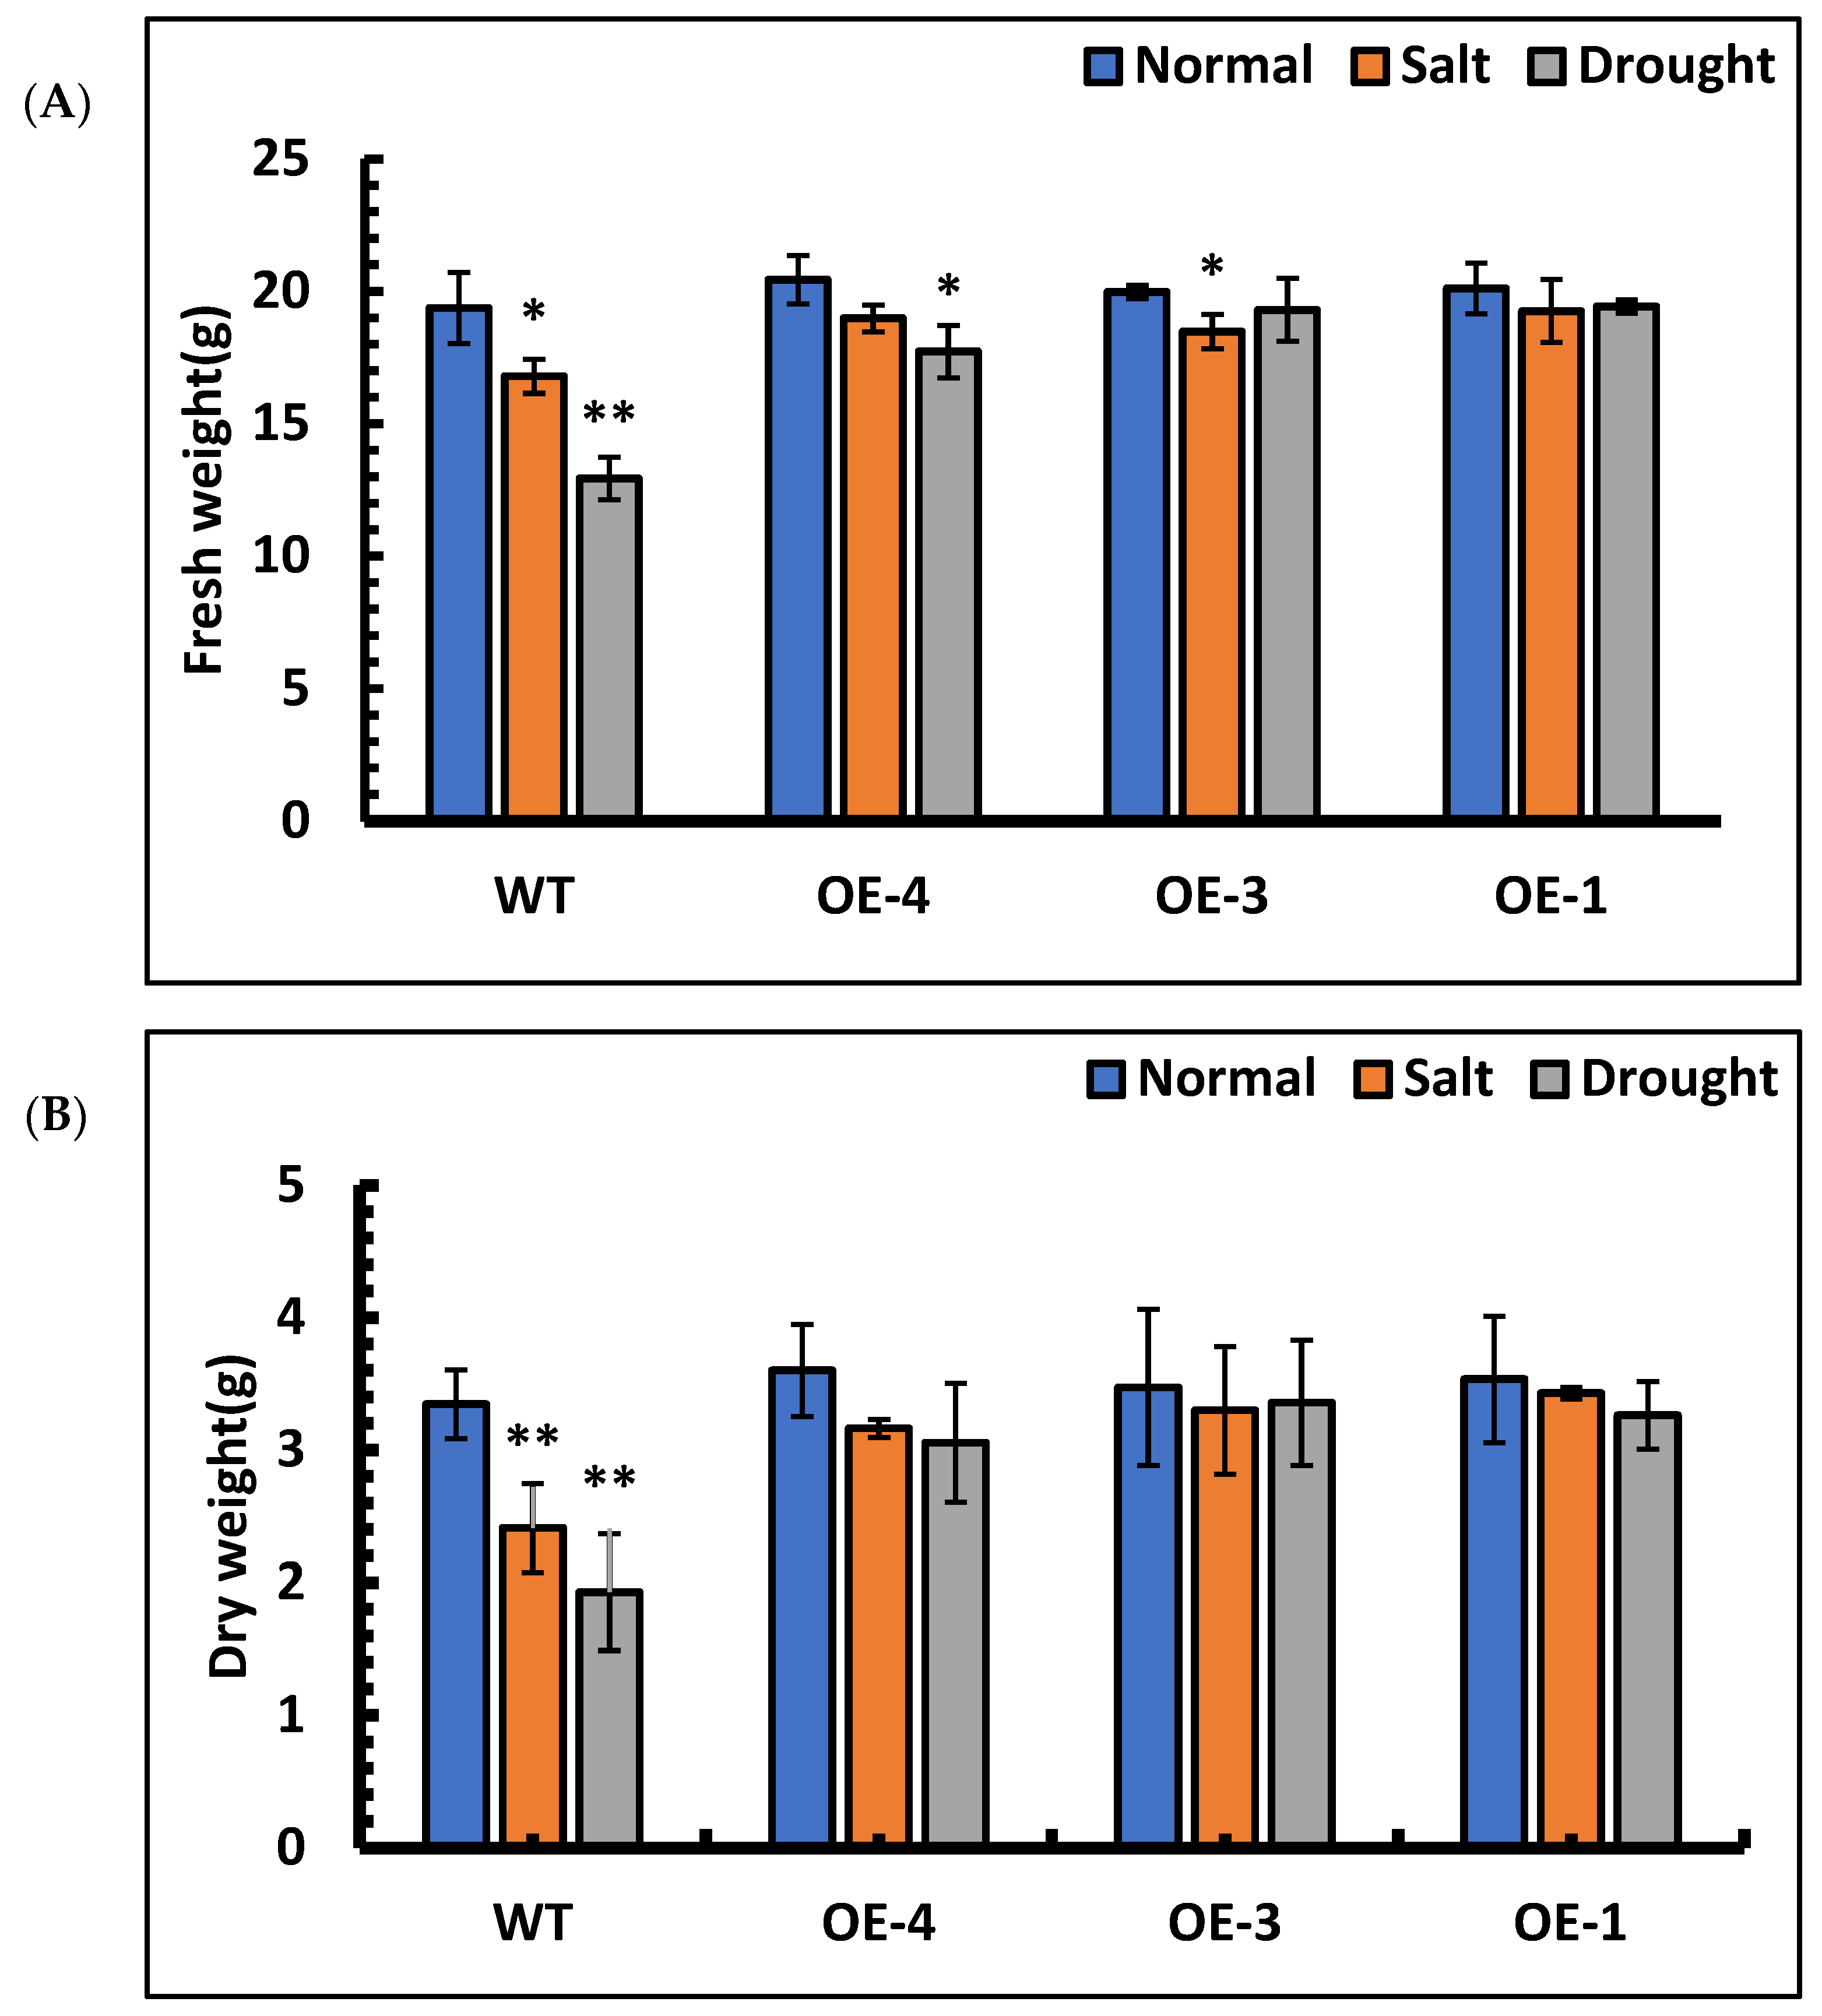
The fresh weight and dry weight of each line under stress treatment were measured. The results of fresh weight measurements showed that OE-4, OE-3, OE-1 and wild-type under salt stress decreased by 7.11%, 7.46%, 4.23% and 13.27%, respectively, compared with those of the control lines. Under simulated drought stress, the fresh weight of OE-4, OE-3, OE-1 and wild-type decreased by 13.26%, 3.39%, 3.38% and 33.20%, respectively, compared with their control lines. Among them, the fresh weight of wild-type decreased significantly under stress (Figure 8A). The results of dry weight measurements showed that OE-4, OE-3, OE-1 and wild-type under salt stress decreased by 12.22%, 5.00%, 2.98% and 27.93%, respectively, compared with those of their control lines. Under simulated drought stress, the dry weight of the OE-4, OE-3, OE-1 and wild-type decreased by 15.16%, 3.33%, 7.72% and 42.30%, respectively, compared with their control lines. Under stress treatment, the dry weight of wild-type was significantly reduced compared to that of the control group (Figure 8B). The above results showed that SpsNAC005 gene stress could reduce the water loss of plants and enhance their resistance to stress.
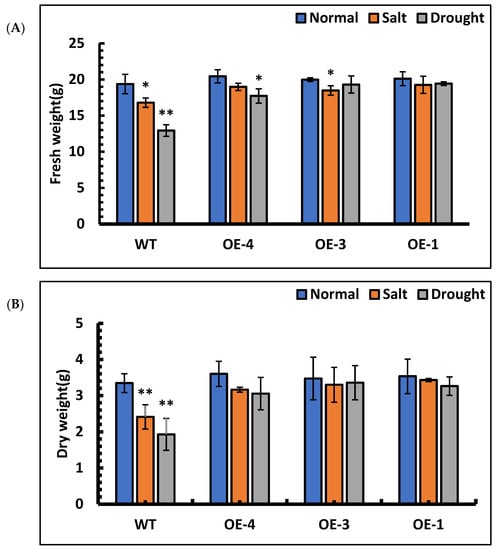
Figure 8.
The fresh weight and dry weight of P. hopeiensis under salt and drought stress. (A) The fresh weight of P. hopeiensis under stress treatment. (B) The dry weight of P. hopeiensis under stress treatment. Values are the mean ± standard deviation of three independent experiments. The significance of differences was determined using t-test and F-test. ** 0.001 ≤ p < 0.01, very significant; * 0.01 ≤ p < 0.05, significant.
3.9. Response of Antioxidant System and Osmotic Regulation of Transgenic P. hopeiensis to Stress
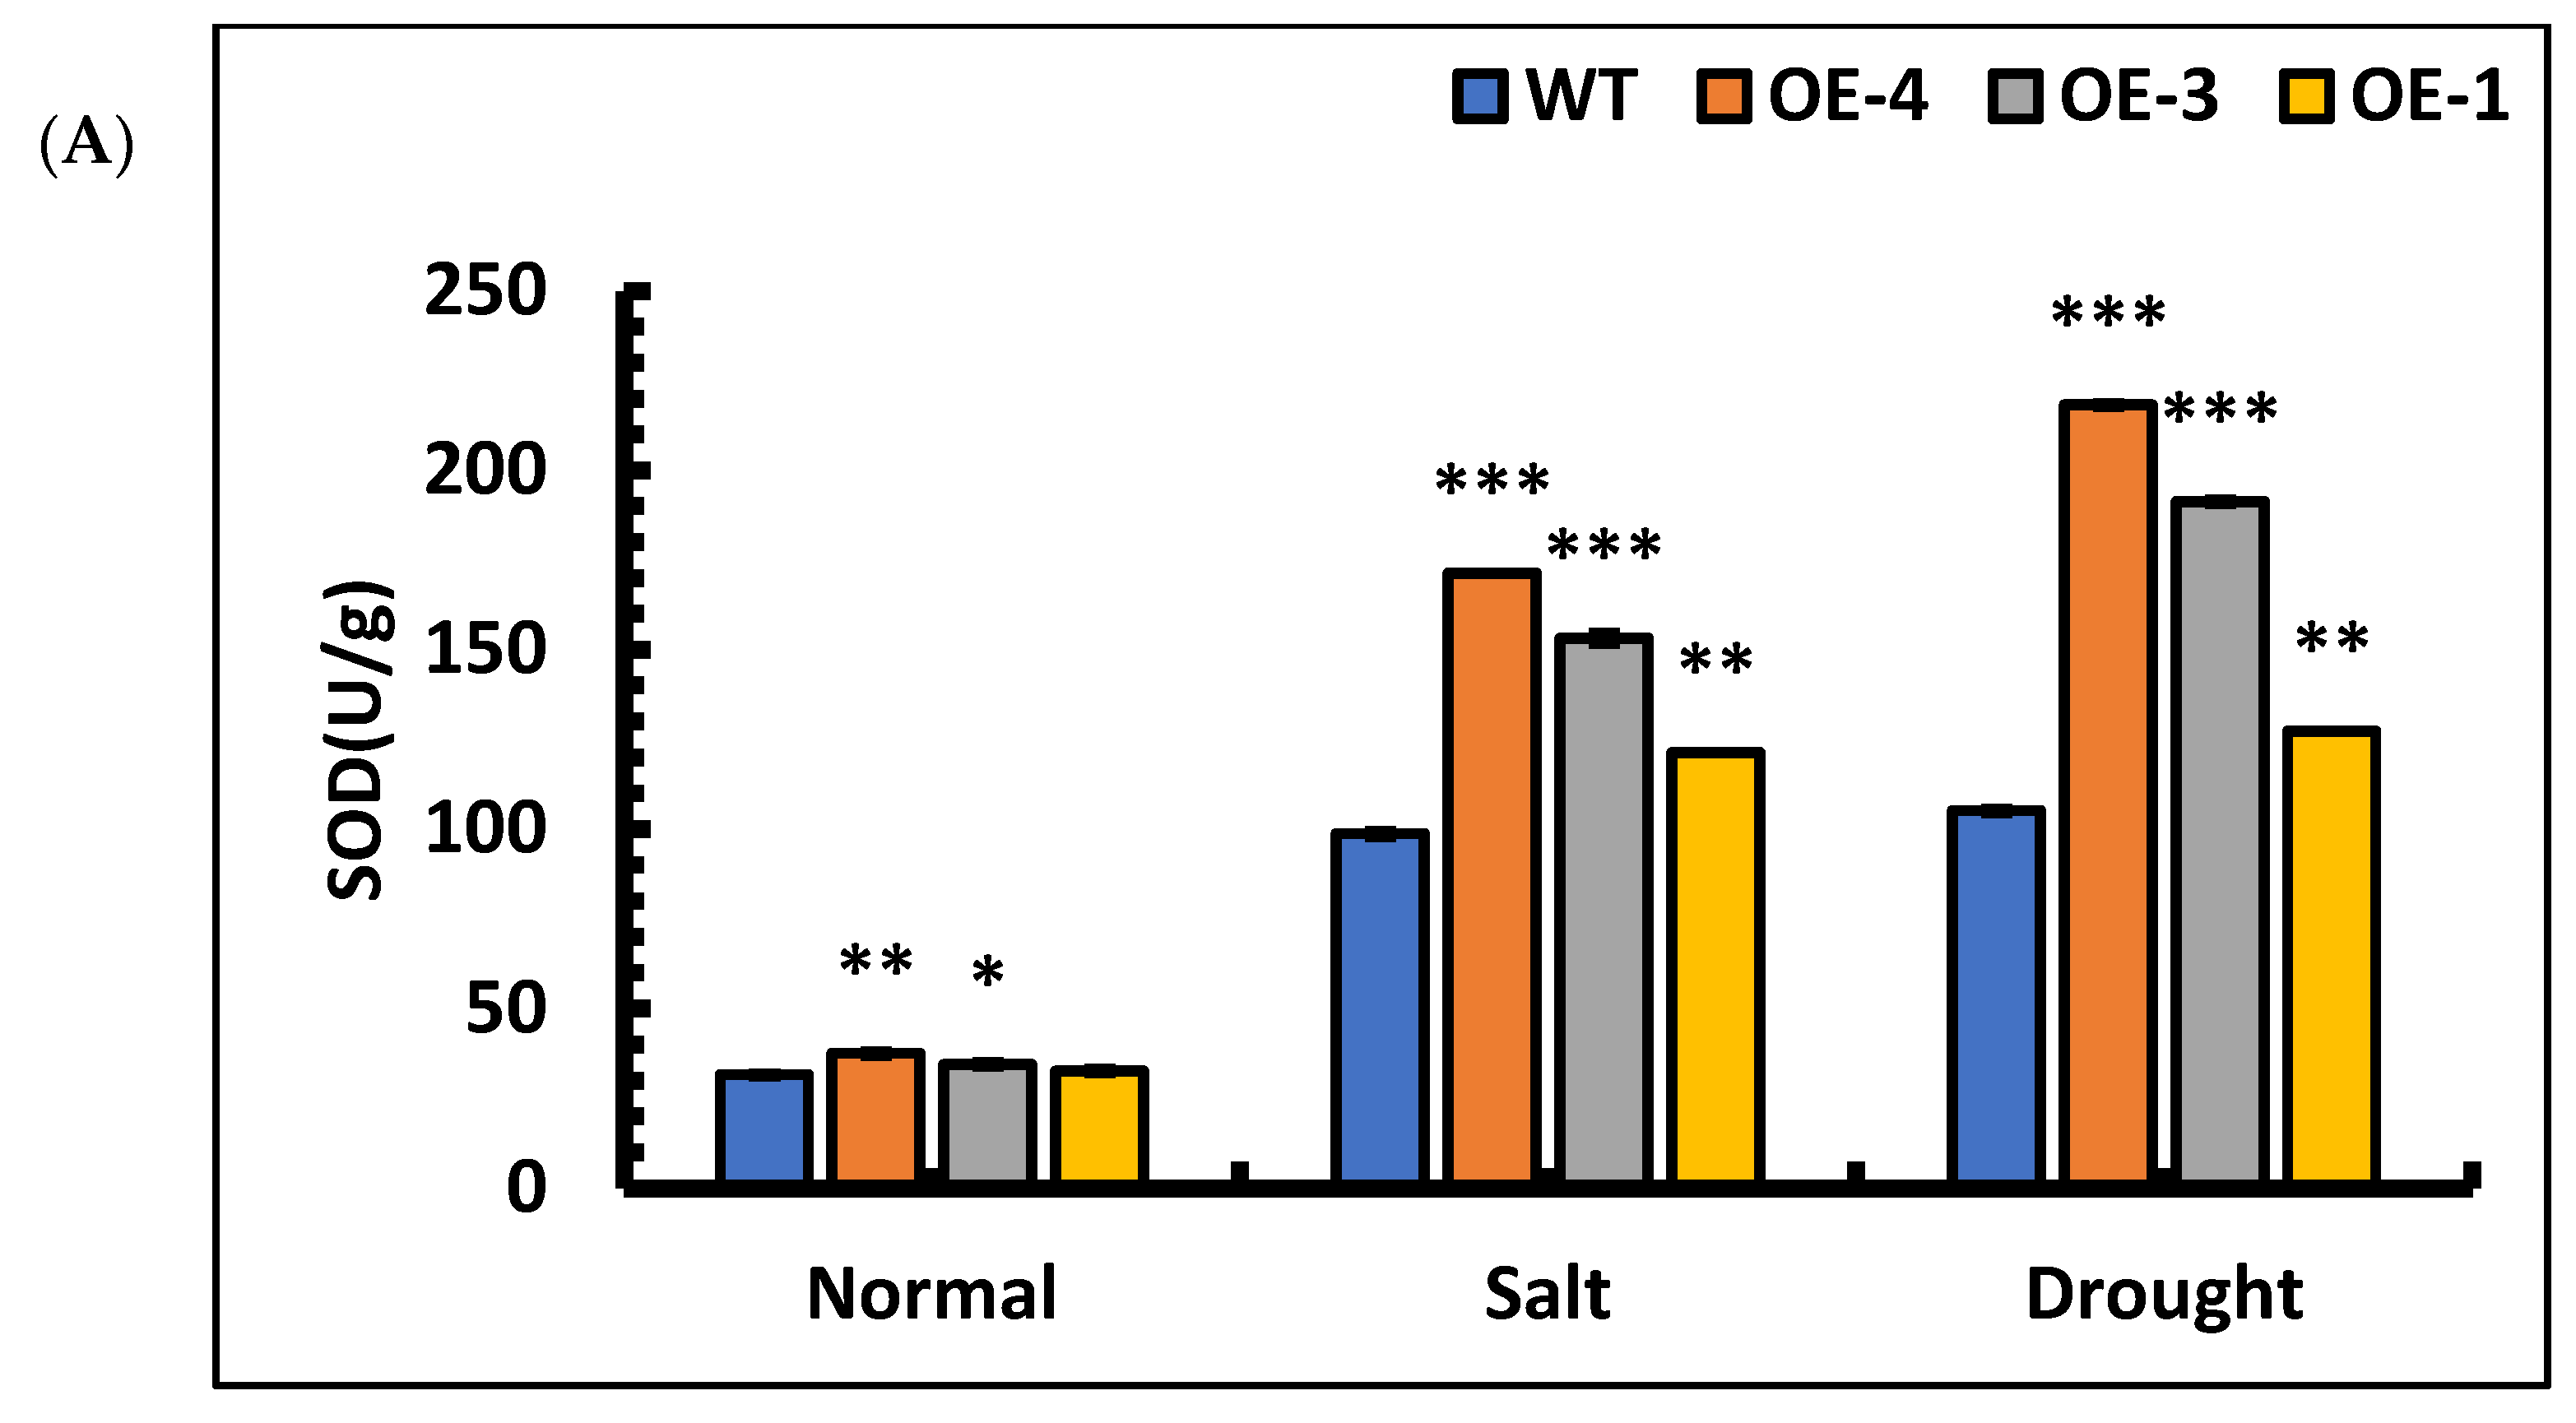
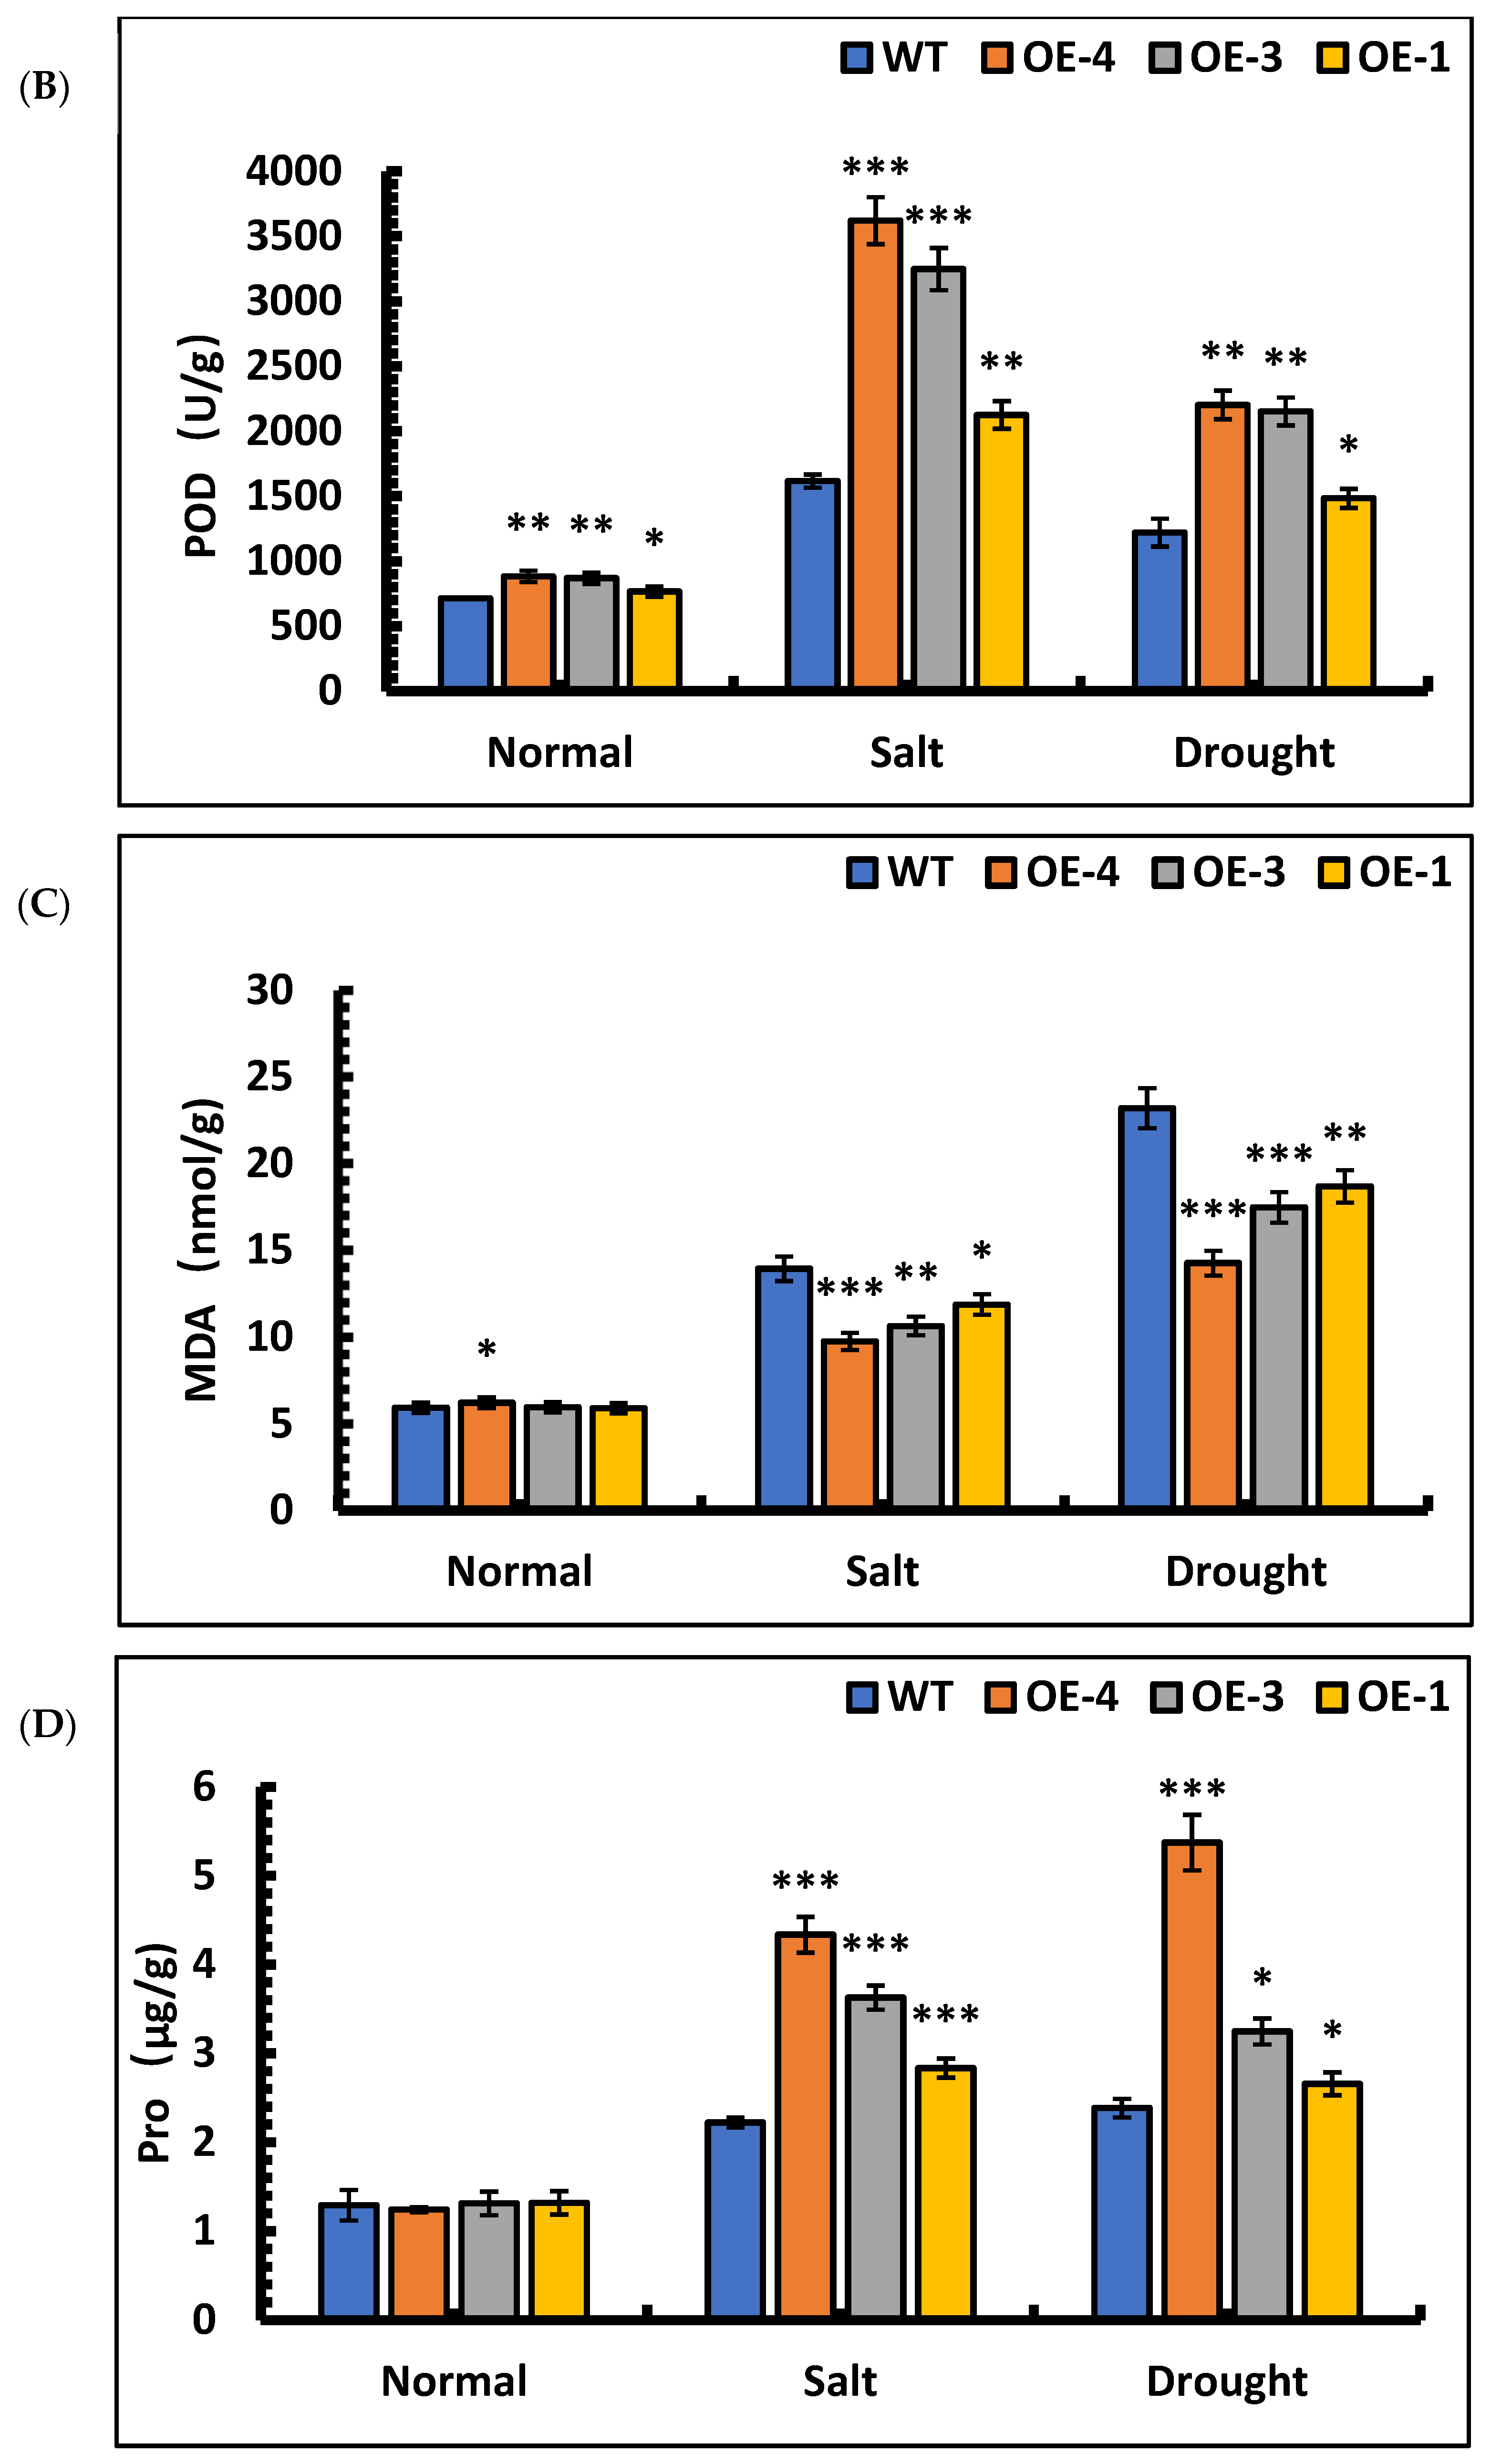
To further characterize the resistance of overexpressed lines, the SOD activities, POD activities, MDA contents, and Pro contents in OE-4, OE-3, OE-1, and wild-type plants were quantified after stress treatment. The mean differences in the SOD activities of OE-4, OE-3, OE-1, and wild-type plants compared with those of the control lines after salt stress were 356.66%, 345.09%, 271.96%, and 213.31%, respectively, and the POD activities increased by 310.25%, 273.61%, 177.53%, and 126.64%, respectively, compared with those of the control lines. Under drought stress, the differences in SOD activities of OE-4, OE-3, OE-1, and the wild-type were 481.73%, 455.42%, 290.38%, and 233.70%, respectively, and the POD activities increased by 149.59% and 147. 59%, 93.67%, and 71.03%, respectively, compared with those of the control lines. The results showed that the SOD and POD activities increased significantly in each line when subjected to salt and drought stress (Figure 9A,B). Among the lines, the SOD and POD activities were significantly higher in overexpression lines than wild-type, indicating that the overexpression of the SpsNAC005 gene enhanced the ability of plants to scavenge oxygen radicals and break down hydrogen peroxide, thus improving the stress resistance of the transgenic line.
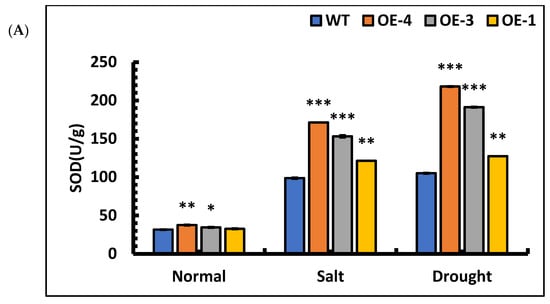

Figure 9.
Changes in physiological indicators of P. hopeiensis transgenic lines under salt and drought stress. (A) SOD activity of P. hopeiensis under stress treatment. (B) POD activity of P. hopeiensis under stress treatment. (C) MDA content in P. hopeiensis under stress treatment. (D) Pro content in P. hopeiensis under stress treatment. Values are the mean ± standard deviation of three independent experiments. The significance of differences was determined using t-test and F-test. *** p < 0.001, extremely significant; ** 0.001 ≤ p < 0.01, very significant; * 0.01 ≤ p < 0.05, significant.
The changes in the MDA contents of the transgenic lines after stress were quantified. The results showed that the MDA contents of OE-4, OE-3, OE-1, and wild-type increased by 56.74%, 78.59%, 101.20%, and 134.85%, respectively, under salt stress compared with those of the control lines. Under drought stress, the MDA contents of OE-4, OE-3, OE-1, and wild-type plants increased by 128.91%, 192.92%, 216.11%, and 290.89%, respectively, compared with control lines. Based on these results, the MDA content was significantly higher in all lines under salt and drought stresses, indicating that free radicals acted on lipids in the plant, resulting in peroxidation reactions, and plant cells were damaged to some extent. However, under the same stress, the MDA content in the transgenic plants was significantly lower than that in the wild-type (Figure 9C), indicating that the free radicals in the transgenic plants produced lipid peroxidation to a lesser extent, indirectly indicating that there was significantly less cell damage in the transgenic plants than in the wild-type plants, and the overexpression of the SpsNAC005 gene in plants resulted in greater resistance to stress.
The proline content in overexpression lines and wild-type under stress was quantified. The results showed that under salt stress, the Pro content in OE-4, OE-3, OE-1, and wild-type increased by 249.21%, 176.47%, 115.03% and 71.84%, respectively. Under simulated drought stress, the Pro content in OE-4, OE-3, OE-1, and wild-type increased by 332.73%, 147.45%, 101.56% and 84.54%, respectively. The results showed that the Pro content in overexpression lines increased significantly under stress, indicating that overexpression of the SpsNAC005 gene protects the membrane system of cells in plants to some extent, slows down the degradation of intracellular proteins, and enhances the adaptability to stress.
3.10. Up-Regulated Expression of SOS1, MPK6, HKT1, P5CS1, and PRODH1 Genes in Transgenic P. hopeiensis under Stress
To analyze the possible regulatory pathways of SpsNAC005 genes, changes in the expressions of three genes, SOS1, MPK6, and HKT1, were examined. Under salt and drought stress, the expression levels of SOS1, MPK6, and HKT1 were significantly higher in the overexpression lines than in wild-type. Under salt stress, the relative expression of SOS1 genes in the OE-4, OE-3, OE-1, and wild-type plants was 9.51, 8.16, 6.89, and 5.14, respectively. Under drought stress, the relative expression of SOS1 genes in the OE-4, OE-3, OE-1, and wild-type plants was 17.60, 15.22, 13.17, and 5.81, respectively. These results indicate that the expression of the SOS1 gene under stress was increased compared with that under the water treatment, but the expression pattern of the overexpression lines was significantly higher than that of wild-type plants under the same treatment (Figure 10A). Therefore, SpsNAC005 promoted the expression of the SOS1 gene, maintained the dynamic balance of Na+/H+ in the transgenic line under stress, and improved the stress resistance of transgenic P. hopeiensis.
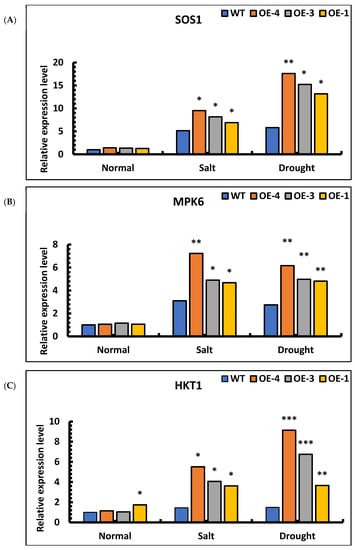

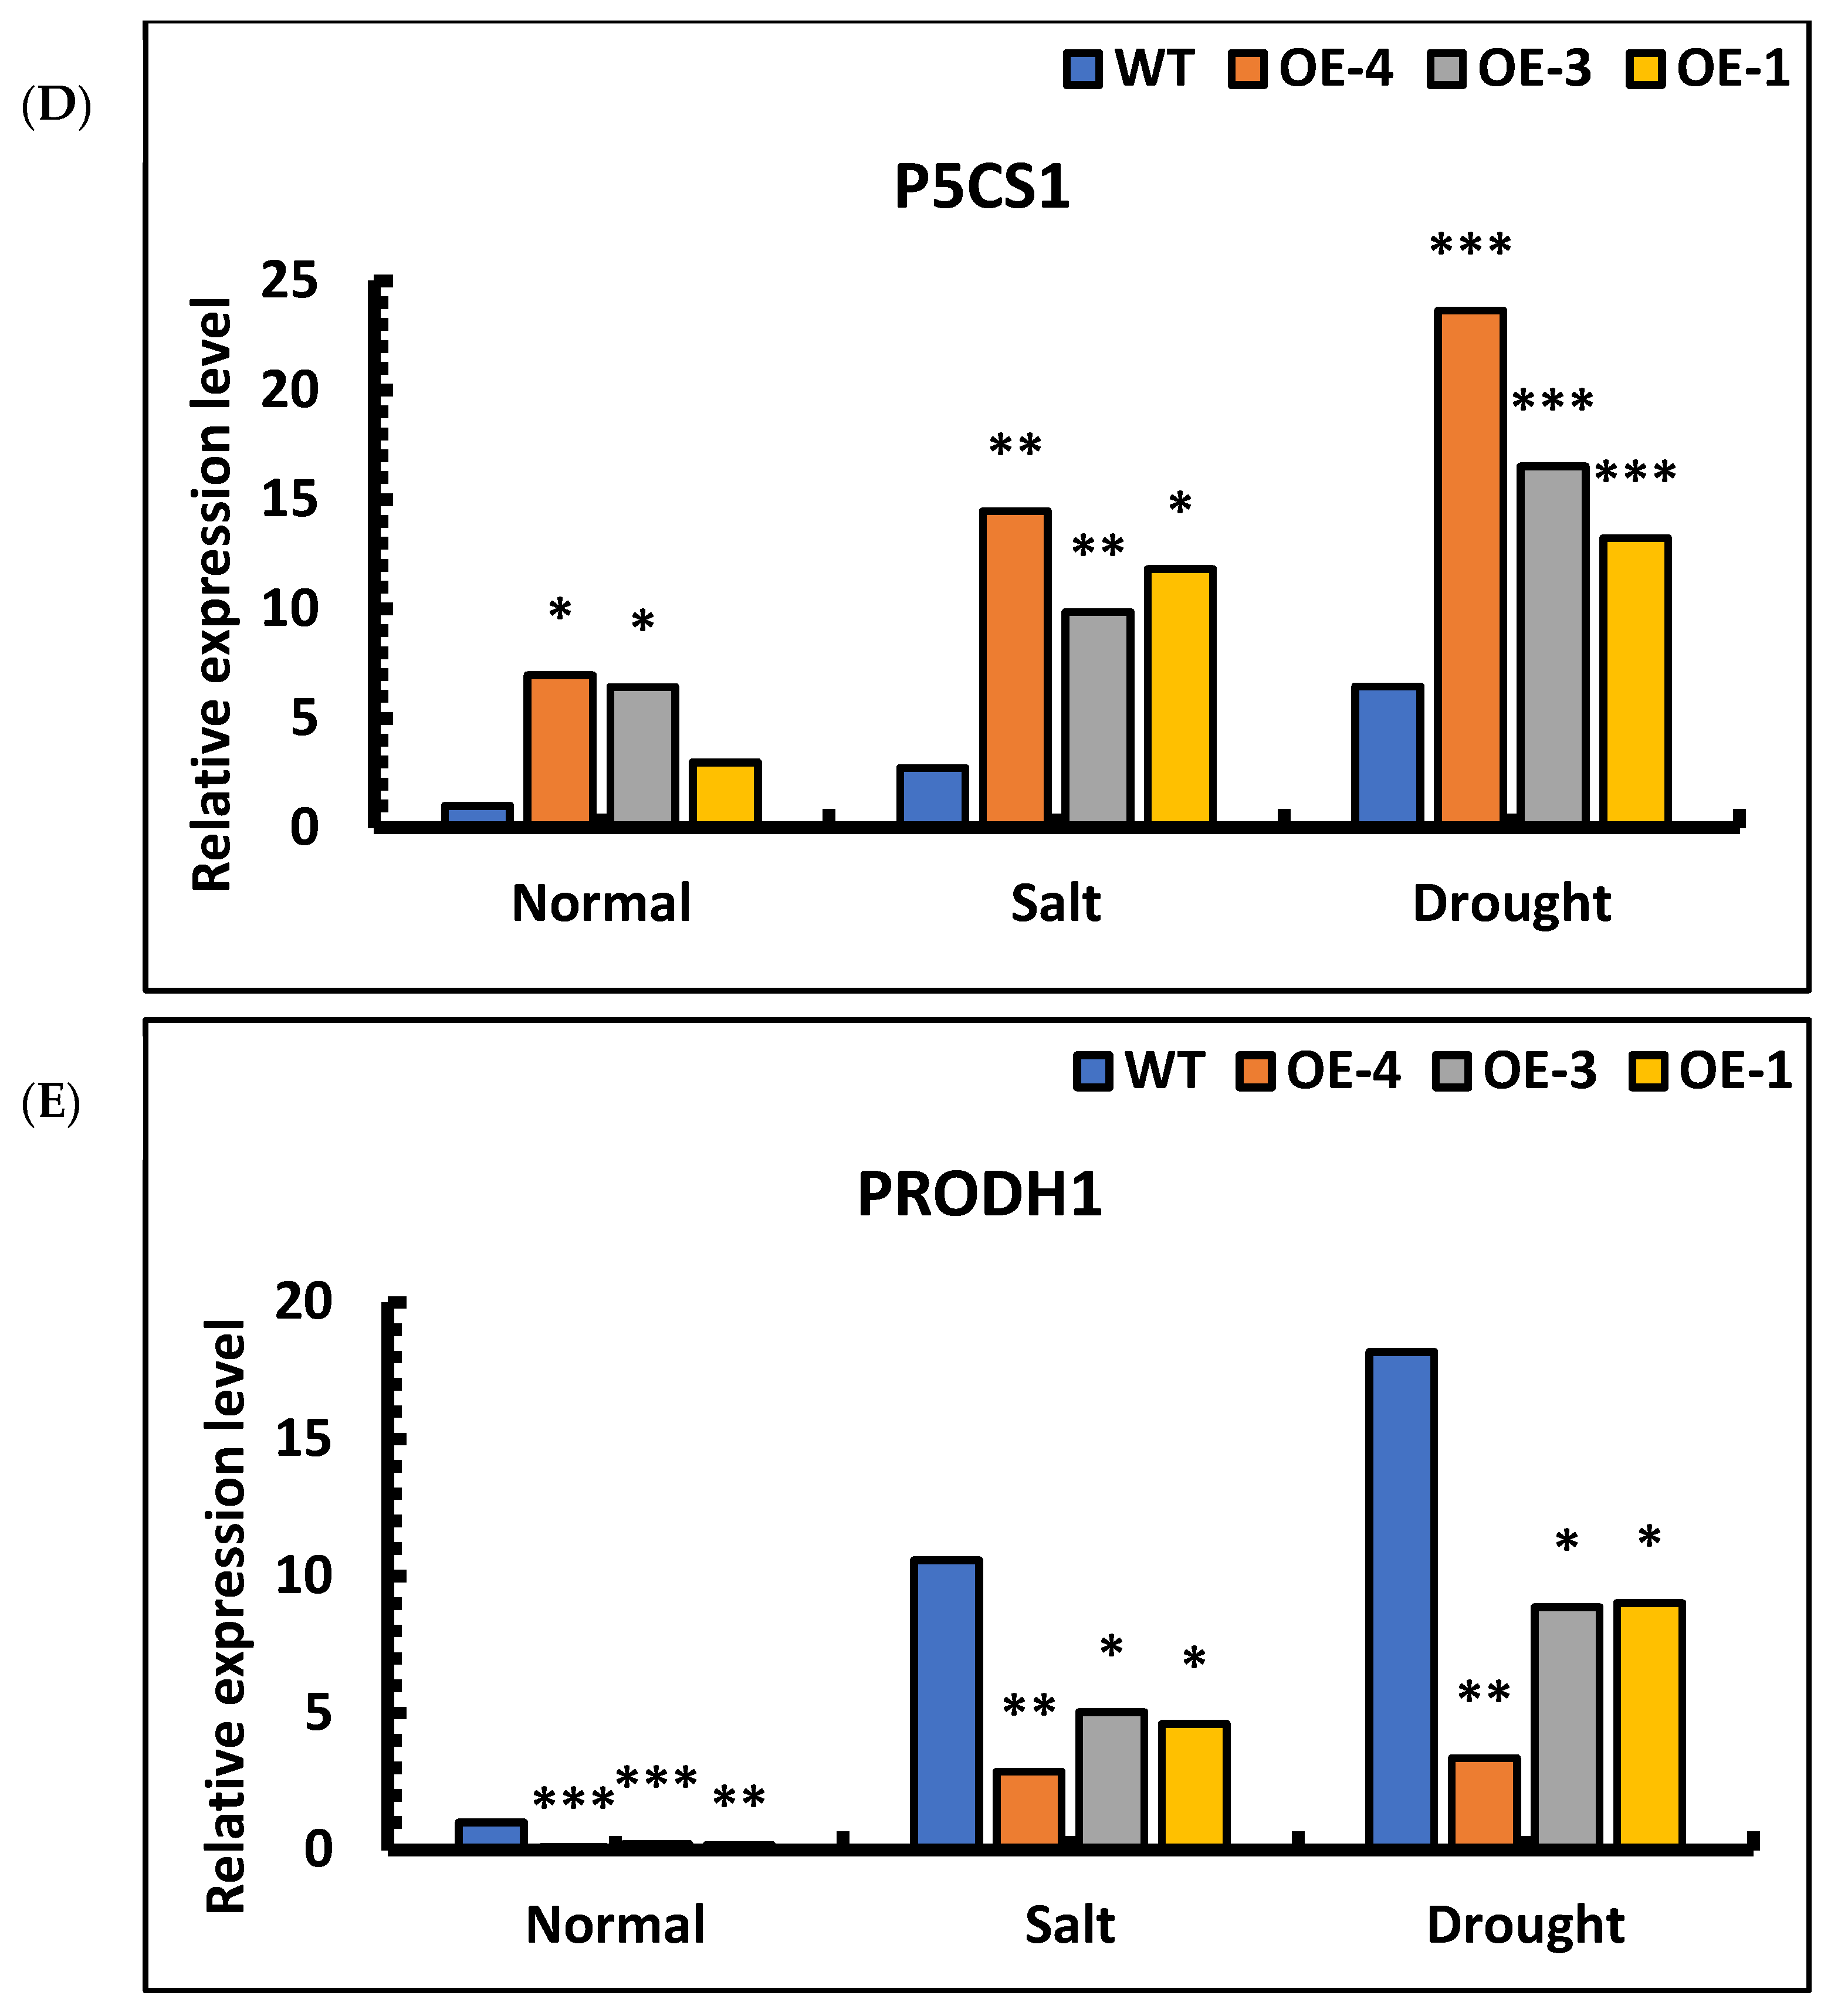
Figure 10.
Expression analysis of SOS1, MPK6, and HKT1 genes in transgenic lines of P. hopeiensis under salt and drought stress: (A) SOS1 gene expression in wild-type and overexpression lines of P. hopeiensis under salt and drought stress; (B) MPK6 gene expression in wild-type and overexpression lines of P. hopeiensis under salt and drought stress; (C) HKT1 gene expression in wild-type and overexpression lines of P. hopeiensis under salt and drought stress; (D) P5CS1 gene expression in wild-type and overexpression lines of P. hopeiensis under salt and drought stress; (E) PRODH1 gene expression in wild-type and overexpression lines of P. hopeiensis under salt and drought stress. Values are the mean ± standard deviation of three independent experiments. The significance of differences was determined using t-test and F-test. *** p < 0.001, extremely significant; ** 0.001 ≤ p < 0.01, very significant; * 0.01 ≤ p < 0.05, significant.
An analysis of MPK6 expression in overexpression lines showed that the expression of the transgenic lines was 3–6 times higher than that of wild-type under salt stress. Under drought stress, the expression of the transgenic lines was 4–5 times higher than that of wild-type. Based on the results of qRT-PCR, the expression of the MPK6 gene under stress was increased compared to level with water treatment, and the expression of the transgenic lines was significantly higher than that of wild-type plants under the same treatment (Figure 10B). Therefore, the MPK6 gene was activated under salt and drought stress, which eventually affected the redox status of the plant cells. The expression of SpsNAC005 increased the relative expression of the MPK6 gene, making transgenic P. hopeiensis significantly more resistant to stress than wild-type.
The analysis of HKT1 expression in transgenic lines showed that the relative expression in OE-4, OE-3, OE-1, and wild-type plants increased 4.81-fold, 3.90-fold, 2.08-fold, and 1.45-fold, respectively, under salt stress compared with water treatments. Under drought stress, the relative expression in OE-4, OE-3, OE-1, and wild-type plants increased 7.97-fold, 6.47-fold, 2.11-fold, and 1.48-fold, respectively, compared with water treatments. The results indicate that the expression of the MPK6 gene in all transgenic lines was significantly higher than that in the wild-type plants under the same stress treatment (Figure 10C). Therefore, SpsNAC005 upregulated the expression of the HKT1 gene, which enabled the plants to maintain the sodium–potassium ratio during osmoregulation and improved the tolerance of transgenic P. hopeiensis to stress.
The expression analysis of P5CS1 in overexpression lines showed that the relative expression level in transgenic lines under salt stress was 3–5 times higher than that in wild type. Under drought stress, the relative expression level in transgenic lines was 2–4 times higher than in wild type. The results showed that expression of the P5CS1 gene in overexpression lines was up-regulated under stress and that its relative expression in transgenic lines was significantly higher than in wild-type under the same treatment (Figure 10D). The expression analysis of PRODH1 in overexpression lines showed that the relative expression level in transgenic lines under salt stress was 2–3 times lower than in wild type. Under drought stress, the expression level in transgenic lines was 2–4 times lower than in wild type. The results showed that the relative expression of the PRODH1 gene was down-regulated under stress and that its relative expression in transgenic lines was significantly lower than in wild-type under the same treatment (Figure 10E). Therefore, the P5CS1 and PRODH1 genes can be induced by salt and drought stress, promote the synthesis of proline in plants, and protect plants from injury under stress.
4. Discussion
4.1. SpsNAC005 Gene Promotes the Growth and Development of Plants
The SpsNAC005 gene promotes the growth and development of woody plants. The SpsNAC005 gene is an orthologous gene with ANAC032 (AT1G77450.1), Potri.005G069500.1, and Sapur.005G052900.1 [40]. ANAC032 overexpression of Arabidopsis causes plants to accumulate more biomass, and their leaf area was significantly larger than that in the control and chimeric repressor lines [41]. The NAC transcription factor HaNAC1 was isolated from Haloxylon ammodendron, and ectopic expression in Arabidopsis promoted the growth of Arabidopsis [10]. Among 74 NAC transcription factors obtained from the whole Solanum lycopersicum genome, SNAC4-9 genes were involved in the growth and development of S. lycopersicum [42]. In this study, the SpsNAC005 gene was overexpressed in P. hopeiensis, and a significant increase in plant height and ground diameter was found in transgenic lines. At the same time, the results showed that the leaf area of plants increased, which was consistent with the phenotype of ANAC032 overexpression plants in Arabidopsis. NAC genes can positively regulate plant growth and development. So, we think the SpsNAC005 gene had a role in promoting plant growth and development in woody plants.
4.2. SpsNAC005 Gene Enhances Stress Tolerance and Antioxidant Capacity of Transgenic P. hopeiensis
The SpsNAC005 gene can enhance plant tolerance under stress. As demonstrated in other NAC-related gene studies, numerous NAC transcription factors are involved in the expression of drought, salinity, low temperature, and high temperature responsive genes, which play an important role in plant resistance to stress [43]. Through microarray analysis, ANAC032 was isolated from Arabidopsis thaliana under multiple biological stresses (salt, drought, and cold stress). ANAC032 was identified as a valuable candidate gene that could be used to cultivate feed crops resistant to multiple biological stresses through genetic modification of a single gene [41]. The overexpression of OSNAC10 [44] and OSNAC045 [45] genes in Oryza sativa improved resistance. The Tartary buckwheat NAC transcription factor FtNAC17 responds to abiotic stresses such as drought, low temperature, and salt [46]. Transient genetic transformation of the LoNAC18 gene in Larix olgensis indicated that the gene was involved in regulating the response of L. olgensis to PEG simulated drought stress [47]. HaNAC20 was cloned in Haloxylon ammodendron, and an in-depth analysis verified that this gene can respond to abiotic stress [48]. The PsnNAC030 gene was cloned, and it was verified through relevant experiments using Populus simonii × P. nigra as experimental material that the gene’s expression could be effectively induced by salt, drought, and high and low temperature [49]. In Populus simonii × P. nigra overexpressing ERF76, Potri.005G069500.1 was significantly up-regulated under NaCl, KCl, CdCl2, and PEG stress, indicating that Potri.005G069500.1 had a synergistic effect on improving the tolerance of transgenic plants [50]. In our study, we found that the height, leaf area, and growth rate of the transgenic lines were significantly higher than in wild-type during stress. Under salt and simulated drought treatment, the overexpression lines remained alive, and the antioxidant capacity of transgenic poplar was significantly higher than that of wild-type. In conclusion, the overexpression of SpsNAC005 enhanced the tolerance of P. hopeiensis to the stress treatments.
The SpsNAC005 gene enhanced the antioxidant capacity of P. hopeiensis. In related studies, the cloned sweet potato IbNAC72 gene showed significantly higher SOD activity, significantly lower MDA content, and significantly higher drought resistance in transgenic plants under prolonged drought conditions [51]. In a study on drought tolerance genes in Zea mays, ZmNAC33 participated in the regulation of ABA signaling pathway genes by regulating the expression of drought tolerance genes in plants, improving the activity of antioxidant enzymes and the content of osmotic protection substances in plants, and enhancing the drought tolerance of plants [52]. In Tamarix chinensis, overexpression of ThNAC12 lines enhanced antioxidant enzyme activities and improved salt tolerance in transgenic plants under salt stress [53]. In this study, the SOD and POD activities of the overexpression lines were significantly higher than those of wild-type, and the MDA contents were significantly lower under salt and simulated drought stress. These results indicate that overexpression of the SpsNAC005 gene in P. hopeiensis enhanced the antioxidant capacity of P. hopeiensis. The SpsNAC005 gene high expression line had higher SOD and POD and lower MDA; these results further indicate that the antioxidant capacity of the SpsNAC005 gene high expression line was stronger, and that the expression of the SpsNAC005 gene was positively correlated with the antioxidant capacity of poplar. The abovementioned studies fully demonstrated that SpsNAC005 could enhance the antioxidant enzyme activity in transgenic P. hopeiensis and mitigate the extent of damage to plant lipid membranes from osmotic stress.
4.3. SpsNAC005 Gene Regulates Tolerance to Stress through Na+ Transporters Pathway
The SpsNAC005 gene enhanced the expression of the SOS1, MPK6, and HKT1 genes. SOS1, which encodes a plasma membrane Na+/H+ reverse transporter protein, is a major member of the ion homeostasis regulatory pathway during plant salt stress signal transduction [54]. Moreover, overexpression of the SOS1 gene in Arabidopsis and Chrysanthemum resulted in enhanced salt tolerance [55,56]. In our study, we found that the expression level of the SOS1 gene was significantly higher in overexpression lines of P. hopeiensis than in wild-type under stress. The overexpression of the SpsNAC005 gene in this study likely regulated the SOS1 gene directly or indirectly to attenuate the toxic effects of osmotic stress on transgenic lines by regulating the ion concentration around the cell membrane and improved the resistance of transgenic P. hopeiensis to stress.
MPK is a large family of serine/threonine protein kinases and is one of the biological signal transduction systems [57]. When plants are subjected to abiotic stress, plant cells can activate defense genes that affect the redox status, ultimately leading to the activation of MPK with a series of metabolic changes [58]. Arabidopsis activates MPK6 under salt stress [59]. In the present study, the expression of the MPK6 gene was significantly increased under both salt and drought stresses. The MPK6 gene was positively correlated with the expression of the SpsNAC005 gene under stress conditions, indicating that the SpsNAC005 gene may positively regulate the MPK6 gene, thus activating the defense mechanism of the plant and making transgenic P. hopeiensis more tolerant of osmotic stress.
HKT is a protein transporter with a high affinity for K+ that is also capable of transporting Na+, which maintains a normal sodium–potassium ratio in plants when they are subjected to osmoregulatory stress and ion partitioning [60]. The salt tolerance of the HKT1 gene has been verified in Triticum aestivum [61], Hordeum vulgare [62], Oryza sativa [63], and Vitis vinifera [64], which reduced the accumulation of Na+ in plants and reduced the osmotic imbalance to the greatest extent. When subjected to stress, the expression of the HKT1 gene was significantly higher in overexpression lines than in wild-type. The present study showed that under stress, SpsNAC005 overexpression in P. hopeiensis may alleviate the accumulation of Na+ in plants by regulating the expression of the HKT1 gene in the medium, attenuating the toxic effect of Na+ on plants and enhancing the tolerance of transgenic P. hopeiensis.
4.4. SpsNAC005 Gene Responds to Stress by Regulating Proline Synthesis
Under different stress conditions caused by factors such as drought, salinization, heavy metals and ultraviolet radiation, proline accumulation in plants can be induced, playing a protective role in plants. In higher plants, proline synthesis has two pathways, with glutamic acid and ornithine as precursors, respectively. Among them, the glutamate pathway is mainly responsible for proline accumulation under stress conditions [65]. Pyrroline-5-carboxylic acid synthase (P5CS) catalyzes the first step of the glutamate synthesis pathway and is the key enzyme in proline synthesis pathway [66]. PRODH is the rate-limiting enzyme in the proline decomposition pathway [67]. Early studies have improved drought and salt tolerance in Arabidopsis by antisense inhibition of the PRODH gene [68]. In Arabidopsis, the P5CS1 gene is expressed in most organs and is induced by high salt, drought and ABA stress, but not in rapidly dividing cells [69]. The stress tolerance of transgenic AtP5CS1 plants was analyzed, showing that under the stress of 150 mmol/L NaCl and 15% PEG6000, the proline content was significantly increased, and AtP5CS1 transgenic plants had a better phenotype than the control; that is, the expression of AtP5CS1 gene in Brassica oleracea significantly improved the salt tolerance and drought tolerance of transgenic plants. In our study, under salt and simulated drought stress, the P5CS1 gene of SpsNAC005 transgenic lines was significantly up-regulated, the PRODH1 gene was significantly down-regulated, and the proline content was significantly increased. These results indicate that overexpression of the SpsNAC005 gene may directly or indirectly regulate P5CS1 and PRODH1 genes under pressure stress and improve the resistance of transgenic Populus hopeiensis to stress by catalyzing the glutamate synthesis pathway and limiting proline decomposition.
5. Conclusions
We obtained seven transgenic lines using an Agrobacterium-mediated transformation technique, and their expression levels were determined. The three lines with the highest relative expression were selected for phenotypic observation and subsequent stress treatment, and it was found that the height and leaf area of the transgenic plants were significantly increased compared with the wild-type plants, and the growth rates of their plant height and ground diameter were significantly higher than those of the wild-type. The fresh weight and dry weight of wild-type were significantly lower than their control. Under salt and drought stress, the SOD activities, POD activities and Pro contents in the transgenic plants were significantly increased, the accumulation of MDA was significantly lower than that in the wild type, and the transgenic strains clearly showed tolerance to salt and drought. Meanwhile, it was found that the expressions of SOS1, MPK6, and HKT1 genes were also up-regulated by quantitative measurements. The expression of the PRODH1 gene was down-regulated based on quantitative measurements. In conclusion, overexpression of the SpsNAC005 gene in transgenic plants can promote plant growth and development and improve tolerance to salt and drought.
Author Contributions
H.Y., L.F. wrote sections of the manuscript. L.F. performed the experiments and carried out the statistical analysis. X.Y. completed the vector construction. X.Z. and P.H. assisted in the sample collection and sample grinding. D.W. and G.Z. provided guidance and advice on stress methods in earlier stages of this study. All authors contributed to manuscript revision and approved the submitted version. All authors have read and agreed to the published version of the manuscript.
Funding
This work was supported by the National Key Program on Transgenic Research (2018ZX08020002-005-005), the Key Technology Research Project of Inner Mongolia Autonomous Region (2021GG0075) and the National Natural Science Foundation of China (31660216).
Institutional Review Board Statement
Not applicable.
Informed Consent Statement
Not applicable.
Data Availability Statement
Not applicable.
Acknowledgments
We acknowledge everyone who contributed to this article.
Conflicts of Interest
The authors declare no conflict of interest.
Abbreviations
| qRT-PCR | Quantitative real-time PCR |
| cDNA | Complementary DNA |
References
- Christianson, J.A.; Dennis, E.S.; Llewellyn, D.J.; Wilson, I.W. ATAF NAC transcription factors: Regulators of plant stress signaling. Plant. Signal. Behav. 2010, 5, 428–432. [Google Scholar] [CrossRef] [PubMed] [Green Version]
- Souer, E.; van Houwelingen, A.; Kloos, D.; Mol, J.; Koes, R. The No Apical Meristem Gene of Petunia Is Required for Pattern Formation in Embryos and Flowers and Is Expressed at Meristem and Primordia Boundaries. Cell 1996, 85, 159–170. [Google Scholar] [CrossRef] [Green Version]
- Aida, M.; Ishida, T.; Fukaki, H.; Fujisawa, H.; Tasaka, M. Genes involved in organ separation in Arabidopsis: An analysis of the cup-shaped cotyledon mutant. Plant. Cell 1997, 9, 841–857. [Google Scholar] [CrossRef] [Green Version]
- Ernst, H.A.; Olsen, A.N.; Skriver, K.; Larsen, S.; Leggio, L.L. Structure of the conserved domain of ANAC, a member of the NAC family of transcription factors. EMBO Rep. 2004, 5, 297–303. [Google Scholar] [CrossRef] [PubMed]
- Chen, Q.; Wang, Q.; Xiong, L.; Lou, Z. A structural view of the conserved domain of rice stress-responsive NAC1. Protein Cell 2011, 2, 55–63. [Google Scholar] [CrossRef] [PubMed] [Green Version]
- Olsen, A.N.; Ernst, H.A.; Leggio, L.L.; Skriver, K. NAC transcription factors: Structurally distinct, functionally diverse. Trends Plant. Sci. 2005, 10, 79–87. [Google Scholar] [CrossRef]
- Li, W.; Han, L.; Qian, Y.Q.; Sun, Z.Y. Characteristics and Functions of NAC Transcription Factors in Plants. Chin. J. Appl. Environ. Biol. 2011, 17, 596–606. Available online: https://en.cnki.com.cn/Article_en/CJFDTotal-YYHS201104030.htm (accessed on 13 December 2021).
- Ooka, H.; Satoh, K.; Doi, K.; Nagata, T.; Otomo, Y.; Murakami, K.; Matsubara, K.; Osato, N.; Kawai, J.; Carninci, P.; et al. Comprehensive Analysis of NAC Family Genes in Oryza sativa and Arabidopsis thaliana. DNA Res. 2003, 10, 239–247. [Google Scholar] [CrossRef]
- Hu, R.; Qi, G.; Kong, Y.; Kong, D.; Gao, Q.; Zhou, G. Comprehensive Analysis of NAC Domain Transcription Factor Gene Family in Populus trichocarpa. BMC Plant. Biol. 2010, 10, 145. [Google Scholar] [CrossRef] [Green Version]
- Gong, L.; Zhang, H.; Liu, X.; Gan, X.; Nie, F.; Yang, W.; Zhang, L.; Chen, Y.; Song, Y.; Zhang, H. Ectopic expression of HaNAC1, an ATAF transcription factor from Haloxylon ammodendron, improves growth and drought tolerance in transgenic Arabidopsis. Plant. Physiol. Biochem. 2020, 151, 535–544. [Google Scholar] [CrossRef]
- Mahmood, K.; El-Kereamy, A.; Kim, S.-H.; Nambara, E.; Rothstein, S.J. ANAC032 Positively Regulates Age-Dependent and Stress-Induced Senescence in Arabidopsis thaliana. Plant. Cell Physiol. 2016, 57, 2029–2046. [Google Scholar] [CrossRef] [PubMed] [Green Version]
- Mahmood, K.; Xu, Z.; El-Kereamy, A.; Casaretto, J.A.; Rothstein, S.J. The Arabidopsis Transcription Factor ANAC032 Represses Anthocyanin Biosynthesis in Response to High Sucrose and Oxidative and Abiotic Stresses. Front. Plant Sci. 2016, 7, 1548. [Google Scholar] [CrossRef] [PubMed]
- Fan, L.; Fan, C.H. Cloning and Expression Analysis of CaNAC23 Gene in Capsicum annuum L. Mol. Plant Breed. 2020, 18, 3854–3861. [Google Scholar]
- Zhang, L.Q.; Jia, X.H.; Zhao, J.W.; Liu, Y.X.; Hasiagula. Cloning and Expression Analysis of MfNAC37 from Medicago falcata under Salt Stress. Chin. J. Grassl. 2019, 41, 10–14+166. [Google Scholar] [CrossRef]
- Jia, D.; Jiang, Q.; van Nocker, S.; Gong, X.; Ma, F. An apple (Malus domestica) NAC transcription factor enhances drought tolerance in transgenic apple plants. Plant Physiol. Biochem. 2019, 139, 504–512. [Google Scholar] [CrossRef]
- Hu, H.; Dai, M.; Yao, J.; Xiao, B.; Li, X.; Zhang, Q.; Xiong, L. Overexpressing a NAM, ATAF, and CUC (NAC) transcription factor enhances drought resistance and salt tolerance in rice. Proc. Natl. Acad. Sci. USA 2006, 103, 12987–12992. [Google Scholar] [CrossRef] [Green Version]
- Jia, H.; Zhang, J.; Li, J.; Sun, P.; Zhang, Y.; Xin, X.; Lu, M.; Hu, J. Genome-wide transcriptomic analysis of a desert willow, Salix psammophila, reveals the function of hub genes SpMDP1 and SpWRKY33 in drought tolerance. BMC Plant Biol. 2019, 19, 1–15. [Google Scholar] [CrossRef] [Green Version]
- Li, W.X.; Liu, Z.X.; Yan, W.; Zhang, X.J.; Miu, S.G.; Huo, J.F.; Wang, Y.S. Study on Good Family Breeding of Salix Psammophila. J. Desert Res. 2008, 28, 679–684. [Google Scholar]
- Gu, M.H.; Xie, Z.H. Soil moisture characteristics of eight types of shelter forest in Kubuqi desert. Pratacult. Sci. 2017, 34, 2437–2444. [Google Scholar]
- Luo, W.X.; Liu, G.Q.; Li, J.J. Cultivation Techniques for Main Tree Species in Northwest China. China For. Press. 2007, 8, 682–687. [Google Scholar]
- Yu, X.Y. Cloning of NAC in Salix psammophila, Bioinformatics Analysis and Construction of Expression. Master’s Thesis, Inner Mongolia agricultural University, Hohhot, China, 2020. [Google Scholar]
- Horsch, R.B.; Fry, J.E.; Hoffmann, N.L.; Wallroth, M.; Eichholtz, D.; Rogers, S.G.; Fraley, R.T. A Simple and General Method for Transferring Genes into Plants. Science 1985, 227, 1229–1231. [Google Scholar] [CrossRef] [PubMed]
- Chen, K.-S.; Li, F.; Xu, C.-J.; Zhang, S.-L.; Fu, C.-X. An efficient macro-method of genomic DNA isolation from Actinidia chinensis leaves. Hereditas 2004, 26, 529–531. [Google Scholar] [PubMed]
- Yang, H.F.; Bo, G.F. Cloning and expression analysis of SpsNAC042 gene in Salix psammophila. J. Northwest For. Univ. 2021, 36, 11–17+27. [Google Scholar]
- Livak, K.J.; Schmittgen, T.D. Analysis of Relative Gene Expression Data Using Real-Time Quantitative PCR and the 2−ΔΔCT Method. Methods 2001, 25, 402–408. [Google Scholar] [CrossRef] [PubMed]
- Tian, Q.; Cao, Z.Z. Digital camera and Auto CAD based method for measuring the leaf area of landscape plants. Grassl. Turf. 2008, 3, 25–28. [Google Scholar]
- Cai, X.; Jiang, Z.; Tang, L.; Zhang, S.; Li, X.; Wang, H.; Liu, C.; Chi, J.; Zhang, X.; Zhang, J. Genome-wide characterization of carotenoid oxygenase gene family in three cotton species and functional identification of GaNCED3 in drought and salt stress. J. Appl. Genet. 2021, 62, 527–543. [Google Scholar] [CrossRef]
- Ning, H.L. Field Experiment and Statistical Methods; Science Press: Beijing, China, 2012; Available online: http://ss.zhizhen.com/detail_38502727e7500f26a81075d227d4798ebf0734766bdfb21d1921b0a3ea25510134114c969f2eae5c34597dee38cfeccc2f9303951adbee66eb7ea3d7539ba9795c5481485155be4acdc25c707daf213c? (accessed on 4 March 2022).
- Puranik, S.; Sahu, P.P.; Srivastava, P.S.; Prasad, M. NAC proteins: Regulation and role in stress tolerance. Trends Plant Sci. 2012, 17, 369–381. [Google Scholar] [CrossRef]
- Shen, H.; Yin, Y.; Chen, F.; Xu, Y.; Dixon, R.A. A Bioinformatic Analysis of NAC Genes for Plant Cell Wall Development in Relation to Lignocellulosic Bioenergy Production. Bioenerg. Res. 2009, 2, 217–232. [Google Scholar] [CrossRef]
- Hibara, K.; Takada, S.; Tasaka, M. CUC1 gene activates the expression of SAM-related genes to induce adventitious shoot formation. Plant J. 2003, 36, 687–696. [Google Scholar] [CrossRef]
- Zhong, R.; Richardson, E.A.; Ye, Z.-H. Two NAC domain transcription factors, SND1 and NST1, function redundantly in regulation of secondary wall synthesis in fibers of Arabidopsis. Planta 2007, 225, 1603–1611. [Google Scholar] [CrossRef]
- Mitsuda, N.; Iwase, A.; Yamamoto, H.; Yoshida, M.; Seki, M.; Shinozaki, K.; Ohme-Takagi, M. NAC Transcription Factors, NST1 and NST3, Are Key Regulators of the Formation of Secondary Walls in Woody Tissues of Arabidopsis. Plant Cell 2007, 19, 270–280. [Google Scholar] [CrossRef] [PubMed] [Green Version]
- Zhao, C.; Avci, U.; Grant, E.H.; Haigler, C.H.; Beers, E.P. XND1, a member of the NAC domain family in Arabidopsis thaliana, negatively regulates lignocellulose synthesis and programmed cell death in xylem. Plant J. 2008, 53, 425–436. [Google Scholar] [CrossRef] [PubMed]
- Tran, L.-S.P.; Nakashima, K.; Sakuma, Y.; Simpson, S.D.; Fujita, Y.; Maruyama, K.; Fujita, M.; Seki, M.; Shinozaki, K.; Yamaguchi-Shinozaki, K. Isolation and Functional Analysis of Arabidopsis Stress-Inducible NAC Transcription Factors That Bind to a Drought-Responsive cis-Element in the early responsive to dehydration stress 1 Promoter[W]. Plant Cell 2004, 16, 2481–2498. [Google Scholar] [CrossRef] [PubMed] [Green Version]
- Guo, Y.; Gan, S. AtNAP, a NAC family transcription factor, has an important role in leaf senescence. Plant J. 2006, 46, 601–612. [Google Scholar] [CrossRef]
- Yang, Z.-T.; Lu, S.-J.; Wang, M.-J.; Bi, D.-L.; Sun, L.; Zhou, S.-F.; Song, Z.-T.; Liu, J.-X. A plasma membrane-tethered transcription factor, NAC062/ANAC062/NTL6, mediates the unfolded protein response in Arabidopsis. Plant J. 2014, 79, 1033–1043. [Google Scholar] [CrossRef]
- Jung, J.-H.; Park, C.-M. Auxin modulation of salt stress signaling in Arabidopsis seed germination. Plant Signal. Behav. 2011, 6, 1198–1200. [Google Scholar] [CrossRef] [Green Version]
- Liu, Y.; Sun, J.; Wu, Y. Arabidopsis ATAF1 enhances the tolerance to salt stress and ABA in transgenic rice. J. Plant Res. 2016, 129, 955–962. [Google Scholar] [CrossRef]
- Yang, H.F.; Yu, X.W.; Jin, N.; He, Y.J.; Li, A.Y.; Zhang, X.; Wang, Y.Z.; Gao, Y.Y.; Wang, L. Cloning and bioinformatics analysis of SpsNAC005 gene in Salix psammophila. J. Inn. Mong. Agric Univ. 2021, 42, 65–71. [Google Scholar]
- Sun, L.; Zhang, P.; Wang, R.; Wan, J.; Ju, Q.; Rothstein, S.J.; Xu, J. The SNAC-A Transcription Factor ANAC032 Reprograms Metabolism in Arabidopsis. Plant Cell Physiol. 2019, 60, 999–1010. [Google Scholar] [CrossRef]
- Wang, S. Cloning and Expression Analysis of Solanum Lycopersicum NAC Transcription Factors. Master’s Thesis, Tianjin University, Tianjin, China, 2014. [Google Scholar]
- Shao, H.; Wang, H.; Tang, X. NAC transcription factors in plant multiple abiotic stress responses: Progress and prospects. Front. Plant Sci. 2015, 6, 902. [Google Scholar] [CrossRef] [Green Version]
- Jeong, J.S.; Kim, Y.S.; Baek, K.H.; Jung, H.; Ha, S.-H.; Do Choi, Y.; Kim, M.; Reuzeau, C.; Kim, J.-K. Root-Specific Expression of OsNAC10 Improves Drought Tolerance and Grain Yield in Rice under Field Drought Conditions. Plant Physiol. 2010, 153, 185–197. [Google Scholar] [CrossRef] [PubMed] [Green Version]
- Yu, S.; Huang, A.; Li, J.; Gao, L.; Feng, Y.; Pemberton, E.; Chen, C. OsNAC45 plays complex roles by mediating POD activity and the expression of development-related genes under various abiotic stresses in rice root. Plant Growth Regul. 2018, 84, 519–531. [Google Scholar] [CrossRef]
- Rong, Y.P.; Tang, B.; Li, P.; Zhang, J.Q.; Chen, Q.F.; Zhu, L.W.; Deng, J.; Huang, J. Identification and Expression of NAC Transcription Factor FtNAC17 in Tartary Buckwheat. Biotechnol. Bull. 2021, 37, 174. [Google Scholar] [CrossRef]
- Zhang, L.; Xiong, H.H.; Cao, Q.; Zhao, J.L.; Zhang, H.G. Drought Resistance of Larch NAC Gene by Transient Genetic Transformation. Bull. Bot. Res. 2020, 40, 394–400. [Google Scholar]
- Zhou, L.D.; Yao, Z.P. Cloning and characterization of the HaNAC20 gene of P. sylvestris. Acta Agric. Boreali-Occident. Sin. 2021, 30, 1556–1564. [Google Scholar]
- Wang, X.Y.; Zhang, X.M. Function analysis of poplar transcription factor PsnNAC030 gene. J. Northeast. For. Univ. 2021, 49, 1–8. [Google Scholar]
- Yao, W.; Zhou, B.; Zhang, X.; Zhao, K.; Cheng, Z.; Jiang, T. Transcriptome analysis of transcription factor genes under multiple abiotic stresses in Populus simonii × P.nigra. Gene 2019, 707, 189–197. [Google Scholar] [CrossRef]
- Zhang, H.; Yang, N.K. Cloning and functional analysis of drought-related gene IbNAC72 in sweet potato. Acta Agron. Sin. 2020, 46, 1649–1658. [Google Scholar]
- Liu, W.P. Mining of Drought-Resistant Related Genes in Maize and Functional Identification of Drought-Resistant Genes. Ph.D. Thesis, Northeastern Agricultural University, Harbin, China, 2020. [Google Scholar]
- Wang, R.; Zhang, Y.; Wang, C.; Wang, Y.-C.; Wang, L.-Q. ThNAC12 from Tamarix hispida directly regulates ThPIP2;5 to enhance salt tolerance by modulating reactive oxygen species. Plant Physiol. Biochem. 2021, 163, 27–35. [Google Scholar] [CrossRef]
- Foster, K.J.; Miklavcic, S.J. A Comprehensive Biophysical Model of Ion and Water Transport in Plant Roots. II. Clarifying the Roles of SOS1 in the Salt-Stress Response in Arabidopsis. Front. Plant Sci. 2019, 10, 1121. [Google Scholar] [CrossRef]
- Shi, H.; Lee, B.; Wu, S.-J.; Zhu, J.-K. Overexpression of a plasma membrane Na+/H+ antiporter gene improves salt tolerance in Arabidopsis thaliana. Nat. Biotechnol. 2003, 21, 81–85. [Google Scholar] [CrossRef] [PubMed]
- Gao, J.; Sun, J.; Cao, P.; Ren, L.; Liu, C.; Chen, S.; Chen, F.; Jiang, J. Variation in tissue Na+ content and the activity of SOS1 genes among two species and two related genera of Chrysanthemum. BMC Plant Biol. 2016, 16, 98. [Google Scholar] [CrossRef] [PubMed] [Green Version]
- Mishra, N.S.; Tuteja, R.; Tuteja, N. Signaling through MAP kinase networks in plants. Arch. Biochem. Biophys. 2006, 452, 55–68. [Google Scholar] [CrossRef] [PubMed]
- Zhang, S.; Liu, Y. Activation of Salicylic Acid–Induced Protein Kinase, a Mitogen-Activated Protein Kinase, Induces Multiple Defense Responses in Tobacco. Plant Cell 2001, 13, 1877–1889. [Google Scholar] [CrossRef] [Green Version]
- Yu, L.; Nie, J.; Cao, C.; Jin, Y.; Yan, M.; Wang, F.; Liu, J.; Xiao, Y.; Liang, Y.; Zhang, W. Phosphatidic acid mediates salt stress response by regulation of MPK6 in Arabidopsis thaliana. New Phytol. 2010, 188, 762–773. [Google Scholar] [CrossRef]
- Rubio, F.; Gassmann, W.; Schroeder, J.I. Sodium-Driven Potassium Uptake by the Plant Potassium Transporter HKT1 and Mutations Conferring Salt Tolerance. Science 1995, 270, 1660–1663. [Google Scholar] [CrossRef]
- Waters, S.; Gilliham, M.; Hrmova, M. Plant High-Affinity Potassium (HKT) Transporters Involved in Salinity Tolerance: Structural Insights to Probe Differences in Ion Selectivity. Int. J. Mol. Sci. 2013, 14, 7660–7680. [Google Scholar] [CrossRef] [Green Version]
- Van Bezouw, R.F.H.M.; Janssen, E.M.; Ashrafuzzaman, M.; Ghahramanzadeh, R.; Kilian, B.; Graner, A.; Visser, R.G.F.; van der Linden, C.G. Shoot sodium exclusion in salt stressed barley (Hordeum vulgare L.) is determined by allele specific increased expression of HKT1;5. J. Plant Physiol. 2019, 241, 153029. [Google Scholar] [CrossRef]
- Suzuki, K.; Yamaji, N.; Costa, A.; Okuma, E.; Kobayashi, N.I.; Kashiwagi, T.; Katsuhara, M.; Wang, C.; Tanoi, K.; Murata, Y.; et al. OsHKT1;4-mediated Na+ transport in stems contributes to Na+ exclusion from leaf blades of rice at the reproductive growth stage upon salt stress. BMC Plant Biol. 2016, 16, 22. [Google Scholar] [CrossRef] [Green Version]
- Liu, C.; Gao, Z. Functional Identification of Grape Potassium Ion Transporter VviHKT1;7 Under Salt Stress. Sci. Agric. Sinina 2021, 54, 1952–1963. [Google Scholar]
- Delauney, A.; Hu, C.; Kishor, P.; Verma, D. Cloning of ornithine delta-aminotransferase cDNA from Vigna aconitifolia by trans-complementation in Escherichia coli and regulation of proline biosynthesis. J. Biol. Chem. 1993, 268, 18673–18678. [Google Scholar] [CrossRef]
- Kishor, P.B.K.; Sangam, S.; Amrutha, R.N.; Laxmi, P.S.; Naidu, K.R.; Rao, K.R.S.S.; Rao, S.; Reddy, K.J.; Theriappan, P.; Sreenivasulu, N. Regulation of proline biosynthesis, degradation, uptake and transport in higher plants: Its implications in plant growth and abiotic stress tolerance. Curr. Sci. 2005, 88, 424–438. [Google Scholar]
- Funck, D.; Eckard, S.; Müller, G. Non-redundant functions of two proline dehydrogenase isoforms in Arabidopsis. BMC Plant Biol. 2010, 10, 70. [Google Scholar] [CrossRef] [PubMed] [Green Version]
- Nanjo, T.; Kobayashi, M.; Yoshiba, Y.; Kakubari, Y.; Yamaguchi-Shinozaki, K.; Shinozaki, K. Antisense suppression of proline degradation improves tolerance to freezing and salinity in Arabidopsis thaliana. FEBS Lett. 1999, 461, 205–210. [Google Scholar] [CrossRef] [Green Version]
- Yoshiba, Y.; Kiyosue, T.; Katagiri, T.; Ueda, H.; Mizoguchi, T.; Yamaguchi-Shinozaki, K.; Wada, K.; Harada, Y.; Shinozaki, K. Correlation between the induction of a gene for Δ1-pyrroline-5-carboxylate synthetase and the accumulation of proline in Arabidopsis thaliana under osmotic stress. Plant J. 1995, 7, 751–760. [Google Scholar] [CrossRef]


Publisher’s Note: MDPI stays neutral with regard to jurisdictional claims in published maps and institutional affiliations. |
© 2022 by the authors. Licensee MDPI, Basel, Switzerland. This article is an open access article distributed under the terms and conditions of the Creative Commons Attribution (CC BY) license (https://creativecommons.org/licenses/by/4.0/).