
Accuracy of Defoliation Estimates from Aerial and Ground Surveys in a Boreal Forest during an Outbreak of the Hemlock Looper, Lambdina fiscellaria (Guenée)

 ,
,  and
and 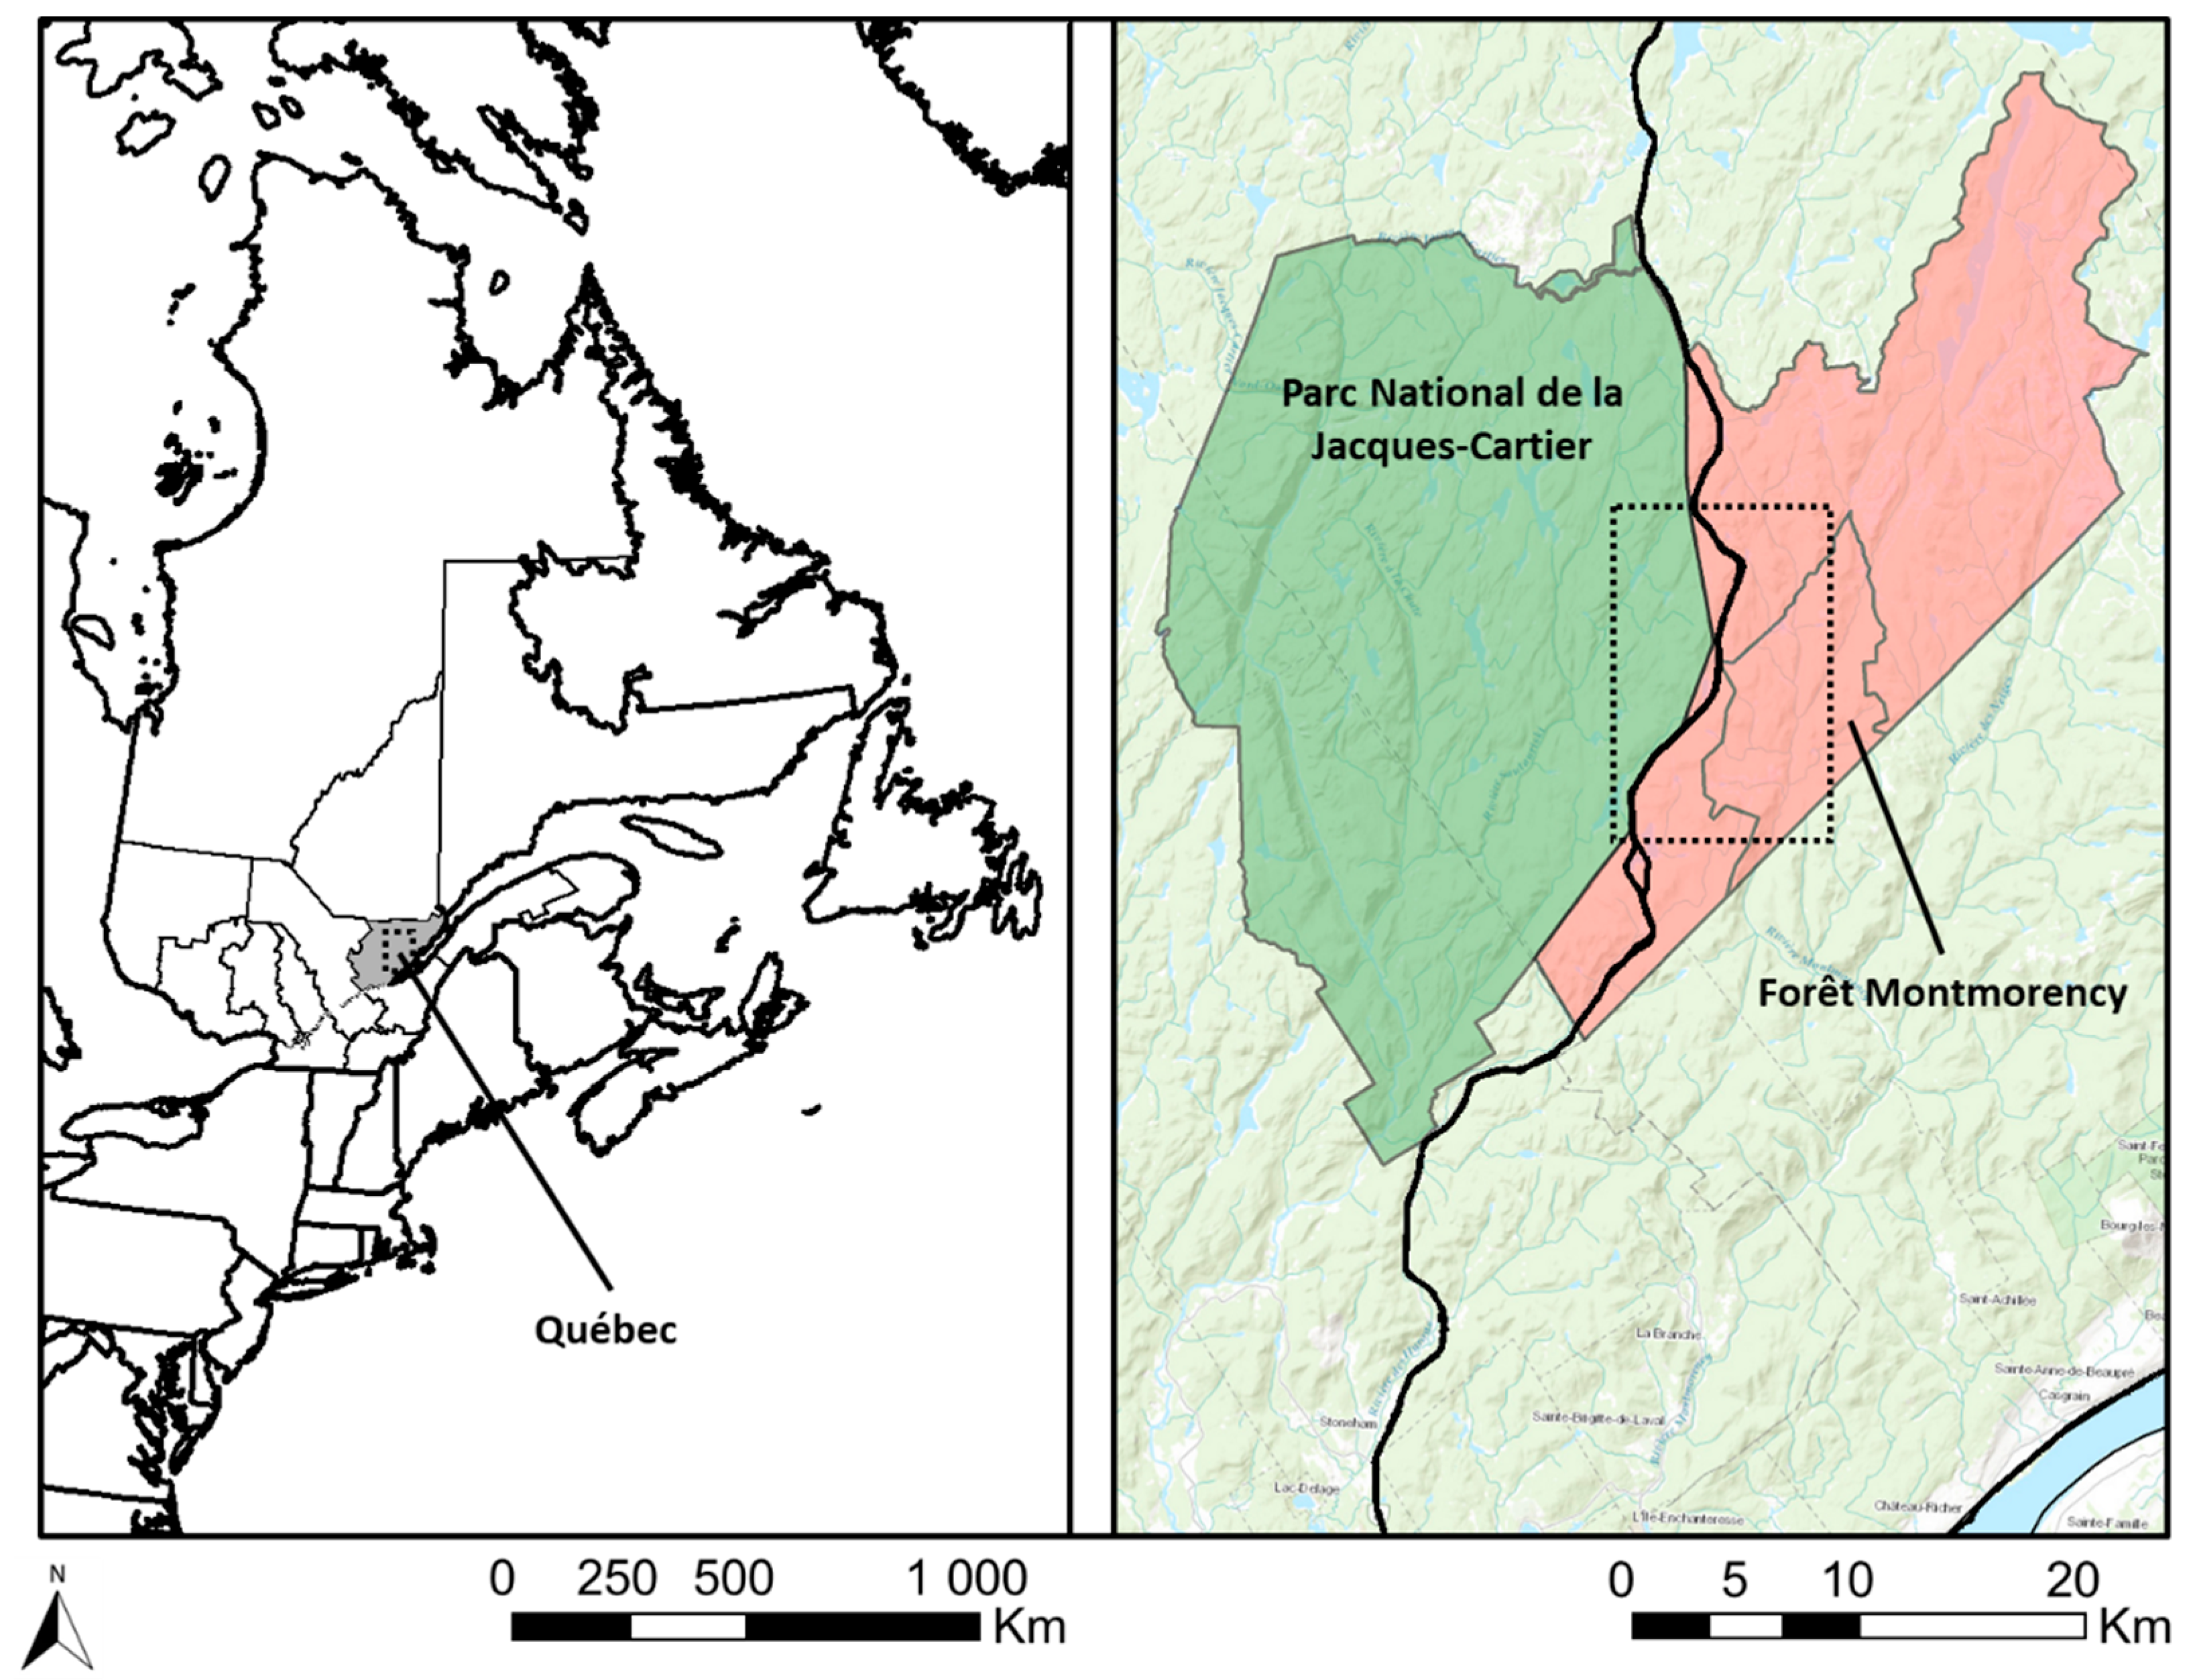
Abstract
1. Introduction
2. Materials and Methods
2.1. Study Area
2.2. Stand Selection and Defoliation Estimation
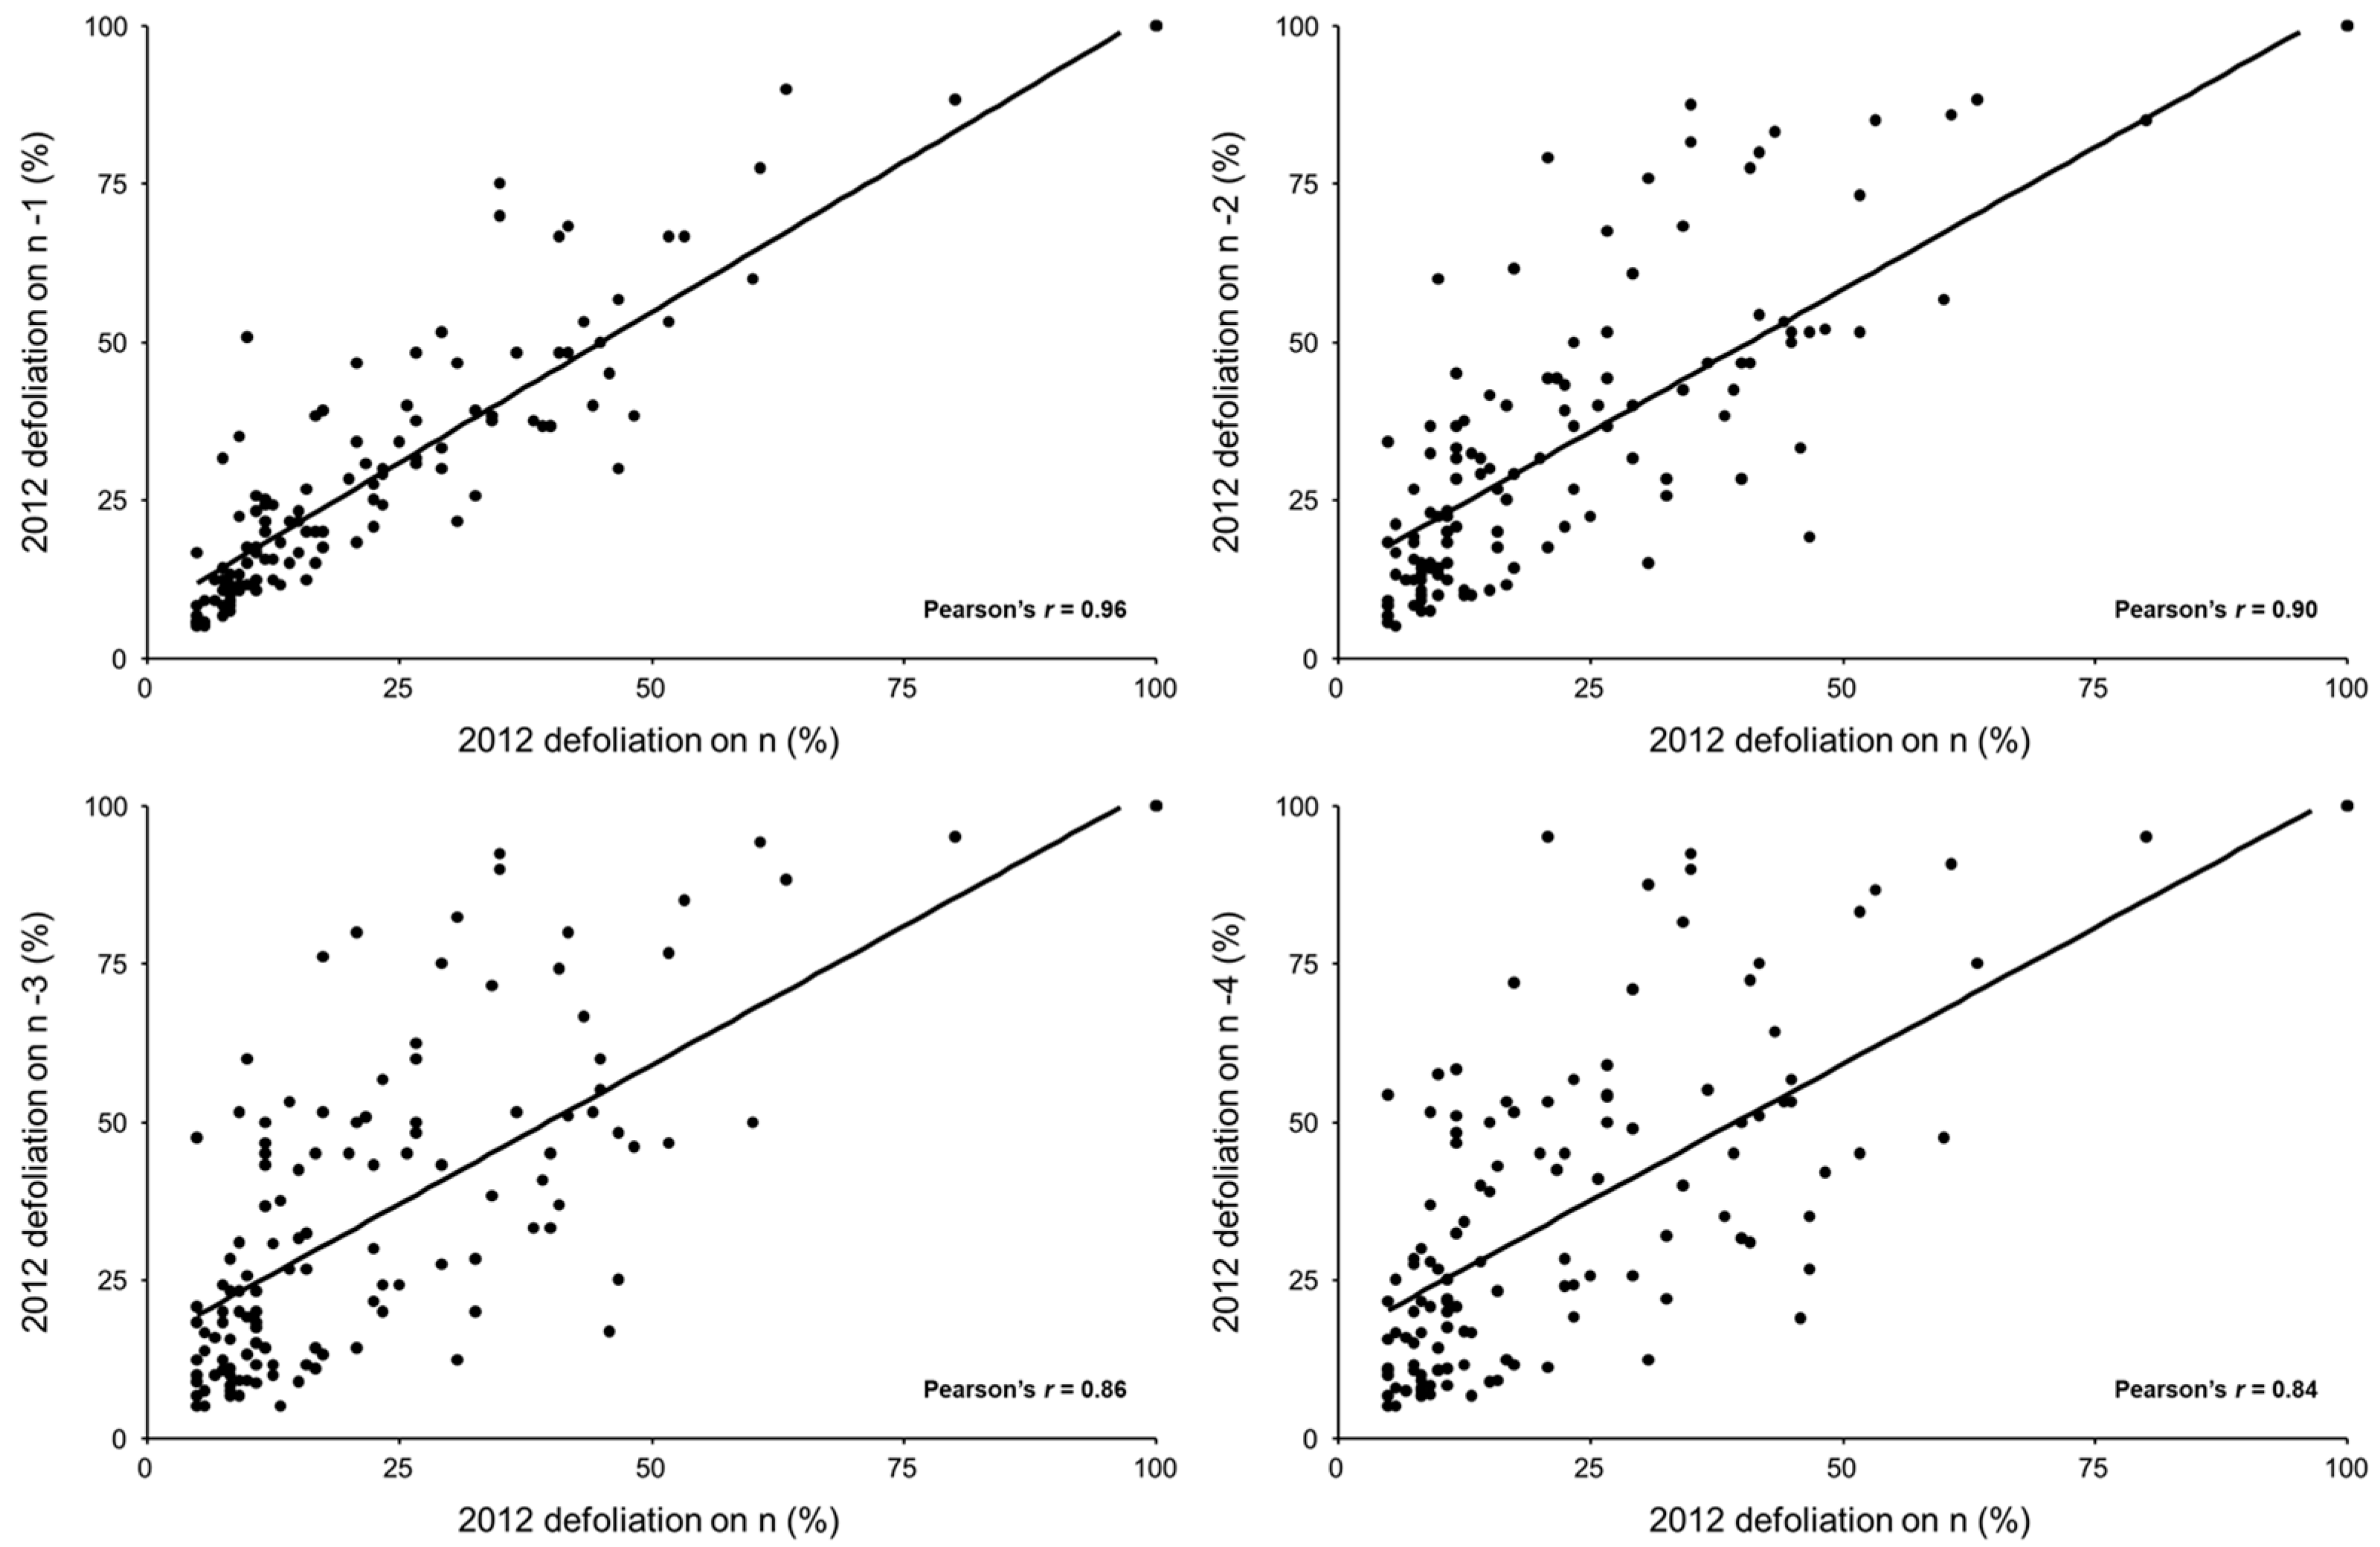
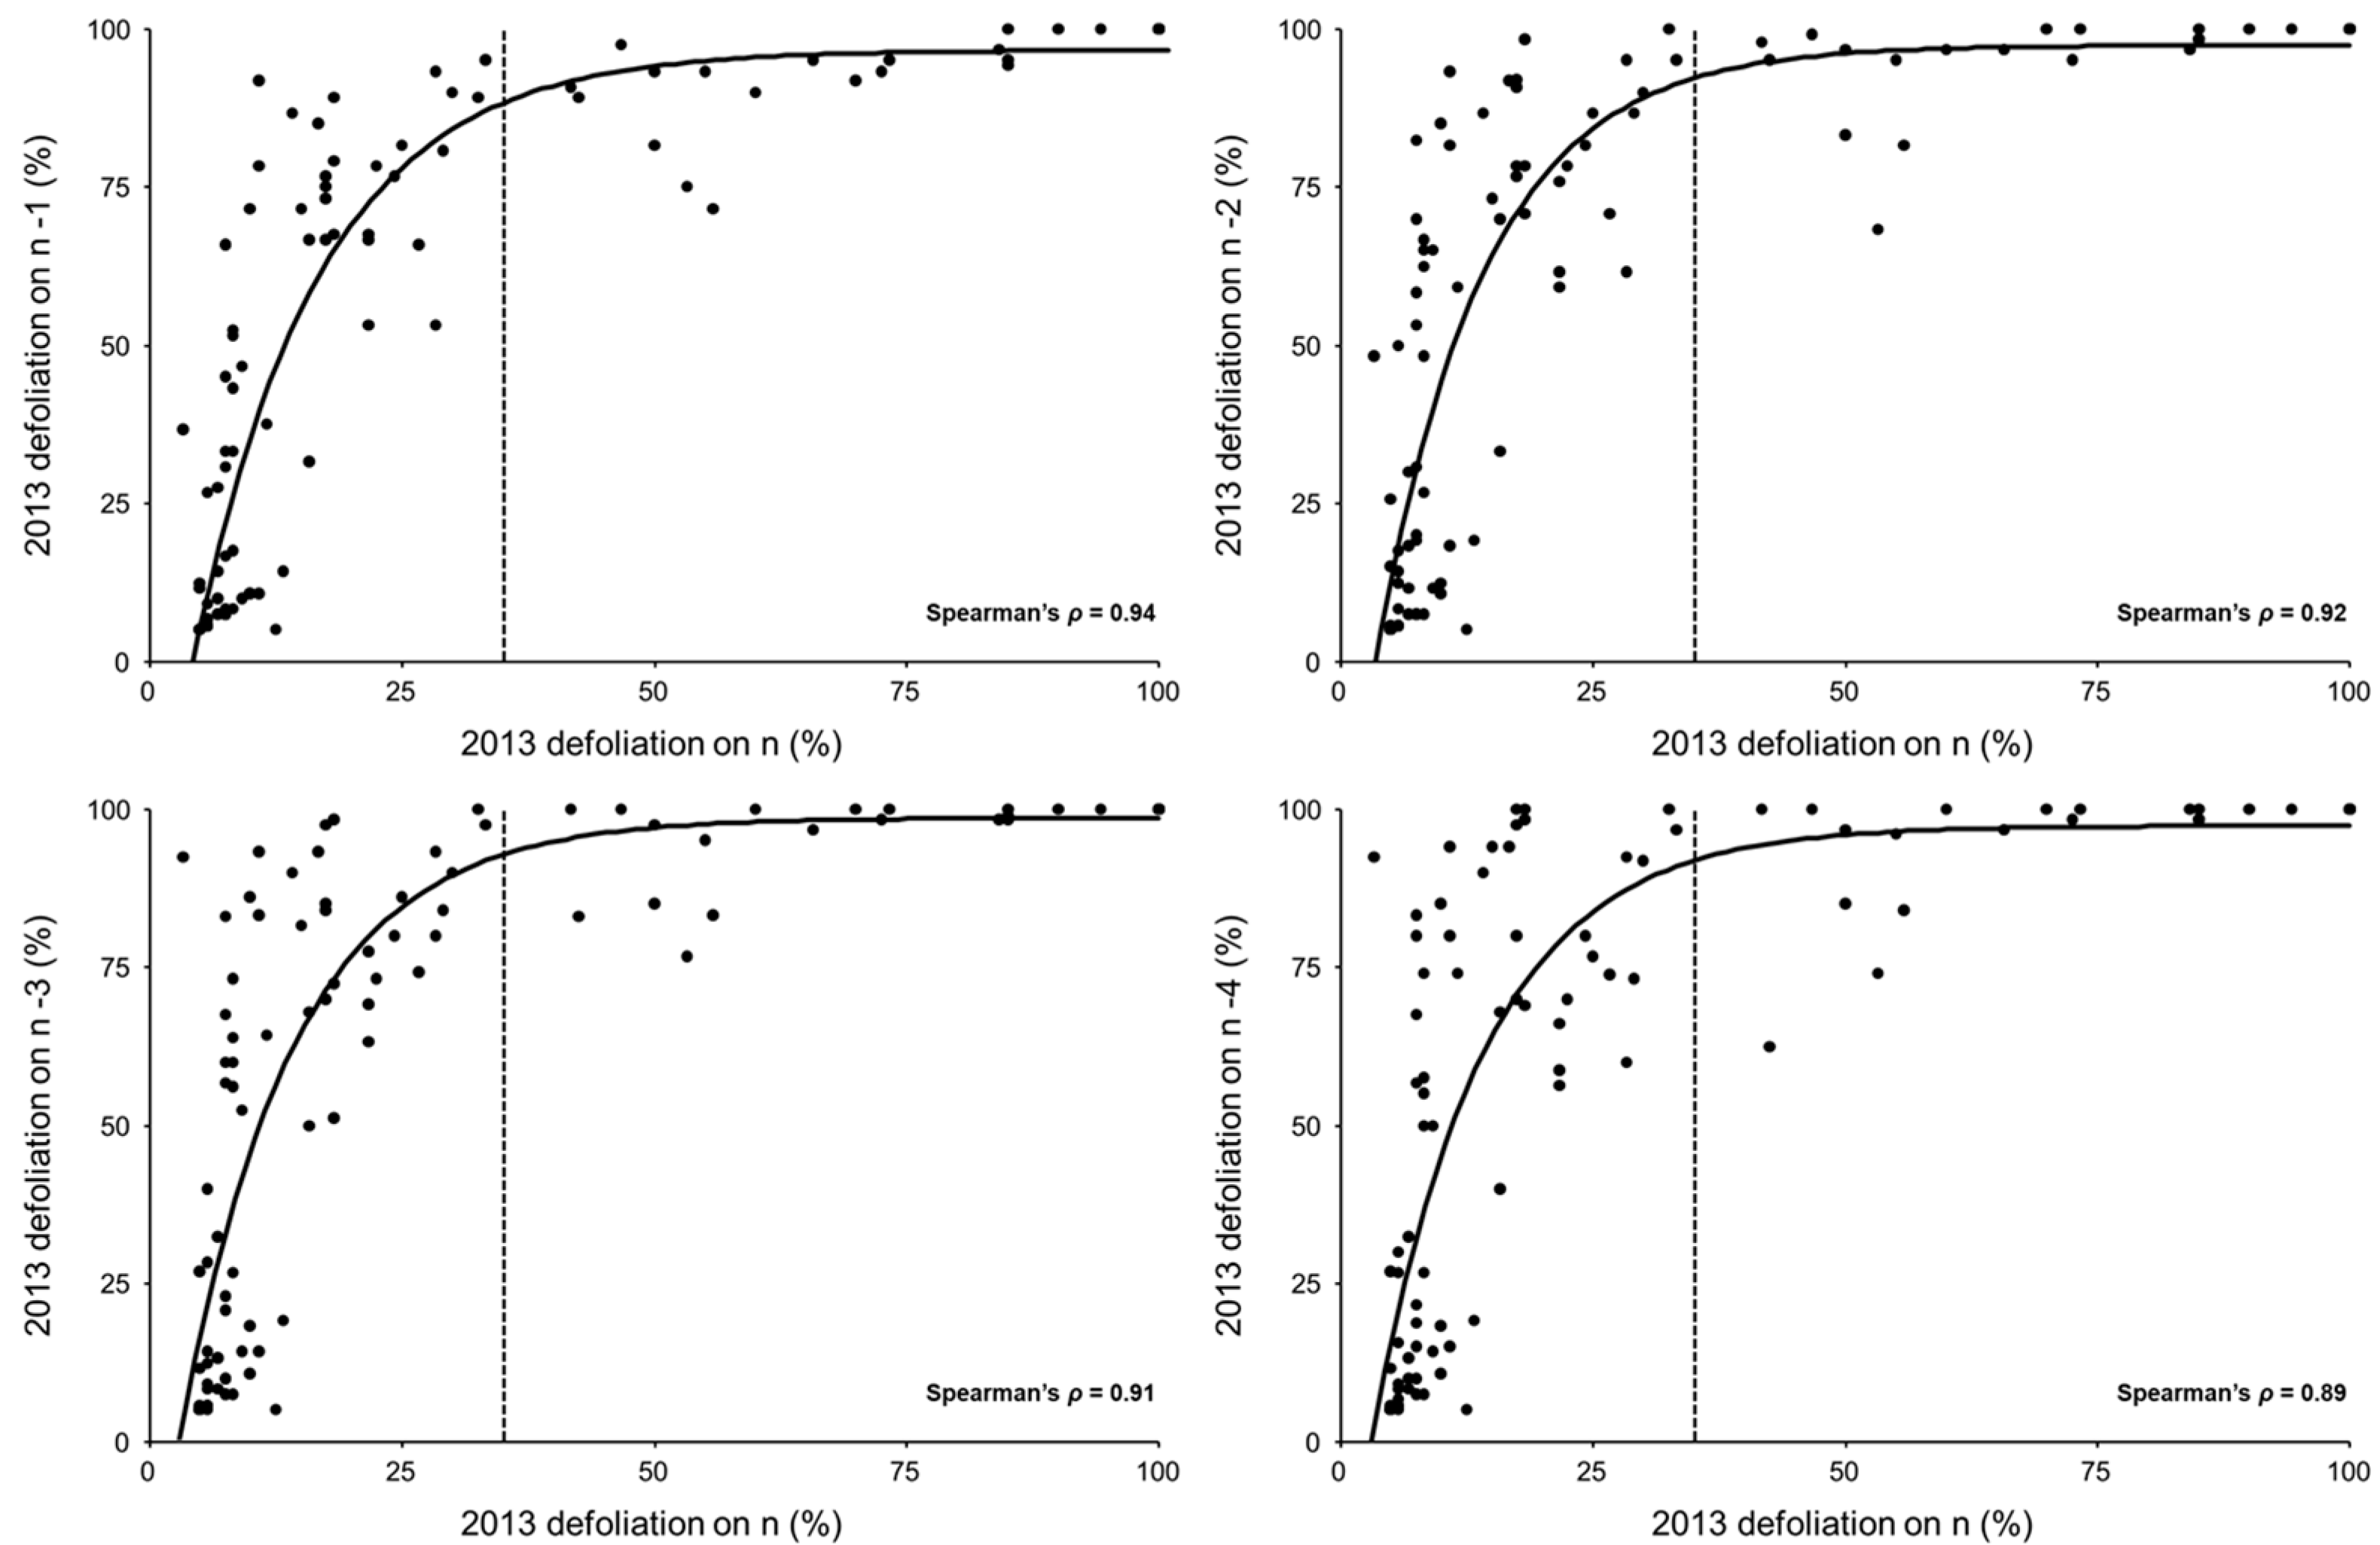
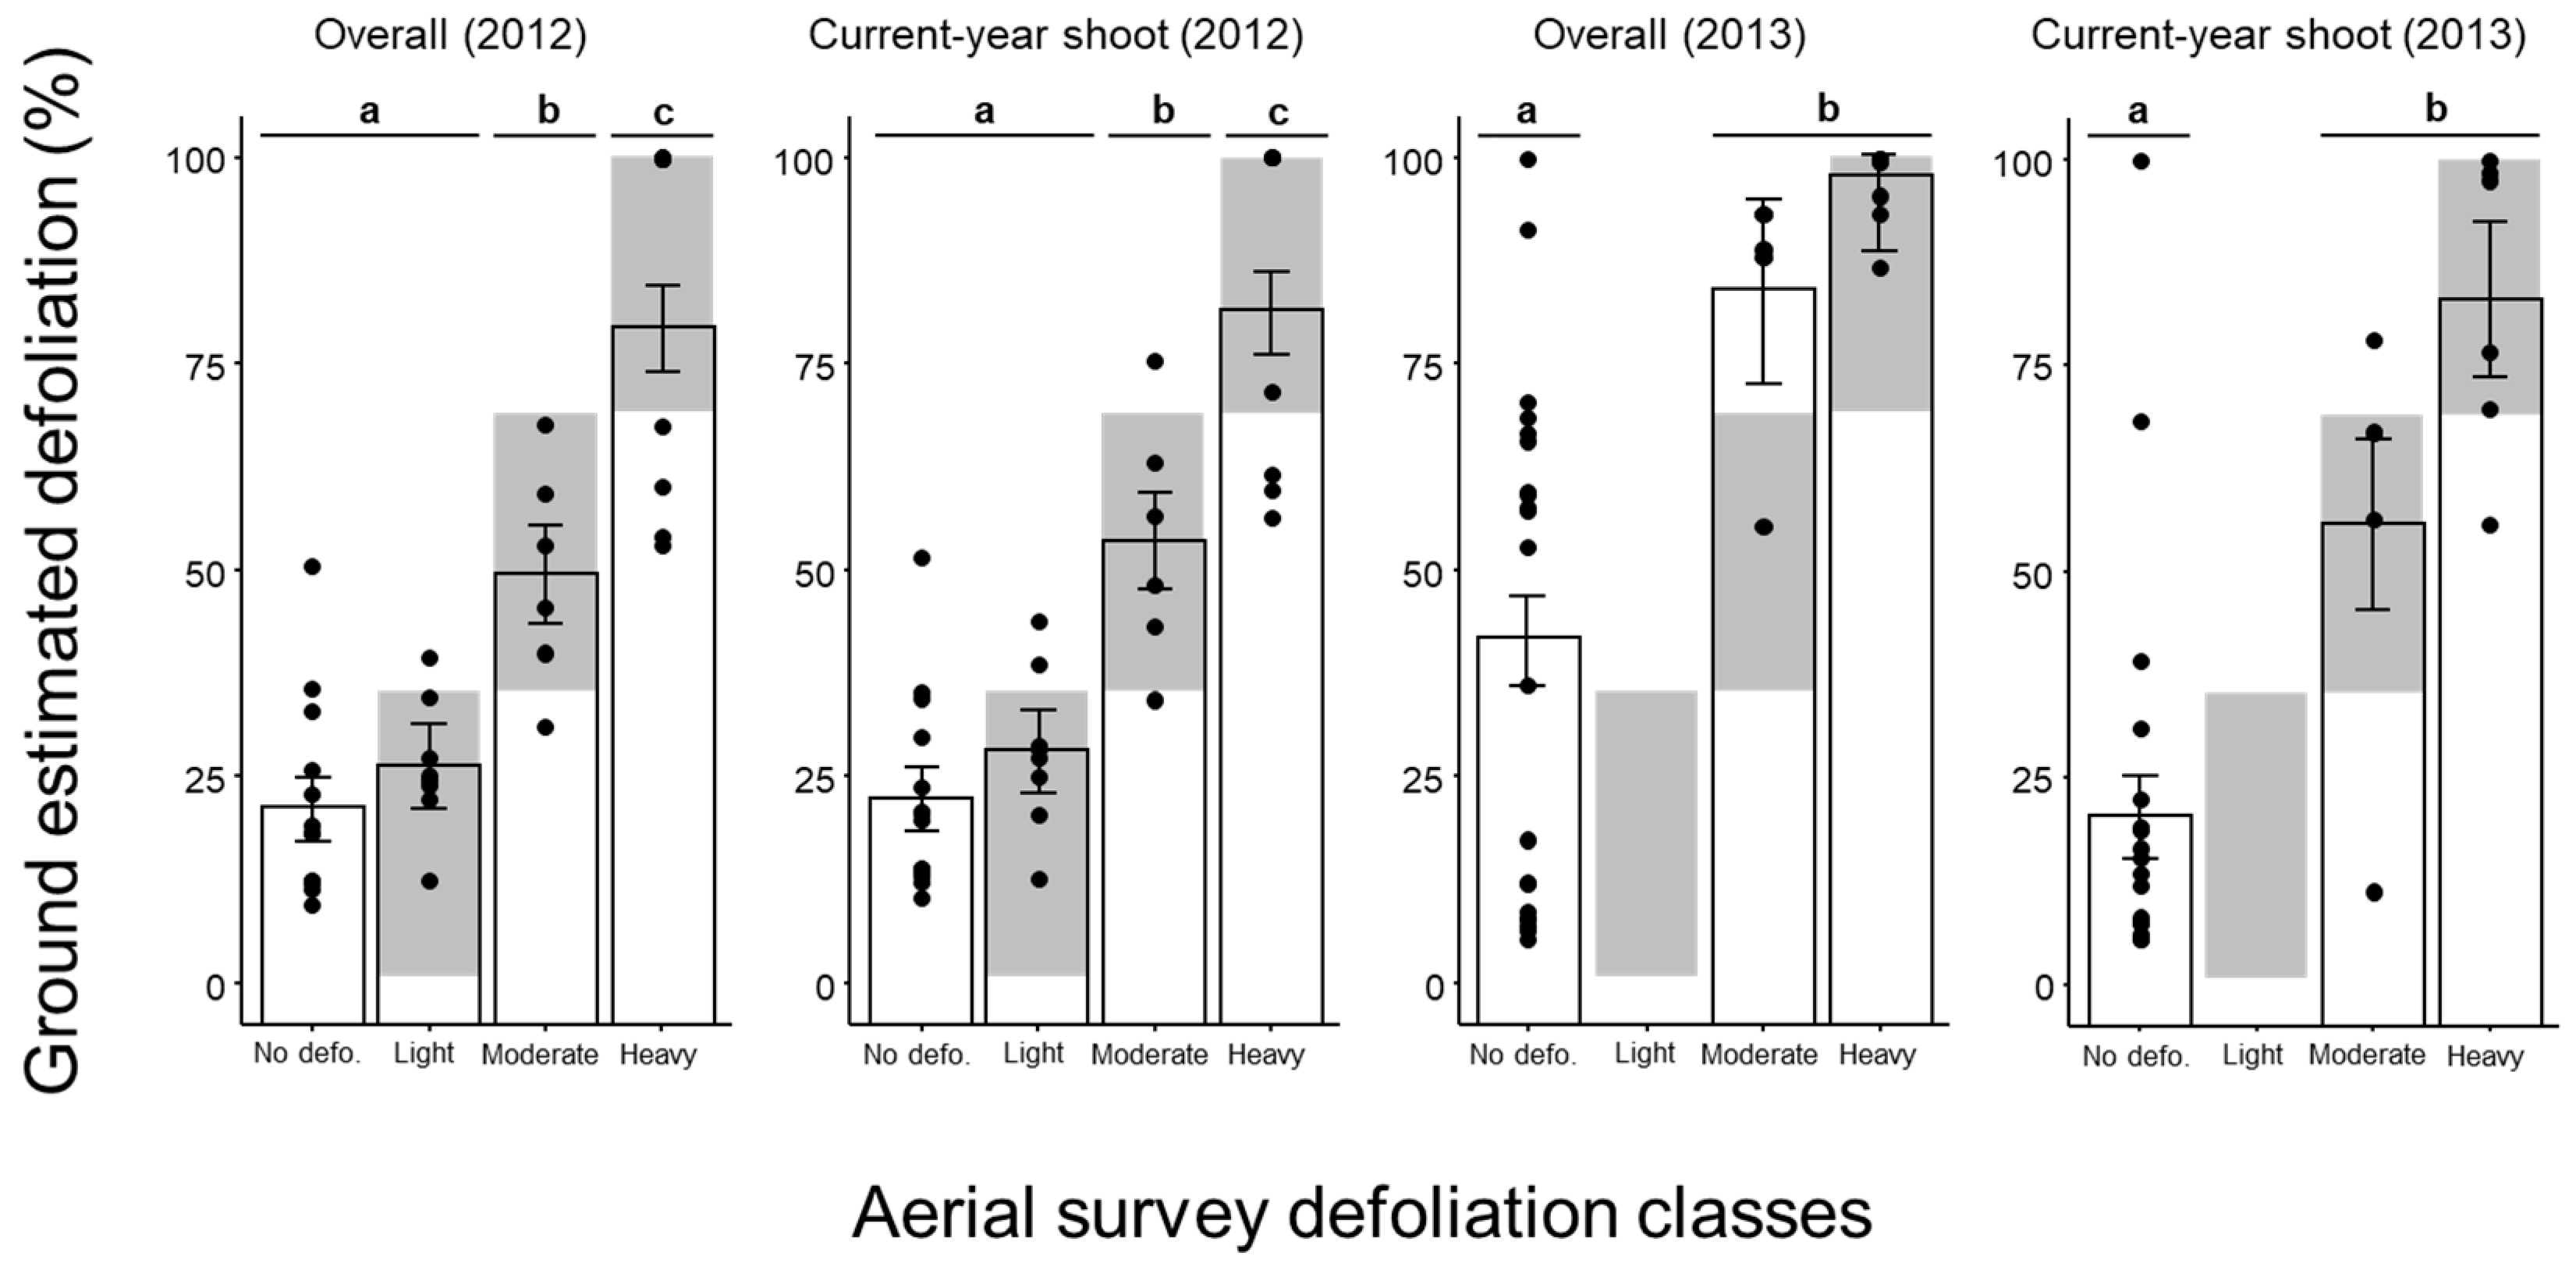
2.3. Statistical Analysis
3. Results
4. Discussion
5. Conclusions
Author Contributions
Funding
Institutional Review Board Statement
Informed Consent Statement
Data Availability Statement
Acknowledgments
Conflicts of Interest
References
- Hébert, C.; Brodeur, J. Lambdina fiscellaria (Guenée), hemlock looper (Lepidoptera: Geometridae). In Biological Control Programmes in Canada 2001–2012; Mason, P.G., Gillespie, D., Eds.; CABI Publishing: Wallingford, UK, 2013; pp. 203–207. [Google Scholar]
- Trial, H.; Trial, J.G. A Method to Predict Defoliation of Eastern Hemlock (Tsuga canadensis [L.] Carr.) by Eastern Hemlock Looper (Lambdina fiscellaria fiscellaria [Gn.]) Using Egg Sampling; Technol. Rep. No., 31; Maine Dep., Conserv.; Maine For., Serv.; Insect Disease Manag., Div.; Me. Forest Service [ie Bureau of Forestry]: Sainte-Foy, QC, Canada, 1992.
- Jobin, L. L’arpenteuse de la pruche, insecte insulaire? Environ. Can. Cent. Rech. For. Laurent. St. -Foy Qc. Milieu 1973, 7, 8–12. [Google Scholar]
- Jobin, L. L’arpenteuse de la pruche: Un insecte insulaire. Racine 1980, 2, 5–7. [Google Scholar]
- Hébert, C.; Jobin, L.J. The hemlock looper. Laur. For. Cent. Can. For. Serv. Nat. Resour. Can. St. -Foy QC. Inf. Leafl. 2001, LFC-4, 17. [Google Scholar]
- Arsenault, J.-E.; Hébert, C.; Tousignant, A.; Berthiaume, R.; Bauce, É. L’arpenteuse de la pruche: Une arrivée remarquée. Bull. Conserv. 2014, pp. 5–9. Available online: https://docplayer.fr/38015072-L-arpenteuse-de-la-pruche-une-arrivee-remarquee.html (accessed on 13 July 2022).
- De Gryse, J.J.; Schedl, K. An account of the eastern hemlock looper, Ellopia fiscellaria Gn., on hemlock, with notes on allied species. Sci. Agric. 1934, 14, 523–539. [Google Scholar]
- Watson, E.B. An account of the eastern hemlock looper, Ellopia fiscellaria Gn., on balsam fir. Sci. Agric. 1934, 14, 669–678. [Google Scholar]
- Carroll, W.J. History of the hemlock looper, Lambdina fiscellaria fiscellaria (Guen.), (Lepidoptera: Geometridae) in Newfoundland, and notes on its biology. Can. Entomol. 1956, 88, 587–599. [Google Scholar] [CrossRef]
- Iqbal, J.; MacLean, D.A. Estimating cumulative defoliation of balsam fir from hemlock looper and balsam fir sawfly using aerial defoliation survey in western Newfoundland, Canada. For. Ecol. Manage. 2010, 259, 591–597. [Google Scholar] [CrossRef]
- Dobesberger, E.J. A sequential decision plan for the management of the eastern hemlock looper, Lambdina fiscellaria fiscellaria (Lepidoptera: Geometridae), in Newfoundland. Can. J. For. Res. 1989, 19, 911–916. [Google Scholar] [CrossRef]
- Blais, J.R. The vulnerability of balsam fir to spruce budworm attack in northwestern Ontario, with special reference to the physiological age of the tree. For. Chron. 1958, 34, 405–422. [Google Scholar] [CrossRef]
- MacLean, D.A. Vulnerability of fir-spruce stands during uncontrolled spruce budworm outbreaks: A review and discussion. For. Chron. 1980, 56, 213–221. [Google Scholar] [CrossRef]
- Hébert, C.; Jobin, L.; Berthiaume, R.; Coulombe, C.; Dupont, A. Changes in hemlock looper (Lepidoptera: Geometridae) pupal distribution through a 3-year outbreak cycle. Phytoprotection 2001, 82, 57–63. [Google Scholar] [CrossRef][Green Version]
- Hébert, C.; Jobin, L.; Berthiaume, R.; Mouton, J.-F.; Dupont, A.; Bordeleau, C. A new standard pupation shelter for sampling pupae and estimating mortality of the hemlock looper (Lepidoptera: Geometridae). Can. Entomol. 2004, 136, 879–887. [Google Scholar] [CrossRef]
- MacLean, D.A.; MacKinnon, W.E. Accuracy of aerial sketch-mapping estimates of spruce budworm defoliation in New Brunswick. Can. J. For. Res. 1996, 26, 2099–2108. [Google Scholar] [CrossRef]
- MacLean, D.A.; Lidstone, R.G. Defoliation by spruce budworm: Estimation by ocular and shoot-count methods and variability among branches, trees, and stands. Can. J. For. Res. 1982, 12, 582–594. [Google Scholar] [CrossRef]
- Gray, D.R.; Régnière, J.; Boulet, B. Analysis and use of historical patterns of spruce budworm defoliation to forecast outbreak patterns in Quebec. For. Ecol. Manag. 2000, 127, 217–231. [Google Scholar] [CrossRef]
- Candau, J.N.; Fleming, R.A. Landscape-scale spatial distribution of spruce budworm defoliation in relation to bioclimatic conditions. Can. J. For. Res. 2005, 35, 2218–2232. [Google Scholar] [CrossRef]
- Saucier, J.-P.; Robitaille, A.; Bergeron, J.-F.; Gosselin, J. Les Régions Écologiques du Québec Méridional, 4th ed.; Carte à l’échelle de 1/1 250 000; Direction des inventaires forestiers, Ministère des Ressources naturelles et de la Faune: Québec, QC, Canada, 2011. [Google Scholar]
- Ministère des Ressources naturelles et de la Faune. Aires infestées par l’arpenteuse de la pruche au Québec en 2012; Direction de la Protection des Forêts, Ministère des Ressources Naturelles et de la Faune: Québec, QC, Canada, 2012. [Google Scholar]
- Fettes, J.J. Investigations of Sampling Techniques for Population Studies of the Spruce Budworm on Balsam Fir in Ontario; Forest Insect Laboratory: Sault Ste. Marie, ON, Canada, Annual Technical Report; 1950. [Google Scholar]
- R Core Team. R: A Language and Environment for Statistical Computing; R Foundation for Statistical Computing: Vienna, Austria, 2021. Available online: https://www.R-project.org/ (accessed on 13 July 2022).
- Lenth, R. Emmeans: Estimated Marginal Means, aka Least-Squares Means. 2021. R package version 1.7.0. Available online: https://CRAN.R-project.org/package=emmeans (accessed on 13 July 2022).
- Clark, J. Photosynthesis and respiration in white spruce and balsam fir. State Univ. Coll. For. Technol. Publ. 1961, 85, 1–72. [Google Scholar]
- Ministère des Forêts, de la Faune et des Parcs. Aires Infestées par L’arpenteuse de la Pruche au Québec en 2014. Direction de la Protection des Forêts. Service de la Gestion des Ravageurs Forestiers; Ministère des Ressources naturelles et de la Faune: Québec, QC, Canada, 2014.


Publisher’s Note: MDPI stays neutral with regard to jurisdictional claims in published maps and institutional affiliations. |
© 2022 by the authors. Licensee MDPI, Basel, Switzerland. This article is an open access article distributed under the terms and conditions of the Creative Commons Attribution (CC BY) license (https://creativecommons.org/licenses/by/4.0/).
Share and Cite
Béland, J.-M.; Bauce, É.; Cloutier, C.; Berthiaume, R.; Hébert, C. Accuracy of Defoliation Estimates from Aerial and Ground Surveys in a Boreal Forest during an Outbreak of the Hemlock Looper, Lambdina fiscellaria (Guenée). Forests 2022, 13, 1120. https://doi.org/10.3390/f13071120
Béland J-M, Bauce É, Cloutier C, Berthiaume R, Hébert C. Accuracy of Defoliation Estimates from Aerial and Ground Surveys in a Boreal Forest during an Outbreak of the Hemlock Looper, Lambdina fiscellaria (Guenée). Forests. 2022; 13(7):1120. https://doi.org/10.3390/f13071120
Chicago/Turabian StyleBéland, Jean-Michel, Éric Bauce, Conrad Cloutier, Richard Berthiaume, and Christian Hébert. 2022. "Accuracy of Defoliation Estimates from Aerial and Ground Surveys in a Boreal Forest during an Outbreak of the Hemlock Looper, Lambdina fiscellaria (Guenée)" Forests 13, no. 7: 1120. https://doi.org/10.3390/f13071120
APA StyleBéland, J.-M., Bauce, É., Cloutier, C., Berthiaume, R., & Hébert, C. (2022). Accuracy of Defoliation Estimates from Aerial and Ground Surveys in a Boreal Forest during an Outbreak of the Hemlock Looper, Lambdina fiscellaria (Guenée). Forests, 13(7), 1120. https://doi.org/10.3390/f13071120