Article

Dissolved Organic Carbon Flux Is Driven by Plant Traits More Than Climate across Global Forest Types

1
Center for Global Change and Ecological Forecasting, Tiantong National Field Observation Station for Forest Ecosystem, School of Ecological and Environmental Sciences, East China Normal University, Shanghai 200241, China
2
Center for Ecological Research, Key Laboratory of Sustainable Forest Ecosystem Management-Ministry of Education, School of Forestry, Northeast Forestry University, Harbin 150040, China
3
College of Forestry and Biotechnology, Zhejiang A&F University, Hangzhou 311300, China
*
Authors to whom correspondence should be addressed.
Forests 2022, 13(7), 1119; https://doi.org/10.3390/f13071119
Submission received: 15 June 2022 / Revised: 13 July 2022 / Accepted: 14 July 2022 / Published: 16 July 2022

Abstract

:
Dissolved organic carbon (DOC) is one of the most important components in the global carbon cycle, which is largely influenced by climate and plant traits. Although previous studies have examined the impacts of climatic factors (e.g., mean annual temperature (MAT) and precipitation (MAP)) or plant traits (e.g., leaf area index, leaf nitrogen) on DOC, the relative importance of climate and plant traits on DOC flux remains unclear on a global scale. In this study, we compiled 153 pairs of DOC observational data from 84 forest sites to explore the relative importance of climate and plant traits on DOC flux with a linear mixed model, variance partitioning, and random forest approaches. Our results showed that DOC fluxes from throughfall and the litter layer were higher in broadleaved forests than those in coniferous forests. Throughfall-DOC flux increased significantly with MAT and MAP in coniferous forests, but that from the litter layer showed no significant correlations with climate factors. In broadleaved forests, throughfall-DOC flux increased with potential evapotranspiration (PET), while that from the litter layer was positively correlated with MAT. Meanwhile, throughfall-DOC flux had negative relationships with specific leaf area (SLA), leaf nitrogen content (LN), and leaf phosphorus content (LP) in broadleaved forests, but it showed a positive correlation with SLA in coniferous forests. Litter-layer-DOC flux increased with LN in broadleaved forests, but this correlation was the opposite in coniferous forests. Using the variance partitioning approach, plant traits contributed to 29.0% and 76.4% of the variation of DOC from throughfall and litter layer, respectively, whereas climate only explained 19.1% and 8.3%, respectively. These results indicate that there is a more important contribution by plant traits than by climate in driving the spatial variability of global forest DOC flux, which may help enhance forest management as a terrestrial carbon sink in the future. Our findings suggest the necessity of incorporating plant traits into land surface models for improving predictions regarding the forest carbon cycle.

1. Introduction

Dissolved organic carbon (DOC) represents the mobile phase of soil organic matter (SOM), which influences myriad biogeochemical processes (e.g., litter and SOC decomposition, greenhouse gas emissions, and nutrient transfer) and plays a significant role in the global carbon balance [1,2,3]. Although the flux of DOC is small compared to other carbon fluxes (e.g., litter inputs, heterotrophic respiration) in forest ecosystems [4,5], DOC is easily and quickly mineralized for plant and microbial uses and is also retained in soils by chelate compounds [2,4,6]. Meanwhile, DOC is an important substrate for microbial growth and metabolism, offering an indirect source of CO2 to the atmosphere [7,8]. In the past few decades, researchers have attempted to incorporate lateral DOC flux from throughfall, the litter layer, and root exudates into several earth system models [9,10,11]. However, the patterns and drivers of DOC flux on a global scale are still unclear, which limits our ability to accurately predict ecosystem carbon dynamics, especially in future climate scenarios.
During the past decades, numerous studies have investigated DOC flux from throughfall and litter layer at the local scale, where they flow into groundwater. These results have considerably enhanced our understanding of how DOC flux is affected by forest type and climate [12,13]. Previous studies showed that DOC flux from throughfall in coniferous forests in Birkenes, Norway was twice as high as that in hardwood/ broadleaved forests in Bavaria, Germany [14,15]. The difference was probably due to the higher leaf area index (LAI) in coniferous rather than broadleaved forests (16.1 vs. 7.4 g m−2 year−1) [14,15]. In Harvard Forest, DOC flux from the litter layer was 39.8 g m−2 year−1 in coniferous stands, which was much higher than that in the broadleaved stands (22.5 g m−2 year−1) because the DOC of conifer litter contains a more complex carbon structure (e.g., polyphenols and proteins) than broadleaved litter [16,17]. These inconsistent results limited our ability to effectively develop regional and global models to accurately simulate forest carbon dynamics. Therefore, a better understanding of DOC flux among different forest types on a global scale could considerably improve the estimates of carbon budgets and the prediction of future carbon-climate feedback in terrestrial ecosystems.
It has been demonstrated that climate is a primary factor in regulating DOC fluxes [18,19,20]. Generally, high temperatures would promote microbial activity to utilize DOC and enhance litter mineralization, which would reduce the DOC flux exporting from plants to the soil by leaching [21,22]. Meanwhile, changes in precipitation and evapotranspiration (ET) strongly influence DOC leaching rates [1,21,23]. For instance, rapid water infiltration from strong precipitation could decrease the soil sorption and microbial decomposition, resulting in a large volume of DOC fluxes being transported in a montane forest [2,24]. However, previous studies have found positive, negative, or no relationships between DOC fluxes and precipitation in diverse experiments [15,25,26]. Although a few studies on DOC flux have been conducted on a continental or a global scale [27,28,29,30,31], a mechanistic understanding of how climate factors drive the spatial variability of DOC flux on a global scale and between different forests type is still to be reached.
In addition to the effect of climate on DOC flux, previous studies have demonstrated that plant traits (e.g., LAI, leaf N, specific leaf area (SLA)) also play a key role in regulating DOC fluxes, due to the alteration in resource partitioning and the modification of micro-environments. According to the leaf economic spectrum theory, plant traits from conservative species often have low SLA and nutrient content (e.g., leaf N), which are associated with a slow litter decomposition rate, resulting in lower levels of DOC flux into the soil [32,33,34]. In contrast, high forest productivity was responsible for large-scale DOC release in northern forests [35]. Some studies found that DOC fluxes increased with an increased LAI, which considerably influenced the interception precipitation and DOC leaching from the leaves [15]. However, the relative importance of climate and plant traits on DOC fluxes remains unclear at either the local or the global scale, to date [12,36].
In this study, we compiled data regarding DOC flux from global forests to probe the relative importance of climate and plant traits on DOC fluxes on a global scale. We hypothesized that: (1) DOC fluxes from both throughfall and the litter layer might be lower in coniferous than in broadleaved forests, due to high lignin levels and slow litter decomposition in conifer needles, relative to broadleaves; and (2) plant traits might play a dominant role in driving DOC fluxes, due to their direct linkage with nutrients (e.g., SLA and LN) and the microenvironments (e.g., LAI) of decomposers, relative to climate. This study will demonstrate the general pattern of DOC flux and the key influencing factors in forests, to improve the estimation of forests’ carbon storage on a global scale.

2. Materials and Methods

2.1. Data Source

Peer-reviewed journal articles were searched using the Web of Science, Google Scholar, and the China Knowledge Resource Integrated Database (CNKI) (1900–2021) with the following search term combinations: (“dissolved organic carbon” OR “DOC” OR “soluble organic carbon”) AND (“leaf” OR “leaves” OR “foliage” OR “litter” OR “tree” OR “canopy” OR “plant *”) AND (“throughfall” OR “leaching”). To avoid bias in the publication selection, the following criteria were used: (i) only those experiments conducted in forest ecosystems were included and DOC was generally defined as the fraction of organic matter that can pass through a filter with a size of 0.45 μm. (ii) DOC was measured from throughfall and/or litter layer in field conditions and was collected by zero tension. (iii) Field studies had been chosen when the experimental duration was longer than one growing season. (iv) The means, standard deviations/errors, and sample sizes of the variables could be extracted directly from context, tables, or digitized graphs. In total, 45 peer-reviewed papers, published from 1995 to September 2021 and analyzing 84 forest sites, were selected from more than 1900 papers, yielding 153 pairs of observational data (see Figure 1 and Table S1 in the Supplementary Materials).
In our dataset, environmental variables were also extracted directly from the papers, including latitude, longitude, mean annual temperature (MAT), mean annual precipitation (MAP), and potential evapotranspiration (PET). For the missing environmental variables, we used site geographical coordinates to extract MAT, MAP, and PET data from the global climate database (version 2, www.worldclim.com (30 May 2018)) and CEDA (version CRU TS 4.00, https://catalogue.ceda.ac.uk (30 May 2018)). The corresponding climate data were reported in the collected papers for 92% of the dataset, and only about 8% of the climate data were extracted from the WorldClim database. To investigate the relationships between DOC fluxes and leaf traits, we collected leaf trait data from TRY datasets (www.try-db.org (30 May 2018)). The relevant variables include specific leaf area (SLA, where SLA is the leaf area per unit of leaf dry mass), leaf nitrogen content per leaf mass (LN), and leaf phosphorus concentration per leaf mass (LP) [37]. These traits were selected due to their important roles in explaining plant ecological strategies and decomposition progress, which are closely related to DOC flux [32]. TRY dataset provides the most integrated data for leaf traits over the world, since most of our selected studies did not report leaf traits. Because of the important roles played by the dominant species in regulating ecosystem function [38,39,40,41], the dominant species-based traits were used to indicate ecosystem-level plant traits (for details, see Method S1 in the Supplementary Materials). In addition, canopy height was obtained from the Geoscience Laser Altimeter System [42]; the leaf area index (LAI) was sourced from NASA’s Earth Observatory Team (MOD15 product); net primary production (NPP) was obtained from a product of the MODIS sensor [43]. Climatic factors included MAT, MAP, and PET, while the plant traits included NPP, LAI, canopy height, SLA, LN, and LP. Among these traits, SLA, LN, and LP represent the leaf economics functions, while LAI, NPP, and canopy height represent the plant biomass.

2.2. Statistical Analysis

A t-test with a Bonferroni test was used to test the difference in DOC flux between broadleaved and coniferous forests. The parameters were tested for normality and homogeneity of variance, and/or log-transformed to meet the assumptions for an analysis of variance (ANOVA) when necessary. Given the effect of spatial autocorrelation, we used linear mixed model analysis and a modified t-test to examine the relationships between climate (MAT, MAP, and PET) and plant traits (NPP, LAI, canopy height, SLA, LN, and LP), with DOC flux from throughfall and the litter layer, employing the “nlme” and “SpatialPack” packages in R software (see Tables S2, S3 and S5 in the Supplementary Materials) [44,45,46]. Sites within climate zones were regarded as a nested random factor, while the climate and plant traits were regarded as fixed factors. The coefficient of determination (R2) was used to assess the contribution of the fixed effects (R2 marginal), and both fixed and random effects (R2 conditional). The difference in the response of DOC flux to the climate and traits between broadleaved and coniferous forests was analyzed by comparing the 95% confidence intervals of the coefficient. If the coefficient of broadleaved (or coniferous) forests fell within the 95% confidence interval of the coefficient of coniferous (or broadleaved) forests, there was no significant difference between these two forest types [47].
We used general linear mixed models (GLMMs) to explore the independent and interactive effects of climate and plant traits on DOC flux from throughfall and the litter layer. The parameters were scaled before analysis (see Table S6). To avoid multicollinearity and model overfitting, a principal component analysis (PCA) was conducted to select the representative climate and plant traits, which explained almost more than 84% of the total variance (see Figure S1 and Table S4 in the Supplementary Materials). Then, we selected those variables with the highest contributions for each principal component, to represent the principal component. We tested the significance of the interactive effect between climate properties and/or plant traits in the pairwise linear mixed model. Non-significant interactive effects were excluded before performing GLMMs with the “nlme” R package. The relative contributions of climate and plant traits to the spatial variance in DOC fluxes were quantified by variance partitioning, based on GLMMs. From each GLMM, the explained variance (represented by marginal R2 value) was used to calculate the fraction of variance explained by each set of fixed variables, separately [48]. First, we compared the marginal r2 values of sub-models that only included the climate model (MAT, MAP) or plant traits (SLA, LN, NPP, forest type, and the interactive effect between SLA and forest type in throughfall) to evaluate their relative contribution (fractions a and c represent the independent effects of climate and plant traits, respectively; fraction b represents the interactive effects between climate and plant traits (see Figure S2 in the Supplementary Materials)). Second, we used the difference between the r2 values of the full model (fraction [a + b + c] represents the total effect of the climate properties and plant traits on DOC fluxes (see Table S1 in the Supplementary Materials)) and those of the sub-models to examine the interactive effects of climate and traits on DOC fluxes [48,49]. The same GLMMs were run to distinguish fractions of the explained variance in the DOC fluxes from the litter layer in the climate model, but SLA, LN, FT, and the interactive effect of plant traits (SLA and LN) with forest type were included in the plant traits model. The inhibitory interactive effects of climate and plant traits on DOC flux were shown as negative values [50]. The variation partitioning analysis was conducted with the vegan R package in R software (version 3.5.0, R Development Core Team, 2018, http://www.r-project.org/ accessed on 23 April 2018).
In addition, the importance of influencing factors (including plant traits, climate, and forest type) on DOC flux was expressed as IncNode Purity, derived from random forest modeling using the “randomForests” package in R. The model’s IncNode purity will be positively associated with variable importance [51]. In total, nine variables were used in the random forest model, including climate (MAT, MAP, and PET) and plant traits (LAI, NPP, canopy height, SLA, LN, LP, and forest type). All statistical analyses were performed in R(version 3.5.0, R Core Team, 2018, http://www.r-project.org/ accessed on 23 April 2018) and SPSS (version 21, SPSS Inc., Chicago, IL, USA).

3. Results

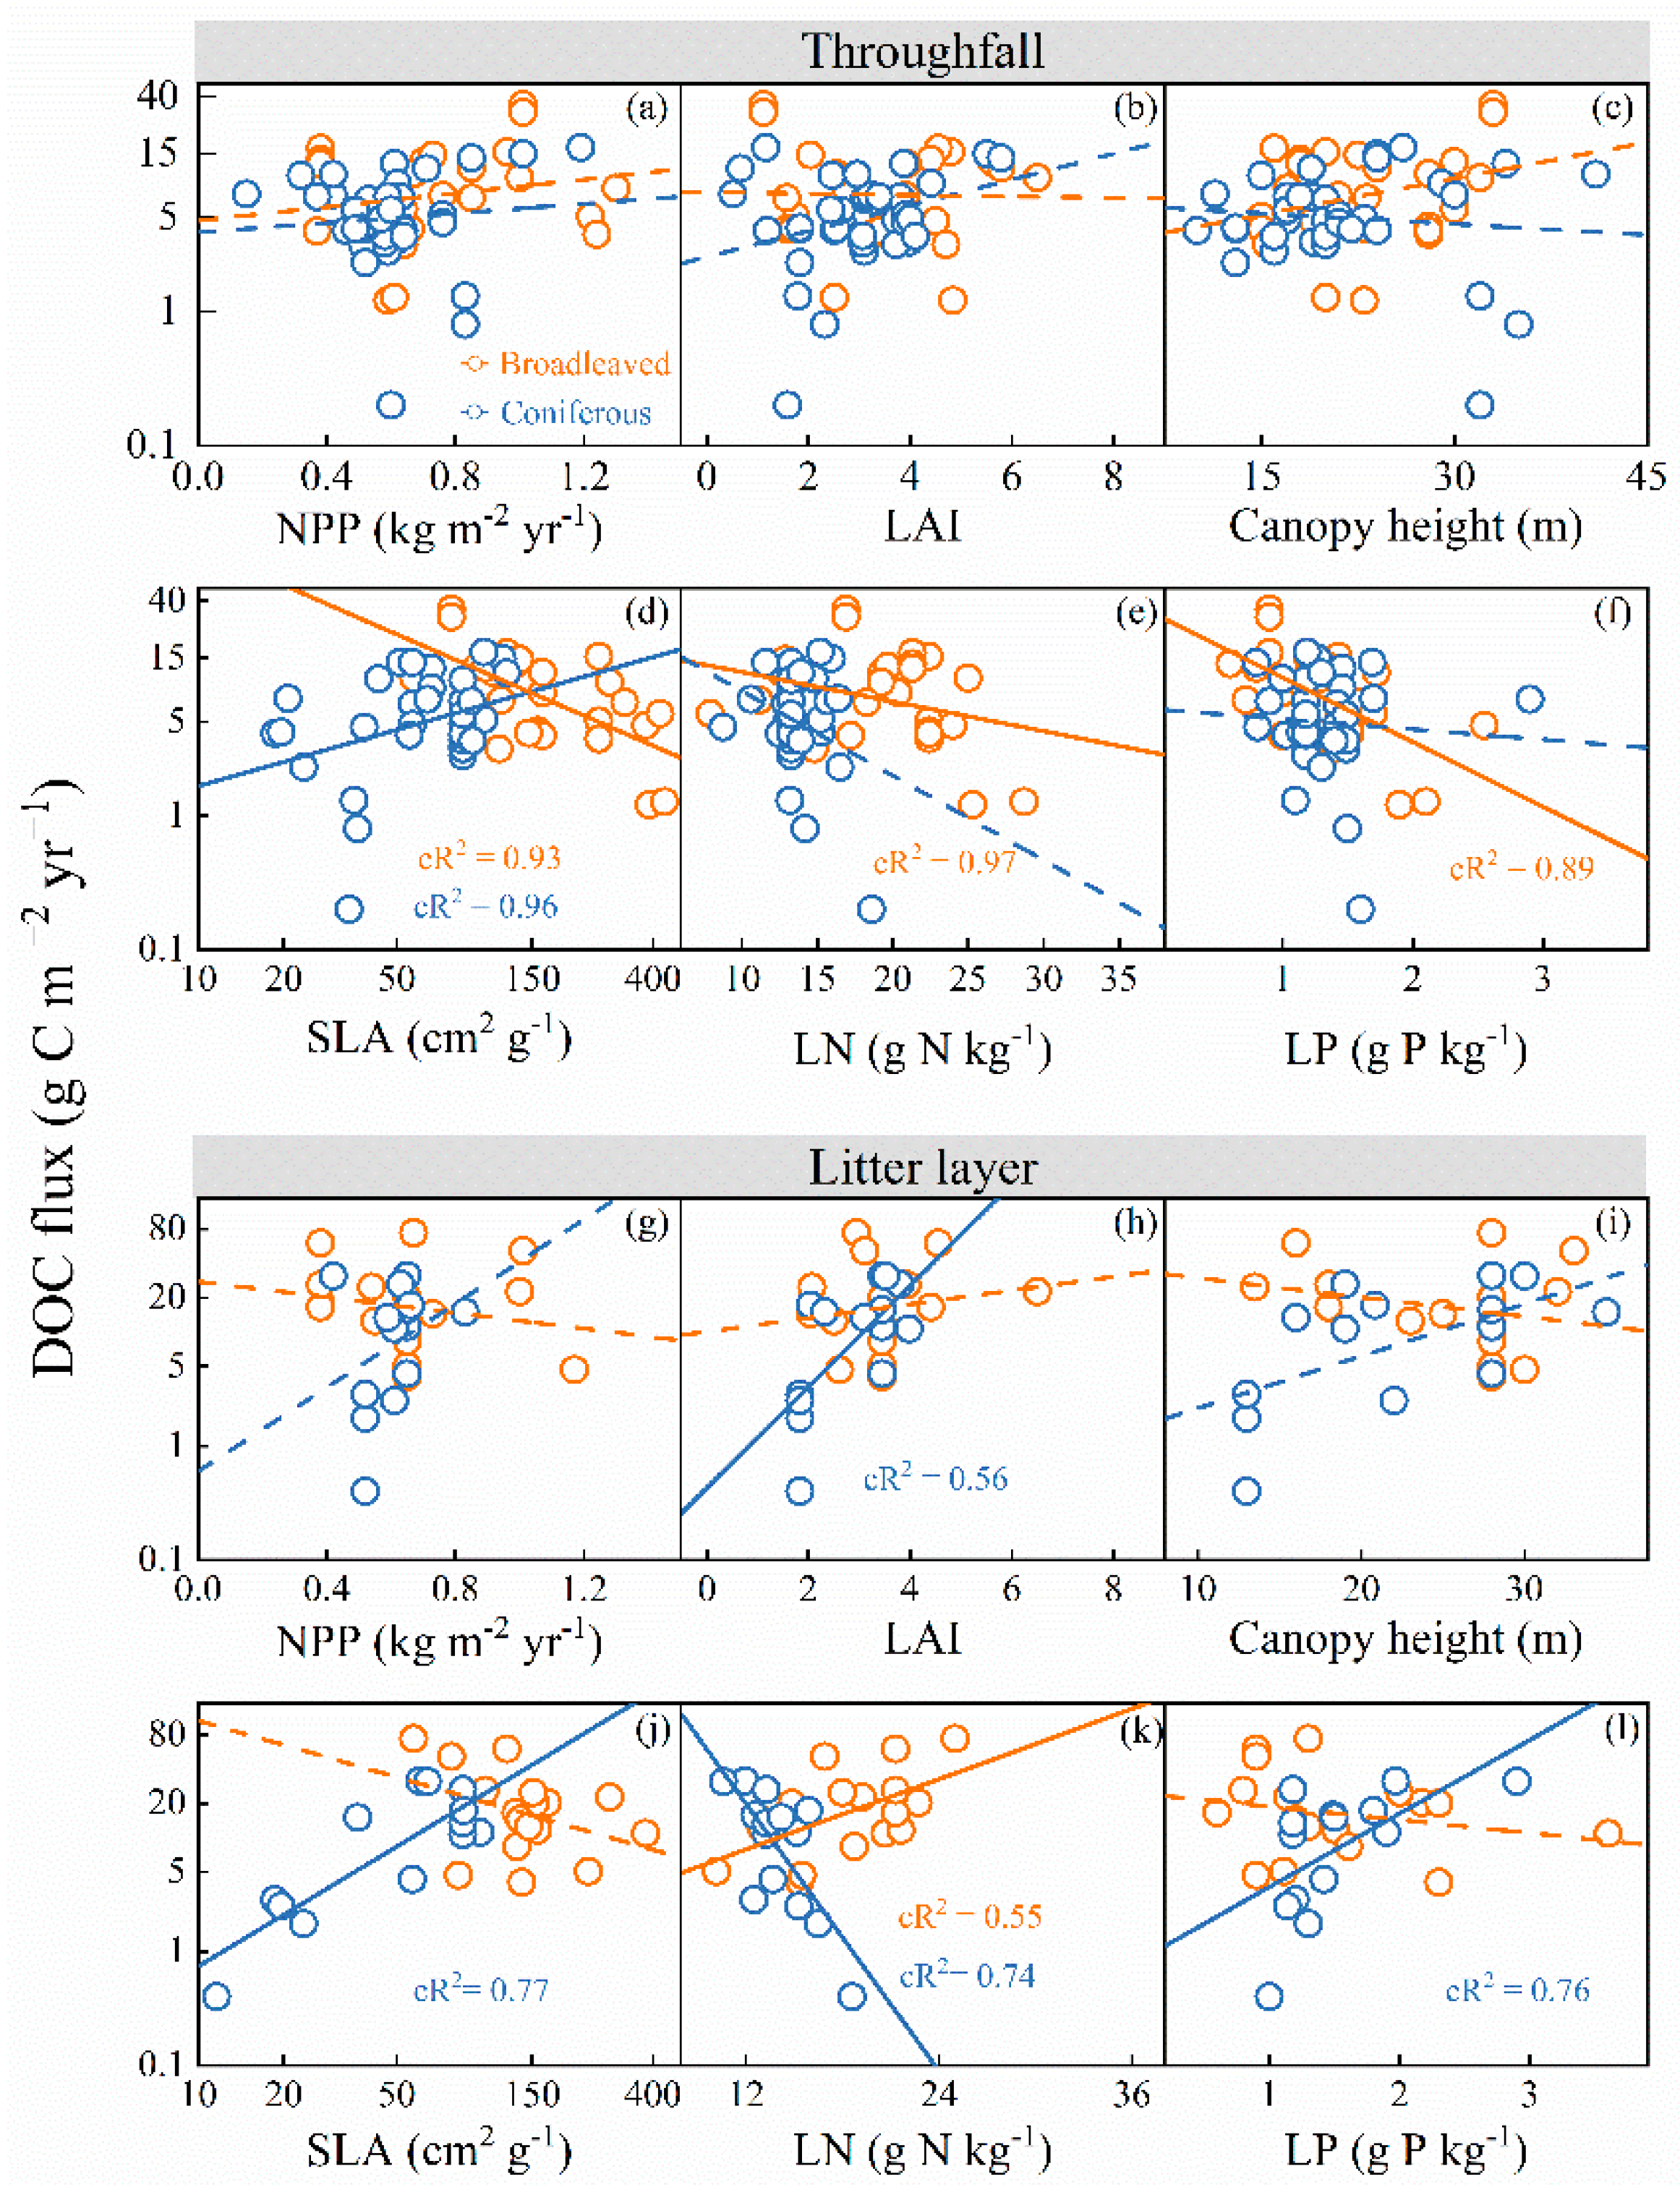
3.1. The Variation in DOC Fluxes in Coniferous and Broadleaved Forests

The observed DOC fluxes from throughfall (n = 112) and the litter layer (n = 41) varied between 0.07–48.00 and 0.40–74.06 g C m−2 year−1, with medians of 7.36 and 12.91 g C m−2 year−1, respectively (see Figure S3 in the Supplementary Materials). The mean DOC fluxes from throughfall were 11.43 ± 1.52 and 8.84 ± 1.18 g C m−2 year−1 in broadleaved (n = 56) and coniferous forests (n = 56), respectively (see Figure S3 in the Supplementary Materials). Similarly, the mean DOC fluxes from the litter layer were 21.87 ± 4.66 and 12.49 ± 2.86 g C m−2 yr−1 in broadleaved (n = 22) and coniferous forests (n = 19), respectively (see Figure S3 in the Supplementary Materials). DOC fluxes from the litter layer in coniferous forests were significantly lower than those in broadleaved forests (p < 0.05, see Figure 2), while there was no statistical difference in DOC fluxes from throughfall (p > 0.1, see Figure 2). For these two forest types, DOC fluxes from the litter layer were higher than those from throughfall.

3.2. Effects of Climatic Variables on DOC Fluxes

Across all forest ecosystems, DOC fluxes from throughfall increased significantly with MAT, MAP, and PET (p < 0.05; see Figure S4 and Table S2 in the Supplementary Materials). Throughfall-DOC flux in coniferous forests increased with MAT and MAP, while that in broadleaved forests increased with PET (p < 0.05; see Figure 3 and Table S2 in the Supplementary Materials). DOC fluxes from the litter layer were positively correlated with MAT in all forests and coniferous forests, while DOC fluxes from the litter layer did not show significant correlations with MAT, MAP, and PET in broadleaved forests (see Figure 3 and Table S2 in the Supplementary Materials). Furthermore, there was no significant difference in the LMM coefficients between broadleaved and coniferous forests, compared with the climate variables (see Table S2 in the Supplementary Materials).

3.3. Effects of Plant Traits on DOC Fluxes

DOC flux from throughfall significantly increased with NPP and decreased with LN and LP (p < 0.05), but had no significant relationships with LAI, canopy height, and SLA across all forest ecosystems (p > 0.05; see Figure S4 and Table S2 in the Supplementary Materials). In broadleaved forests, DOC flux from throughfall had a negative relationship with SLA, LN, and LP, but DOC flux from throughfall had a positive relationship with SLA in coniferous forests (p < 0.05), while there were no significant relationships with NPP, LAI, and canopy height (see Figure 4 and Table S2 in the Supplementary Materials). There was no significant difference in the LMM coefficient between broadleaved and coniferous forests compared with plant traits, with the exception of SLA (see Table S2 in the Supplementary Materials). Throughfall-DOC flux in broadleaved forests exhibited a significant negative correlation with SLA but did not show any significant trend in coniferous forests (see Table S2 in the Supplementary Materials).
In the case of the litter layer, DOC flux was not significantly correlated with plant traits, but it increased significantly with LAI and SLA in coniferous forests (p < 0.05; see Figure 4 and Table S3 in the Supplementary Materials). Interestingly, DOC flux from the litter layer decreased with LN in coniferous forests, but it increased in broadleaved forests (p < 0.05; see Figure 4 and Table S3 in the Supplementary Materials). There was no significant difference in the LMM coefficient between coniferous and broadleaved forests compared with plant traits, with the exception of LN (see Table S3 in the Supplementary Materials). The relationships of DOC flux from the litter layer with LN were significantly different between coniferous and broadleaved forests (see Figure 4 and Table S3 in the Supplementary Materials). The results from the random forest model showed that SLA was more important than other factors for causing a variation in DOC flux (see Figure 5).

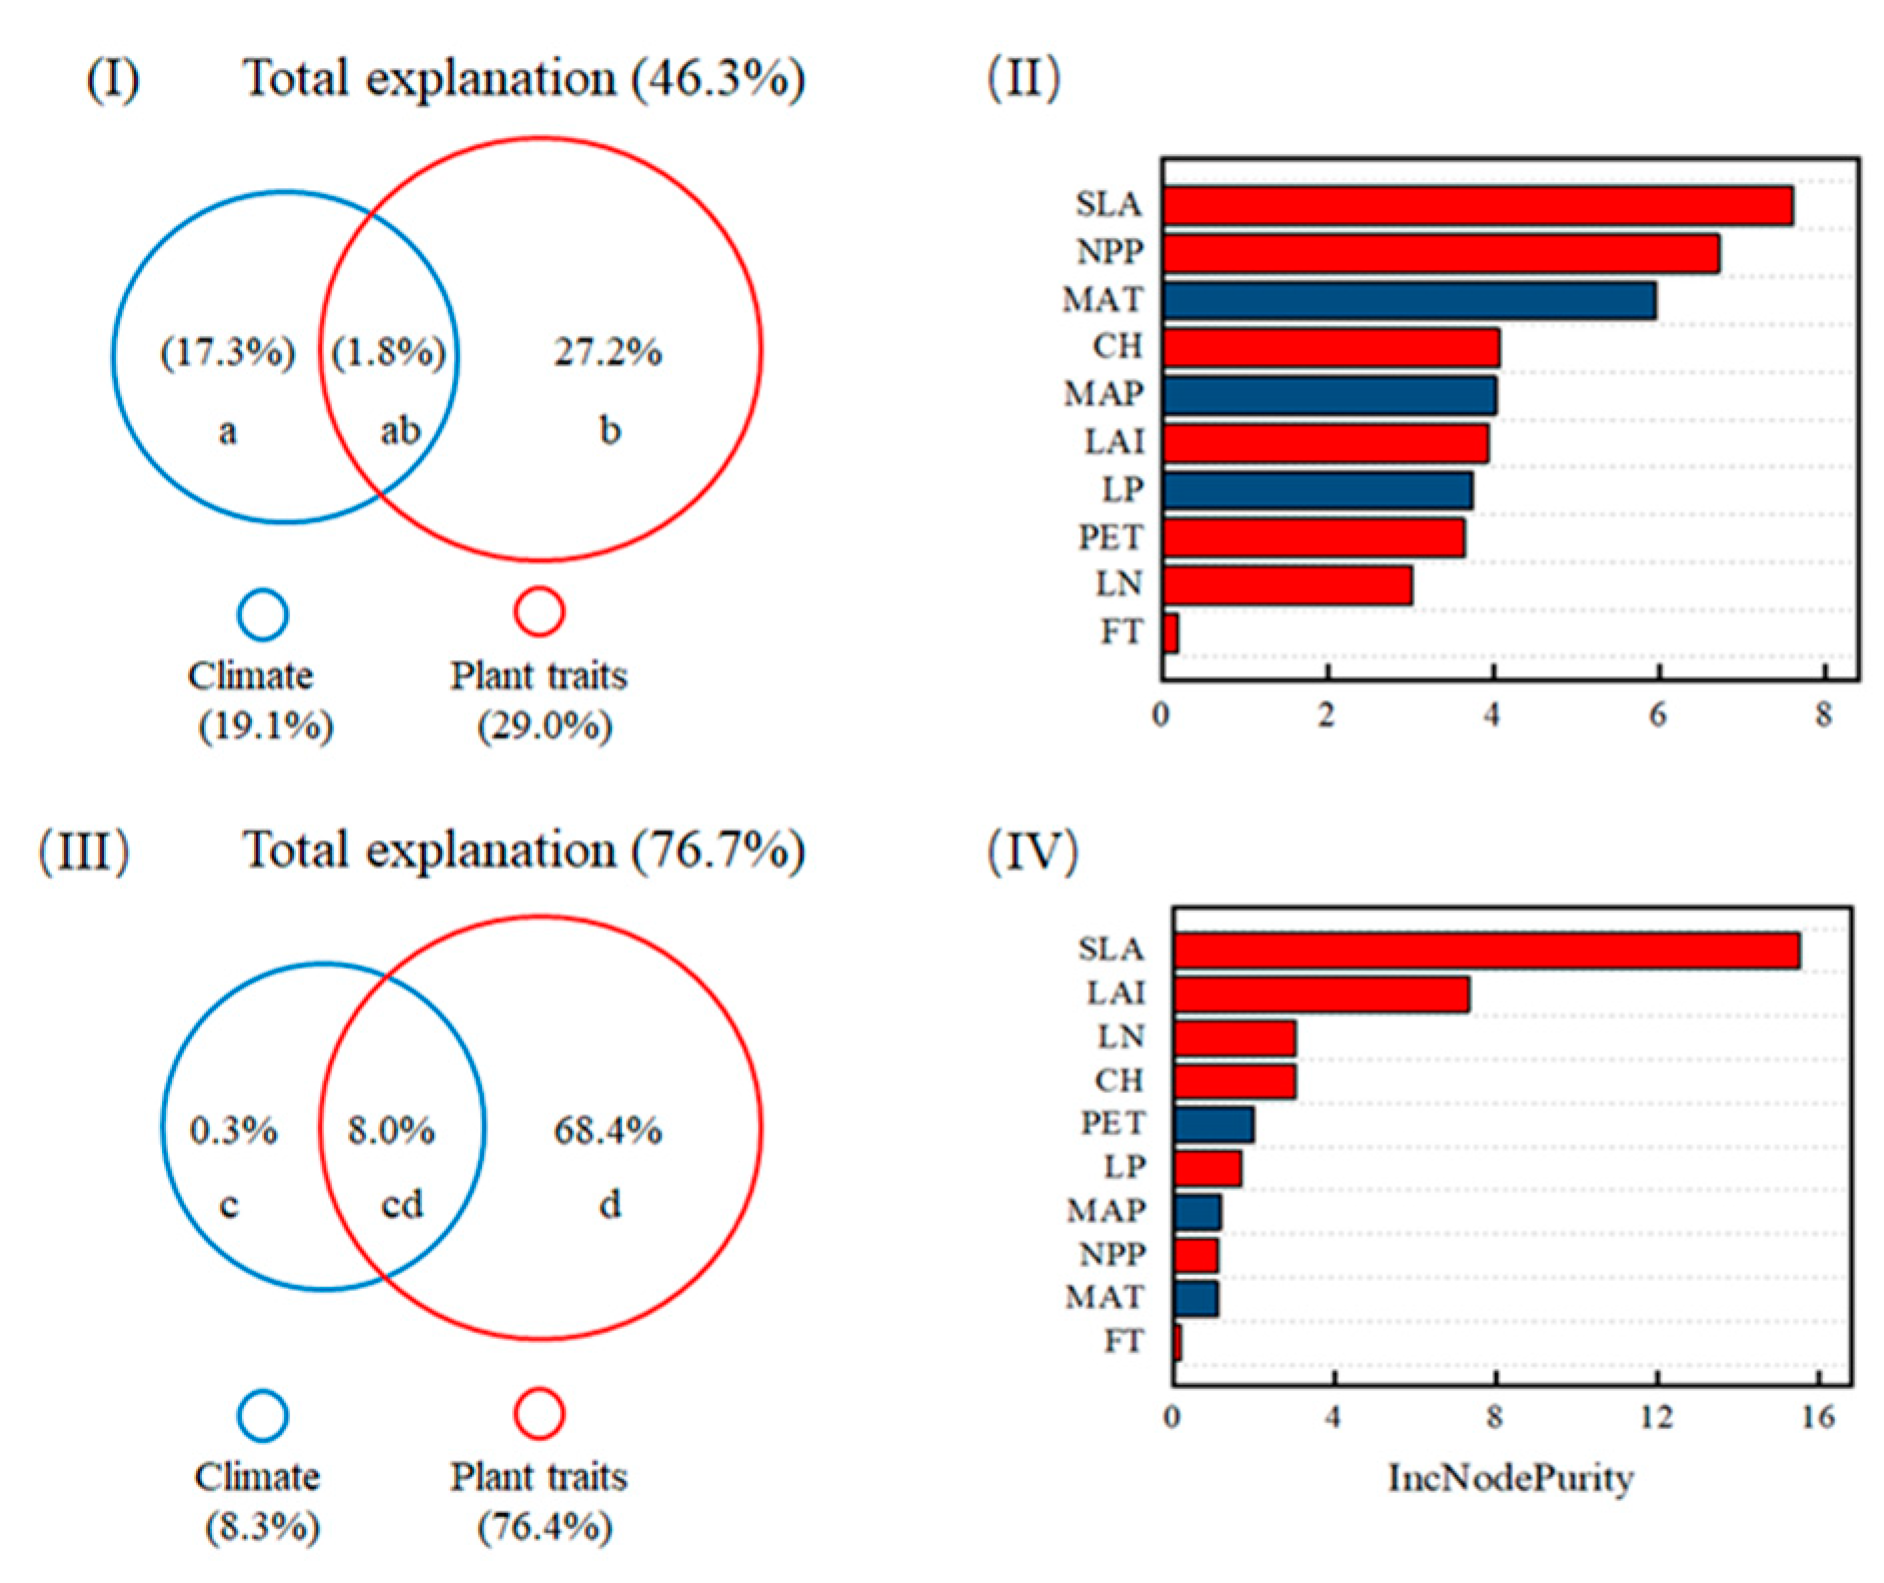
3.4. The Relative Contribution of Climate and Plant Traits to DOC Fluxes

According to the best multiple linear mixed models, significant interactive effects on DOC flux from throughfall were observed between SLA and forest type, LN, and MAT, while interactive effects on DOC flux from the litter layer were between forest type and SLA or LN (see Table 1). Results from variation partitioning analysis showed that plant traits and climatic variables, together, explained 46.3% of the variance in DOC fluxes from throughfall, of which plant traits and climate independently explained 27.2% and 17.3% of the variance, respectively, and their interactive effects only explained 1.8% of the variance (see Figure 5). Similarly, these two factors together explained 76.7% variance in DOC fluxes from the litter layer, of which plant traits and climate independently explained 68.4% and 0.3% of the variance, respectively, and their interactive effects explained 8% of the variance (see Figure 5).

4. Discussion

4.1. Differences in DOC Flux between Coniferous and Broadleaved Forests

Understanding the global pattern of DOC flux and its influencing factors is crucial for better predicting and assessing the feedback of the carbon cycle in terms of climate change [11], although the influencing factors might be different among forest ecosystems. Our results showed that DOC fluxes from the litter layer in coniferous forests were significantly lower than those in broadleaved forests (see Figure 2), likely resulting from the difference in litter quality/quantity and the subsequent litter decomposition in diverse forests [52]. Generally, conifer needles contain more lignin than broadleaves, which could hinder leaf litter decomposition, leading to less DOC being released [34,53]. However, a meta-analysis did not display any difference in DOC fluxes from the litter layer between broadleaved and coniferous forests in temperate regions [14]. This controversy might be due to the low variation in litter traits in the same climate type, compared to the great changes on the global scale [32,54].
For DOC flux from throughfall, there was no significant difference between coniferous and broadleaved forests (see Figure 2). We found significant relationships between climate (e.g., MAT, MAP, and PET) and DOC flux from throughfall (all forest sites), while the relationships only significantly increased in the case of MAT for the litter layer (see Figure 3a–c and Table S1 in the Supplementary Materials). This may be attributed to the difference in the influencing factors with canopy structure, atmospheric dust, and precipitation for DOC flux from throughfall, and with litter quality and decomposition for the litter layer, among these two vegetation types [10,52,55]. Besides this, our results showed significant relationships between climate (MAT and MAP) and DOC flux from throughfall in coniferous forests but did not for broadleaved forests (see Figure 3a,b and Table S1 in the Supplementary Materials). This may be attributed to the fact that a high MAP may enhance DOC flux by increasing the plant carbon inputs, although a high MAP could generate a dilution effect on DOC concentration in broadleaved forests [25,56]. Furthermore, the increasing trends of DOC fluxes from throughfall with the MAP in coniferous forests were inconsistent with an early synthesis showing no relationships in temperate forests [14]. These contradictory results may be due to the low variation in MAP, causing the limiting effects of MAP on DOC fluxes in temperate forests, compared to this study at the global analysis level [14]. In addition, DOC fluxes from the litter layer increased with MAT in broadleaved forests, while they showed no significant correlation with MAT in coniferous forests (see Figure 3d–f and Table S1 in the Supplementary Materials). These findings were supported by a MAT threshold hypothesis: plant traits have a dominant effect on litter decomposition when MAT does not limit the decomposer activity (see Table 1) [57]. Furthermore, coniferous forests are usually located in cold and arid regions, where there was a lower litter decomposition rate, causing lower DOC fluxes compared to broadleaved forests [20].

4.2. The Dominant Role of Plant Traits in the Spatial Variability of DOC Fluxes Relative to Climate

DOC flux is usually affected by myriad biotic and abiotic factors [14]. However, it was unclear whether and in what way climate and plant traits affect DOC flux. In this study, the contribution of plant traits (e.g., SLA or LN) to the spatial variability of DOC flux from throughfall or litter layer was predominant relative to climate (e.g., temperature and precipitation; see Table 1 and Figure 4). Specifically, the significant interactive effect between LN and forest type on DOC flux indicated that the LN-DOC flux relationship was different between broadleaved and coniferous forests, which was supported by the increased DOC flux with LN in broadleaved forests but the decreased DOC flux with LN in coniferous forests (see Figure 4 and Table 1 and Table S1 in the Supplementary Materials). These results may be due to the following reasons. First, LN has been proved to influence the litter decomposition rate [58]. Meanwhile, decomposer composition was more strongly related to litter N availability rather than its moisture or temperature [59] and, thus, indirectly influenced DOC flux. Second, leaf surface protection by wax in coniferous forests, which was likely to limit the leaching of nutrients from leaves, resulted in lower DOC fluxes compared to that in broadleaved forests [14,33,34]. Furthermore, conifer needles have a higher lignin content and slower litter decomposition than broadleaves, resulting in low DOC fluxes in coniferous forests (see Figure 2) [8]. We also found that forest type could indirectly regulate DOC flux from the litter layer by influencing SLA (see Table 1). Compared with broadleaved leaf litter, coniferous leaf litter usually has a low SLA and nitrogen-poor leaves, which may be associated with a slow rate of decomposition, resulting in lower DOC flux [60,61].
We found that litter layer-DOC fluxes from coniferous forests increased with LAI, which was positively related to the production of litterfall (see Figure 4h) [62,63]. This result was consistent with previous investigations showing that the removal of annual litterfall decreased the DOC fluxes from the litter layer in a hardwood forest [62]. Previous studies suggested that the duration of contact between infiltrating water and organic matter increased with the thickness of the litter layer, thereby increasing the amount of DOC flux [64]. Meanwhile, the thickness of the litter layer was one of the key mechanisms for DOC flow into soil carbon storage, which was dependent on differences in plant species [14,64].
For throughfall, DOC flux increased significantly with NPP (see Table S1 in the Supplementary Materials), probably due to the fact that plant biomass plays an important role in throughfall-DOC flux, via aboveground biomass [10]. For example, low NPP provides less C for precipitation processes, causing fewer DOC fluxes during the throughfall progress [65]. In addition, DOC fluxes from throughfall were positively affected by the interactive effect between SLA and the forest type (see Figure 4d and Table 1). According to leaf construction cost hypotheses that a low SLA generally has a high lignin content to resist environmental stress, the resulting throughfall-DOC flux decreased with decreasing SLA in coniferous forests [66,67,68,69]. Generally, plant traits could affect the resources acquisition of phyllosphere microbes, including the availability of leaf nutrients and organic compounds [66,70], which finding was in accordance with our results that throughfall-DOC flux decreased with SLA, LN, and LP in broadleaved forests (see Figure 4h,i and Table S1 in the Supplementary Materials). For example, the “conservative” resource-strategy species (e.g., with a low SLA, LN, and LP) would invest more nutrients in their structural organs, likely leading to higher leaching DOC fluxes from throughfall [32]. Meanwhile, SLA was also related to water-holding capacity and the concentration of secondary metabolites in the leaf, which could influence the DOC flux [71]. Therefore, plant traits may influence forest throughfall DOC fluxes more on a global scale than does climate [72].

4.3. Limitations and Implications

As a substantial element of the global carbon and hydrological cycles’ balance, DOC fluxes not only directly link nutrients for plants and microbes but also easily transport organic C among the different ecosystems [12,73], although DOC fluxes are relatively small. However, DOC fluxes can be greatly influenced by global changes, including rising temperatures, reduced moisture, and changing vegetation via land-use change [4,12,13]. Our study may offer some insights into the improvement of land-surface models, as well as future experiments, at least in three aspects. First, our results showed the greater contribution of plant traits, relative to climate, to the spatial variation of DOC flux from throughfall and the litter layer (see Figure 5). Current ecosystem or land surface models only consider the effects of climate and forest types on DOC flux and neglected the role of plant traits in the terrestrial carbon cycle [10,74]. These findings can be incorporated into the framework of ecosystem and regional models, to improve the estimation of global DOC balance [9,11], especially in terms of global climate change. Specifically, the correlations of SLA with DOC fluxes from throughfall and LN with those from the litter layer could be directly used in setting model parameters and equations, to predict the forest carbon dynamic in the future.
Second, we found that DOC fluxes were higher in broadleaved forests than in coniferous forests (see Figure 2), suggesting the importance of forest type in terms of DOC fluxes. Forest type could affect soil carbon decomposition, due to the different responses of the soil microbial community to variations in litter quality and quantity [75,76]. However, our dataset did not include information regarding the microbial composition and the interactive effects on DOC flux. Besides this, the DOC microbial mechanism is still unclear on a global scale. Hence, researchers should pay more attention to the importance of DOC microbial progress in future global analyses. In addition, this study did not test the influences of lignin or cellulose on the DOC flux, due to the lack of sufficient trait measurements across the study sites. It is worth addressing how the lignin values covary with climate to further drive the DOC flux in the future [34,53]. Furthermore, the biases caused by the different approaches might affect the global estimates. Thus, we intend to adopt a standard method to analyze DOC in the future. According to the results of LMM, the marginal R2 was much lower than the conditional R2, indicating that the random factor of the site within the climate zone also affected DOC flux, along with other environmental factors that were not included in this study. Third, most of the current studies were distributed in temperate regions, particularly in Europe (see Figure 1). The limited ecosystem types and climate zones involved here may have also induced uncertainties when generalizing patterns and drivers. Thus, more studies from other regions (e.g., Africa, South America, Oceania, and Russia) need to be conducted in the future to better understand how climate and plant traits influence DOC flux in global forests.

5. Conclusions

Forest DOC fluxes from throughfall and the litter layer are an important source of carbon for soil microorganisms and mineral soil carbon sequestration. In this study, we found that DOC fluxes from throughfall and the litter layer were higher in broadleaved forests than those in coniferous forests on a global scale. The correlations of the DOC flux with climate and plant traits were significantly different in broadleaved and coniferous forests. The variations in DOC flux from throughfall and the litter layer were explained by plant traits (e.g., SLA or LN), indicating that the contribution of plant traits is probably higher than that of climate to forest DOC fluxes on a global scale. This study highlights the importance of forest type and the regulation of SLA/LN for DOC fluxes from the throughfall/litter layer on a global scale, which should be considered in the prediction of this global carbon flux in future climate scenarios.

Supplementary Materials

The following supporting information can be downloaded at: https://www.mdpi.com/article/10.3390/f13071119/s1, Method S1: The calculation of dominant species-based plant traits [37,77], Figure S1: Principal component analysis of the throughfall and litter layer climate variables (a and b) and plant traits (c and d), respectively. MAT (°C), mean annual temperature; MAP (mm), mean annual precipitation; PET (mm), potential evapotranspiration; NPP (kg yr−1), net primary production; LAI, leaf area index; CH (m), canopy height; SLA (cm2 g−1), specific leaf area; LN (g N kg−1), leaf nitrogen content per leaf mass; LP (g P kg−1), leaf phosphorus content per leaf mass, Figure S2: Variance partitioning among those variables that influence the dissolved organic carbon (DOC) fluxes from throughfall and the litter layer. Fraction a represent the independent effects of climate; fraction b represents the interactive effects between climate and plant traits; fraction c represents the independent effects of the plant traits. [a + b + c] represents the total effect of the climate properties and plant traits on DOC fluxes, Figure S3: Frequency distributions of the logarithmic transformed (nature log) DOC flux from throughfall (a) and the litter layer (b) on a global scale, Figure S4: Relationships between the DOC fluxes from throughfall and the litter layer and mean annual temperature (MAT, a), mean annual precipitation (MAP, b), potential evapotranspiration (PET, c), net primary production (NPP, d), leaf area index (LAI, e), canopy height (f), specific leaf area (SLA, g), leaf nitrogen content per leaf mass (LN, h), and leaf phosphorus content per leaf mass (LP, i). The fitted lines were determined with a linear mixed-effect model, with the site within the climate zone as the nested random factor. cR2 indicated the contribution of fixed and random effects. The red squares and blue rhombus represent data from the throughfall and litter layer, respectively. The dashed lines indicate an insignificant correlation between DOC flux and climate/plant traits at the p > 0.05 level, Table S1: Reference list of the DOC flux, site location, climate, and plant traits in this meta-analysis, Table S2: Summary of the linear mixed-effects models relating climatic and plant traits variables to the DOC flux from throughfall for all forests, broadleaved forests, and coniferous forests, Table S3: Summary of the linear mixed-effects models relating climatic and plant traits variables to the DOC flux from the litter layer for all forests, broadleaved forests, and coniferous forests, Table S4: Contributions of climate and plant traits from throughfall and the litter layer to Dim 1, Dim 2 and Dim 3 of the principal component analysis. Abbreviations are in reference to Figure S3, Table S5: Corrected Pearson’s correlation for spatial autocorrelation among DOC flux climate (MAT, MAP, and PET) and plant traits (NPP, LAI, CH, SLA, LN, and LP), Table S6: Data transformations for summary statistics, multiple linear regression models, and correlations, Data S1. A list of 44 papers from which the data were extracted for this meta-analysis.

Author Contributions

Y.J., Y.H. and X.Z. conceived the study and analyzed the data. Y.J., Y.H., J.S., H.L., Y.F., X.C., Y.C., R.L., J.G., N.L., G.Z., and L.Z. compiled the dataset. Y.J., Y.H. and X.Z. led the writing, with contributions from all the authors. All authors have read and agreed to the published version of the manuscript.

Funding

National Natural Science Foundation of China: 31901200; National Natural Science Foundation of China: 31930072; National Natural Science Foundation of China: 32071593; National Key Research and Development Program of China: 2020YFA0608403.

Data Availability Statement

The authors confirm that the data will be shared via the Dryad Digital Repository if the manuscript is accepted.

Acknowledgments

We thank everyone who contributed to this article.

Conflicts of Interest

The authors declare no conflict of interest.

References

  1. Tranvik, L.J.; Jansson, M. Climate change—Terrestrial export of organic carbon. Nature 2002, 415, 861–862. [Google Scholar] [CrossRef]
  2. Kaiser, K.; Kalbitz, K. Cycling downwards—Dissolved organic matter in soils. Soil Biol. Biochem. 2012, 52, 29–32. [Google Scholar] [CrossRef]
  3. Wologo, E.; Shakil, S.; Zolkos, S.; Textor, S.; Ewing, S.; Klassen, J.; Spencer, R.G.M.; Podgorski, D.C.; Tank, S.E.; Baker, M.A.; et al. Stream dissolved organic matter in permafrost regions shows surprising compositional similarities but negative priming and nutrient effects. Glob. Biogeochem. Cycles 2021, 35, e2020GB006719. [Google Scholar] [CrossRef]
  4. Moore, T.R. Dissolved organic carbon in a northern boreal landscape. Glob. Biogeochem. Cycles 2003, 17, 4. [Google Scholar] [CrossRef] [Green Version]
  5. Battin, T.J.; Luyssaert, S.; Kaplan, L.A.; Aufdenkampe, A.K.; Richter, A.; Tranvik, L.J. The boundless carbon cycle. Nat. Geosci. 2009, 2, 598–600. [Google Scholar] [CrossRef]
  6. Pausch, J.; Kuzyakov, Y. Carbon input by roots into the soil: Quantification of rhizodeposition from root to ecosystem scale. Glob. Change Biol. 2018, 24, 1–12. [Google Scholar] [CrossRef] [PubMed]
  7. Bradford, M.A.; Keiser, A.D.; Davies, C.A.; Mersmann, C.A.; Strickland, M.S. Empirical evidence that soil carbon formation from plant inputs is positively related to microbial growth. Biogeochemistry 2013, 113, 271–281. [Google Scholar] [CrossRef]
  8. Cotrufo, M.F.; Wallenstein, M.D.; Boot, C.M.; Denef, K.; Paul, E. The microbial efficiency-matrix stabilization (MEMS) framework integrates plant litter decomposition with soil organic matter stabilization: Do labile plant inputs form stable soil organic matter? Glob. Change Biol. 2013, 19, 988–995. [Google Scholar] [CrossRef] [Green Version]
  9. Michalzik, B.; Tipping, E.; Mulder, J.; Lancho, J.F.G.; Matzner, E.; Bryant, C.L.; Clarke, N.; Lofts, S.; Esteban, M.A.V. Modelling the production and transport of dissolved organic carbon in forest soils. Biogeochemistry 2003, 66, 241–264. [Google Scholar] [CrossRef]
  10. Wu, H.; Peng, C.; Moore, T.R.; Hua, D.; Li, C.; Zhu, Q.; Peichl, M.; Arain, M.A.; Guo, Z. Modeling dissolved organic carbon in temperate forest soils: TRIPLEX-DOC model development and validation. Geosci. Model Dev. 2014, 7, 867–881. [Google Scholar] [CrossRef] [Green Version]
  11. Nakhavali, M.; Lauerwald, R.; Regnier, P.; Guenet, B.; Chadburn, S.; Friedlingstein, P. Leaching of dissolved organic carbon from mineral soils plays a significant role in the terrestrial carbon balance. Glob. Change Biol. 2021, 27, 1083–1096. [Google Scholar] [CrossRef] [PubMed]
  12. Neff, J.C.; Asner, G.P. Dissolved organic carbon in terrestrial ecosystems: Synthesis and a model. Ecosystems 2001, 4, 29–48. [Google Scholar] [CrossRef] [Green Version]
  13. Uselman, S.M.; Qualls, R.G.; Lilienfein, J. Quality of soluble organic C, N, and P produced by different types and species of litter: Root litter versus leaf litter. Soil Biol. Biochem. 2012, 54, 57–67. [Google Scholar] [CrossRef]
  14. Michalzik, B.; Kalbitz, K.; Park, J.H.; Solinger, S.; Matzner, E. Fluxes and concentrations of dissolved organic carbon and nitrogen—A synthesis for temperate forests. Biogeochemistry 2001, 52, 173–205. [Google Scholar] [CrossRef]
  15. Arisci, S.; Rogora, M.; Marchetto, A.; Dichiaro, F. The role of forest type in the variability of DOC in atmospheric deposition at forest plots in Italy. Environ. Monit. Assess. 2012, 184, 3415–3425. [Google Scholar] [CrossRef]
  16. Currie, W.S.; Aber, J.D.; McDowell, W.H.; Boone, R.D.; Magill, A.H. Vertical transport of dissolved organic C and N under long-term N amendments in pine and hardwood forests. Biogeochemistry 1996, 35, 471–505. [Google Scholar] [CrossRef]
  17. Cuss, C.; Gueguen, C. Impacts of microbial activity on the optical and copper-binding properties of leaf-litter leachate. Front. Microbiol. 2012, 3, 166. [Google Scholar] [CrossRef] [Green Version]
  18. Prior, S.A.; Runion, G.B.; Rogers, H.H.; Torbert, H.A.; Reeves, D.W. Elevated atmospheric CO2 effects on biomass production and soil carbon in conventional and conservation cropping systems. Glob. Change Biol. 2005, 11, 657–665. [Google Scholar] [CrossRef]
  19. Kalbitz, K.; Meyer, A.; Yang, R.; Gerstberger, P. Response of dissolved organic matter in the forest floor to long-term manipulation of litter and throughfall inputs. Biogeochemistry 2007, 86, 301–318. [Google Scholar] [CrossRef]
  20. Lapierre, J.-F.; Seekell, D.A.; del Giorgio, P.A. Climate and landscape influence on indicators of lake carbon cycling through spatial patterns in dissolved organic carbon. Glob. Change Biol. 2015, 21, 4425–4435. [Google Scholar] [CrossRef]
  21. Dorrepaal, E.; Toet, S.; van Logtestijn, R.S.P.; Swart, E.; van de Weg, M.J.; Callaghan, T.V.; Aerts, R. Carbon respiration from subsurface peat accelerated by climate warming in the subarctic. Nature 2009, 460, 616–619. [Google Scholar] [CrossRef]
  22. Pries, C.E.H.; Castanha, C.; Porras, R.C.; Torn, M.S. The whole-soil carbon flux in response to warming. Science 2017, 355, 1420–1422. [Google Scholar] [CrossRef] [PubMed] [Green Version]
  23. Hagedorn, F.; Joos, O. Experimental summer drought reduces soil CO2 effluxes and DOC leaching in Swiss grassland soils along an elevational gradient. Biogeochemistry 2014, 117, 395–412. [Google Scholar] [CrossRef]
  24. Cleveland, C.C.; Reed, S.C.; Townsend, A.R. Nutrient regulation of organic matter decomposition in a tropical rain forest. Ecology 2006, 87, 492–503. [Google Scholar] [CrossRef] [PubMed]
  25. Chang, R.; Li, N.; Sun, X.; Hu, Z.; Bai, X.; Wang, G. Nitrogen addition reduces dissolved organic carbon leaching in a montane forest. Soil Biol. Biochem. 2018, 127, 31–38. [Google Scholar] [CrossRef]
  26. Gielen, B.; Neirynck, J.; Luyssaert, S.; Janssens, I.A. The importance of dissolved organic carbon fluxes for the carbon balance of a temperate Scots pine forest. Agric. For. Meteorol. 2011, 151, 270–278. [Google Scholar] [CrossRef]
  27. Mulholland, P.J. Large-scale patterns in dissolved organic carbon concentration, flux, and sources. In Aquatic Ecosystems; Findlay, S.E.G., Sinsabaugh, R.L., Eds.; Academic Press: Burlington, NJ, USA, 2003; pp. 139–159. [Google Scholar]
  28. Harrison, J.A.; Caraco, N.; Seitzinger, S.P. Global patterns and sources of dissolved organic matter export to the coastal zone: Results from a spatially explicit, global model. Glob. Biogeochem. Cycles 2005, 19, GB4S04. [Google Scholar] [CrossRef]
  29. Moatar, F.; Abbott, B.W.; Minaudo, C.; Curie, F.; Pinay, G. Elemental properties, hydrology, and biology interact to shape concentration-discharge curves for carbon, nutrients, sediment, and major ions. Water Resour. Res. 2017, 53, 1270–1287. [Google Scholar] [CrossRef]
  30. Raymond, P.A.; Saiers, J.E.; Sobczak, W.V. Hydrological and biogeochemical controls on watershed dissolved organic matter transport: Pulse-shunt concept. Ecology 2016, 97, 5–16. [Google Scholar] [CrossRef]
  31. Zarnetske, J.P.; Bouda, M.; Abbott, B.W.; Saiers, J.; Raymond, P.A. Generality of hydrologic transport limitation of watershed organic carbon flux across ecoregions of the United States. Geophys. Res. Lett. 2018, 45, 11702–11711. [Google Scholar] [CrossRef]
  32. Wright, I.J.; Reich, P.B.; Westoby, M.; Ackerly, D.D.; Baruch, Z.; Bongers, F.; Cavender-Bares, J.; Chapin, T.; Cornelissen, J.H.C.; Diemer, M.; et al. The worldwide leaf economics spectrum. Nature 2004, 428, 821–827. [Google Scholar] [CrossRef] [PubMed]
  33. Cornwell, W.K.; Cornelissen, J.H.C.; Amatangelo, K.; Dorrepaal, E.; Eviner, V.T.; Godoy, O.; Hobbie, S.E.; Hoorens, B.; Kurokawa, H.; Perez-Harguindeguy, N.; et al. Plant species traits are the predominant control on litter decomposition rates within biomes worldwide. Ecol. Lett. 2008, 11, 1065–1071. [Google Scholar] [CrossRef] [PubMed]
  34. de la Riva, E.G.; Prieto, I.; Villar, R. The leaf economic spectrum drives leaf litter decomposition in Mediterranean forests. Plant Soil 2019, 435, 353–366. [Google Scholar] [CrossRef]
  35. Pregitzer, K.S.; Zak, D.R.; Burton, A.J.; Ashby, J.A.; MacDonald, N.W. Chronic nitrate additions dramatically increase the export of carbon and nitrogen from northern hardwood ecosystems. Biogeochemistry 2004, 68, 179–197. [Google Scholar] [CrossRef]
  36. Shi, S.; Yang, M.; Hou, Y.; Peng, C.; Wu, H.; Zhu, Q.; Liang, Q.; Xie, J.; Wang, M. Simulation of dissolved organic carbon concentrations and fluxes in Chinese monsoon forest ecosystems using a modified TRIPLEX-DOC model. Sci. Total Environ. 2019, 697, 20. [Google Scholar] [CrossRef]
  37. Kattge, J.; Sandel, B. TRY plant trait database—Enhanced coverage and open access (vol 2020, pg 119, 2020). Glob. Change Biol. 2020, 26, 5343. [Google Scholar] [CrossRef]
  38. Grime, J.P. Benefits of plant diversity to ecosystems: Immediate, filter and founder effects. J. Ecol. 1998, 86, 902–910. [Google Scholar] [CrossRef]
  39. Lavorel, S.; Garnier, E. Predicting changes in community composition and ecosystem functioning from plant traits: Revisiting the Holy Grail. Funct. Ecol. 2002, 16, 545–556. [Google Scholar] [CrossRef]
  40. Finegan, B.; Pena-Claros, M.; de Oliveira, A.; Ascarrunz, N.; Bret-Harte, M.S.; Carreno-Rocabado, G.; Casanoves, F.; Diaz, S.; Eguiguren Velepucha, P.; Fernandez, F.; et al. Does functional trait diversity predict above-ground biomass and productivity of tropical forests? Testing three alternative hypotheses. J. Ecol. 2015, 103, 191–201. [Google Scholar] [CrossRef] [Green Version]
  41. Zhou, H.; Shao, J.; Liu, H.; Du, Z.; Zhou, L.; Liu, R.; Bernhofer, C.; Gruenwald, T.; Dusek, J.; Montagnani, L.; et al. Relative importance of climatic variables, soil properties and plant traits to spatial variability in net CO2 exchange across global forests and grasslands. Agric. For. Meteorol. 2021, 307, 15. [Google Scholar] [CrossRef]
  42. Lefsky, M.A. A global forest canopy height map from the moderate resolution imaging spectroradiometer and the geoscience laser altimeter system. Geophys. Res. Lett. 2010, 37, 15. [Google Scholar] [CrossRef] [Green Version]
  43. Running, S.W.; Nemani, R.R.; Heinsch, F.A.; Zhao, M.S.; Reeves, M.; Hashimoto, H. A continuous satellite-derived measure of global terrestrial primary production. Bioscience 2004, 54, 547–560. [Google Scholar] [CrossRef]
  44. Clifford, P.; Richardson, S.; Hemon, D. Assessing the significance of the correlation between two spatial processes. Biometrics 1989, 45, 123–134. [Google Scholar] [CrossRef] [PubMed]
  45. Bradford, M.A.; Veen, G.F.; Bonis, A.; Bradford, E.M.; Classen, A.T.; Cornelissen, J.H.C.; Crowther, T.W.; De Long, J.R.; Freschet, G.T.; Kardol, P.; et al. A test of the hierarchical model of litter decomposition. Nat. Ecol. Evol. 2017, 1, 1836–1845. [Google Scholar] [CrossRef] [PubMed]
  46. Hu, Z.; Chen, H.Y.H.; Yue, C.; Gong, X.Y.; Shao, J.; Zhou, G.; Wang, J.; Wang, M.; Xia, J.; Li, Y.; et al. Traits mediate drought effects on wood carbon fluxes. Glob. Change Biol. 2020, 26, 3429–3442. [Google Scholar] [CrossRef]
  47. Sokal, R.R.J.B. The principles and practice of statistics in biological research. Biometry 1995, 451–554. [Google Scholar] [CrossRef]
  48. Nakagawa, S.; Schielzeth, H. A general and simple method for obtaining R2 from generalized linear mixed-effects models. Methods Ecol. Evol. 2013, 4, 133–142. [Google Scholar] [CrossRef]
  49. Hu, Z.; Michaletz, S.T.; Johnson, D.J.; McDowell, N.G.; Huang, Z.; Zhou, X.; Xu, C. Traits drive global wood decomposition rates more than climate. Glob. Change Biol. 2018, 24, 5259–5269. [Google Scholar] [CrossRef]
  50. Heikkinen, R.K.; Luoto, M.; Kuussaari, M.; Pöyry, J. New insights into butterfly–environment relationships using partitioning methods. Proc. R. Soc. B Boil. Sci. 2005, 272, 2203–2210. [Google Scholar] [CrossRef] [Green Version]
  51. Jian, J.; Steele, M.K.; Thomas, R.Q.; Day, S.D.; Hodges, S.C. Constraining estimates of global soil respiration by quantifying sources of variability. Glob. Change Biol. 2018, 24, 4143–4159. [Google Scholar] [CrossRef]
  52. Wieder, W.R.; Cleveland, C.C.; Townsend, A.R. Controls over leaf litter decomposition in wet tropical forests. Ecology 2009, 90, 3333–3341. [Google Scholar] [CrossRef] [PubMed] [Green Version]
  53. Perakis, S.S.; Matkins, J.J.; Hibbs, D.E. Interactions of tissue and fertilizer nitrogen on decomposition dynamics of lignin-rich conifer litter. Ecosphere 2012, 3, 1–12. [Google Scholar] [CrossRef]
  54. Reich, P.B.; Walters, M.B.; Ellsworth, D.S. From tropics to tundra: Global convergence in plant functioning. Proc. Natl. Acad. Sci. USA 1997, 94, 13730–13734. [Google Scholar] [CrossRef] [PubMed] [Green Version]
  55. Moreno, G.; Gallardo, J.F.; Bussotti, F. Canopy modification of atmospheric deposition in oligotrophic Quercus pyrenaica forests of an unpolluted region (central-western Spain). For. Ecol. Manag. 2001, 149, 47–60. [Google Scholar] [CrossRef]
  56. Fowler, R.A.; Osburn, C.L.; Saros, J.E. Climate-driven changes in dissolved organic carbon and water clarity in Arctic lakes of west Greenland. J. Geophys. Res. Biogeosci. 2020, 125, 2. [Google Scholar] [CrossRef]
  57. Prescott, C.E.J.B. Litter decomposition: What controls it and how can we alter it to sequester more carbon in forest soils? Biogeochemistry 2010, 101, 133–149. [Google Scholar] [CrossRef]
  58. Deng, M.; Liu, L.; Jiang, L.; Liu, W.; Wang, X.; Li, S.; Yang, S.; Wang, B. Ecosystem scale trade-off in nitrogen acquisition pathways. Nat. Ecol. Evol. 2018, 2, 1724–1734. [Google Scholar] [CrossRef]
  59. Matulich, K.L.; Martiny, J.B.H. Microbial composition alters the response of litter decomposition to environmental change. Ecology 2015, 96, 154–163. [Google Scholar] [CrossRef]
  60. Buzzard, V.; Michaletz, S.T.; Deng, Y.; He, Z.; Ning, D.; Shen, L.; Tu, Q.; Van Nostrand, J.D.; Voordeckers, J.W.; Wang, J.J.; et al. Continental scale structuring of forest and soil diversity via functional traits. Nat. Ecol. Evol. 2019, 3, 1298–1308. [Google Scholar] [CrossRef]
  61. Cubino, J.P.; Biurrun, I.; Bonari, G.; Braslavskaya, T.; Font, X.; Jandt, U.; Jansen, F.; Rašomavičius, V.; Škvorc, Ž.; Willner, W.J.E. The leaf economic and plant size spectra of European forest understory vegetation. Ecography 2021, 44, 1311–1324. [Google Scholar] [CrossRef]
  62. Aitkenhead-Peterson, J.A.; Alexander, J.E.; Albrechtova, J.; Kram, P.; Rock, B.; Cudlín, P.; Hruška, J.; Lhotakova, Z.; Huntley, R.; Oulehle, F.J.P.; et al. Linking foliar chemistry to forest floor solid and solution phase organic C and N in Picea abies [L.] Karst stands in northern Bohemia. Plant Soil 2006, 283, 187–201. [Google Scholar] [CrossRef]
  63. Chen, H.Y.H.; Brant, A.N.; Seedre, M.; Brassard, B.W.; Taylor, A.R. The contribution of litterfall to net primary production during secondary succession in the Boreal forest. Ecosystems 2017, 20, 830–844. [Google Scholar] [CrossRef]
  64. Camino-Serrano, M.; Gielen, B.; Luyssaert, S.; Ciais, P.; Vicca, S.; Guenet, B.; De Vos, B.; Cools, N.; Ahrens, B.; Arain, M.A.; et al. Linking variability in soil solution dissolved organic carbon to climate, soil type, and vegetation type. Glob. Biogeochem. Cycles 2014, 28, 497–509. [Google Scholar] [CrossRef]
  65. He, N.; Liu, C.; Tian, M.; Li, M.; Yang, H.; Yu, G.; Guo, D.; Smith, M.D.; Yu, Q.; Hou, J. Variation in leaf anatomical traits from tropical to cold-temperate forests and linkage to ecosystem functions. Funct. Ecol. 2018, 32, 10–19. [Google Scholar] [CrossRef] [Green Version]
  66. Kembel, S.W.; Mueller, R.C. Plant traits and taxonomy drive host associations in tropical phyllosphere fungal communities. Botany 2014, 92, 4. [Google Scholar] [CrossRef] [Green Version]
  67. Manning, D.W.P.; Rosemond, A.D.; Gulis, V.; Benstead, J.P.; Kominoski, J.S. Nutrients and temperature additively increase stream microbial respiration. Glob. Change Biol. 2018, 24, E233–E247. [Google Scholar] [CrossRef]
  68. Lustenhouwer, N.; Maynard, D.S.; Bradford, M.A.; Lindner, D.L.; Oberle, B.; Zanne, A.E.; Crowther, T.W. A trait-based understanding of wood decomposition by fungi. Proc. Natl. Acad. Sci. USA 2020, 117, 11551–11558. [Google Scholar] [CrossRef]
  69. Williams, K.; Percival, F.; Merino, J.; Mooney, H.A. Estimation of Tissue Construction Cost from Heat of Combustion and Organic Nitrogen Content. Plant Cell Environ. 1987, 10, 725–734. [Google Scholar] [CrossRef]
  70. Kembel, S.W.; O’Connor, T.K.; Arnold, H.K.; Hubbell, S.P.; Wright, S.J.; Green, J.L. Relationships between phyllosphere bacterial communities and plant functional traits in a neotropical forest. Proc. Natl. Acad. Sci. USA 2014, 111, 13715–13720. [Google Scholar] [CrossRef] [Green Version]
  71. Berg, B.; McClaugherty, C. Plant Litter: Decomposition, Humus Formation, Carbon Sequestration; Springer Nature: Berlin, Germany, 2020. [Google Scholar]
  72. Hu, Z.; Xu, C.; McDowell, N.G.; Johnson, D.J.; Wang, M.; Luo, Y.; Zhou, X.; Huang, Z. Linking microbial community composition to C loss rates during wood decomposition. Soil Biol. Biochem. 2017, 104, 108–116. [Google Scholar] [CrossRef] [Green Version]
  73. Weyhenmeyer, G.A.; Froberg, M.; Karltun, E.; Khalili, M.; Kothawala, D.; Temnerud, J.; Tranvik, L.J. Selective decay of terrestrial organic carbon during transport from land to sea. Glob. Change Biol. 2012, 18, 349–355. [Google Scholar] [CrossRef]
  74. Agren, G.I.; Kleja, D.B.; Bosatta, E. Modelling Dissolved organic carbon production in coniferous forest soils. Soil Sci. Soc. Am. J. 2018, 82, 1392–1403. [Google Scholar] [CrossRef] [Green Version]
  75. Wang, Q.; Wang, S.; He, T.; Liu, L.; Wu, J. Response of organic carbon mineralization and microbial community to leaf litter and nutrient additions in subtropical forest soils. Soil Biol. Biochem. 2014, 71, 13–20. [Google Scholar] [CrossRef]
  76. Yu, X.; Dijkstra, F.A. Carbon and nitrogen dynamics affected by litter and nitrogen addition in a grassland soil: Role of fungi. Eur. J. Soil Biol. 2020, 100, 103211. [Google Scholar] [CrossRef]
  77. Spurr, S.H.; Barnes, B.V. Forest Ecology, 3rd ed.; John Wiley & Sons: North Miami Beach, FL, USA, 1980. [Google Scholar]
Figure 1. The global distribution of the field experiments used in this synthesis. Blue and red circles represent dissolved organic carbon (DOC) flux sampled from throughfall in broadleaved and coniferous forests, respectively. Blue and red circles and triangles represent DOC fluxes sampled from the litter layer in broadleaved and coniferous forests, respectively.
Forests 13 01119 g001
Figure 2. Comparison of DOC flux from throughfall or the litter layer between broadleaved and coniferous forests. The box and whisker plots represent 25th percentile, median, 75th percentile, minimum and maximum values in each bin. The black solid circles present the mean values. The red circles represent data from throughfall. The green and orange squares represent data from throughfall in coniferous and broadleaved forests, respectively. The red rhombuses represent data from the litter layer. The green and orange rhombuses represent data from the litter in coniferous and broadleaved forests, respectively. Significant differences are denoted by “*” at p < 0.05, between coniferous forests and broadleaved forests.
Forests 13 01119 g002
Figure 3. Relationships of the DOC flux from throughfall with mean annual temperature (MAT) (a), mean annual precipitation (MAP) (b), and potential evapotranspiration (PET) (c). Relationships of the DOC fluxes from the litter layer with MAT (d), MAP (e), and PET (f). The fitted lines were determined with a linear mixed-effect model, with the site within the climate zone as a nested random factor. cR2 indicated the contribution of fixed and random effects. The orange and blue squares represented data in broadleaved and coniferous forests, respectively. The dashed line indicated an insignificant correlation between DOC flux and climate properties at the p > 0.05 level. Response and predictor variables were transformed by the nature log.
Forests 13 01119 g003
Figure 4. Relationships of the DOC flux from throughfall with net primary production (NPP) (a), leaf area index (LAI) (b), canopy height (c), specific leaf area (SLA) (d), leaf nitrogen content per leaf mass (LN) (e), and leaf phosphorus content per leaf mass (LP) (f). Relationships of the DOC fluxes from the litter layer with NPP, (g), LAI, (h), canopy height (i), SLA (j), LN (k), LP (l). The fitted lines were determined by a linear mixed-effect model, with the site within the climate zone as a nested random factor. cR2 indicated the contribution of fixed and random effects. The orange and blue squares represent data in broadleaved and coniferous forests, respectively. The dashed line indicates an insignificant correlation between DOC flux and climate properties, at the p > 0.05 level.
Forests 13 01119 g004
Figure 5. Variation partitioning (marginal R2) of climate and plant traits when accounting for the variance in DOC flux from throughfall (I) and the litter layer (III). In the multiple linear mixed model, the symbols a/c and b/d represent the independent effects of climate factors and plant traits on DOC flux from the throughfall/litter layer; ab/cd represent the interactive effects between climate and plant traits on DOC flux from throughfall/litter layer, respectively (see Figure S2 in the Supplementary Materials). The random forest values indicate the predictor importance (IncNodePurity) of climate and plant traits on DOC flux from throughfall (II) and the litter layer (IV). Variable importance is indicated as an increase in the model’s node purity if a specific variable is removed. There are nine variables used in the full-variable random forests model, including MAT, MAP, PET, LAI, NPP, canopy height, SLA, LN, and LP. The abbreviations are in reference to Figure 3 and Figure 4.
Forests 13 01119 g005
Table 1. The multiple effects of climate, plant traits, and forest type on DOC flux from throughfall and the litter layer, based on the best model. Results from multiple linear mixed models are shown.
ModelThroughfallModelLitter Layer
VariableCoefficientVariableCoefficient
Full
model
Intercept9.09Full
model
Intercept−0.13
MAT−1.54 * MAT1.33
MAP0.17 MAP−0.19
SLA−0.71 LN0.10 **
NPP0.31 SLA−0.35
LN−0.41 * FT−1.58
FT0.51 * LN × FT1.55 ***
LN × MAT0.12 * SLA × FT0.33 ***
SLA × FT2.51 *** mR276.7
mR246.3
Climate modelIntercept−1.37Climate modelIntercept1.48
MAT0.79 * MAT−70 *
MAP0.12 MAP2.00
mR219.1 mR28.3
Traits
model
Intercept5.71Traits
model
Intercept2.49
SLA−0.75 * LN0.12 **
NPP0.75 * SLA−0.36
LN−0.03 FT−2.39
FT−0.71 *** LN × FT−0.37 ***
SLA × FT1.52 *** SLA × FT1.79 ***
mR229.0 mR276.4
Note. MAT (°C), mean annual temperature; MAP (mm), mean annual precipitation; NPP (kg yr−1), net primary production; LAI, leaf area index; SLA (cm2 g−1), specific leaf area; LN (g N kg−1), leaf nitrogen content per leaf mass; LP (g P kg−1), leaf phosphorus content per leaf mass. mR2 indicates fixed effects (R2 marginal). The symbol ‘×’ indicates the interaction of two variables. *** p < 0.001, ** p < 0.01, * p < 0.05.
Publisher’s Note: MDPI stays neutral with regard to jurisdictional claims in published maps and institutional affiliations.

