Abstract
Broussonetia papyrifera (L.) L’Hér. ex Vent., a perennial deciduous tree, is used in feed, medicine, papermaking, environmental protection, and ecological restoration. This paper ttook 33 provenances from the natural distribution as the research objects, observes their growth and nutritional traits, and analyzes the laws of geographical variation. The repeatability was 0.80–0.88 and 0.48–0.91, respectively. The correlation was significant (the correlation coefficient was 0.764). The variation is greatly affected by the latitudinal direction. Through clustering, the 33 provenances were clustered into 4 groups and most provenances with relatively close geographical origins were clustered together, showing differences between different geographical regions. Using leaf biomass (0.4662 g) and crude protein content (14.39%) as the selection index, the Sichuan Mianyang (SCMY), Chongqing Kaizhou (CQKZ), Shanghai (SH), and Fujian Nanping (FJNP) provenances were selected as fast-growing, high-yield, and high-quality paper mulberry provenances. This study provides the basis for the selection of excellent paper mulberry trees.
1. Introduction
Broussonetia papyrifera (L.) L’Hér. Ex Vent., also known as peach, valley tree, and shell tree, is a perennial deciduous tree of the genus Broussonetia and the family Moraceae. It is distributed in China, the Malay Peninsula, the Korean Peninsula, Japan, Southeast Asia, the Pacific Islands, and other places. Broussonetia papyrifera resources are abundant in China and are widely distributed around the Yellow River, Yangtze River, Pearl River Basin, and Taiwan, where the plant grows wild or is planted in wastelands, the countryside, and ditches near villages [1,2]. Paper mulberry is a positive tree species with strong adaptability, stress resistance, and pollution resistance. It has the characteristics of fast growth, wide distribution, easy reproduction, high heat tolerance, and short rotation period. It has important economic value, and the whole plant can be used as a medicine with high medicinal value, while the leaves and fruits are rich in flavonoids, alkaloids, and coumarins [3,4]. Extracts of paper ketones, lignans, and terpenoids have antibacterial, anti-oxidation, and anti-cancer effects, relieve fatigue, and improve human immunity and are used in the treatment of breast cancer, diabetes, obesity, gout, and cardiovascular diseases [5,6,7,8,9]. The phloem fiber of paper mulberry bark is slender and represents 43.06% of contents. It can be used as a high-quality raw material for papermaking, rayon, advanced blending. Naxi Dongba paper, and the Dai nationality handmade paper, the latter two of which were selected for the first batch of submission to the national intangible cultural heritage list and are mainly made from paper mulberry [10,11,12]. The seeds are rich in fatty oils and can be used as raw materials for the production of paint, soap, and lubricating oil. It has the unique characteristics of thick leaves, a rough surface, and pilose on the back. It has a very strong ability to absorb harmful gases and dust, so it is often used as a greening and pollution-resistant tree species for planting [13,14]. Paper mulberry is widely used and plays an important role in poverty alleviation industries, environmental protection, and ecological restoration [15,16,17,18].
The crude protein content in the leaves of paper mulberry can reach more than 20%, which is higher than that of plants such as alfalfa (Medicago sativa, Shi S L). Research shows that using B. papyrifera as a raw material to produce feed for cattle, sheep, and pigs can greatly improve the quality of the meat and as a high-quality feed it can greatly reduce the cost of feed [19,20,21,22,23]. If it can be developed into a new type of feed material, it can not only increase the added value of paper mulberry but also reduce the cost of feed and promote the development of industry. At present, there is no clear understanding of the geographical differences in the growth and nutritional properties of B. papyrifera from different provenances in China. During its promotion, it became impossible to accurately obtain excellent provenances with fast growth and high nutritional value, resulting in the slow growth or low nutritional value of artificially planted B. papyrifera, which greatly reduces its economic value. Therefore, the study of the variation in growth and nutritional traits in the leaf powder of different provenances of paper mulberry can provide a basis for the selection of excellent provenances. In this study, the leaf powder of 33 provenances of paper mulberry was used as the research object, the growth amount and conventional nutrient components in the growth period were determined, and the differences in the feed traits of the paper mulberry leaf powder of different provenances were studied. Taking the biomass and crude protein content of the leaves as the main selection indexes, the excellent provenances were selected. This study can provide a reference for the selection and breeding of paper mulberry.
2. Materials and Methods
2.1. Materials
We collected paper mulberry seeds with 33 provenances (Table 1 and Figure 1) and raised seedlings in the greenhouse of the College of Forestry and Landscape Architecture, South China Agricultural University, Guangzhou.

Table 1.
Geographic locations and ecological factors of B. papyrifera.
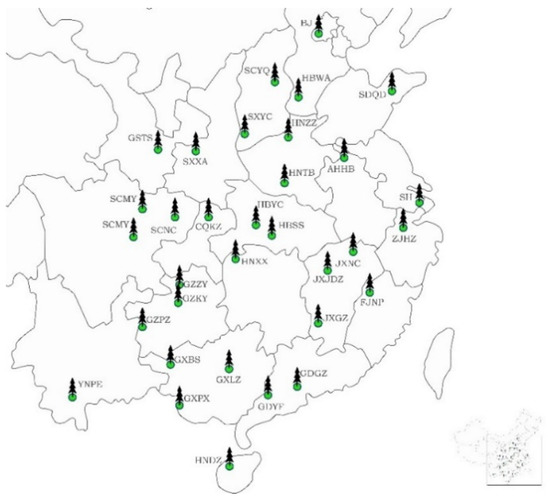
Figure 1.
Distribution map of seed collection points of B. papyrifera in China.
Due to the low natural germination rate of mature paper mulberry seeds, concentrated sulfuric acid was used to induce germination and then the germinated seeds were moved to a nursery cup for growth and management in a greenhouse. In June 2018, they were transplanted to the afforestation test site for field afforestation. The row spacing of the fixed plants was 0.5 m × 2.0 m. The experiment used a randomized complete block design with 10 blocks containing 5 plants each.
2.2. Experimental Method
The afforestation was uniformly mowed for 1.5 years and continued to grow for 90 days to investigate the growth traits, including plant Height (H in cm), Ground Diameter (GD in cm), and Crown width (C in cm). Then, it was cut again and five plant leaves from each plot were mixed into one sample and there were 10 mixed samples from each provenance. We weighed the fresh weight (leaf biomass, Bio) of each leaf sample, placed the collected leaf samples into an oven at 105 °C for 30 min, and then baked them at 80 °C for 48 h. The samples were mixed evenly by the quartering method and the relevant nutritional indicators were determined by sampling. The Dry Matter (DM), Crude Protein (CP), Ether Extract (EE) and Ash of the samples were detected by the method described by AOAC [24], the contents of Calcium (Ca) and Phosphorus (P) were detected by the method of Tang [25], and the neutral detergent fiber (NDF) and acid detergent fiber (ADF) contents were determined by the method described by Van Soest [26].
2.3. Data Analysis
R version 4.0.2 [27] was used for the analysis of the variation in growth and nutritional traits, including coefficient of variation (CV), genetic variation coefficient (GVC), the provenance variance (Vp), the random error variance (Ve), gain (G), and repeatability (R). In order to determine the differences between the phenotypic variables of the provenances, Duncan’s multiple range tests were conducted in the agricolae package [28] of R version 4.0.2. Variance analyses were estimated using the sommer package [29] in R version 4.0.2. Cluster analyses were conducted using SPSS 19 software [30]. Based on a General Linear Model:
where y is a vector of trait phenotypes, β is a vector of random effects (provenance), and ε is the residual. X is random effects.
y = X β + ε
The coefficient of variation (CV) was calculated using the following formula:
where is the trait average phenotypic mean, and SD is the phenotypic standard deviation.
The genetic variation coefficient (GVC) was calculated using the following formula:
To estimate the degree of genetic control for each trait, repeatability (R) for all traits in the provenances overall was calculated using the following formula, based on the variance component estimates from the model analyses:
The realized gain (G) was estimated by:
where and are the mean values of the selected superior provenance and the overall trait, respectively.
The repeatability (R) was estimated by:
where F is the mean square ratio between the processing of the statistical method and the random error.
Surfer 13.0 (Golden Software, Golden, CO, USA) software was used for trend surface mapping. The regression equation for the trend surface analysis was as follows:
where β is the regression coefficient, x is the latitude, y is the longitude, and εij is the random error.
Zi = β0 + β1x + β2y + β3x2 + β4y2 + β5xy + εij
3. Results
3.1. Variation in Growth Traits of Different Provenances
Among all growth traits (Table 2), the maximum values of GD, H, C, and Bio were 13.87 mm, 107 cm, 134 cm, and 1.64 kg, respectively, and the minimum values of GD, H, C, and Bio were 2.89 mm, 12.50 cm, 5.50 cm, and 0.01 kg, respectively. The variation coefficients of GD, H, C, and Bio were 22.63%, 26.41%, 30.39%, and 62.88%, respectively.
Table 2.
Growth trait statistics for B. papyrifera.
This shows that the genetic differences of growth traits between different provenances. Among all growth traits, GD had the smallest coefficient of variation, while Bio has the largest coefficient of variation. This indicated that the genetic improvement potential of the biomass of the leaves of the arborvitae was the greatest.
3.2. Variation of Nutritional Traits in Different Provenances
Among all nutritional traits (Table 3), the maximum values of CP, NDF, ADF, DM, EE, Ash, Ca, and P were 20.06%, 59.46%, 32.21%, 36.85%, 5.39%, 19.23%, 4.16%, and 5.76%, while the minimum values were 10.60%, 24.02%, 11.00%, 8.92%, 2.23%, 5.71%, 1.00%, and 2.08%, respectively. The coefficients of variation of CP, NDF, ADF, DM, EE, Ash, Ca, and P were 12.77%, 15.75%, 20.88%, 11.39%, 16.61%, 15.32%, 18.64%, and 18.30%, respectively. The coefficient of variation of DM was the smallest and the coefficient of variation of ADF was the largest. The coefficient of variation of all nutritional traits was greater than 10%.
Table 3.
Nutritional trait statistics for B. papyrifera.
3.3. Analysis of Variance for Different Provenance Traits
Except for the insignificant variance of Ash among different provenances (Table 4), the variances of all the other traits were significant. The provenance variance of GD, H, C, and BIO accounted for 28.67%, 41.75%, 35.76%, and 33.33% of the total variance, respectively. CP, NDF, ADF, DM, EE, Ca, and P accounted for 14.79%, 51.43%, 15.94%, 5.43%, 48.78%, 4.76%, and 17.07% of the total variance, respectively. With the exception of NDF, these values are all lower than the variance component caused by random error, which suggests that the variation in NDF is mainly influenced by genetic effects while the variation in other traits is mainly influenced by random environmental effects. The repeatability of the growth traits (GD, H, C, Bio) was 0.80–0.88, which suggests that these growth traits are under a high degree of genetic control. The repeatability of the nutritional traits (CP, NDF, ADF, DM, P) was 0.48–0.91, which suggests that these traits of paper mulberry are under medium-to-high genetic control. The repeatability of Ash and Ca were 0.25 and 0.33, respectively, and these two traits were under low genetic control. The coefficient of genetic variation (GVC) of growth traits was 12.19–34.27%, and the coefficient of genetic variation (GVC) of nutritional traits was 2.79–11.58%. The GVC of growth traits was greater than that of nutritional traits. The GVC of Bio (34.27%) was much larger than the other traits, showing that the provenance selection potential of Bio is much greater than that of other traits. When comparing growth traits and nutritional traits, the provenance selection potential of growth traits is much greater than that of nutritional traits.
Table 4.
Variance components, repeatability, and genetic variation coefficients of the provenances.
3.4. Typical Correlation Analysis between Growth and Nutritional Traits
The typical correlation analysis results of the growth traits and nutritional traits are shown in Table 5. The correlation coefficient of canonical variable 1 is 0.764 and reaches a significant level, which shows that the relationship between the growth traits and the nutritional traits of paper mulberry provenance is very close. Except for calcium, the typical load coefficient values of all traits exceeded 0.60. From the load symbols of each trait, all growth traits have the same symbols as dry matter and calcium content, which are positively correlated. They are negatively correlated with the sign of crude protein, crude fat, and phosphorus content. It can be seen that with the increase in growth traits among different provenances, the content of dry matter and calcium increases. However, the contents of crude protein, crude fat, and phosphorus tended to decrease. Among canonical variables 1, leaf biomass (−0.915) and crude protein (0.685) had the largest loads, reflecting the effect of total biomass and crude protein on mutual traits. This indicates that the variation in the growth traits and nutritional traits of paper mulberry provenances was most affected by the variation in crude protein and leaf biomass.
Table 5.
Canonical correlation analysis of growth and nutritional traits.
3.5. Geographical Variation Analysis of Different Provenances
To better understand the relative trends of each trait and geographic variation, a binary quadratic trend surface analysis was performed (Table 6). The regression equations of GD, H, C, Bio, CP, and EE reached a significant level while the regression equations for NDF, ADF, DM, Ash, Ca, and P did not reach a significant level (subsequent discussions do not consider traits whose geographic variation did not reach a significant level).
Table 6.
Regression equation for each trait.
It can be seen the relative trends of each trait from the trend surface diagram (Figure 2) that the geographic variation trends of the four growth traits (GD, H, C, and Bio) were similar, with the boundary around 38 °N, and the growth traits generally showed a decreasing trend from west to east in the southern region (influenced by longitude more than latitude). However, the northern area shows a decreasing trend from south to north (mainly affected by latitude, but not much by longitude). CP showed an increasing variation trend from southwest to northeast (more affected by latitude than longitude) and EE showed a trend of increasing first and then decreasing from southwest to northeast (more affected by latitude than longitude).
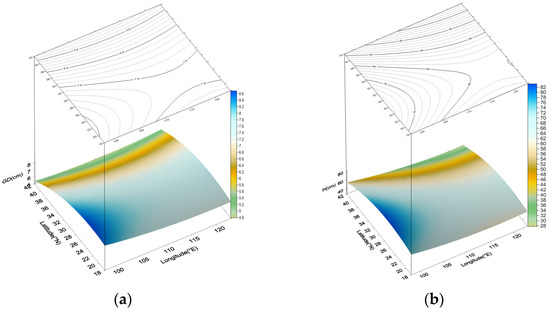
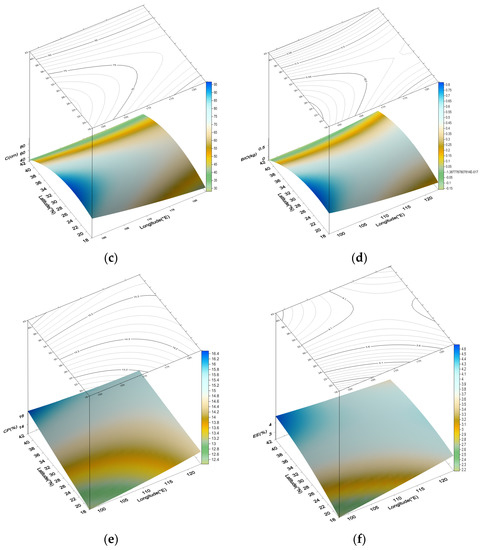
Figure 2.
Power contour-trend surfaces for the GD (a), H (b), C (c), Bio (d), CP (e), and EE (f) of B. papyrifera. The surface represents the geographic variation and the lines upon the surface represent the contours.
3.6. Provenance Clustering and Provenance Selection
3.6.1. Provenance Clustering
The growth and nutritional traits were used to perform cluster analysis on paper mulberry using the SPSS 19 software, and the results are shown in Figure 3. The threshold was 6, and the 33 paper mulberry provenances were divided into four categories. The first category contains two provenances from southwest China, Mianyang, Sichuan and Kaizhou, Chongqing. This group has the highest leaf biomass and high crude protein. The second category is mainly from the southern and southwestern regions, including Ganzhou in Jiangxi, Yichang in Hubei, Nanchong in Sichuan, Baise in Guangxi, Pu’er in Yunnan, Guangzhou in Guangdong, Dayi in Sichuan, Liuzhou in Guangxi, Yunfu in Guangdong, Panzhou in Guizhou, Huangping in Guizhou, Ping in Guangxi Xiang, and Guizhou Zunyi. This group has low protein content and large leaf biomass. The third group is mainly from the northern and southeastern regions, including Tongbai in Henan, Nanping in Fujian, Shanghai, Xiangxi in Hunan, Tianshui in Gansu, Nanchang in Jiangxi, Huaibei in Anhui, Zhengzhou in Henan, Qingdao in Shandong, Jingdezhen in Jiangxi, Shashi in Hubei, Hangzhou in Zhejiang and Xi’an in Shaanxi Province. The crude protein content of this group was higher and the leaf biomass was lower. The fourth group is mainly from northern provenances, including Wu’an in Hebei, Danzhou in Hainan, Yuncheng in Shanxi, Yangquan in Shanxi, and Beijing. This group has medium crude protein and the smallest leaf biomass.
Figure 3.
Cluster analysis of paper mulberry from different provenances.
3.6.2. Selection of Superiority Provenance for Feed Type
From the perspective of feed raw material production, the breeding of high-quality varieties is carried out and the main goal of breeding is to select excellent provenances with fast growth, large biomass, and high protein content. In the selection of excellent provenances for high-yield and high-quality feeds, leaf biomass and crude protein content can be considered selection indicators. In this paper, the overall average leaf biomass and crude protein content (0.4662 kg and 14.39%, respectively) were used as the threshold for the selection of superior provenances.
When the leaf samples were used as feed materials, leaf biomass and crude protein content were used as selection indicators. Seventeen provenances has biomass greater than the average (0.4662 g) and 15 provenances had crude protein content greater than the overall average (14.39%). Considering the two indicators, there were only four provenances with both indicators above the threshold (Figure 4), namely Sichuan Mianyang (SCMY), Chongqing Kaizhou (CQKZ), Shanghai (SH), and Fujian Nanping (FJNP). In the cluster analysis, the provenances of Sichuan Mianyang (SCMY) and Chongqing Kaizhou (CQKZ) were clustered into one group and the provenances of Shanghai (SH) and Fujian Nanping (FJNP) were clustered together. These two clusters were closely related. The genetic gains of all traits of the above four provenances are shown in Table 7, where the largest genetic gain is leaf biomass (27.01%), while the genetic gain of neutral detergent fiber is the smallest (−3.06%). The genetic gains were positive for all the growth traits, as well as the crude protein, acid detergent fiber, and crude fat, and negative for the other traits.
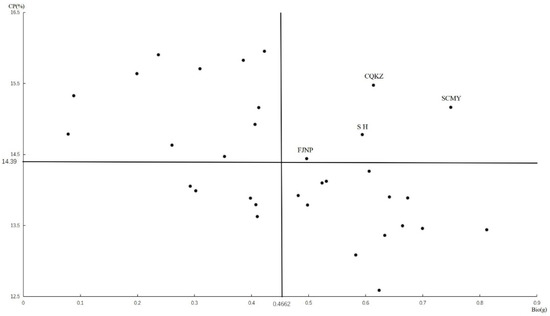
Figure 4.
Selection of superiority provenance for feed type.
Table 7.
Genetic gain of each characteristic of the selected superior provenances.
4. Discussion
4.1. Variation in Growth and Nutritional Traits of Paper Mulberry
In the production and application of woody feed, the speed of growth and the content of nutrients are important indicators. In this study, all traits of the different provenances were significantly different, the coefficient of variation of total leaf biomass was as high as 62%, and the coefficient of variation of the other growth traits was more than 20%, indicating that different provenances of paper mulberry have high genetic diversity, especially as it pertains to the huge potential of leaf biomass selection, which corresponds with the results of Liao [20].
The crude protein content in the leaves is relatively high, and using the leaves as feed materials can increase the growth of cattle and sheep, as it is a feed material with high crude protein content [21]. In this study, the main nutritional properties of the leaf powder were determined, and the crude protein content of the leaves was 10.6–20.6%, which was close to the results of Shi Haina [31] (12.98–19.57%) and slightly lower than those of Chen Tiantian (22.31%) and Zuo Xin (22.49%) [32,33]. It may be that the nutritional value of paper mulberry is affected by the growth period, tenderness, harvesting time, and stubble height of the harvested plants, and the nutritional components are quite different. The contents of crude fat, neutral detergent fiber, acid detergent fiber, crude ash, calcium, and phosphorus are also close to those reported by others [23,34,35]. There are great differences among different provenances for each nutritional trait, and the coefficient of variation is more than 10%, which is consistent with the research of Zuo Xin [33], meaning that the breeding selection potential is huge.
4.2. Correlation of Phenotypic Variation
In this experiment, the correlation between the growth traits was always strong and positive, similar to other plants [36,37,38]. These results may provide a rationale for indirect selection for growth traits. At the same time, the correlation between growth traits and nutritional traits is weak, which is similar to the findings of Alves [39]. However, the canonical correlation analysis of growth traits and nutritional traits showed that the overall correlation between the two was relatively high. The genes controlling these two types of traits may be related to a certain extent [40,41,42], but further verification at the molecular level is required.
4.3. Variation Patterns of Geographic Provenance
Geographical changes related to the origin of forest trees are one of the main components of changes at different levels of tree species. Using the influence of this change on growth traits and nutritional value, high-yielding, fast-growing, and high-quality feed-type paper mulberry germplasm resources can be selected [43,44,45]. In this paper, significant geographic differences were found in GD, H, C, Bio, CP, and EE. All growth traits showed similar patterns of geographic variation, which facilitated the evaluation of the growth potential of different provenances. In general, growth traits are more affected by latitude than longitude and are bounded by about 38° north latitude. Growth traits generally show a decreasing trend from west to east in the southern region. The north area shows a decreasing trend from south to north. This is consistent with the geographic variation of most tree phenotypic traits [46,47]. This pattern is closely related to the climatic conditions of the original tree distribution area [48]. At the paper mulberry seeding sites, the southwest and southern regions have higher annual average temperature, suitable precipitation, and longer plant growth periods. On the whole, CP and EE showed a decreasing trend from north to south, which was consistent with the results of wheat and other crops [49]. These results can play a guiding role in the selection of superior seed sources.
4.4. Source Selection of Forage Paper Mulberry
This study showed that all growth traits tested were significant, so leaf biomass can be used to replace the variation trend of growth traits. When developing fast-growing, high-yield, and forage-quality paper mulberry provenances, growth traits and nutritional traits should be considered comprehensively [50]. In this paper, using growth traits and nutritional traits for cluster analysis, the 33 paper mulberry provenances tested were divided into four categories, some geographically similar provenances were clustered together, and traits closely related to nutritional value were selected: leaf biomass and crude protein content were selected as selection indicators, and the Sichua Mianyang (SCMY), Chongqing Kaizhou (CQKZ), Shanghai (SH), and Fujian Nanping (FJNP) provenances were selected as fast-growing, high-yield, and high-quality paper mulberry provenances. Among the genetic gains of the above four provenance traits, the largest genetic gain was leaf biomass (27.01%), while the genetic gain of neutral detergent fiber was the smallest (−3.06%). Positive genetic gains were observed for all growth traits, including crude protein, crude fat, etc., but the genetic gains of traits such as neutral detergent fiber and ash content, which affect the nutritional value of paper mulberry leaves, were negative, which provides a basis for our selection of high-quality paper mulberry trees for foraging.
5. Conclusions
This study shows that there are significant differences in the growth and nutritional traits of paper mulberry among different provenances, and the potential for genetic improvement is great. Growth traits showed a decreasing trend from south to north, and nutritional traits were just the opposite, but provenances in the southwest and southeast regions showed good growth traits and nutritional traits. Overall, the variations in growth traits and nutritional traits were mainly affected by latitude, showing a relatively obvious south–north variation trend. Sichuan Mianyang (SCMY), Chongqing Kaizhou (CQKZ), Shanghai (SH), and Fujian Nanping (FJNP) were selected as fast-growing, high-yield, and high-quality provenances. If paper mulberry is used as a raw material for development, it is necessary to further improve the evaluation system that refines the quality of paper mulberry and further develop the palatability evaluation of poultry and livestock. This study helps to provide a scientific basis for high-quality paper mulberry breeding, production, and processing.
Author Contributions
Conceptualization, X.C. and W.Z.; methodology, P.Z. and W.Z.; software, P.Z.; validation, B.K., Q.Q. and S.C.; formal analysis, P.Z. and W.Z.; investigation, Q.Q., S.C., B.K. and P.Z.; resources, B.K. and W.Z.; data curation, P.Z. and S.C.; writing—original draft preparation, P.Z.; writing—review and editing, X.C. and W.Z.; visualization, P.Z.; supervision, X.C. and W.Z.; project administration, X.C. and W.Z.; funding acquisition, X.C. and W.Z. All authors have read and agreed to the published version of the manuscript.
Funding
This research was funded by the Forestry Science and Technology Innovation Project in Guang-dong Province (Grant No. 2018KJCX001), the Project of the Guangzhou Forestry and Garden Bureau (Research and demonstration of forest feed industry development), and the Youth Innovative Talents Project of Guangdong Province (2020KQNCX005).
Institutional Review Board Statement
For studies not involving humans or animals.
Informed Consent Statement
Informed consent was obtained from all subjects involved in the study. Written informed consent has been obtained from the patient(s) to publish this paper.
Data Availability Statement
The data presented in this study are available on request from the corresponding author. The data are not publicly available due to the request of the funder.
Conflicts of Interest
The authors declare no conflict of interest.
References
- González-Lorca, J.; Rivera-Hutinel, A.; Moncada, X.; Lobos, S.; Seelenfreund, D.; Seelenfreund, A.N.Z.J. Ancient and modern introduction of Broussonetia papyrifera ([L.] Vent.; Moraceae) into the Pacific: Genetic, geographical and historical evidence. N. Z. J. Bot. 2015, 53, 75–89. [Google Scholar] [CrossRef]
- Lin, J.; Zou, J.; Zhang, B.; Que, Q.; Zhang, J.; Chen, X.; Zhou, W. An efficient in vitro propagation protocol for direct organogenesis from root explants of a multi-purpose plant, Broussonetia papyrifera (L.) L’Hér. ex Vent. Ind. Crops Prod. 2021, 170, 113686. [Google Scholar] [CrossRef]
- Feng, W.; Li, H.; Zheng, X. Research of constituents of Broussonetia papyrifera. China J. New Drugs 2008, 17, 272–278. [Google Scholar]
- Zeng, P.; Guo, Z.; Xiao, X.; Zhou, H.; Gu, J.; Liao, B. Tolerance capacities of Broussonetia papyrifera to heavy metal(loid)s and its phytoremediation potential of the contaminated soil. Int. J. Phytoremediation 2022, 24, 580–589. [Google Scholar] [CrossRef]
- Ryu, H.W.; Curtislong, M.J.; Jung, S.; Jeong, I.Y.; Kim, D.S.; Kang, K.Y.; Park, K.H. Anticholinesterase potential of flavonols from paper mulberry (Broussonetia papyrifera) and their kinetic studies. Food Chem. 2012, 132, 1244–1250. [Google Scholar] [CrossRef] [PubMed]
- Cao, X.; Yang, L.; Xue, Q.; Yao, F.; Sun, J.; Yang, F.; Liu, Y. Antioxidant evaluation-guided chemical profiling and structure-activity analysis of leaf extracts from five trees in Broussonetia and Morus (Moraceae). Sci. Rep. 2020, 10, 4808. [Google Scholar] [CrossRef] [PubMed]
- Dong, Y.; Chen, C. Comprehensive Profiling of Paper Mulberry (Broussonetia papyrifera) Crotonylome Reveals the Significance of Lysine Crotonylation in Young Leaves. Int. J. Mol. Sci. 2022, 23, 1173. [Google Scholar] [CrossRef] [PubMed]
- Ran, X.K.; Wang, X.-T.; Liu, P.-P.; Chi, Y.-X.; Wang, B.-J.; Dou, D.-Q.; Kang, T.-G.; Xiong, W. Cytotoxic constituents from the leaves of Broussonetia papyrifera. Chin. J. Nat. Med. 2013, 11, 269–273. [Google Scholar] [CrossRef]
- Ko, H.H.; Chang, W.L.; Lu, T.M. Antityrosinase and antioxidant effects of ent-kaurane diterpenes from leaves of Broussonetia papyrifera. J. Nat. Prod. 2008, 71, 1930–1933. [Google Scholar] [CrossRef]
- Guo, F. on the Chinese Forest Culture. J. Northwest AF Univ. 2006, 6, 90–95. [Google Scholar]
- Niu, M.; Gao, H.; Zhang, L. Fiber morphology, chemical composition and pulping properties of xylem in Broussonetia papyrifera. Econ. For. Res. 2007, 25, 45–49. [Google Scholar]
- Bai, S. Analazy the Pulping Performance of Paper Mulberry of Different Tree-Age. Ph.D. Thesis, Dalian University of Technology, Dalian, China, 2009. [Google Scholar]
- Adil, S.; Mashiatullah, A.; Asma, M.; Abid, J.; Ghaffar, A. Heavy metal removal efficiency of paper mulberry biochar and commercially available silica powder from simulated industrial wastewater. Iran. J. Energy Environ. 2014, 5, 446–450. [Google Scholar]
- Yang, G.; Zhao, Y.; Xu, Z.; Huang, H.; Zhou, J. The chloroplast genome comparative characteristic of artificial breeding tree, a case about Broussonetia kazinoki × Broussonetia papyrifera. BIOCELL 2022, 46, 803–819. [Google Scholar]
- Wei, Y.; Wu, C.; Jiang, L. Evaluation of the benefits of development and utilization of paper mulberry resources in karst rocky desertification areas. Green Sci. Technol. 2014, 9, 60–61. [Google Scholar]
- Wang, J.; Liu, J.; Peng, X.; Ni, Z.; Wang, G.; Shen, S. Application of hybrid paper mulberry in ecological virecence of coastal saline. Tianjin Agric. Sci. 2014, 20, 95–101. [Google Scholar]
- Shi, X.; Zhang, X.; Chen, G.; Chen, Y.; Wang, L.; Shan, X. Seedling growth and metal accumulation of selected woody species in copper and lead zinc mine tailings. J. Environ. Sci. 2011, 23, 266–274. [Google Scholar] [CrossRef]
- Peng, X.; Wang, J.; Shen, S. Application of the paper mulberry in ecological restoration of tailings and mining area. Tianjin Agric. Sci. 2016, 22, 92–98. [Google Scholar]
- Si, B.; Tao, H.; Zhang, X.; Guo, J.; Cui, K.; Tu, Y.; Diao, Q. Effect of Broussonetia papyrifera L. (paper mulberry) silage on dry matter intake, milk composition, antioxidant capacity and milk fatty acid profile indairy cows. Asian-Australas J. Anim. Sci. 2018, 31, 1259–1266. [Google Scholar] [CrossRef]
- Liao, S.X.; Deng, Z.H.; Cui, K.; Cui, Y.Z.; Zhang, C.H. Genetic diversity of Broussonetia papyrifera populations in southwest China. Genet. Mol. Res. GMR 2014, 13, 7553–7563. [Google Scholar] [CrossRef]
- Sheng, P.; He, L.; Ji, S.; Huang, J.; Zhang, Z.; Wang, D.; Liu, J.; Zhang, H. Effect of Broussonetia papyrifera L. (paper mulberry) on growth performance, carcase traits, meat quality and immune performance in Hu ram lamb. Ital. J. Anim. Sci. 2021, 20, 691–697. [Google Scholar] [CrossRef]
- Tao, H.; Si, B.; Xu, W.; Tu, Y.; Diao, Q. Effect of Broussonetia papyrifera L. silage on blood biochemical parameters, growth performance, meat amino acids and fatty acids compositions in beef cattle. Asian-Australas J. Anim. Sci. 2019, 27, 1138–1163. [Google Scholar] [CrossRef] [PubMed]
- Alhassan, O. Effects of Supplementation with Leaves of Paper Mulberry (Broussonetia Papyrifera) on Growth Performance and Blood Indices of West African Dwarf Sheep (Djallonké) fed Napier Grass Basal Diet. Ph.D. Thesis, Kwame Nkrumah University, Kumasi, Ghana, 2011. [Google Scholar]
- Association of Official Analytical Chemists. Official Methods of an Analysis, 15th ed.; Association of Official Analytical Chemists: Arlington, TX, USA, 1990. [Google Scholar]
- Tang, X.; Ren, X.; Fang, Y. Determination of eight trace elements of P, Zn, Ba, Fe, Mn, Mg, Ca, Sr in plant by ICP-OES with microwave digestion. Resour. Environ. Eng. 2013, 27, 831–834. [Google Scholar]
- Van Soest, P.J.; Robertson, J.B.; Lewis, B.A. Methods for dietary fiber, neutral detergent fiber, and nonstarch polysaccharides in relation to animal nutrition. J. Dairy Sci. 1991, 74, 3583–3597. [Google Scholar] [CrossRef]
- R Core Team. R: A Language and Environment for Statistical Computing; R Foundation for Statistical Computing: Vienna, Austria, 2020. [Google Scholar]
- De Mendiburu, F. Agricolae: Statistical Procedures for Agricultural Research; American Statistical Association: Alexandria, VA, USA, 2020. [Google Scholar]
- Covarrubias-Pazaran, G. Genome-Assisted Prediction of Quantitative Traits Using the R Package sommer. PLoS ONE 2016, 11, e0156744. [Google Scholar] [CrossRef]
- Hai, P.H.; Jansson, G.; Harwood, C.; Hannrup, B.; Thinh, H.H. Genetic variation in growth, stem straightness and branch thickness in clonal trials of Acacia auriculiformis at three contrasting sites in Vietnam. For. Ecol. Manag. 2008, 255, 156–167. [Google Scholar] [CrossRef]
- Shi, H.; Liang, W.; Liu, Y.; Xu, Z.; Zhang, J.; Li, S.; Gao, Y.; Zhu, Z.; Qingyang Academy of Agricultural Sciences. Analysis on feeding Nutritive value of hybrid Broussonetia papyrifera. China Herbiv. Sci. 2019, 39, 4. [Google Scholar]
- Chen, T.; Zheng, F.; Wang, F. Nutritional components and fermentation quality of different parts of hybrid paper mulberry. Feed. Res. 2020, 43, 97–99. [Google Scholar]
- Zuo, X.; Chen, Z.; Xie, Q.; Zhai, S.S.; Wang, H.; Zhong, S.Y.; Zhu, Y.W.; Wang, W.C.; Yang, L. Determination of nutrients and metabolic energy of geese in Broussonetia papyrifera leaves powder and Broussonetia papyrifera twig leaves powder from different areas. Chin. J. Anim. Nutr. 2018, 30, 2823–28308. [Google Scholar]
- Hao, Y.Y.; Huang, S.; Zhang, J.; Gong, Y.; Liu, G.; Sun, X.; Lv, J.; Li, S. PSVIII-23 Effects of different growth height on the yield, chemical composition, silage fermentation profile, in vitro and in situ digestibility of Broussonetia papyrifera. J. Anim. Sci. 2020, 98 (Suppl. 4), 325–327. [Google Scholar] [CrossRef]
- Obour, R.; Oppong, S.K.; Abebrese, I.K. Chemical Composition and Nutritive Value of an Invasive Exotic Species Broussonetia Papyrifera in Ghana. J. Nat. Sci. Res. 2017, 7, 45–53. [Google Scholar]
- Duan, H.; Cao, S.; Zheng, H.; Hu, D.; Lin, J.; Lin, H.; Hu, R.; Sun, Y.; Li, Y. Variation in the Growth Traits and Wood Properties of Chinese Fir from Six Provinces of Southern China. Forests 2016, 7, 192. [Google Scholar] [CrossRef]
- Martins, K.; Santos, W.; Quadros, T.M.C.; Aguiar, A.V.D.; Machado, J.A.R.; Sebbenn, A.M.; Freitas, M.L.M. Genetic variation and effective population size of a Myracrodruon urundeuva (Engler) Fr. Allem. provenance and progeny test. J. For. Res. 2018, 23, 228–236. [Google Scholar] [CrossRef]
- Li, S.; Zhang, H.; Fan, Z.; Liang, D.; Sun, H.; Li, Y.; Zhao, X. Genetic test and early selection in full-sib families of Pinus koraiensis. Scand. J. For. Res. 2021, 36, 221–229. [Google Scholar] [CrossRef]
- Alves, B.M.; Filho, A.C.; Toebe, M.; Burin, C. Linear relations among phenological, morphological, productive and protein-nutritional traits in early maturing and super-early maturing maize genotypes. J. Cereal Sci. 2016, 70, 229–239. [Google Scholar] [CrossRef]
- Filho, A.C.; Toebe, M.; Alves, B.M.; Burin, C.; Wartha, C.A. Linear relations among traits in jack bean (Canavalia ensiformis). Bioagro 2018, 30, 157–162. [Google Scholar]
- Wang, X. Genome-Wide Association Analysis of Quality Traits Based on SNP in Alfalfa. Ph.D. Thesis, Shandong Agricultural University, Taian, China, 2020. [Google Scholar]
- Pan, X. Genome-Wide Association Analysis of Yield Related Traits in Alfalfa. Ph.D. Thesis, Shandong Agricultural University, Taian, China, 2019. [Google Scholar]
- Sudrajat, D.J. Genetic variation of fruit, seed, and seedling characteristics among 11 populations of white jabon in Indonesia. For. Sci. Technol. 2016, 12, 9–15. [Google Scholar] [CrossRef][Green Version]
- Zhang, F.; Chen, C.; Hu, Z.; Lei, G.; Wu, Z. Analysis on the diversity of morphological traits and nutritional contents in bitter gourd germplasm resources. China Agric. Sci. Bull. 2011, 27, 183–188. [Google Scholar]
- Tan, L.; Li, J.; Li, Y.; Wang, H.; Gao, X.; Zhao, J.; Ma, J.; Jin, T.; Wang, H. Analysis of nutritional compositions and evaluation of quality in potentilla anserina L. from Qinghai different producing areas. J. Food Biotechnol. 2022, 41, 95–111. [Google Scholar]
- Chen, X. Forest Breeding; China Forestry Press: Beijing, China, 2005. [Google Scholar]
- Wu, H.; Duan, A.; Zhang, J. Long-term Growth Variation and Selection of Geographical Provenances of Cunninghamia lanceolata (Lamb.) Hook. Forests 2019, 10, 876. [Google Scholar] [CrossRef]
- Santiago, L.S.; Kitajima, K.; Wright, S.J.; Mulkey, S.S. Coordinated changes in photosynthesis, water relations and leaf nutritional traits of canopy trees along a precipitation gradient in lowland tropical forest. Oecologia 2004, 139, 495–502. [Google Scholar] [CrossRef]
- Li, J.; Liu, J.; Zhang, J.; Jian, J.; Li, L.; Li, T. Analysis of factors affecting wheat quality and improvement methods. Agric. Sci. Technol. Commun. 2018, 6, 214–216. [Google Scholar] [CrossRef]
- Gallo, A.; Bertuzzi, T.; Giuberti, G.; Moschini, M.; Bruschi, S.; Cerioli, C.; Masoero, F. New assessment based on the use of principal factor analysis to investigate corn silage quality from nutritional traits, fermentation end products and mycotoxins. J. Sci. Food Agric. 2016, 96, 437–448. [Google Scholar] [CrossRef] [PubMed]
Publisher’s Note: MDPI stays neutral with regard to jurisdictional claims in published maps and institutional affiliations. |
© 2022 by the authors. Licensee MDPI, Basel, Switzerland. This article is an open access article distributed under the terms and conditions of the Creative Commons Attribution (CC BY) license (https://creativecommons.org/licenses/by/4.0/).