Article

Functional Diversity of Plant Communities in Relationship to Leaf and Soil Stoichiometry in Karst Areas of Southwest China

1
Key Laboratory of Plant Resource Conservation and Germplasm Innovation in Mountainous Region (Ministry of Education), College of Life Sciences/Institute of Agro-Bioengineering, Guizhou University, Guiyang 550025, China
2
Institute of Mountain Resources of Guizhou Academy of Sciences, Guiyang 550025, China
*
Author to whom correspondence should be addressed.
Forests 2022, 13(6), 864; https://doi.org/10.3390/f13060864
Submission received: 6 April 2022 / Revised: 14 May 2022 / Accepted: 28 May 2022 / Published: 31 May 2022

Abstract

:
Assessment of relationships between functional diversity and ecological stoichiometry in plant communities can aid in determining the relative variability and ecological complementarity of functional attributes among species, which is a better approach to understanding ecosystem processes and functions than studying species taxonomic diversity. Here, we analyzed the relationships among community weighted means of functional traits, functional diversity, and leaf and soil chemical properties of plant communities during various stages of vegetation restoration in Mao Lan National Karst Forest Nature Reserve, located in humid subtropical Guizhou of China. Our results showed significant changes in four weighted functional traits of plant communities at different restoration stages, namely, plant height, leaf width to leaf length ratio, and leaf area. Additionally, with the progression of the recovery of plant communities, functional richness, functional separation, and quadratic entropy, the coefficient tended to increase. Functional divergence tended to gradually decrease. The association of functional diversity with soil chemical properties was stronger than that with leaf ecological stoichiometry. Regarding leaf and soil chemical properties, soil phosphorus content and leaf C:P were particularly important in influencing functional diversity. Our overall findings indicate that functional traits shift from “acquisitive” to “conservative” as the community is restored. Karst plant communities reduce interspecific resource competition as restoration proceeds, thereby increasing functional overlap effects.

1. Introduction

The relationship between biodiversity and ecosystem function is currently one of the focal issues in the field of ecology [1]. The ecosystem function needs to consider the different functional properties of each species within the community [2]. Functional diversity of plants represents the range of values and variations in functional traits of organisms within communities and ecosystems [3,4] as well as compositions and variations of morphological, physiological, or other traits that influence plant function [5] and highlights differences in functional traits of species within communities [6,7,8]. Species are likely to exhibit significant differences in functional diversity due to variations in their functional traits [3,9]. Therefore, an increasing number of scholars have advocated the study of the diversity of functional traits instead of the taxonomical diversity of plant species [10,11,12]. Thus, the establishment of the relative variability and ecological complementarity of functional attributes among species that have a more direct role in determining ecosystem function is of considerable research interest [9,13,14,15]. It was found, for instance, that the relationship between functional diversity and succession was not significant in wetland ecosystems [16]. Other studies found that functional diversity declined as plant species richness and community mean specific leaf area declined over the course of the succession study, and all of these trends were associated with declining precipitation, indicating that functional diversity is a passenger but not a driver of drought-related plant diversity losses of community change [17] for different succession stages. Relationships between functional diversity index, species diversity, and community types were tightly linked to successional stages. Functional richness decreased with the successional stage, and the genetic characteristics of plant and environmental factors also had significant effects on the functional diversity index [18]. Compared with taxonomic diversity, plant functional diversity considers redundant species and interspecific complementarity in plant communities [3], links plant functional traits to ecosystem functions [19] and can be used in multiple ways plant functional traits describe ecosystem functions [20]. Therefore, plant functional diversity can predict ecosystem function more accurately [21,22,23,24].
Ecological stoichiometry represents the ratios of chemical elements critical for ecological interactions and processes [25]. Plants and soils are interconnected organic units and analysis of their C, N, and P contents and ratios is important for the energy cycle and stability of ecosystems [26]. The karst region in southwest China is one of the most fragile ecological regions of our country, and ecological and environmental problems have become a bottleneck limiting economic and social development in this area [27]. With the rapid development of ecological chemometrics, an increasing number of scholars have focused on different aspects of this technology. Wang et al. [28] and Yang et al. [29] reported the ecological stoichiometric characteristics of soil in different ecosystems of karst while Pi and co-workers [30] analyzed the ecological stoichiometry of leaves of dominant species in karst secondary forests. More recently, Liu et al. [31] examined the C:N:P stoichiometry of leaf–litter–soil continuum in secondary forests of the rocky desertification regions of the karst plateau.
Accumulating recent research suggests that functional traits of plant communities can determine key ecosystem processes and functions [32,33]. A number of studies have focused on species diversity, functional traits, and ecological stoichiometry and their associations in karst forest plant communities [34]. However, the association between functional diversity and ecological stoichiometry at different vegetation restoration stages has not been documented to date. To address this gap in knowledge, in the current study, we examined the influence of ecological stoichiometry and community composition on the functional composition and diversity of plant communities at different restoration stages in the humid subtropical Guizhou Maolan National Karst Forest Nature Reserve via community science surveys and functional trait measurements along with evaluation of functional diversity and leaf and soil chemical properties. We also assessed and compared the relative importance of functional diversity with leaf and soil chemical properties to determine which stoichiometry is more closely related to functional diversity.

2. Materials and Methods

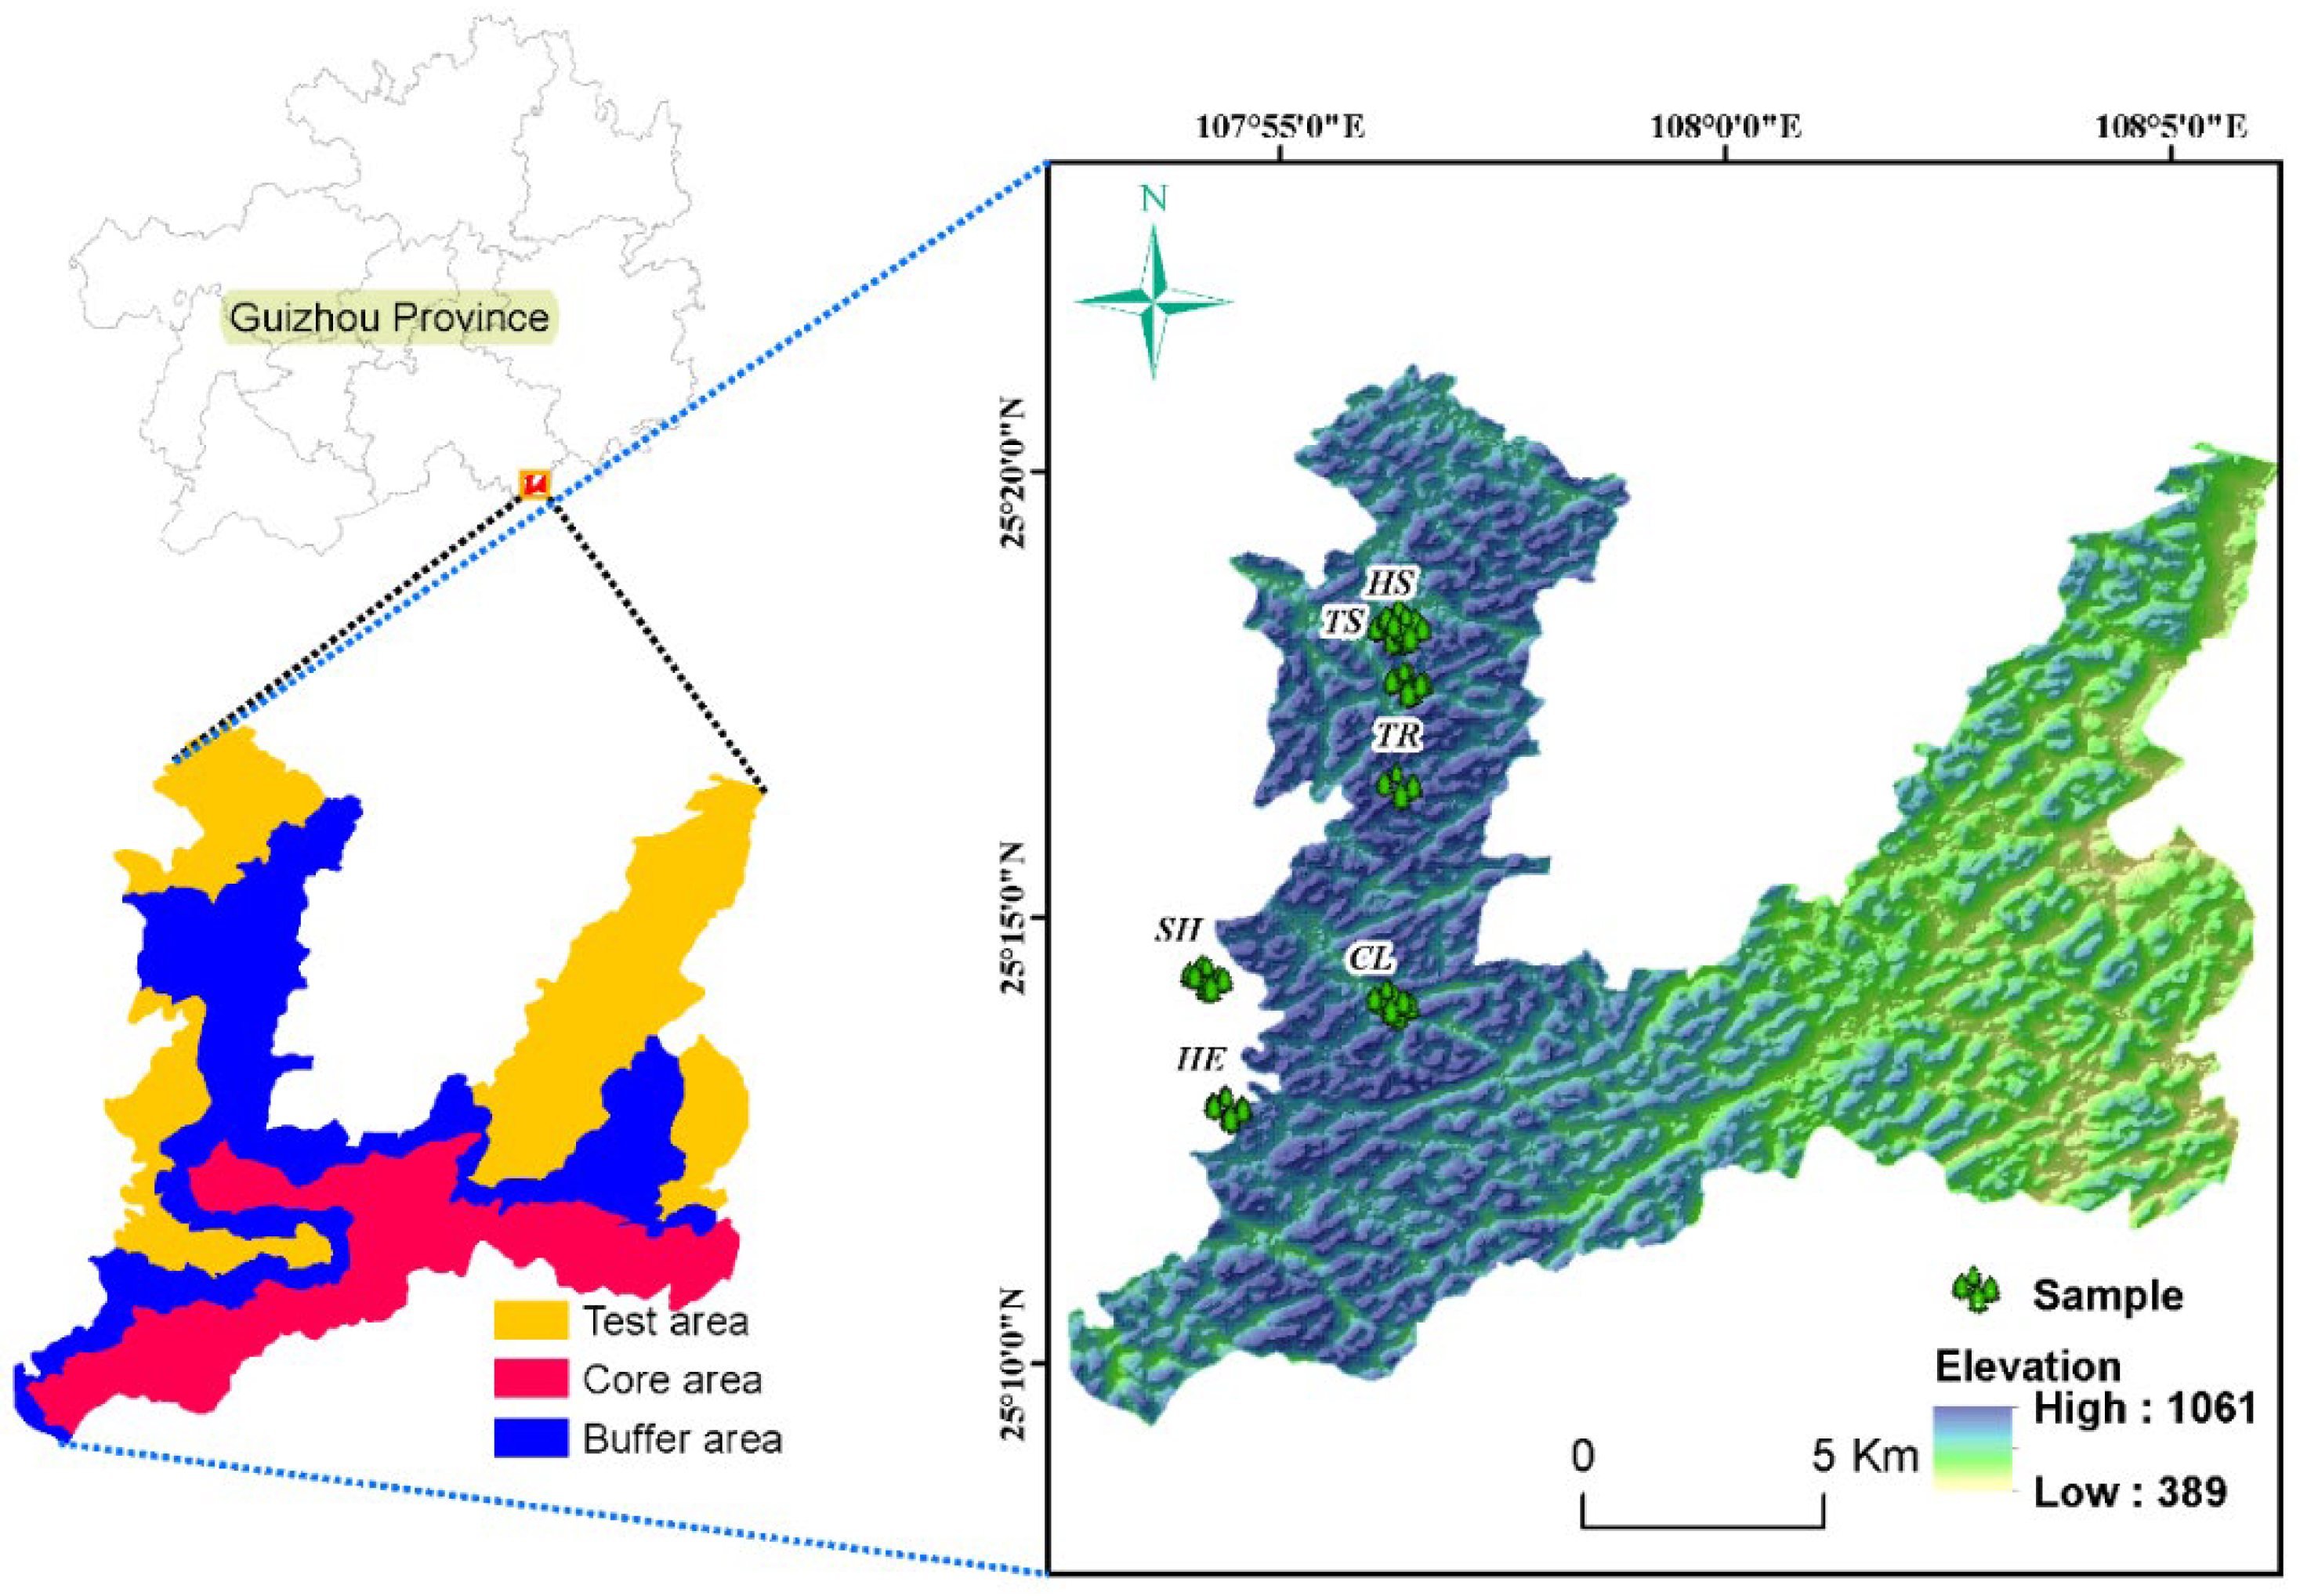
2.1. Overview of the Study Area

Guizhou Maolan National Nature Reserve is located in Libo County, Qiannan Buyi Miao Autonomous Prefecture, Guizhou Province. The geographical location is 107°52′10″–108°45′40″ east longitude and 25°09′20″–25°20′50″ north latitude. In our study area, the HE and SH stages are in the test area, the HS, TS, and TR stages are all in the buffer area, and the CL stage is in the core area (Figure 1). The average annual percentage of sunshine is 29%, growth period is 315 days, annual average relative humidity is 80%, and annual average temperature is 18.3 °C, consistent with the humid central subtropical monsoon climate. The main exposed rocks constituting the karst landscape in the study area are pure limestone and dolomite. The soil is predominantly black limestone with weak alkaline quality (Table 1), but the soil layer is shallow, and cover is discontinuous [35]. The majority of the reserve is a meso-subtropical native karst forest with mixed evergreen deciduous broad-leaved forests. Additionally, successional communities with different degrees of degradation are present, which are highly represented in studies on natural recovery of degraded communities [36].

2.2. Sample Plot, Sample Square Setting and Plant Community Survey

The degradation of karst forests in the study area is considered to be an important cause of disturbance, which is mainly in the form of fire, raising livestock, grazing, and woodcutting. In 1984, there was the establishment of a nature reserve in the area to stop disturbing the plants in the reserve, thus creating a natural recovery [37]. All of our sample sites are in the Maolan Karst Nature Reserve. Due to the different degrees of human disturbance, the succession sequence of plant community is not consistent in the restoration process. The interference is larger in the test area, followed by that in the buffer area and least in the core area. Therefore, the early restoration grassland stage and grass irrigation stage were mainly distributed in the experimental area with large disturbance. In the buffer zone with moderate disturbance, shrub stage, tree stage, and tree stage were distributed. The ultimate phase is mainly distributed in the core region with less disturbance. Previous studies have shown that the method of “space instead of time” [38] can be used to study the plant community at each stage, and the vegetation restoration process in this area can be divided into six stages: herbaceous stage (HE), grass and shrub transition stage (HS), shrub stage (SH), tree and shrub transition stage (TS), tree stage (TR) and ultimate stage (CL). In this study, three sample plots were selected as replicates of each stage, leading to a total of 18 standard plots for analysis. To facilitate the plant survey, small sample squares were set up at each site.
The sample squares in TS, TR, and CL stages were set up in the same way; among them, 9 tree layer small sample squares with an area of 10 m × 10 m were set up. One 4 m × 4 m shrub layer small sample was set in each tree small square. One 1 m × 1 m herbaceous layer small sample square was set in each shrub layer small sample square. Therefore, 9 tree layer samples, 9 shrub layer samples, and 9 herb layer samples can be set up in each stage of TS, TR, and CL. Thus, there are 27 small samples in each stage of TS, TR, and CL. Since there are three replicate sample plots, there are 243 small samples in these three stages of TS, TR, and CL.
The sample plots in the HS and SH stages were set up in the same way; among them, 9 shrub layer mini samples with an area of 4 m × 4 m were set up. One 1 m × 1 m herbaceous sample was set in each shrub layer sample. Thus, 9 shrub subsamples and 9 herb subsamples can be set up in each stage of HS and SH. Thus, there are 18 small sample squares in each stage of HS and SH, and since there are 3 replicate sample plots, there are 108 small sample squares in these two stages of HS and SH.
In the HE stage, 10 small sample squares of 1 m × 1 m were set, and since there were 3 replicate sample plots, there were 30 small sample squares in the HE stage.
Therefore, we surveyed a total of 381 small sample squares in 6 restoration stages. Finally, the names, plant height, diameter at breast height, and crown width of trees and shrubs were recorded, along with the names, plant numbers, average height, and cover of herbaceous plants, to facilitate the determination of weighted functional traits of the community (Table 2).

2.3. Sample Collection and Determination

The method of measurement sampling was divided into two phases. The first phase involved selecting all the plants in the sample square, cutting off the branches of the sampling plant in the four directions of the south, east north, and west of the canopy with high pruning shears, picking about 20 healthy disease-free leaves on each branch, and mixing them into one sample. The second phase was to select plants with the top two importance values (dominant species) in the sample square as the sampling plants and mix each dominant species from each stage into one sample. The importance value of the tree layer was calculated as: (relative abundance + relative frequency + relative dominance based on diameter at breast height)/3, and shrub and grass layers as (relative abundance + relative frequency + relative cover)/3. The “S” method [39] was used in sample plots of each stage to sample the soil from 0 to 20 cm within a small square (less than 20 cm to the actual depth). Soil was sampled from 0 to 20 cm (if <20 cm, the actual depth was determined) and equal volumes mixed into a single sample. We took 5 soil samples from each sample plot in each stage, with 3 replicate plots per stage, so there were 15 soil samples per stage; for the 6 stages, the total consisted of 90 soil samples. Several leaf samples from the first phase, 36 leaf samples from the second phase, and 18 soil samples were collected in total. Plant samples were desiccated at 105 °C for 2 h, followed by incubation at 75 °C until a consistent weight was obtained, while soil samples were air-dried at room temperature. All samples were finely ground, sieved through 60-mesh screen, and stored in a ventilated area for nutrient analysis.

2.4. Functional Trait Selection and Sample Analysis

Six quantitative traits representing functional diversity, including plant height (PLH), leaf thickness (LT), chlorophyll content (CHL), leaf dry matter content (LDMC), leaf area (LA), ratio of leaf length to leaf width (RLW) and specific leaf area (SLA), were selected for analysis. The new global manual for standardized measurement of plant functional traits was utilized [40]. Leaf thickness was measured using electronic vernier calipers (Deli, DL91150, Ningbo Deli Group Limited, Ningbo, China). Leaf length and area were calculated using a scanner in combination with Photoshop software (HP, HPScanJetN92120, Qingdao Lekai Office Culture Supplies Co., Qingdao, China), and chlorophyll content measured using a specific chlorophyll meter (Linde, LD-YD, Shandong Lainde Only Technology Co., Weifang, China). PLH was recorded based on actual measurements in the field and LDMC obtained from the ratio of dried leaf weight to fresh leaf weight. Organic carbon content (SCC) was determined by oxidation with the potassium dichromate external heating method. Plant samples were decocted using the H2SO4-H2O2 method and total nitrogen (LNC) (NY/T2017-2011) and total phosphorus (LPC) (NY/T2017-2011) contents assessed using indophenol blue colorimetric and molybdenum antimony anti-colorimetric procedures. Soils were analyzed via Kjeldahl nitrogen (SNC) (LY/T1228-2015) and NaOH fusion–molybdenum antimony anti-colorimetric method for the determination of total phosphorus (SPC) (LY/T1232-2015) methods. These measurement standards are derived from the Chinese forestry industry standard, which has been cited by some researchers. (http://www.gov.cn/fuwu/bzxxcx/bzh.htm, accessed on 10 July 2021).

2.5. Data Processing and Analysis

2.5.1. Calculation of Community-Weighted Functional Traits

Karst plant community weighted functional traits (CWM) were obtained by weighting the functional trait values and relative abundance of species [41] to obtain average values for each functional trait at the community level [42]. The parameter was calculated using the formula:
CWM = i = 1 s P i × V i
where S represents the number of community species, Pi the relative richness of species i, and Vi the characteristic value of a functional trait of species i.

2.5.2. Functional Diversity Calculation

Five functional diversity indices with three dimensions (functional richness, functional evenness, and functional dispersion) were selected to characterize the functional diversity of communities [43]. Functional richness quantifies the size of community functional niches and reflects the degree of spatial resource utilization by communities, which is characterized by the functional richness index (FRic). Functional evenness indicates the uniformity of spatial distribution of community functional traits, which is expressed by the multidimensional functional evenness index (FEve). Functional dispersion represents the dispersion of community functional trait values and characterizes the degree of interspecific ecological niche complementarity. Functional dispersion consists of functional divergence index (FDiv), functional separation index (FDis) and quadratic entropy coefficient (RaoQ). FDiv functional divergence reflects the overall dispersion of community traits, and the degree of dispersion is inversely related to the strength of interspecific resource competition. FDis functional separation concentrates on the degree of complementarity of plant community niches, and the degree of functional separation in an ecosystem is inversely related to the degree of niches differentiation, and positively related to the effect of overlapping niches and the degree of resource competition [7,43,44,45].
F R i c = S F i c R c
F E v e = i = 1 s 1 min ( P E W i , 1 S 1 ) 1 S 1 1 1 S 1
F D i s =     a j a j   a j  
R a o Q = i = 1 s j = 1 s d i j p i p j
F D i v = 2 π arctan { 5 × i = 1 N [ l n C i l n x ¯ ] 2 × A i }
where SFic represents the ecological niche space occupied by the community, Rc represents the ecological niche space occupied by trait C in the community; S is the species richness, PEWi is the local weighted evenness of species I; aj is the multiplicity of species j, zj is the distance from species j to the weighted center of mass; dij is the Euclidean distance, 0 ≤ dij ≤ 1, indicating the dissimilarity of species i and j in a set of trait spaces; Ci represents the value of the ith functional trait, Ai represents the relative richness of the ith functional trait, and lnx represents the weighted mean of the natural logarithm of the species trait values.
Microsoft Excel 2016 was used to conduct preliminary collation of the data. Before analysis, normality and homogeneity of variance of the data were tested. CWM and functional diversity index were calculated by FD software package in R4.1.2, and SPSS25.0 statistical software was used for data analysis. One-way ANOVA and Tukey HSD were used to compare the differences in weighted functional traits, functional diversity index, leaf and soil nutrient contents, and ecological stoichiometry in different restoration stages. Pearson correlation analysis was used to reveal the interaction between these indicators, and the data expression form was mean ± standard value. In order to further verify the changes in functional diversity and leaf and soil stoichiometry, “WGCNA”, “Corrplot” and “GGplot2” program packages in R4.1.2 were used for network analysis and correlation analysis of functional diversity and ecological stoichiometry. Finally, we scatterplotted two variables that are correlated and then performed a linear correlation analysis of these two variables using Spearman analysis. The essence of this linear correlation analysis is that when one variable changes, the other variable changes correspondingly in approximately the same way, and the two variables are said to be linearly correlated. Linear correlation analysis was used to further reveal which stoichiometry has a greater effect on functional diversity.

3. Results

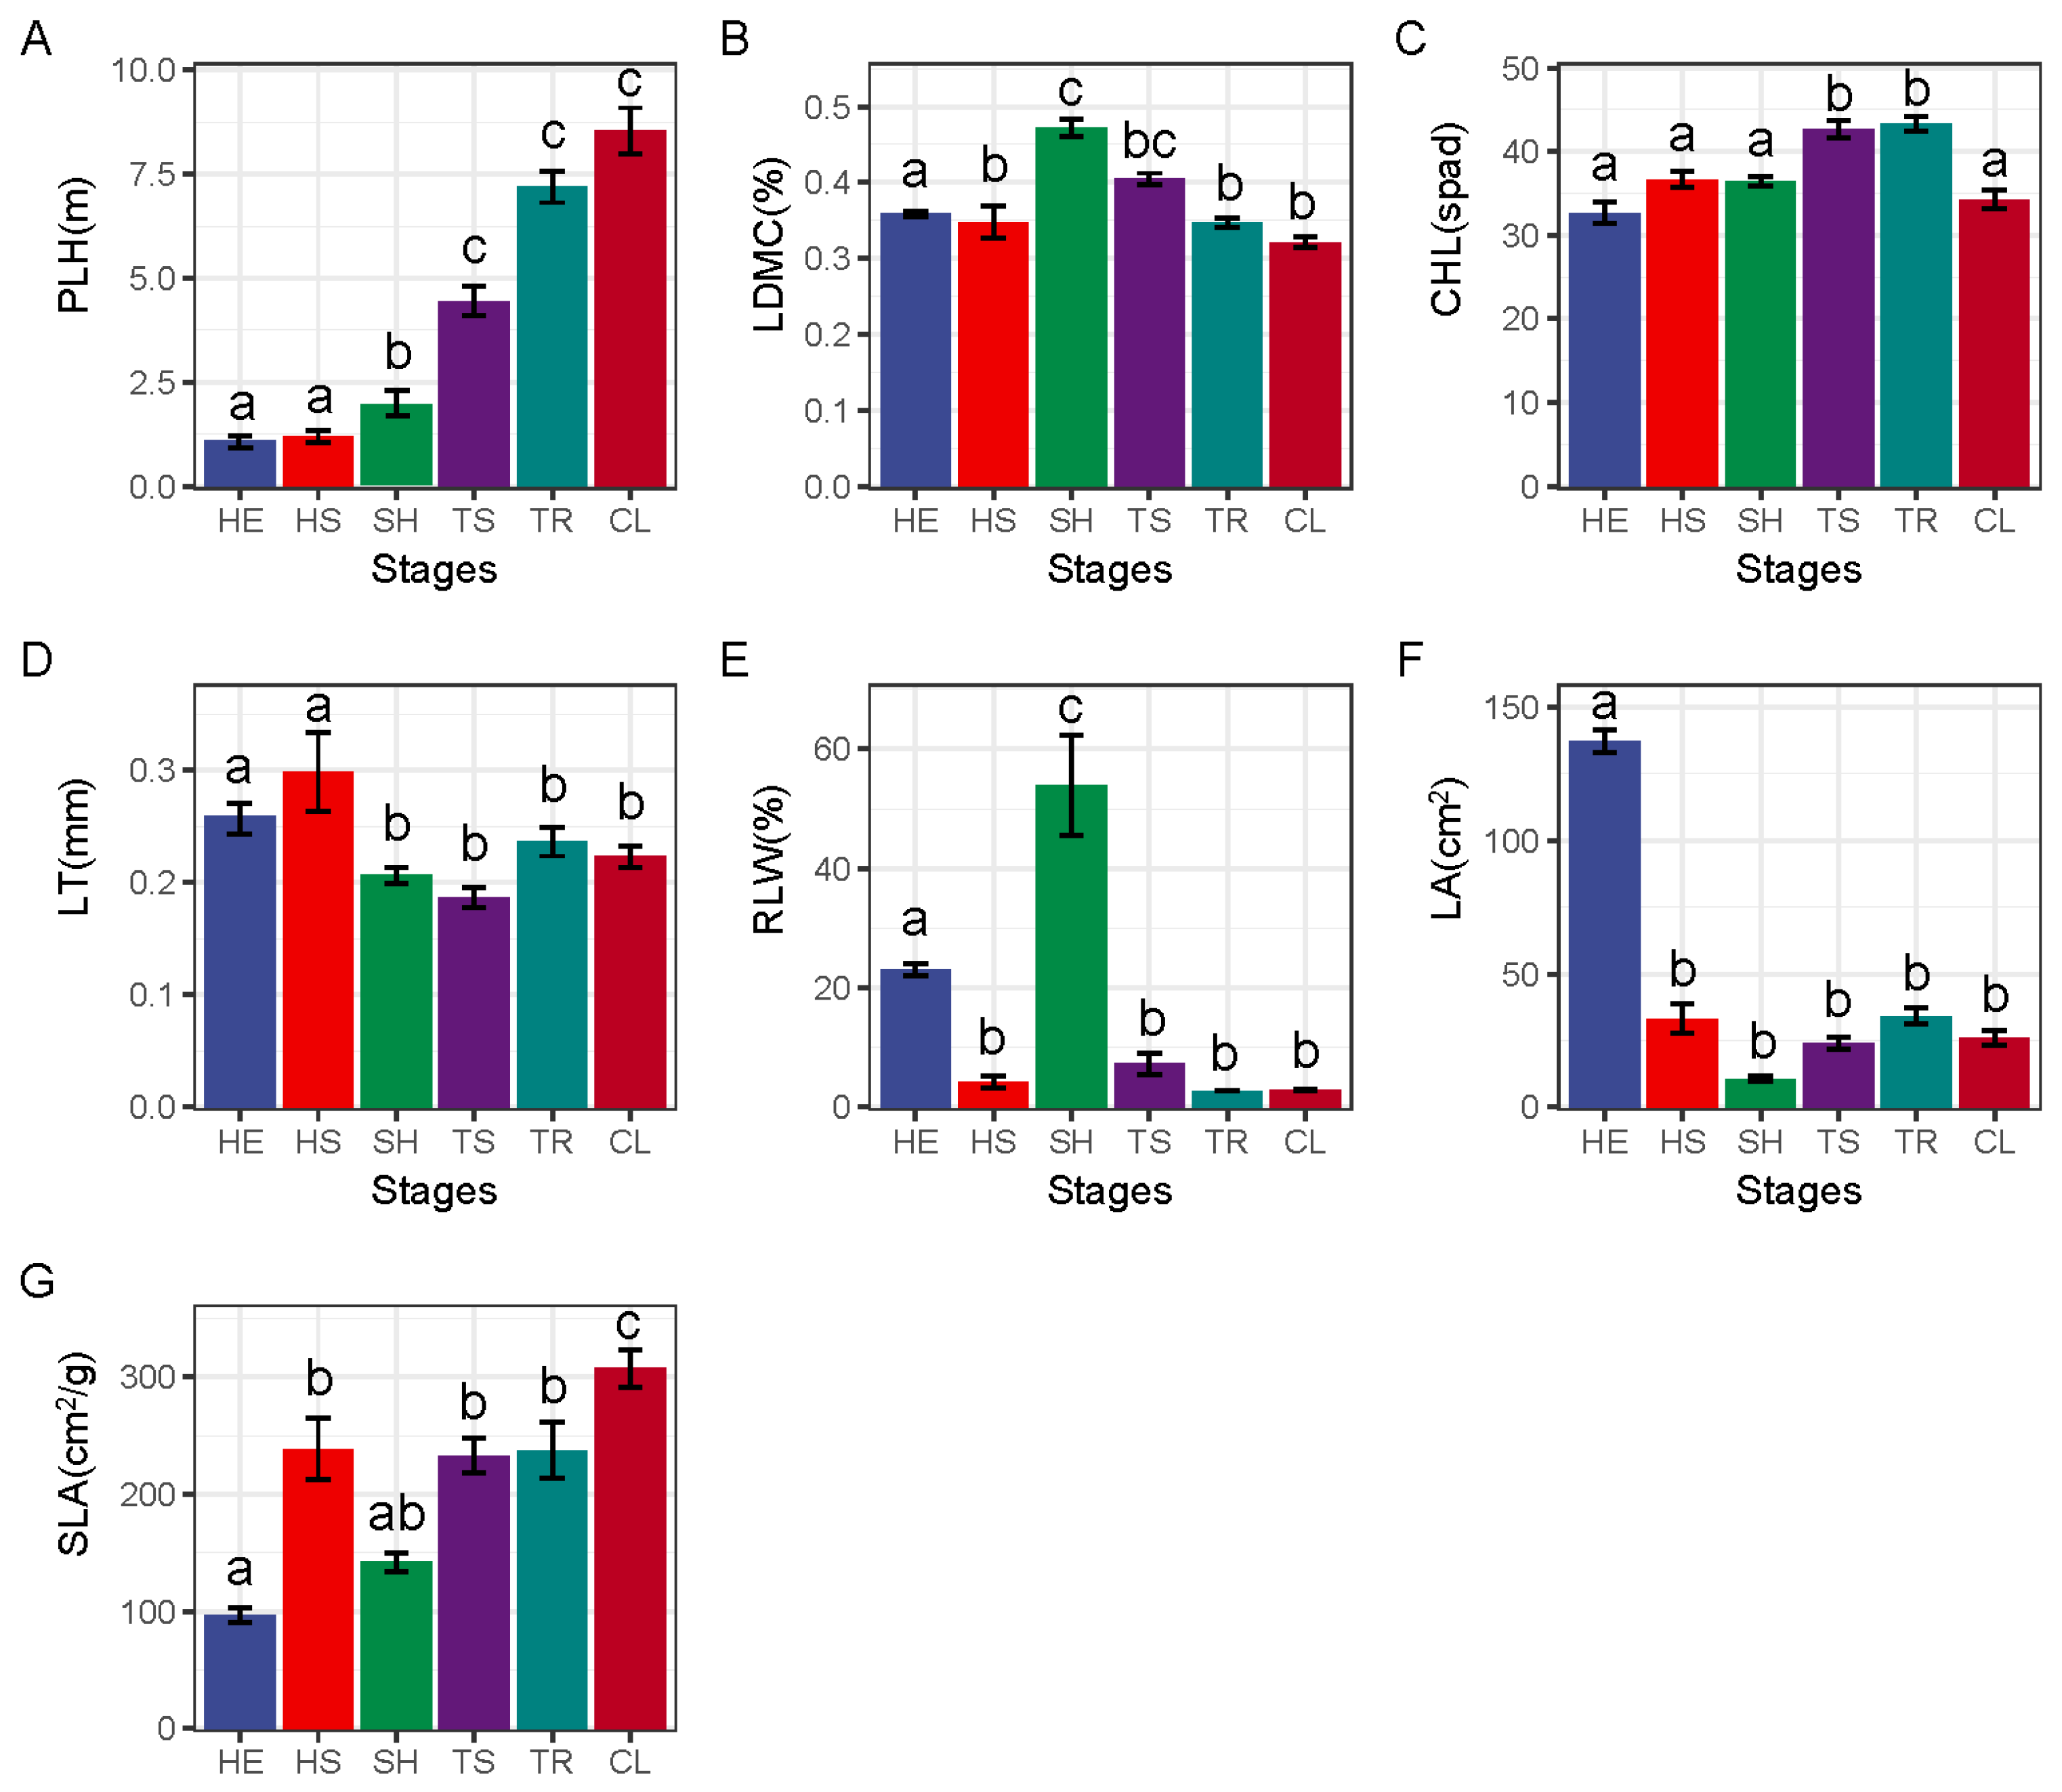
3.1. Weighted Functional Traits of Communities at Different Restoration Stages

As shown in Figure 2, the weighted functional traits of the community changed at different stages with the progress of the restoration. PLH showed an increasing trend and reached the maximum at the ultimate stage, and at the late recovery stage (TS, TR, CL) was significantly higher than that at the SH stage, HS stage, and HE stage. LDMC increased first and then decreased, and the LDMC in the SH stage was significantly higher than that in other stages. There was no significant difference in CHL in HE, HS, SH, and CL stages, while CHL in TS and TR was significantly higher than that in other stages. LT showed a decreasing trend, and LT in HE and HS stages was significantly higher than that in other stages. RLW increased first and then decreased, and reached the maximum at the shrub stage, which was significantly different from other stages. LA was the largest in the grassland stage and significantly higher than that in other stages. SLA changes in a fluctuating pattern. HE stage is significantly lower than other stages, and the CL stage is significantly higher than other stages.

3.2. Functional Diversity of Forest Plant Communities at Different Restoration Stages

As shown in Figure 3, a comparison of functional diversity at different recovery stages showed that FRic and FDis in the ultimate stage tended to increase gradually as recovery proceeded and both FRic (8.20) and FDis (2.35) values at this stage were significantly higher relative to the other stages. FDiv tended to decrease gradually and the FDiv value (0.86) at the herbaceous stage was significantly higher than that recorded during the rest of the stages. We observed no significant differences in FEve among all the stages. RaoQ showed a gradually increasing trend, with a markedly higher value (6.65) at the ultimate stage compared to the remaining stages.

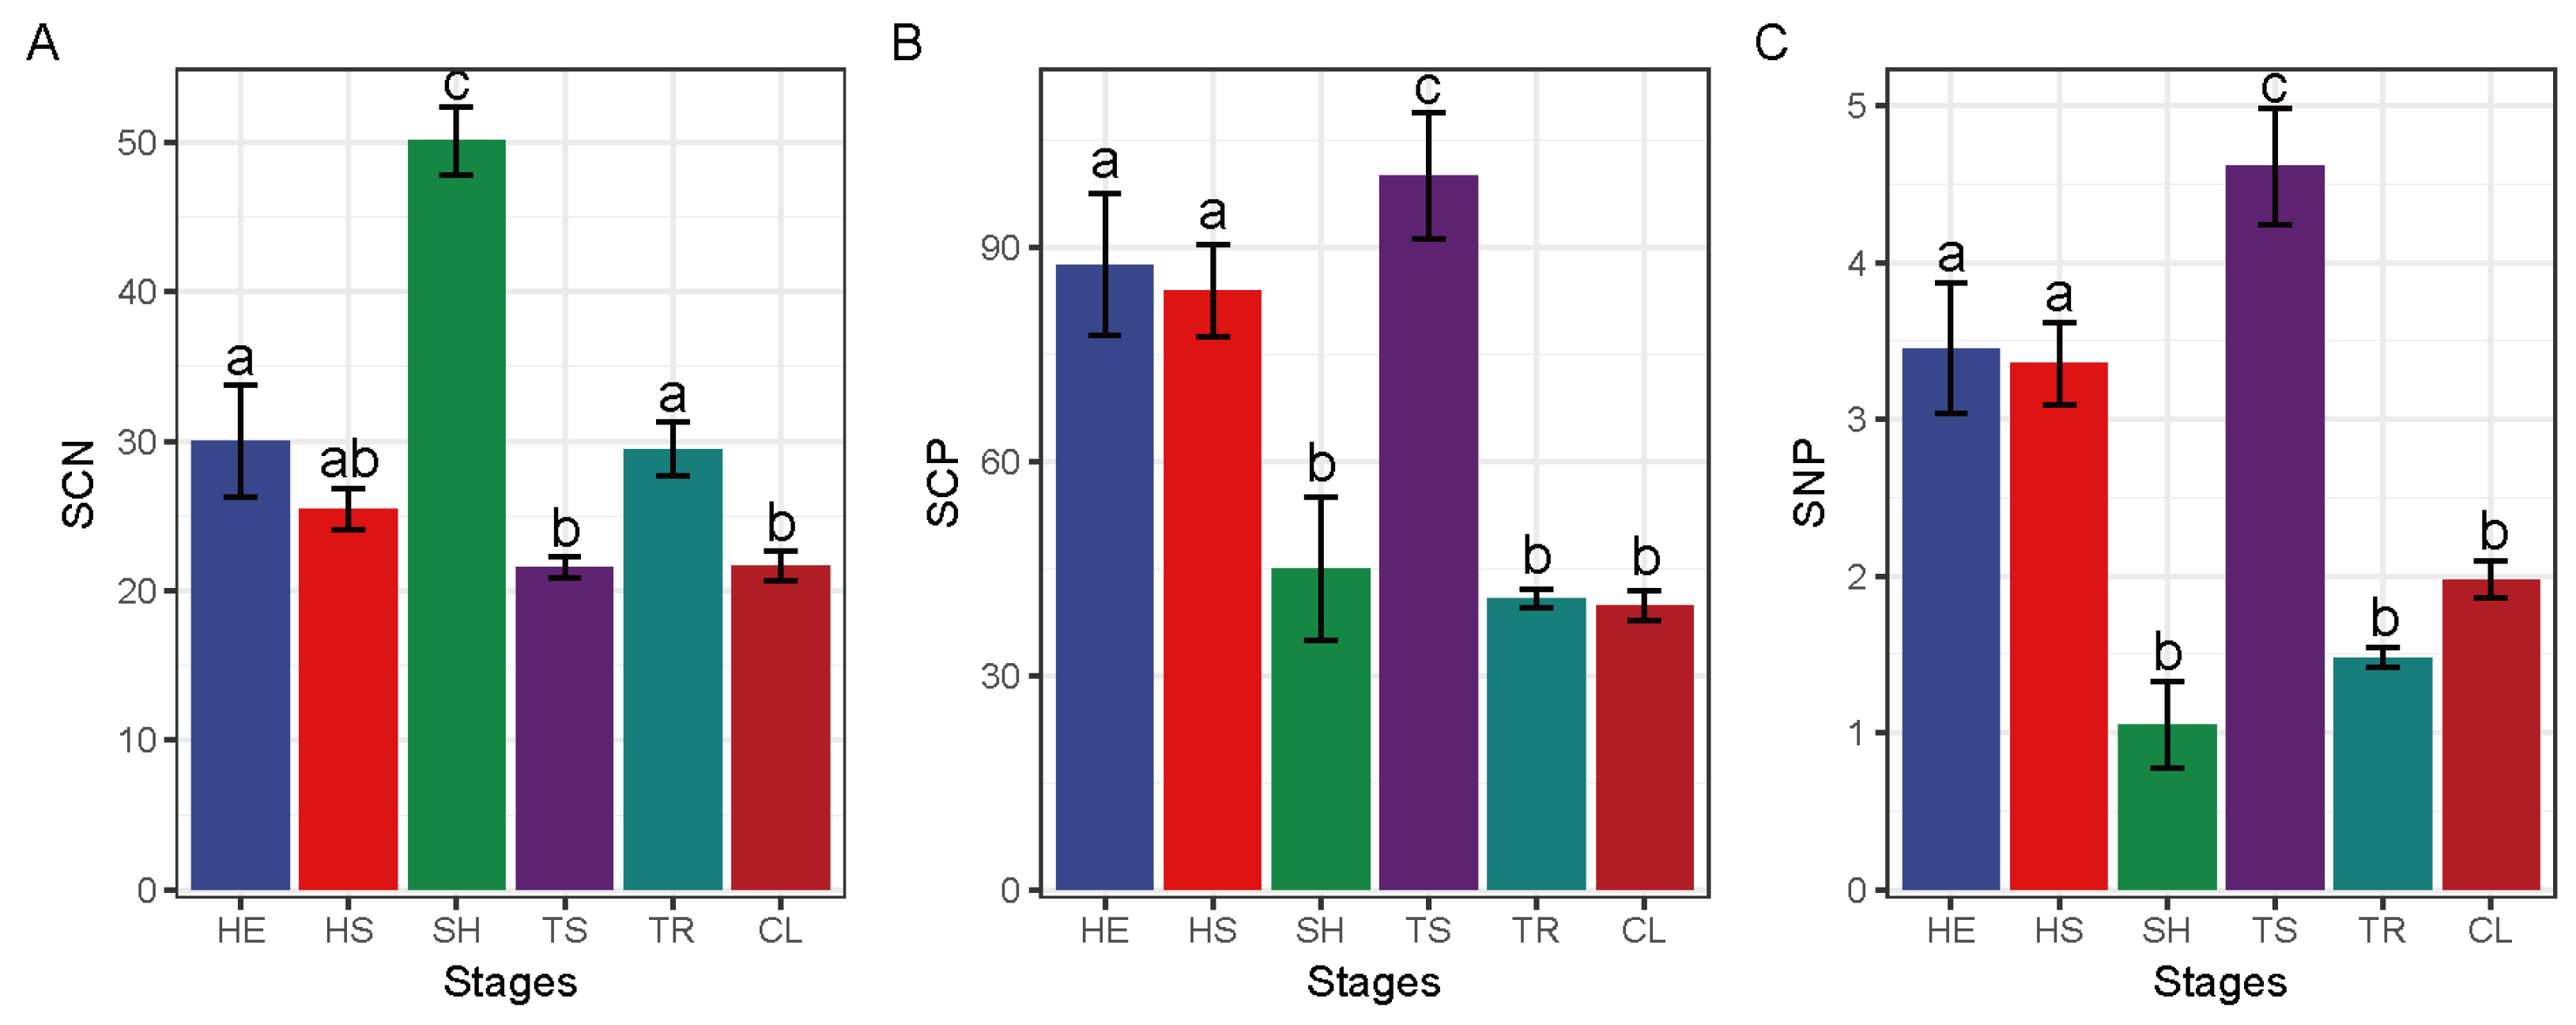
3.3. Changes in Leaf and Soil Nutrient Contents at Different Recovery Stages

As shown in Table 3, soil organic carbon and total nitrogen contents were significantly higher in the TS and CL stages while soil total phosphorus was markedly higher in the CL stage. The highest coefficients of variation of soil C, N, and P were obtained at the HS stage, TS stages. The total nitrogen content in leaves at the HS stage was significantly higher than that at the HE stage, TS stage, and TR stage. There was no significant difference between the SH stage and CL stage. The variation coefficient of leaf carbon content was the highest in the TS stage, while the variation coefficient of leaf nitrogen and phosphorus content was the highest in the SH stage.

3.4. Leaf and Soil Eco-Ecological Stoichiometry Characteristics at Different Restoration Stages

Soil C:N ratio was significantly higher in the shrub stage relative to all the other stages (Figure 4). Maximal soil C:P was obtained in the tree and shrub transition stage, which was markedly higher than that in the shrub, tree, and ultimate stages. Soil N:P was maximum in the Tree and shrub transition stage and the difference relative to its value during the other stages was significant. Leaf C:N reached a maximum value in the tree and shrub transition stage and was significantly higher relative to the grass and shrub transition stage. Leaf C:P was highest in the herbaceous stage to a significant extent compared to grass and shrub transition and tree stages. Maximal leaf N:P value was reached in the ultimate stage, which was significantly higher compared to tree and shrub transition and tree stages.

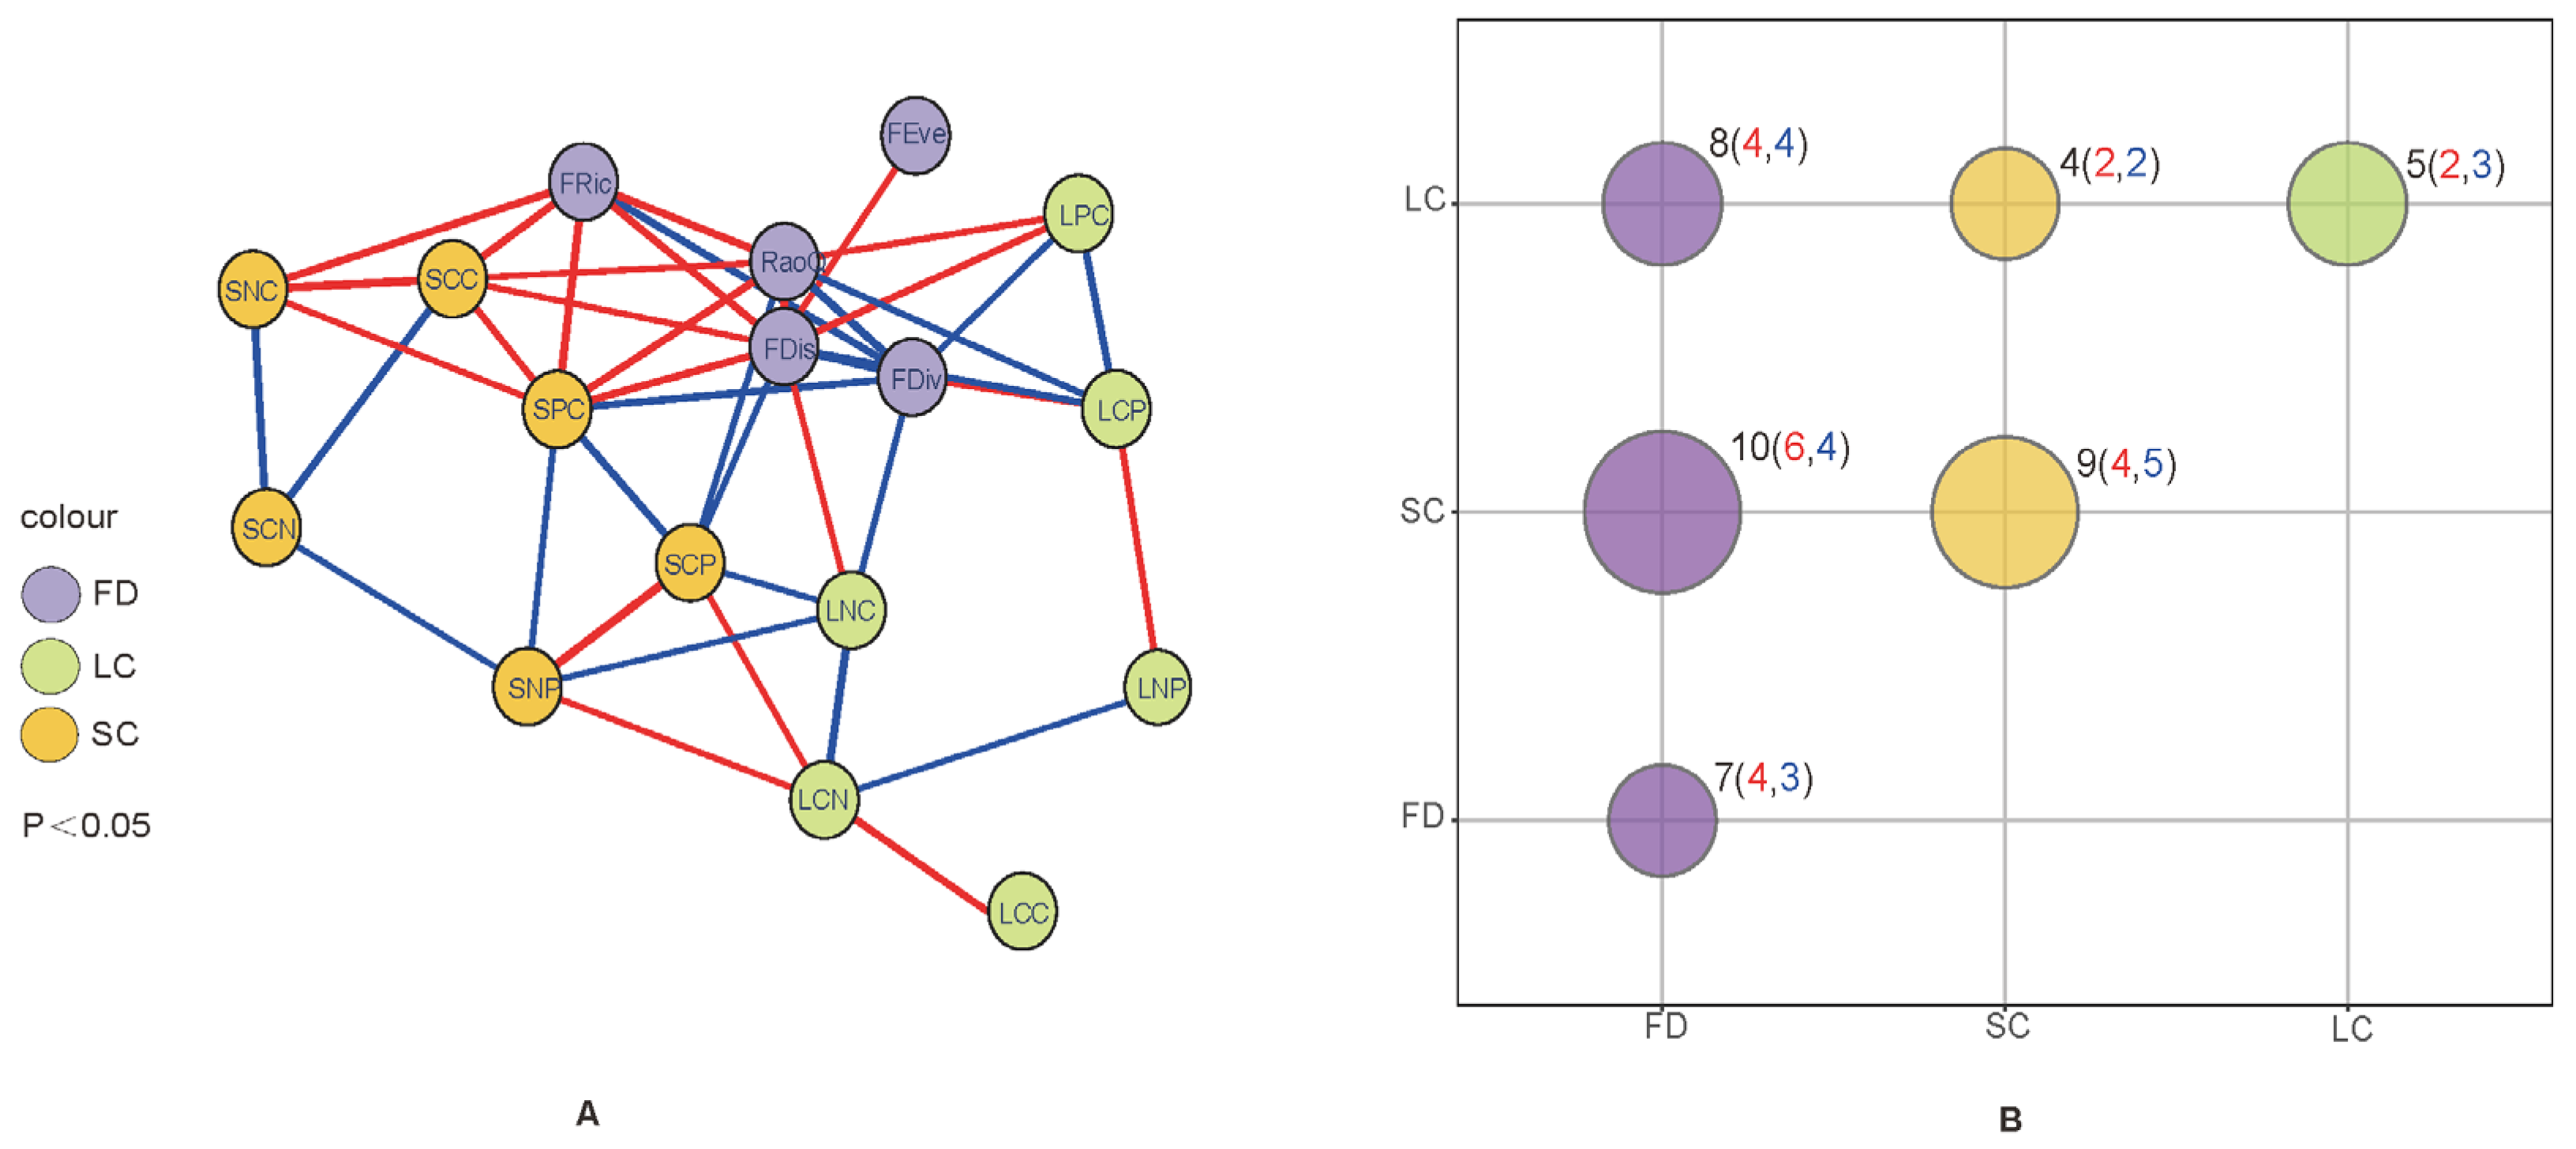
3.5. Network Relationships between the Functional Diversity of Plant Communities and Leaf and Soil Chemical Properties

The correlation network analysis of functional diversity and leaf–soil stoichiometry is presented in Figure 5A. Measurements with p < 0.05 were connected by correlation line segments, with the red lines representing positive correlations and blue lines negative correlations. At the same time, measurements were divided into three major categories, specifically, functional diversity, leaf ecological stoichiometry, and soil chemical properties, and the correlations among these parameters were determined (Figure 5B). The size of the circular bubbles indicates the number of correlation lines between the three major categories and the specific numerical values are labeled. The overall number of correlation line segments was 43. The correlation segments between functional diversity and soil stoichiometry were the most numerous (10 lines, accounting for 23.26%). Eight correlation lines between functional diversity and leaf ecological stoichiometry were observed (accounting for 18.60%). The correlation lines between related measurements were 21 (7 + 9 + 5), accounting for 48.84%. (Related measurement data are data that represent the same type of index composition, for example: SCC, SNC, SPC, SCN, SCP, SNP is a class of data; FEve, FRic, FDiv, FDis, RaoQ is a class of data; LCC, LNC, LPC, LCN, LCP, LNP is a class of data. The data that make up these three broad categories become measurement data because they are obtained in actual measurements or calculations).

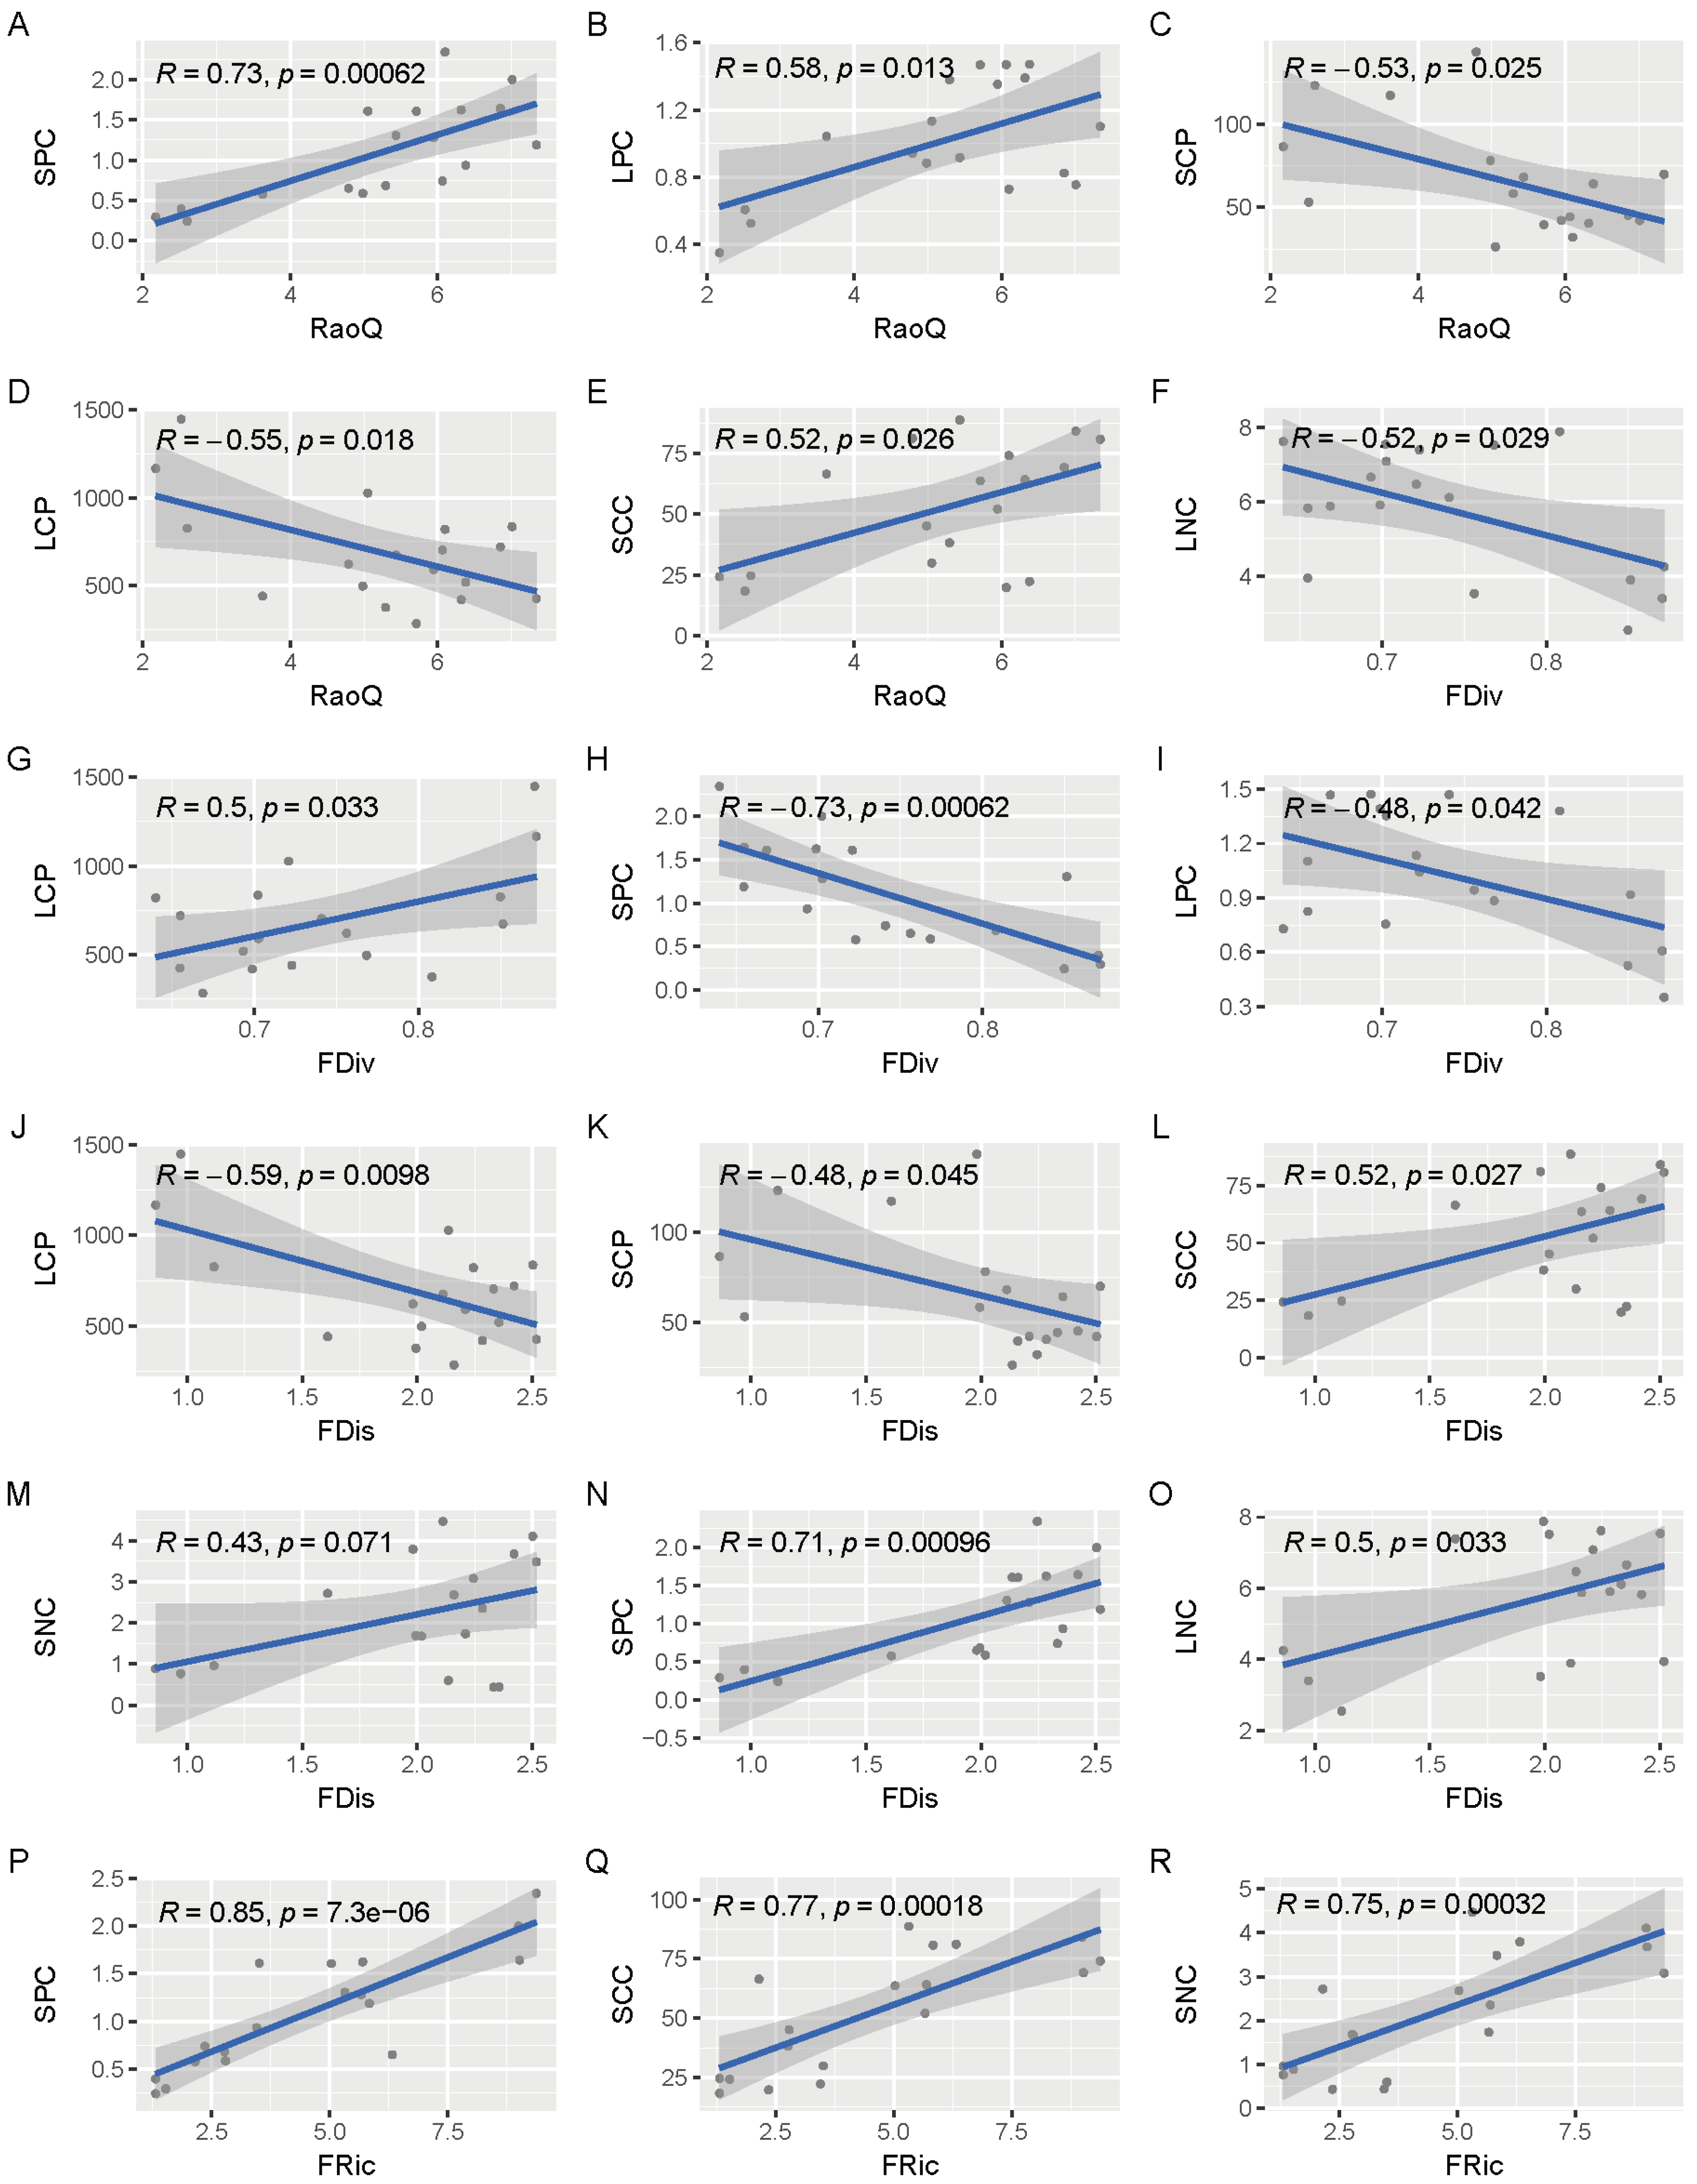
3.6. Correlation Analysis of Functional Diversity of Plant Communities with Leaf and Soil Chemical Properties

The indices composed of functional diversity and leaf and soil chemical properties were further analyzed to determine the correlation between functional diversity and leaf-soil chemical properties, as shown in Figure 6. Linear plots of the correlation between functional diversity and leaf and soil properties in Figure 7. Soil total phosphorus (SPC) content was significantly correlated with quadratic entropy index, functional divergence, functional separation, and functional richness. The functional dispersion index showed the highest correlation with leaf and soil stoichiometry. Six indices RaoQ was significantly negatively correlated with SCP and LCP, significantly positively correlated with SPC, LPC, and SCC, and had the largest positive correlation with SPC and the largest negative correlation with LCP. FDiv was significantly positively correlated with LCP, significantly negatively correlated with LNC, SPC, and LPC, and showed the largest positive correlation with LCP and largest negative correlation with SPC. FDis was significantly negatively correlated with LCP and SCP, significantly positively correlated with SCC, SNC, SPC, and LNC, and showed the largest positive correlation with SPC and largest negative correlation with LCP. FRic was positively correlated with SCC, SNC, and most significantly, SPC.

4. Discussion

4.1. Response of Community-Weighted Functional Traits to Different Recovery Stages

The recovery of plant communities governs the process of species replacement over time [46]. As restoration proceeds, abiotic conditions gradually improve [47] and the environment favors species or traits suitable for survival and maintenance in the community [48], resulting in changes in plant community composition and configuration. Our experiments showed that karst plant communities respond differently to weighted functional traits at each restoration stage (Figure 2). Community restoration was not achieved by actions on each trait but through combined effects of a series of traits. With progressive restoration, PLH gradually increased, and community-weighted functional traits showed a trend of decreasing LA and increasing LDMC, consistent with the trend of functional traits at the species level [49,50,51]. Both LDMC and SLA reached maximal values at the ultimate stage, indicating that with recovery, the environment becomes less stressful to the plant community with increasing soil organic matter and soil moisture during succession [52].

4.2. Changes in Functional Diversity Patterns at Different Restoration Stages

The main objective of studying the changing characteristics of functional diversity at different restoration stages in karst areas is to explore the occupation of ecological niche space by plant communities and the distribution pattern of functional traits in ecological niche space in different restoration stages [44,53]. The functional richness index is generally positively correlated with species richness [54,55], reflecting the occupancy of niche space by existing species. Higher richness is associated with a more fully occupied niche space, productive community, and stable ecosystem function [7]. In our study, the functional richness (FRic) increased gradually during the restoration process (Figure 3A), indicating a progressive increase in the occupation of resources by karst plant communities. Our data suggest that plant communities can make fuller use of ecological space in the later stages of recovery. The functional richness of the ultimate stage was significantly higher than that of the other stages, which mostly comprised shade-tolerant species with low light compensation points, high saturation points, and high drought tolerance. The habitat gradually changed from a drastic heterogeneous environment to a moderate mesophytic environment [56], implying that functional richness has a certain response to habitat changes. Functional evenness measures the distribution of species traits within the occupied trait space and indicates the degree of resource use by the community [57,58] and functional uniformity. When the distribution of community traits is high, the distribution of community traits is more regular and uniform, and the community makes full use of resources. Conversely, low FEve values indicate that species and abundance in the community are in scattered clusters within the trait space [43]. The functional evenness (FEve) estimates in this study (Figure 3B) were not significantly different during the course of restoration, indicating that the efficiency of resource use by plant communities in karst areas did not vary extensively over this time. Functional dispersion reflects the overall dispersion degree of community traits, and the degree of dispersion is inversely related to the strength of interspecific resource competition. This metric is measured by a combination of the degree of community resource variation, degree of competition, and dominance of extreme species in the community, and only has an effect on the weighted average of functional traits, independent of species richness. Higher functional dispersion increases the ecosystem function of communities and leads to more efficient use of resources while lower functional dispersion implies lower differentiation of community niches, underutilization of resources, and intense competition for resources [7,43]. Our data showed significantly higher FDis and RaoQ values in the ultimate stage (CL) compared with the earlier stages (Figure 3D,E), clearly suggesting that the degree of ecological niche differentiation gradually decreased and the intensity of resource competition weakened as restoration proceeded. The degree of functional separation in an ecosystem is inversely proportional to the degree of niche differentiation and positively proportional to the effect of niche overlap and the degree of resource competition [59]. In the current study, FDiv showed a gradual decrease, with a markedly lower value in the ultimate stage relative to earlier stages (Figure 3C). Accordingly, we propose that during the restoration of karst plant communities, habitat resources are gradually enriched, and species types increase while the degree of ecological niche differentiation decreases over time. Simultaneously, the interspecific resource competition of plant communities gradually decreases, the ecological niche overlap increases, the functional representation of species in the community decreases, and the functional redundancy increases. Although our metrics do not define functional redundancy, FDiv can represent functional overlap. When FDiv decreases, the overlap effect between functions increases. The more functions overlap, the more redundancy exists. As a result, functional redundancy increases.

4.3. Response of Community Functional Diversity to Leaf and Soil Chemical Properties

Exploration of the relationship between functional diversity of plant communities and ecological stoichiometry of leaf and soil can provide information on the correlation between ecological niche differences of functional attributes in ecosystems and plant and soil nutrients. In this study, soil C, N, and P contents gradually increased with recovery progress while leaf C, N, and P showed a trend of increase followed by a decrease (Table 3), indicating that karst areas maintain the rise of plant communities by improving soil nutrient content in the process of positive recovery. In addition, both leaf C:N and C:P were greater than global levels [60] (C:N = 22, C:P = 232) (Figure 4), suggesting that the karst plant communities are less efficient in utilizing N and P [61]. The soil C:N value showed an increase and subsequent decrease as restoration proceeded, indicating a higher rate of organic matter mineralization [62]. Soil C:P was significantly lower than the national level [63] (C:P = 136), signifying a lack of P content available for uptake in the study area.
Our experiments showed that functional diversity was correlated to a greater extent with soil chemical properties than leaf ecological stoichiometry (Figure 5). RaoQ, FDiv, FDis, and FRic levels were highly correlated with soil phosphorus content (SPC) and leaf C: P (LCP) (Figure 6 and Figure 7). Soil P content is mainly controlled by the weathering stage of soil-forming parent material [63], which, in turn, is influenced by a combination of different climates, topography, vegetation, microorganisms, and human activities. The study area is developed from a typical karst landscape with a shallow soil surface under a humid climate, where precipitation reduces the P content in the soil through surface runoff and leaching. The significance of plant C:P can be summarized into two aspects: (1) to characterize the efficiency of plant P uptake and C assimilation [64] and (2) to reflect the availability of soil P. In addition, the correlation between soil chemical properties and functional diversity was stronger than that of leaf ecological stoichiometry. The possible reasons underlying this finding are as follows: first, ecological stoichiometry characteristics of soils are influenced by species, restoration stage, and habitat [65] and functional diversity represents the magnitude and range of functional traits while soil moisture, total N content, bulk weight, and organic matter play major roles in functional trait alterations during restoration [52]. Second, plant communities were affected by habitat heterogeneity during restoration and soil C, N, and P contents were low in the early recovery period. Plants occupied ecological space through intense resource competition and ecological niches were severely differentiated, showing efficient use of P elements. The C:P content in this study (689) was significantly higher than the global average (232) [60], suggesting higher utilization of plant P within the study area [66]. The relative scarcity of nutrient elements in soil samples from the karst region has been documented, indicating that nutrient utilization can be improved when soil nutrient elements are scarce as a survival strategy for plants to adapt to nutrient-poor conditions [67]. Therefore, the P required for plant growth and development is more scarce, which may be one of the reasons for the higher P utilization efficiency of plants in this region. Overall, as restoration proceeds, the habitat gradually turns homogeneous and the plant community predominantly shows a decrease in ecological niche differentiation, stronger functional overlap effect, and an increase in functional redundancy.

5. Conclusions

Our collective findings demonstrate that leaf and soil chemical properties and functional diversity interact through a complex network. As the functional traits of plant communities shift from “acquisitive” to “conservative” [52], functional diversity adapts through changes in the level of ecological niche differentiation. Karst plant communities evolve to reduce interspecific resource competition with progressive restoration, thereby increasing the functional overlap effect.

Author Contributions

Conceptualization, Y.W. and L.Y.; methodology, Y.W. and L.Y.; software, Y.W. and J.C.; validation, L.Z., L.F. and F.L.; formal analysis, Y.W.; investigation, Y.W., L.Z., L.F. and F.L.; resources, L.Y.; data curation, L.Y.; writing—original draft preparation, Y.W.; writing—review and editing, Y.W., L.Z. and J.C.; visualization, Y.W.; supervision, L.F.; project administration, L.Y.; funding acquisition, L.Y. All authors have read and agreed to the published version of the manuscript.

Funding

This research was funded by the Project of National Key Research and Development Program of China (2016YFC0502604), the Major Project of Guizhou Province (Qian Ke He Major Project [2016]3022), and the Construction Program of Biology First-class Discipline in Guizhou (GNYL [2017]009), and the Project of Promoted Innovation for Colleges and Universities of Guizhou Province (Qian Jiao He Collaborative Innovation [2014]01).

Institutional Review Board Statement

Not applicable.

Informed Consent Statement

Not applicable.

Data Availability Statement

Not applicable.

Conflicts of Interest

The authors declare no conflict of interest.

References

  1. Li, R.X.; Ding, Y.; Ma, W.J.; Niu, J.M.; Zhang, Q. Research advances in plant functional diversity and its relationship with ecosystem functions. Ecol. Environ. Sci. 2016, 25, 1069–1075. [Google Scholar]
  2. Biswas, S.; Mallik, A.U.; Braithwaite, N.T.; Biswas, P.L. Effects of disturbance type and microhabitat on species and functional diversity relationship in stream-bank plant communities. For. Ecol. Manag. 2019, 432, 812–822. [Google Scholar] [CrossRef]
  3. Díaz, S.; Cabido, M. Vive la difference: Plant functional diversity matters to ecosystem processes. Trends Ecol. Evol. 2001, 16, 646–655. [Google Scholar] [CrossRef]
  4. Diaz, S.; Lavorel, S.; de Bello, F.; Quetier, F.; Grigulis, K.; Robson, T.M. Incorporating plant functional diversity effects in ecosystem service assessments. Proc. Natl. Acad. Sci. USA 2007, 104, 20684–20689. [Google Scholar] [CrossRef] [PubMed] [Green Version]
  5. Hillebrand, H.; Matthiessen, B. Biodiversity in a complex world: Consolidation and progress in functional biodiversity research. Ecol. Lett. 2009, 12, 1405–1419. [Google Scholar] [CrossRef]
  6. Tilman, D.; Reich, P.B.; Knops, J.; Wedin, D.; Mielke, T.; Lehman, C. Diversity and productivity in a long-term grassland experiment. Science 2001, 294, 843–845. [Google Scholar] [CrossRef] [Green Version]
  7. Petchey, O.L.; Gaston, K.J. Functional Diversity(FD), species richness and community composition. Ecol. Lett. 2002, 5, 402–411. [Google Scholar] [CrossRef]
  8. Zhang, J.T.; Fan, L.H. Functional diversity of species and its research methods. J. Mt. Sci. 2011, 29, 513–519. [Google Scholar]
  9. Lepě, J.; De, B.F.; Lavorel, S. Quantifying and interpreting functional diversity of natural communities: Practical considerrations matter. Preslia 2006, 27, 1254–1261. [Google Scholar]
  10. Mcgill, B.J.; Enquist, B.J.; Weiher, E.; Westoby, M. Rebuilding community ecology from functional traits. Trends Ecol. Evol. 2006, 21, 178–185. [Google Scholar] [CrossRef]
  11. Wiegand, T.; Uriate, M.; Kraft, N.J.B.; Shen, G.C.; Wang, X.G.; He, F.L. Spatially explicit metrics of species diversity, functional diversity, and phylogenetic diversity: Insights into plant community assembly processes. Annu. Rev. Ecol. Evol. 2017, 48, 329–351. [Google Scholar] [CrossRef] [Green Version]
  12. Khalil, M.I.; Gibson, D.J.; Baer, S.G.; Willand, J.E. Functional diversity is more sensitive to biotic filters than phylogenetic diversity during community assembly. Ecosphere 2018, 9, e2164. [Google Scholar] [CrossRef]
  13. Tilman, D.; Knops, J.; Wedin, D.; Reich, P.; Ritchie, M.; Siemann, E. The influence of functional diversity and composition on ecosystem processes. Science 1997, 277, 1300–1302. [Google Scholar] [CrossRef] [Green Version]
  14. Tilman, D. Causes, consequences and ethics of biodiversity. Nature 2000, 405, 208–211. [Google Scholar] [CrossRef] [PubMed]
  15. Loreau, M.; Naeem, S.; Inchausti, P.; Bengtsson, J.; Grime, J.P.; Hector, A.; Hooper, D.U.; Huston, M.A.; Raffaelli, D.; Schmid, B.; et al. Biodiversity and ecosystem functioning: Current knowledge and future challenges. Science 2001, 294, 804–808. [Google Scholar] [CrossRef] [PubMed] [Green Version]
  16. Marcin, K.D.; Natalia, C.; Mateusz, Z.; Jaroslaw, T.; Andrzej, M.J. Functional diversity, succession, and human-mediated disturbances in raised bog vegetation. Sci. Total Environ. 2016, 562, 648–657. [Google Scholar]
  17. Jesse, E.D.M.; Dai, J.L.; Marina, L.F.; Susan, H. Functional diversity is a passenger but not driver of drought related plant diversity losses in annual grasslands. J. Ecol. 2019, 107, 2033–2039. [Google Scholar]
  18. Yao, X.Y.; Hu, Y.S.; Liu, Y.H. Plant functional traits and functional diversities of different communities in broad-leaved Korean pine forests in the Changbai Mountain. Nat. Sci. Ed. 2014, 3, 77–84. [Google Scholar]
  19. Petchey, O.L.; Gaston, K.J. Functional diversity: Back to basics and looking forward. Ecol. Lett. 2006, 9, 741–758. [Google Scholar] [CrossRef]
  20. Schleuter, D.; Daufresne, M.; Massol, F.; Argillier, C. A user’s guide to functional diversity indices. Ecol. Monogr. 2010, 80, 469–484. [Google Scholar] [CrossRef] [Green Version]
  21. Hulot, F.D.; Lacroix, G.; Lescher-Moutoué, F.; Loreau, M. Functional diversity governs ecosystem response to nutrient enrichment. Nature 2000, 405, 340–344. [Google Scholar] [CrossRef] [PubMed]
  22. Heemsbergen, D.A.; Berg, M.P.; Loreau, M.; van Hal, J.R.; Faber, J.H.; Verhoef, H.A. Biodiversity effects on soil processes explained by interspecific functional dissimilarity. Science 2004, 306, 1019–1020. [Google Scholar] [CrossRef] [PubMed] [Green Version]
  23. Mokany, K.; Ash, J.; Roxburgh, S. Functional identity is more important than diversity in influencing ecosystem processes in a temperate native grassland. J. Ecol. 2008, 96, 884–893. [Google Scholar] [CrossRef]
  24. Milcu, A.; Roscher, C.; Gessler, A.; Bachmann, D.; Gockele, A.; Guderle, M.; Landais, D.; Piel, C.; Escape, C.; Devidal, S.; et al. Functional diversity of leaf nitrogen concentrations drives grassland carbon fluxes. Ecol. Lett. 2014, 17, 435–444. [Google Scholar] [CrossRef]
  25. He, J.S.; Han, X.G. Ecological stoichiometry: Searching for unifying principle from individuals to ecosystems. Chin. J. Plan Ecol. 2010, 34, 2–6. [Google Scholar]
  26. Elser, J.J.; Fagan, W.F.; Kerkhoff, A.J.; Swenson, N.G.; Enquist, B.J. Biological stoichiometry of plant production: Metabolism, scaling and ecological response to global change. New Phytol. 2010, 186, 593–608. [Google Scholar] [CrossRef] [Green Version]
  27. Wang, S.J. An outline of karst geomorphology zoning in the karst areas of Southern China. Mt. Res. 2003, 33, 120–126. [Google Scholar]
  28. Wang, L.J.; Wang, P.; Sheng, M.Y. Stoichiometry characteristics of soil nutrient elements and its influencing factors in typical in karst rocky desertification ecosystems, Southwest China. Acta Ecol. Sin. 2018, 38, 6580–6593. [Google Scholar]
  29. Yang, D.L.; Yu, Y.H.; Qin, S.Y.; Zhong, X.P. Contents and ecological stoichiometry characteristics of soil nutrients under different land utilization types in stony desertification area. Southwest Chin. J. Agric. Sci. 2018, 31, 1875–1881. [Google Scholar]
  30. Pi, F.J.; Yuan, C.J.; Yu, L.F.; Yan, L.B.; Wu, L.; Yang, R. Ecological stoichiometry characteristics of plant leaves from the main dominant species of natural secondary forest in the Central of Guizhou. Ecol. Environ. Sci. 2016, 25, 801–807. [Google Scholar]
  31. Liu, N.; Yu, L.F.; Zhao, Q.; Wu, Y.N.; Yan, L.B. C: N: P stoichiometry of leaf-litter-soil continuum in secondary forests of the rocky desertification regions of the karst plateau. Chin. J. Appl. Environ. Biol. 2020, 26, 681–688. [Google Scholar]
  32. Vannoppen, W.; Vanmaercke, M.; De Baets, S.; Poesen, J. A review of the mechanical effects of plant roots on concentrated flow erosion rates. Earth Sci. Rev. 2015, 150, 666–678. [Google Scholar] [CrossRef] [Green Version]
  33. Ali, A.; Yan, E.R.; Chang, S.X.; Cheng, J.Y.; Liu, X.Y. Community-weighted mean of leaf traits and divergence of wood traits predict aboveground biomass in secondary subtropical forests. Sci. Total Environ. 2017, 574, 654–662. [Google Scholar] [CrossRef]
  34. Yu, Y.H.; Zhong, X.P.; Zheng, W.; Chen, Z.X.; Wang, J.X. Species diversity, functional traits, stoichiometry and correlation of plant communities in different succession stages of karst forest. Acta Ecol. Sin. 2021, 41, 2408–2417. [Google Scholar]
  35. Zhu, S.Q. Study on Karst Forest Ecology-III; Guizhou Science and Technology Press: Guiyang, China, 2003; pp. 25–122. [Google Scholar]
  36. Yu, L.F.; Zhu, S.Q.; Ye, J.C.; Wei, L.M.; Chen, Z.R. Evaluation of natural restoration of degraded karst forest. Sci. Silvae Sin. 2000, 36, 12–19. [Google Scholar]
  37. Zhang, Z.H.; Hu, G.; Ni, J. Effects of Topographical and Edaphic Factors on the Distribution of Plant Communities in two Subtropical Karst Forests, Southwestern China. J. Mt. Sci. 2013, 10, 95–104. [Google Scholar] [CrossRef]
  38. An, M.T. Studies on Maintenance Mechanism of Plant Species Diversity and Soil Moisture and Nutrient Pattern in Karst Forest. Ph.D. Thesis, Guizhou University, Guiyang, China, 2019. [Google Scholar]
  39. Li, Y.K. Methods for Conventional Analysis of Soil Agrochemistry; Science Press: Beijing, China, 1989; pp. 1–195. [Google Scholar]
  40. Pérezharguindeguy, N.; Díaz, S.; Garnier, E. New handbook for standardised measurement of plant functional traits worldwide. Aust. J. Bot. 2013, 61, 167–234. [Google Scholar] [CrossRef]
  41. Lavorel, S.; Grigulis, K.; Mcintyre, S.; Williams, N.S.G.; Garden, D.; Dorrough, J.; Berman, S.; Quétier, F.; Thébault, A.; Bonis, A. Assessing functional diversity in the field-methodology matters. Funct. Ecol. 2008, 22, 134–147. [Google Scholar] [CrossRef]
  42. Zhang, Z.K.; Wu, Y.H.; Wang, Q.; Ji, L.B.; Huang, L.J. Effects of environmental factors on stem and leaf functional traits of Island plants. Guihaia 2020, 40, 433–442. [Google Scholar]
  43. Mason, N.W.H.; Mouillot, D.; Lee, W.G.; Wilson, J.B. Functional richness, functional evenness and functional divergence: The primary components of functional diversity. Oikos 2005, 111, 112–118. [Google Scholar] [CrossRef]
  44. Mouchet, M.A.; Villéger, S.; Mason, N.W.H.; Mouillot, D. Functional diversity measures: An overview of their redundancy and their ability to discriminate community assembly rules. Funct. Ecol. 2010, 4, 867–876. [Google Scholar] [CrossRef]
  45. Jiang, X.L.; Zhang, W.G. Functional diversity and its research methods. Acta Ecol. Sin. 2010, 30, 2766–2773. [Google Scholar]
  46. Prach, K.; Walker, L.R. Four opportunities for studies of ecological succession. Trends Ecol. Evol. 2011, 26, 119–123. [Google Scholar] [CrossRef] [PubMed]
  47. Buma, B.; Bisbing, S.; Krapek, J.; Wright, G.A. Foundation of ecology rediscovered: 100 years of succession on the William S. Cooper plots in Glacier Bay, Alaska. Ecology 2017, 6, 1513–1523. [Google Scholar] [CrossRef] [PubMed] [Green Version]
  48. Keddy, P.A. Assembly and Response Rules: Two Goals for Predictive Community Ecology. J. Veg. Sci. 1992, 3, 157–164. [Google Scholar] [CrossRef] [Green Version]
  49. Xi, X.Q.; Zhao, Y.J.; Liu, Y.G.; Wang, X.; Gao, X.M. Variation and correlation of plant functional traits in karst area of central Guizhou Province. Chin. J. Plant Ecol. 2011, 35, 1000–1008. [Google Scholar] [CrossRef]
  50. Liu, H.W.; Liu, W.D.; Wang, W.; Chai, J.; Tao, J.P. Leaf traits and nutrient resorption of major woody species in the karst limestone area of Chongqing. Acta Ecol. Sin. 2015, 35, 4071–4080. [Google Scholar]
  51. Jiang, Y.; Chen, X.B.; Ma, J.M.; Liang, S.C.; Huang, J. Interspecific and intraspecific variation in functional traits of subtropical evergreen and deciduous broadleaved mixed forests in karst topography, Guilin, Southwest China. Trop. Conserv. Sci. 2016, 9, 1–9. [Google Scholar] [CrossRef] [Green Version]
  52. Li, Y.J.; Zheng, J.M.; Wang, G.Z.; Zhou, J.X.; Liu, Y.G.; Ha, W.X. A Study of Functional Traits of Natural Secondary Forests and Their Influencing Factors in Different Restoration Stages in Karst Areas: A Case Study of Dahei Mountain, Yunnan Province. Acta Geol. Sin. 2021, 42, 397–406. [Google Scholar]
  53. Fu, H.; Zhong, J.; Fang, S.; Hu, J.; Guo, C.; Lou, Q.; Yuan, G.; Dai, T.; Li, Z.; Zhang, M.; et al. Scale-dependent changes in the functional diversity of macrophytes in subtropical freshwater lakes in south China. Sci. Rep. 2017, 7, 8294. [Google Scholar] [CrossRef]
  54. Ruiz-Benito, P.; Gómez-Aparicio, L.; Paquette, A.; Messier, C.; Kattage, J.; Zavala, M.A. Diversity increases carbon storage and tree productivity in Spanish forests. Glob. Ecol. Biogeogr. 2014, 23, 311–322. [Google Scholar] [CrossRef]
  55. Bu, W.S.; Zang, R.G.; Ding, Y. Functional diversity increases with species diversity along successional gradient in a secondary tropical lowland rainforest. Trop. Ecol. 2014, 55, 393–401. [Google Scholar]
  56. Yu, L.F.; Zhu, S.Q.; Ye, J.C.; Wei, L.M.; Chen, Z.R. Dynamics of a degraded Karst forest in the process of natural restoration. Sci. Silvae Sin. 2002, 38, 1–7. [Google Scholar]
  57. Ren, Y.X. Functional Diversity of Typical Forest Communities in Beijing Mountainous Area. Master’s Thesis, Beijing Forestry University, Beijing, China, 2012. [Google Scholar]
  58. Li, L.F. Quantitative Ecology of Picea wilsonii Forest in Luya Mountain Nature Reserve. Ph.D. Thesis, Beijing Normal University of China, Beijing, China, 2014; pp. 49–52. [Google Scholar]
  59. Villeger, S.; Mason, N.W.; Mouillot, D. New multidimensional functional diversity indices for a multifaceted framework in functional ecology. Ecology 2008, 89, 2290–2301. [Google Scholar] [CrossRef] [PubMed] [Green Version]
  60. Elser, J.J.; Fagan, W.F.; Denno, R.F.; Dobberfuhl, D.R.; Folarin, A.; Huberty, A.; Interlandi, S.; Kilham, S.S.; Mccauley, E.; Schulz, K.L.; et al. Nutritional constraints in terrestrial and freshwater food webs. Nature 2000, 408, 578–580. [Google Scholar] [CrossRef] [PubMed]
  61. Koerselman, W.; Meuleman, A. The vegetation N: P ratio: A new tool to detect the nature of nutrient limitation. J. Appl. Ecol. 1996, 33, 1441–1450. [Google Scholar] [CrossRef]
  62. Zeng, Z.X.; Wang, K.L.; Liu, X.L.; Zeng, F.P.; Song, T.Q.; Peng, W.X.; Zhang, H.; Du, H. Stoichiometric characteristics of live fresh and leaf litter from typical communities in a karst region of northwest Guangxi, China. Acta Ecol. Sin. 2015, 36, 1907–1914. [Google Scholar]
  63. Tian, H.Q.; Chen, G.S.; Zhang, C.; Melillo, J.M.; Hall, C.A.S. Pattern and variation of C: N: P ratios in China’s soil: A synthsis of observational data. Biogeochemistry 2010, 98, 139–151. [Google Scholar] [CrossRef]
  64. Gao, S.P.; Li, J.X.; Xu, M.C.; Chen, X.; Dai, J. Leaf N and P stoichiometry of common species in succession stages of the evergreen broad-leaved forest in Tiantong National Forest Park, Zhejiang Province, China. Acta Ecol. Sin. 2007, 27, 947–952. [Google Scholar]
  65. Chen, L.L.; Deng, Q.; Yuan, Z.Y.; Mu, X.M.; Kallenbach, R.L. Age-related C: N: P stoichiometry in two plantation forests in the Loess Plateau of China. Ecol. Eng. 2018, 120, 857–866. [Google Scholar] [CrossRef]
  66. Vitousek, P. Nutrient cycling and nutrient use efficiency. Am. Nat. 1982, 119, 553–572. [Google Scholar] [CrossRef]
  67. Bowman, W.D. Accumulation and use of nitrogen and phosphorus following fertilization in two alpine tundra communities. Oikos 1994, 70, 261–270. [Google Scholar] [CrossRef]
Figure 1. Overview map of the study area. CL—ultimate stage, TR—tree stage, TS—tree and shrub transition stage, SH—shrub stage, HS—grass and shrub transition stage, HE—herbaceous stage.
Forests 13 00864 g001
Figure 2. Weighted functional trait characteristics of communities at different restoration stages. CL—ultimate stage, TR—tree stage, TS—tree and shrub transition stage, SH—shrub stage, HS—grass and shrub transition stage, HE—herbaceous stage; PLH—plant height, LDMC—leaf dry matter content, CHL—chlorophyll content, LT—leaf thickness, RLW—leaf width to leaf length ratio, LA—leaf area, SLA—specific leaf area. Different lowercase letters represent significant differences, p < 0.05. The different letters of a–c represent significant differences. The change characteristics of PLH (A), LDMC (B), CHL (C), LT (D), RLW (E), LA (F) and SLA (G) in different recovery stages.
Forests 13 00864 g002
Figure 3. Functional diversity at different stages of recovery. FRic—functional richness index, FEve—functional evenness index, FDiv—functional divergence index, FDis—functional separation index, RaoQ—quadratic entropy coefficient; CL—ultimate stage, TR—tree stage, TS—tree and shrub transition stage, SH—shrub stage, HS—grass and shrub transition stage, HE—herbaceous stage. Different lowercase letters represent significant differences, p < 0.05. The different letters of a–c represent significant differences. The change characteristics of FRic (A), FEve (B), FDiv (C), FDis (D) and RaoQ (E) in different recovery stages.
Forests 13 00864 g003
Figure 4. Changes in leaf and soil chemical properties at different restoration stages. SCN—soil C:N, SCP—soil C:P, SNP—soil N:P, LCN—leaf C:N, LCP—leaf C:P, LNP—leaf N:P; CL—Ultimate stage, TR—tree stage, TS—tree and shrub transition stage, SH—shrub stage, HS—grass and shrub transition stage, HE—herbaceous stage; different lowercase letters represent significant differences, p < 0.05. The different letters of a–c represent significant differences. The change characteristics of SCN (A), SCP (B), SNP (C), LCN (D), LCP (E) and LNP (F) in different recovery stages.
Forests 13 00864 g004aForests 13 00864 g004b
Figure 5. Relationship between functional diversity and leaf and soil ecological chemometric networks. SCC—soil organic carbon content, SNC—soil total nitrogen content, SPC—soil total phosphorus content, LCC—leaf organic carbon content, LNC—leaf total nitrogen content, LPC—leaf total phosphorus content, SCN—soil C:N, SCP—soil C:P, SNP—soil N:P, LCN—leaf C:N, LCP—leaf C:P, LNP—leaf N:P. In (A), The red line signifies positive correlations while the blue line represents negative correlations. FD represents functional diversity index, LC—leaf ecological stoichiometry, SC—soil chemical properties; FRic—functional richness index, FEve—functional evenness index, FDiv—functional divergence index, FDis—functional separation index, RaoQ—quadratic entropy coefficient. In (B), the red numbers inside the brackets represent the number of positive correlations and the blue numbers represent the number of negative correlations.
Forests 13 00864 g005
Figure 6. Correlations of functional diversity with leaf and soil chemical properties. SCC—soil organic carbon content, SNC—soil total nitrogen content, SPC—soil total phosphorus content, LCC—leaf organic carbon content, LNC—leaf total nitrogen content, LPC—leaf total phosphorus content, SCN—soil C:N, SCP—soil C:P, SNP—soil N:P, LCN—leaf C:N, LCP—leaf C:P, LNP—leaf N:P. FRic—Functional richness index, FEve—Functional evenness index, FDiv—Functional divergence index, FDis—Functional separation index, RaoQ—Quadratic entropy coefficient. *, p < 0.05, significant correlation; **, p < 0.01, highly significant correlation; ***, p < 0.001, highly significant correlation. The amount of colored area filled within the small circle represents the correlation size.
Forests 13 00864 g006
Figure 7. Linear plots of the correlation between functional diversity and leaf and soil properties. R represents the magnitude of correlation between the two variables, p represents the magnitude of significance, and when p ≤ 0.05, it indicates a significant correlation between the two variables. SCC—soil organic carbon content, SNC—soil total nitrogen content, SPC—soil total phosphorus content, LCC—leaf organic carbon content, LNC—leaf total nitrogen content, LPC—leaf total phosphorus content, SCN—soil C:N, SCP—soil C:P, SNP—soil N:P, LCN—leaf C:N, LCP—leaf C:P, LNP—leaf N:P, FRic—functional richness index, FEve—functional evenness index, FDiv—functional divergence index, FDis—functional separation index, RaoQ—quadratic entropy coefficient. The linear relationship between RaoQ with SPC (A), LPC (B), SCP (C), LCP (D) and SCC (E); The linear relationship between FDiv with LNC (F), LCP (G), SPC (H) and LPC (I); The linear relationship between FDis with LCP (J), SCP (K), SCC (L), SNC (M), SPC (N) and LNC (O); The linear relationship between FRic with SPC (P), SCC (Q) and SNC (R).
Forests 13 00864 g007
Table 1. Sample site information overview. “-” represents the same as the previous column.
SampleSample Size (m×m)Longitude (°)Latitude (°)Elevation (m)Soil TypeParent Material
HE130 × 30107.9068225.214433821.58Calcareous soilDolomite and limestone
HE230 × 30107.9068625.214346824.78--
HE330 × 30107.9069925.214055845.2--
HS130 × 30107.9392825.303444697.16--
HS230 × 30107.9373425.303432702.69--
HS330 × 30107.9389125.304911693.62--
SH130 × 30107.9022925.23859865.16--
SH230 × 30107.9024925.238667857.85--
SH330 × 30107.9034125.238372863.41--
TS130 × 30107.9405325.303972693.55--
TS230 × 30107.9392525.3054732.76--
TS330 × 30107.940625.303961777.35--
TR130 × 30107.9409125.293638710.35--
TR230 × 30107.9388525.27445716.87--
TR330 × 30107.9402225.293434962.5--
CL130 × 30107.9377725.233763668.87--
CL230 × 30107.9383825.233347693.13--
CL330 × 30107.9370425.234201729.35--
Table 2. Basic information on sample sites. CL—ultimate stage, TR—tree stage, TS—tree and shrub transition stage, SH—shrub stage, HS—grass and shrub transition stage, HE—herbaceous stage.
Restoration StageForest Stand TypeCoverage (%)Height (m)Average Diameter at Breast (cm)Mean Ground Diameter (cm)
HEMiscanthus sinensis Anderss, Cyclosorus interruptus Community880.61null0.67
HSNandina domestica Community851.16null1.25
SHLoropetalum chinense Community781.31null1.88
TSLindera communis Hemsl. Nandina domestica Community876.8511.76null
TRSwida wilsoniana (Wanger.) Sojak Community909.915.46null
CLSwida wilsoniana (Wanger.) Sojak Community9211.7719.18null
Table 3. Characteristics of leaf and soil C, N, and P contents at different recovery stages. Different lowercase letters represent significant differences. p < 0.05; CC—organic carbon content, NC—total nitrogen content, PC—total phosphorus content; CV(cc)—coefficient of variation of organic carbon, CV(nc)—coefficient of variation of total nitrogen, CV(pc)—coefficient of variation of total phosphorus; CL—ultimate stage, TR—tree stage, TS—tree and shrub transition stage, SH—shrub stage, HS—grass and shrub transition stage, HE—herbaceous stage.
ConstituteSuccessionCC (g/kg)CV (cc)NC (g/kg)CV (nc)PC (g/kg)CV (pc)
SoilHE22.44 ± 6.92 a30.89%0.87 ± 0.32 b36.78%0.31 ± 0.15 a48.39%
HS49.45 ± 17.38 b35.15%1.99 ± 0.70 c35.18%0.61 ± 0.10 b16.39%
SH24.01 ± 7.63 a31.78%0.49 ± 0.17 a34.69%1.10 ± 0.74 c67.27%
TS82.88 ± 20.46 d24.69%3.86 ± 0.64 d16.16%0.99 ± 0.39 c39.39%
TR60.30 ± 17.14 c28.42%2.25 ± 0.91 c40.44%1.51 ± 0.48 d31.79%
CL76.14 ± 23.92 d31.42%3.63 ± 0.78 d21.49%2.00 ± 0.69 d34.50%
LeafHE412.65 ± 27.72 b6.72%3.23 ± 0.84 a26.01%0.53 ± 0.27 a50.94%
HS368.76 ± 53.49 a14.51%7.86 ± 2.14 c27.23%1.16 ± 0.76 bc47.50%
SH409.45 ± 45.54 b11.12%6.66 ± 4.05 bc60.81%1.30 ± 1.30 bc100.00%
TS413.59 ± 76.43 b18.48%4.03 ± 1.80 a44.67%1.00 ± 0.51 b51.00%
TR405.91 ± 69.53 ab17.13%6.30 ± 3.25 b51.59%1.42 ± 0.48 c33.80%
CL378.98 ± 62.53 ab16.50%6.64 ± 2.76 bc41.57%0.75 ± 0.41 ab54.67%
Publisher’s Note: MDPI stays neutral with regard to jurisdictional claims in published maps and institutional affiliations.

