Simple Summary
We measured the foliage area, weight and number of buds on young and mature balsam fir and white spruce trees. With these measurements, total amounts of foliage per tree and per unit area of forest land can be calculated. These estimates can be used to determine the absolute numbers of insects feeding on these trees, numbers that are important in understanding patterns and fluctuations of population abundance. We also discovered that spruce budworm larvae occur preferentially in buds arranged in clusters.
Abstract
We describe the distribution and amount of foliage, expressed as foliated branch surface area, weight, or number of buds in the live crown of healthy open-grown and closed-canopy balsam fir and white spruce trees. Balsam fir and white spruce have very similar total foliage surface area and weight. The live crown of white spruce trees contains fewer buds than balsam fir of similar dimensions. Thus, bud density per unit foliage weight or surface area is higher in balsam fir than in white spruce. We also observed that buds tend to grow in clusters more often on balsam fir than on white spruce, and that larvae of the spruce budworm preferentially attack buds that grow in clusters. Equations were developed to predict the total surface area and weight of foliage as well as number of buds in the live crown for estimation of absolute population density of spruce budworm. These equations use diameter at breast height (DBH) and the number of nodes in the live crown as predictors. When data on the number of live nodes are unavailable, it can be estimated from tree height. Equations were also developed from which to estimate foliage area, weight or bud numbers from DBH only.
1. Introduction
The spruce budworm, Choristoneura fumiferana (Clem.) (Lepidoptera: Tortricidae) is a key component of forest ecosystems in North America east of the Rocky Mountains. Its recurring outbreaks, caused by pronounced periodic population fluctuations, have been the object of much interest in insect ecology [1,2,3,4,5,6]. The ecological and economic consequences of these outbreaks are also of much concern in forest pest management [7,8,9]. Greenbank [10] summarized the main interactions between spruce budworm and its host plants. Over much of its North American range, the spruce budworm feeds on two major species of conifer: balsam fir, Abies balsamea (L.), and white spruce Picea glauca (Moench.) Voss. Red spruce, Picea rubra is an important host plant in the easternmost range of the insect. Black spruce, P. mariana, is thought to be a marginal host plant over much of the budworm’s range because of poor synchrony between bud break and the emergence of spruce budworm larvae in the spring [11,12]. However, there is evidence that climate change is altering this relative immunity [13,14,15]. Within a given stand containing all four host plants, defoliation inflicted by spruce budworm is highest on balsam fir, and is lower on white spruce, red spruce and black spruce, in decreasing order [16].
There are two principal methods used to monitor changes in population density of spruce budworm: foliage sampling and pheromone trapping [17,18]. Sampling of spruce budworm populations in host tree crowns is a well-researched topic [1,19]. As a compromise to obtain estimates representative of the entire crown, it is common practice to measure the population density of feeding larval stages from foliage samples consisting of 45-cm branch tips taken from the mid-crown of dominant or co-dominant host trees [19]. Likewise, density of eggs and overwintering larvae are estimated from samples of whole branches, 75-cm or 1-m branch tips, also taken from the mid-crown [20]. Population density expressions derived from such samples are relative to the amount of foliage examined: buds or current shoots, branch surface area or foliage weight [19]. These relative density estimates are useful to forecast defoliation, or to measure density differences between locations or changes in the course of one or a few growing seasons [6,21,22,23]. However, because they are always expressed relative to the quantity of foliage examined, they remain relative density estimates.
In some cases, there is a need to estimate the absolute density of budworm populations. This need may arise when a study is concerned with life stages not associated directly with foliage (e.g., moths), or populations of organisms whose habitat is not budworm-host foliage (e.g., generalist natural enemies). For example, to determine the extent of losses resulting from aerial dispersal of early-instar budworm larvae, estimates of absolute densities are needed [24,25]. Absolute densities are also needed to document the numerical response or impact of predatory birds during a spruce budworm outbreak [26,27]. A simple method to derive absolute density estimates of budworm populations would be helpful in better interpreting pheromone-trap catches, because they are influenced by male flight activity as affected by weather and responsiveness to the attractant, to the absolute density of the budworm population in a trap’s vicinity, and to moth dispersal [18]. Absolute density estimates may also shed additional light onto long-term spruce budworm population dynamics, when stand structure changes as a result of reduced tree growth and mortality due to defoliation [5,9,28].
Morris [21] described relationships between the diameter at breast height (DBH), the “cone volume” of balsam fir live crowns and total foliage surface area on trees in the Green River area of New Brunswick. Miller [29] related balsam fir DBH and the number of shoots in the live crown. However, these relationships do not take growing conditions such as open versus closed canopies, and height-growth rate into account. Although Kleinschmidt et al. [30] examined the distribution of foliage in the live crown of balsam fir, they did not provide relationships between tree size, foliage weight or number of growing shoots, common expressions of spruce budworm density [19,23,31]. No information on the relationship between tree size and the amount of spruce budworm resource is available for white spruce.
In this paper, we describe the distribution of foliage in the live crown of the two major hosts of spruce budworm: balsam fir and white spruce. We provide regression equations that relate the total weight and surface area of foliage, as well as the number of buds (or current shoots) on these trees to their DBH and the number of live nodes in their crown. From these equations, estimates of the relative density of spruce budworm obtained from mid-crown branch samples on balsam fir and white spruce (per m2, per kg or per shoot) can be transformed to numbers per tree. Combined with information on stand structure (number of stems/ha, DBH distribution, and number of live whorls), absolute density estimates (budworms/ha) can be calculated. Our samples also contained information on the prevalence of buds growing in clusters rather than singly, and we tested the hypothesis that bud clustering creates a preferred resource for establishment and survival of feeding spruce budworm larvae on balsam fir.
2. Materials and Methods
2.1. Sample Trees
This study was conducted near Black Sturgeon Lake, north of Lake Superior in northwestern Ontario (49.329° N, −88.893° W, 263 m). A detailed description of the stand, measured in 1985, and its physical environment is available [32]. A first sample was taken in June 1965, as the stand that had been damaged by spruce budworm during the 1950’s was regenerating. This sample consisted of 42 young (10–15 years), open-grown balsam fir (23) and white spruce trees (19) with DBH ≤ 10 cm. The DBH and number of live nodes (annual stem growth) of each tree were noted. All live nodal branches of each tree were removed. The length and width at midpoint of their foliated portion were recorded. The product of foliated length and midpoint width was used as a measure of foliated branch surface area [21]. All buds (or current-year shoots) on the branches were also counted. In this sample, internodal branches on the trees were not counted or measured.
A second sample was taken in late June 1980, before the onset of the 17-year outbreak from 1982 to 1998 in the Black Sturgeon Lake stand (see [22]), at a time when spruce budworm development had reached in the late instars (5th, 6th) and pupal stage. Twenty-three large (DBH ≥ 14 cm) dominant and co-dominant trees (11 balsam fir and 12 white spruce) were cut-down from the stand described. The DBH and number of foliated nodes on each tree were recorded. In this sample, all live branches on each node were counted, distinguishing nodal from internodal branches. On each foliated node, two opposing nodal branches were measured (foliated length, maximum foliated width perpendicular to the main axis and fresh foliated weight to the nearest 10 g). Branches from these trees were assumed to be shaped like parallelograms (or triangles), with surface area calculated as S = (foliated length × maximum foliated width)/2. Two additional, large (DBH ≥ 23 cm) open-grown trees (one balsam fir, one white spruce) in the same area were cut down and the foliated length and width were measured and buds counted on half of the branches, maintaining the distinction between nodal and internodal branches. Foliage weight was measured on all live branches on the open-grown white spruce, but, by error, was recorded on only a subset of the branches on the balsam fir. Foliage weight W was available only from trees in the 1980 sample. To estimate foliage weight in trees where it was not measured (1965 sample), as well as most branches on the open-grown balsam fir measured in 1980, we used the simple regression model log W = ai + bi log S where i is the tree species index (in this paper, all logs are base 10). Any missing branch weight in our dataset was replaced by an estimate provided by this regression.
In trees examined in 1980, the number of buds found singly or in clusters of 2, 3, or more was recorded separately for each branch measured. On the mature open-grown balsam fir, all spruce budworm larvae (5th and 6th instars) and pupae found on branches from the top 10 nodes were recorded, along with the number of buds in the feeding site of each insect. Because these trees had been felled prior to foliage examination, it is probable that a small proportion of larvae, especially 6th instar, were dislodged. However, the feeding sites of dislodged budworms were nevertheless very easy to find, and were counted.
2.2. Analysis
2.2.1. Description of Sample Trees
To provide a good description of the trees in our samples, relationships between tree height H (m), live crown length L (m) and DBH D (cm) were established by regression analysis, using species and crown-closure as factors. Live crown length was related to tree height, species and crown closure, with forcing through a zero intercept. The number of live nodes K in the crown was related to live crown length, species and crown closure. The initial models contained all terms and interactions, and were simplified by removing the least-significant terms one at a time until all remaining terms were significant (α = 0.05) to retain the most parsimonious final models.
2.2.2. Nodal and Internodal Foliage
The numbers of intermodal and nodal branches growing on closed-canopy trees of the 1980 sample were related to node number k (where k = 0 is the leader) by polynomial regression, using species i as a factor. Because of the highly non-linear nature of the relationship with k, the polynomial degree n was chosen to maximize the goodness-of-fit. A fully-saturated model was first fitted:
where fi(k) or gi(k) is the number of internodal or nodal branches of tree species i as functions of node number k. Degrees n = 4 and 3 were used for intermodal and nodal branches, respectively. To obtain the most parsimonious models, each regression model was simplified by removing least-significant terms one at a time, until all remaining terms were significant (α = 0.05). Because the number of internodal branches is by nature zero on the leader (k = 0), function fi(k) was forced through intercept ai = 0. From the final models, we calculated the expected ratio of internodal to nodal branches:
In a similar manner, this time from the two open-grown trees cut down in 1980, we calculated the ratios of total foliage surface area Ωi(k), weight Ψi(k) and number of buds Φi(k) on internodal branches relative to nodal branches as functions of node number k and tree species i. To obtain near-normal residual distributions, we used the log transform of total branch area, weight or number of buds in fitting Equation (1).
2.2.3. Total Foliage Area, Weight and Number of Buds
The average nodal-branch surface area , weight and number of buds on node k was calculated for each tree. The total foliage surface area S (m2), foliage weight W (kg) and number of buds B per tree in the 1965 and 1980 samples of trees were obtained with:
where nk is the number of nodal branches on node k = {0, 1, 2, 3, …, K} with k = 0 being the leader and k = K the last foliated node on the tree.
Relationships between total amount of foliage and tree characteristics (species i, crown closure j, DBH D (in cm) and number of foliated nodes K were explored with regression analysis, using the general model:
where Y is foliage weight W, branch area S or number of buds B calculated with Equation (3). Simpler expressions using only D as a predictor, were also obtained with the general model:
These models were fitted to all open-grown trees measured in 1965, and closed-canopy trees measured in 1980. The two open-grown trees measured in 1980 (one balsam fir, one white spruce) were excluded because their large size compared to the other, much smaller, open-grown trees from the 1965 sample made them “influential outliers”. The initial models contained all categorical and continuous predictors and their interactions, and the final, most parsimonious models were obtained by eliminating least-significant terms one at a time until all remaining terms were significant (α = 0.05). In all regression analyses above, the normality of residuals was tested by the Anderson–Darling statistic (AD) [33].
2.2.4. Bud Density and Clustering
The density of spruce budworm is most often expressed in relative terms, per branch, m2 or kg of foliage. In recent work [23,31], the density expression used has been “insects per bud or shoot”, which is more closely related to the insect’s food resource. It is therefore useful to better understand the distribution of buds on host foliage over the live crown of young and mature, open-grown and closed-canopy trees of the main budworm host species. The average density of buds (or current-year shoots) per m2, kg and branch was calculated for each node on young open-grown and mature closed-canopy balsam fir and white spruce trees. The proportion of buds found in clusters on nodal branches of the closed-canopy trees sampled in 1980 was also compiled by node and tree species.
Differences in likelihood of balsam fir buds being attacked by budworm when growing singly or in clusters of 2, 3, or more buds were established by logistic regression, using node and buds per cluster as continuous predictors.
3. Results
3.1. Description of Sample Trees
The height and live crown length of our sample trees were described by regression models relating them quite accurately to DBH, species and crown closure. Open-grown trees grew higher for a given DBH than closed-canopy trees, and balsam fir tended to be slightly taller than white spruce (Table 1; Figure 1a; R2 = 0.99). Open-grown trees had longer live crowns than did closed-canopy trees at a given DBH, and the live crown tended to be slightly longer in balsam fir than in white spruce, although the species contribution was barely significant (Table 1; Figure 1b; R2 = 0.96). Live crown length was linearly related to tree height: in open-grown trees, the live crown covered 84% of the tree height, but in closed-canopy trees, it represented only the top 50%. These proportions were the same in balsam fir and white spruce (Table 1; Figure 1c; R2 = 0.99). The number of nodes K in the live crown was closely related to treee height H, and the relationship was independent of tree species or crown closure (Table 1; Figure 1d; R2 = 0.8):

Table 1.
Description of the height H, live crown length L and number of live nodes K in our sample trees from Black Sturgeon Lake (open-grown in 1965 and closed-canopy in 1980) as functions of DBH D, tree species and crown-closure. AD: Anderson–Darling residual normality test.
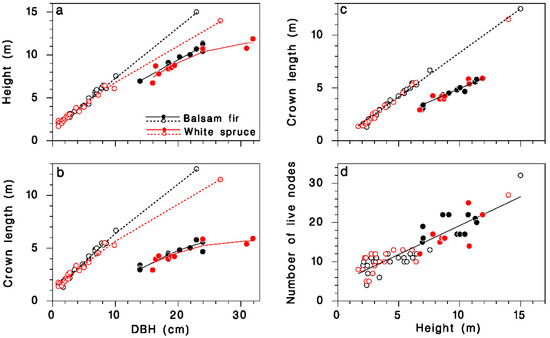
Figure 1.
Description of the sample trees collected at Black Sturgeon Lake. (a) Tree height against DBH. (b) Live crown length against DBH. (c) Live crown length against tree height. (d) Number of live nodes against tree height. Black: balsam fir; red: white spruce; open circles and dotted lines: open-grown (in 1965 or 1980); closed circles and solid lines: closed-canopy (in 1980).
This relationship provides an estimate of the number of live nodes K when only tree height information is available. Below, we use K as a determinant of the total amount of foliage (or buds) on trees because it is a better predictor than are either tree height or live crown length.
3.2. Estimation of Missing Foliage Weights
Regression anaysis of foliated branch weight W against foliated branch area S provided a good fit to observations (R2 = 0.85 on log scale, R2 = 0.61 on regular scale). While regression residuals (logs) were not normally-distributed (AD = 5.5, n = 1099, p < 0.005), they displayed a clear, if somewhat negatively skewed, bell-shaped distribution and deviation from the normality assumption was not deemed critical. The weight estimation function used to replace missing values in our dataset was therefore:
3.3. Internodal to Nodal Ratios
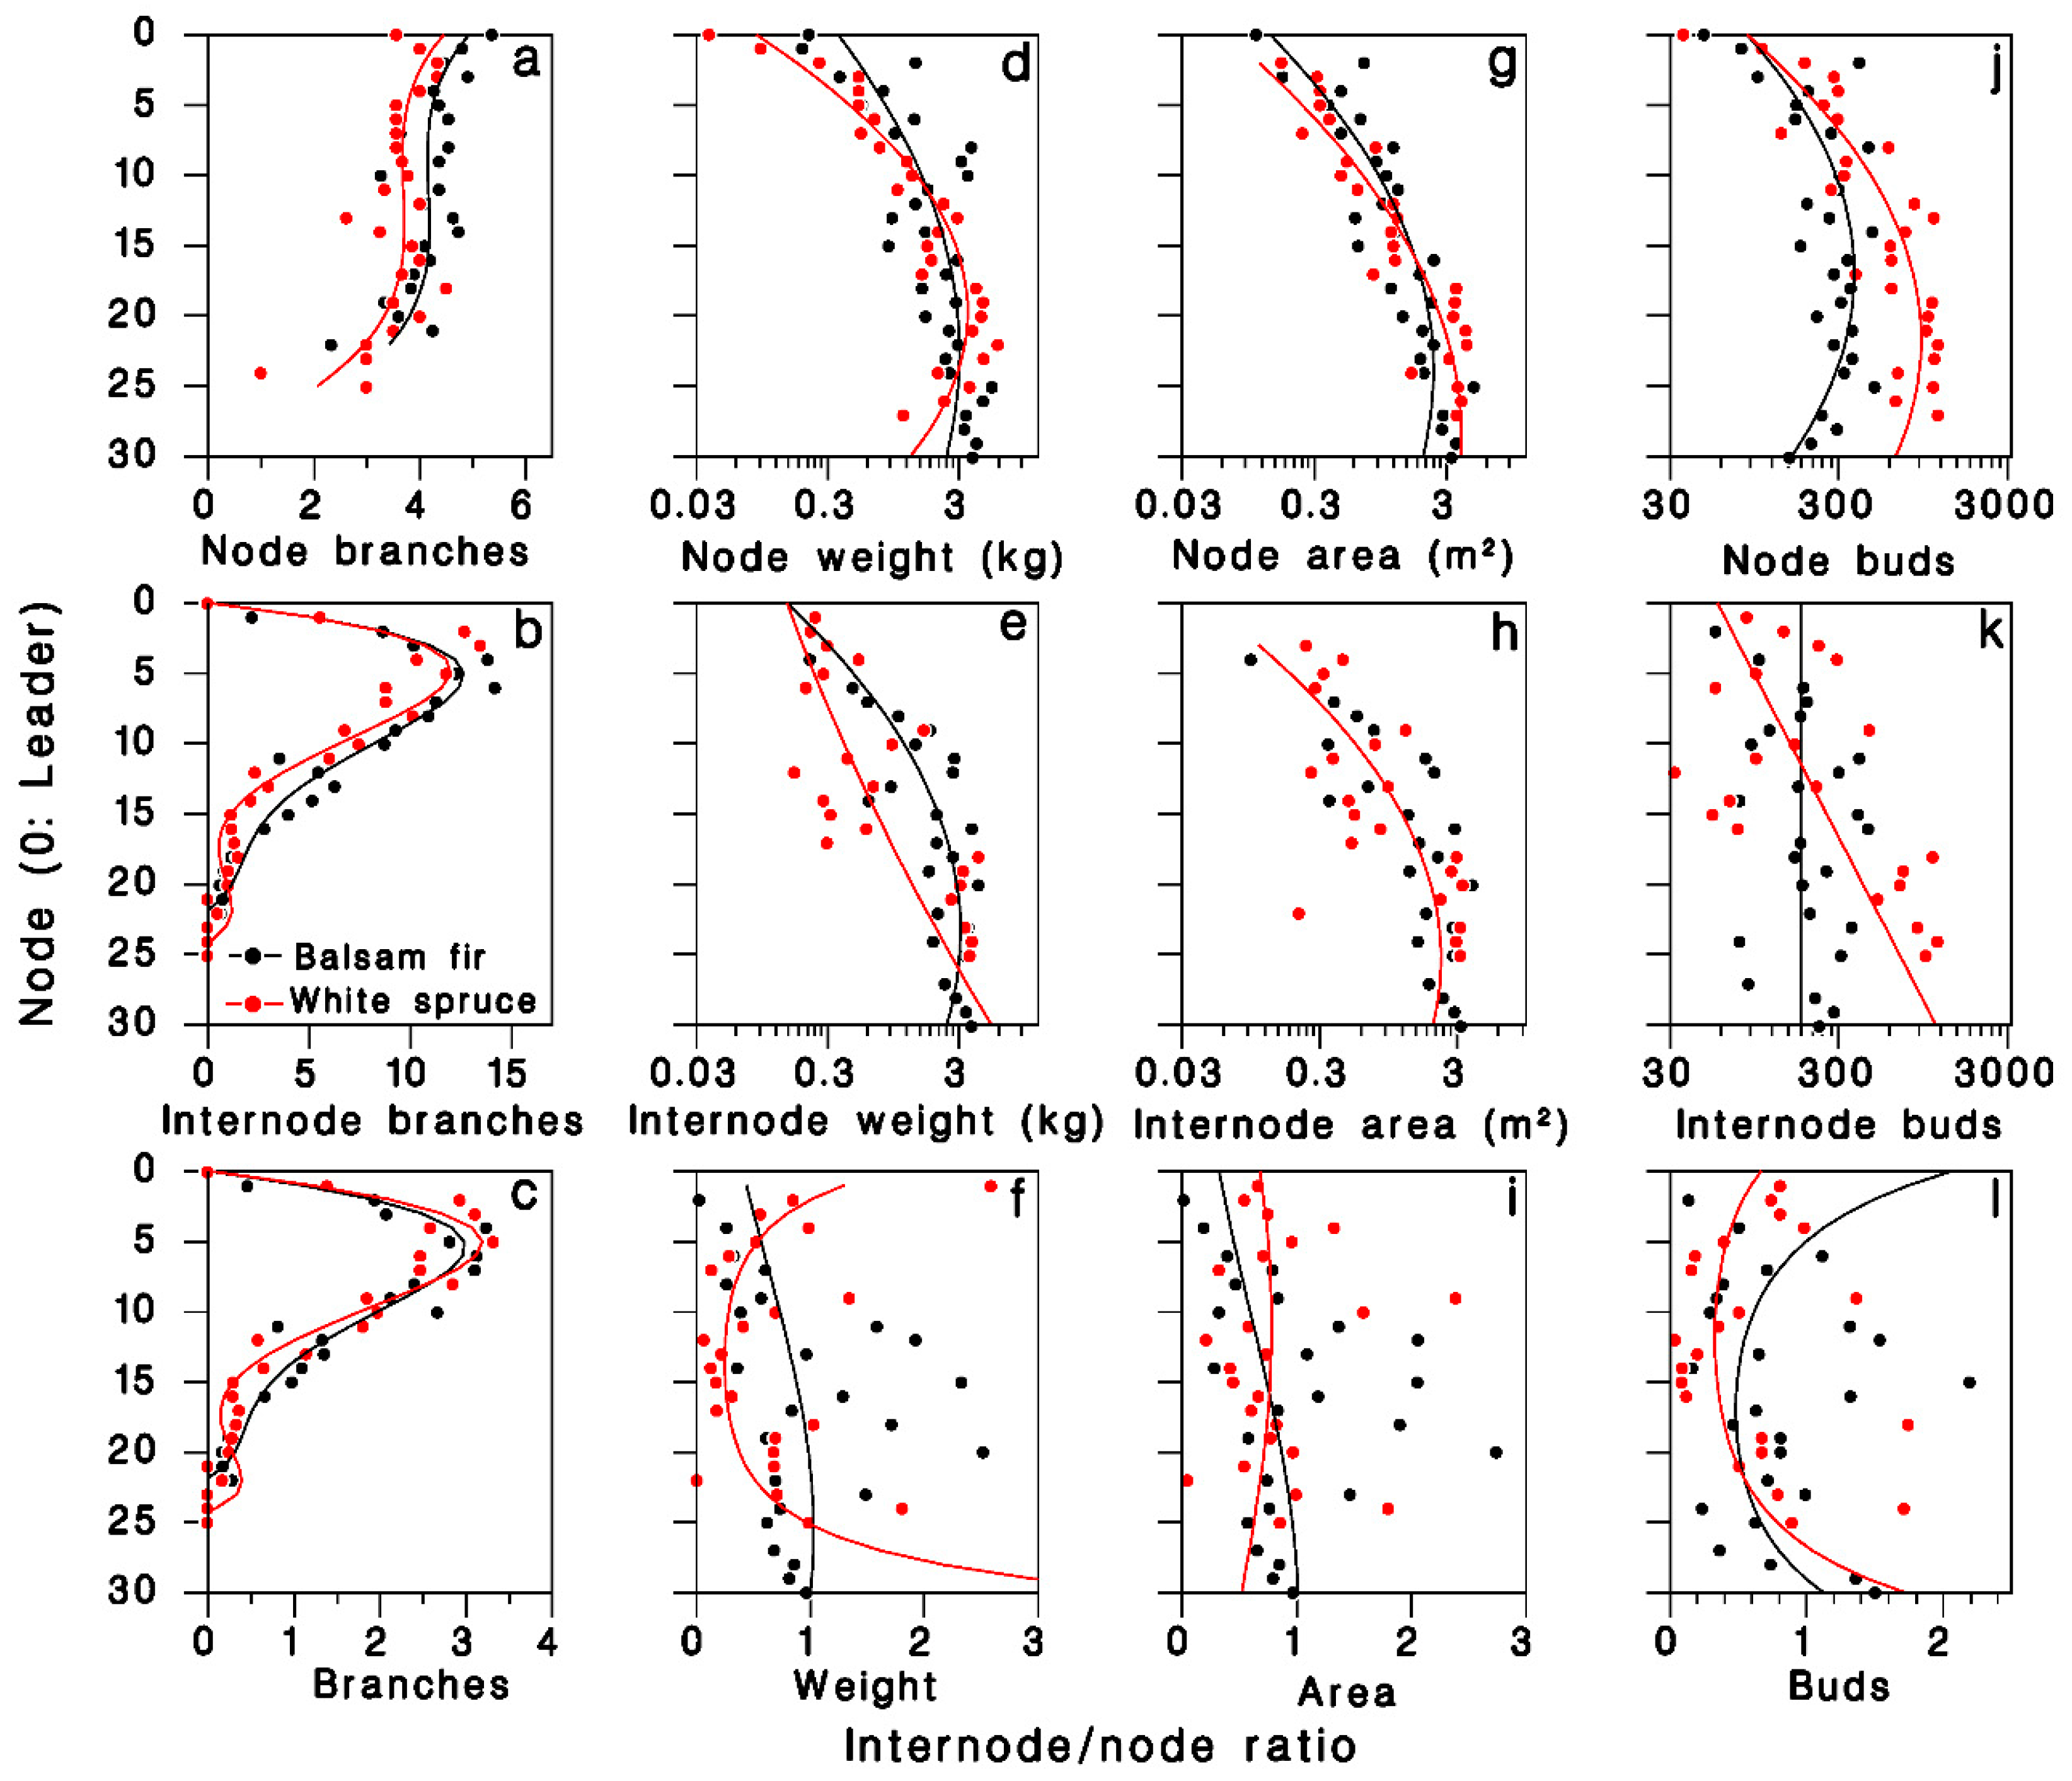
In the 1980 closed-canopy tree sample, the number of foliated nodal branches per node was described by third-degree polynomials specific to each tree species (R2 = 0.54; Table 2; Figure 2a). The number of foliated internodal branches per node, which is zero on the leader (k = 0), increased sharply between nodes two and 10, then decreased to near zero at the base of the live crown, somewhat faster in white spruce (Figure 2b). These patterns were well described by fourth-degree polynomials with zero intercept (R2 = 0.92; Table 2). The pattern of internodal to nodal branches ratio over the live crown was well described (R2 = 0.91; Figure 2c) by the ratios of regression polynomials estimated above:
Table 2.
Equation (1) relating nodal and internodal number of branches, log foliage weight, log area, and log number of buds, to node number k and tree species i at Black Sturgeon Lake, in 1980. Number of branches from closed-canopy trees; weight area and number of buds from open-grown trees. AD: Anderson–Darling residual normality test.
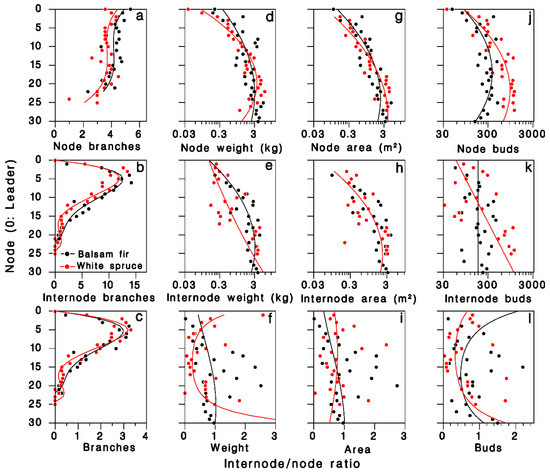
Figure 2.
Distribution of foliage in the live crown of balsam fir and white spruce trees sampled in 1980 at Black Sturgeon Lake. (a–c): Number of branches, (a) nodal, (b) internodal branches, (c) internodal to nodal ratio (closed-canopy trees). (d–f): Foliage weight; (g–i): foliage area; and (j–l): number of buds (open-grown trees). Black: balsam fir; red: white spruce; lines are Equation (1) in top and center rows, and Equations (8)–(11) in (c–l), respectively.
The log weight of foliated nodal branches was well described by a second-degree polynomial (R2 = 0.77; Table 2; Figure 2d). On foliated internodal branches, weight was more variable, but was adequately described by a second-degree polynomial (R2 = 0.55; Table 2; Figure 2e). The internodal to nodal weight ratio Ψ was highly variable (R2 = 0.35; Figure 2f), but was adequately expressed by the ratios of regression polynomials estimated above:
The log branch area on nodal and internodal branches were well described by second-degree polynomials (R2 = 0.83 and 0.69, respectively; Table 2; Figure 2g,h). The resulting ratio Ω was highly variable, and the ratio of fitted polynomials described less than 10% of this variation (Figure 2i; R2 = 0.08):
3.4. Whole-Tree Foliage Area, Weight and Buds
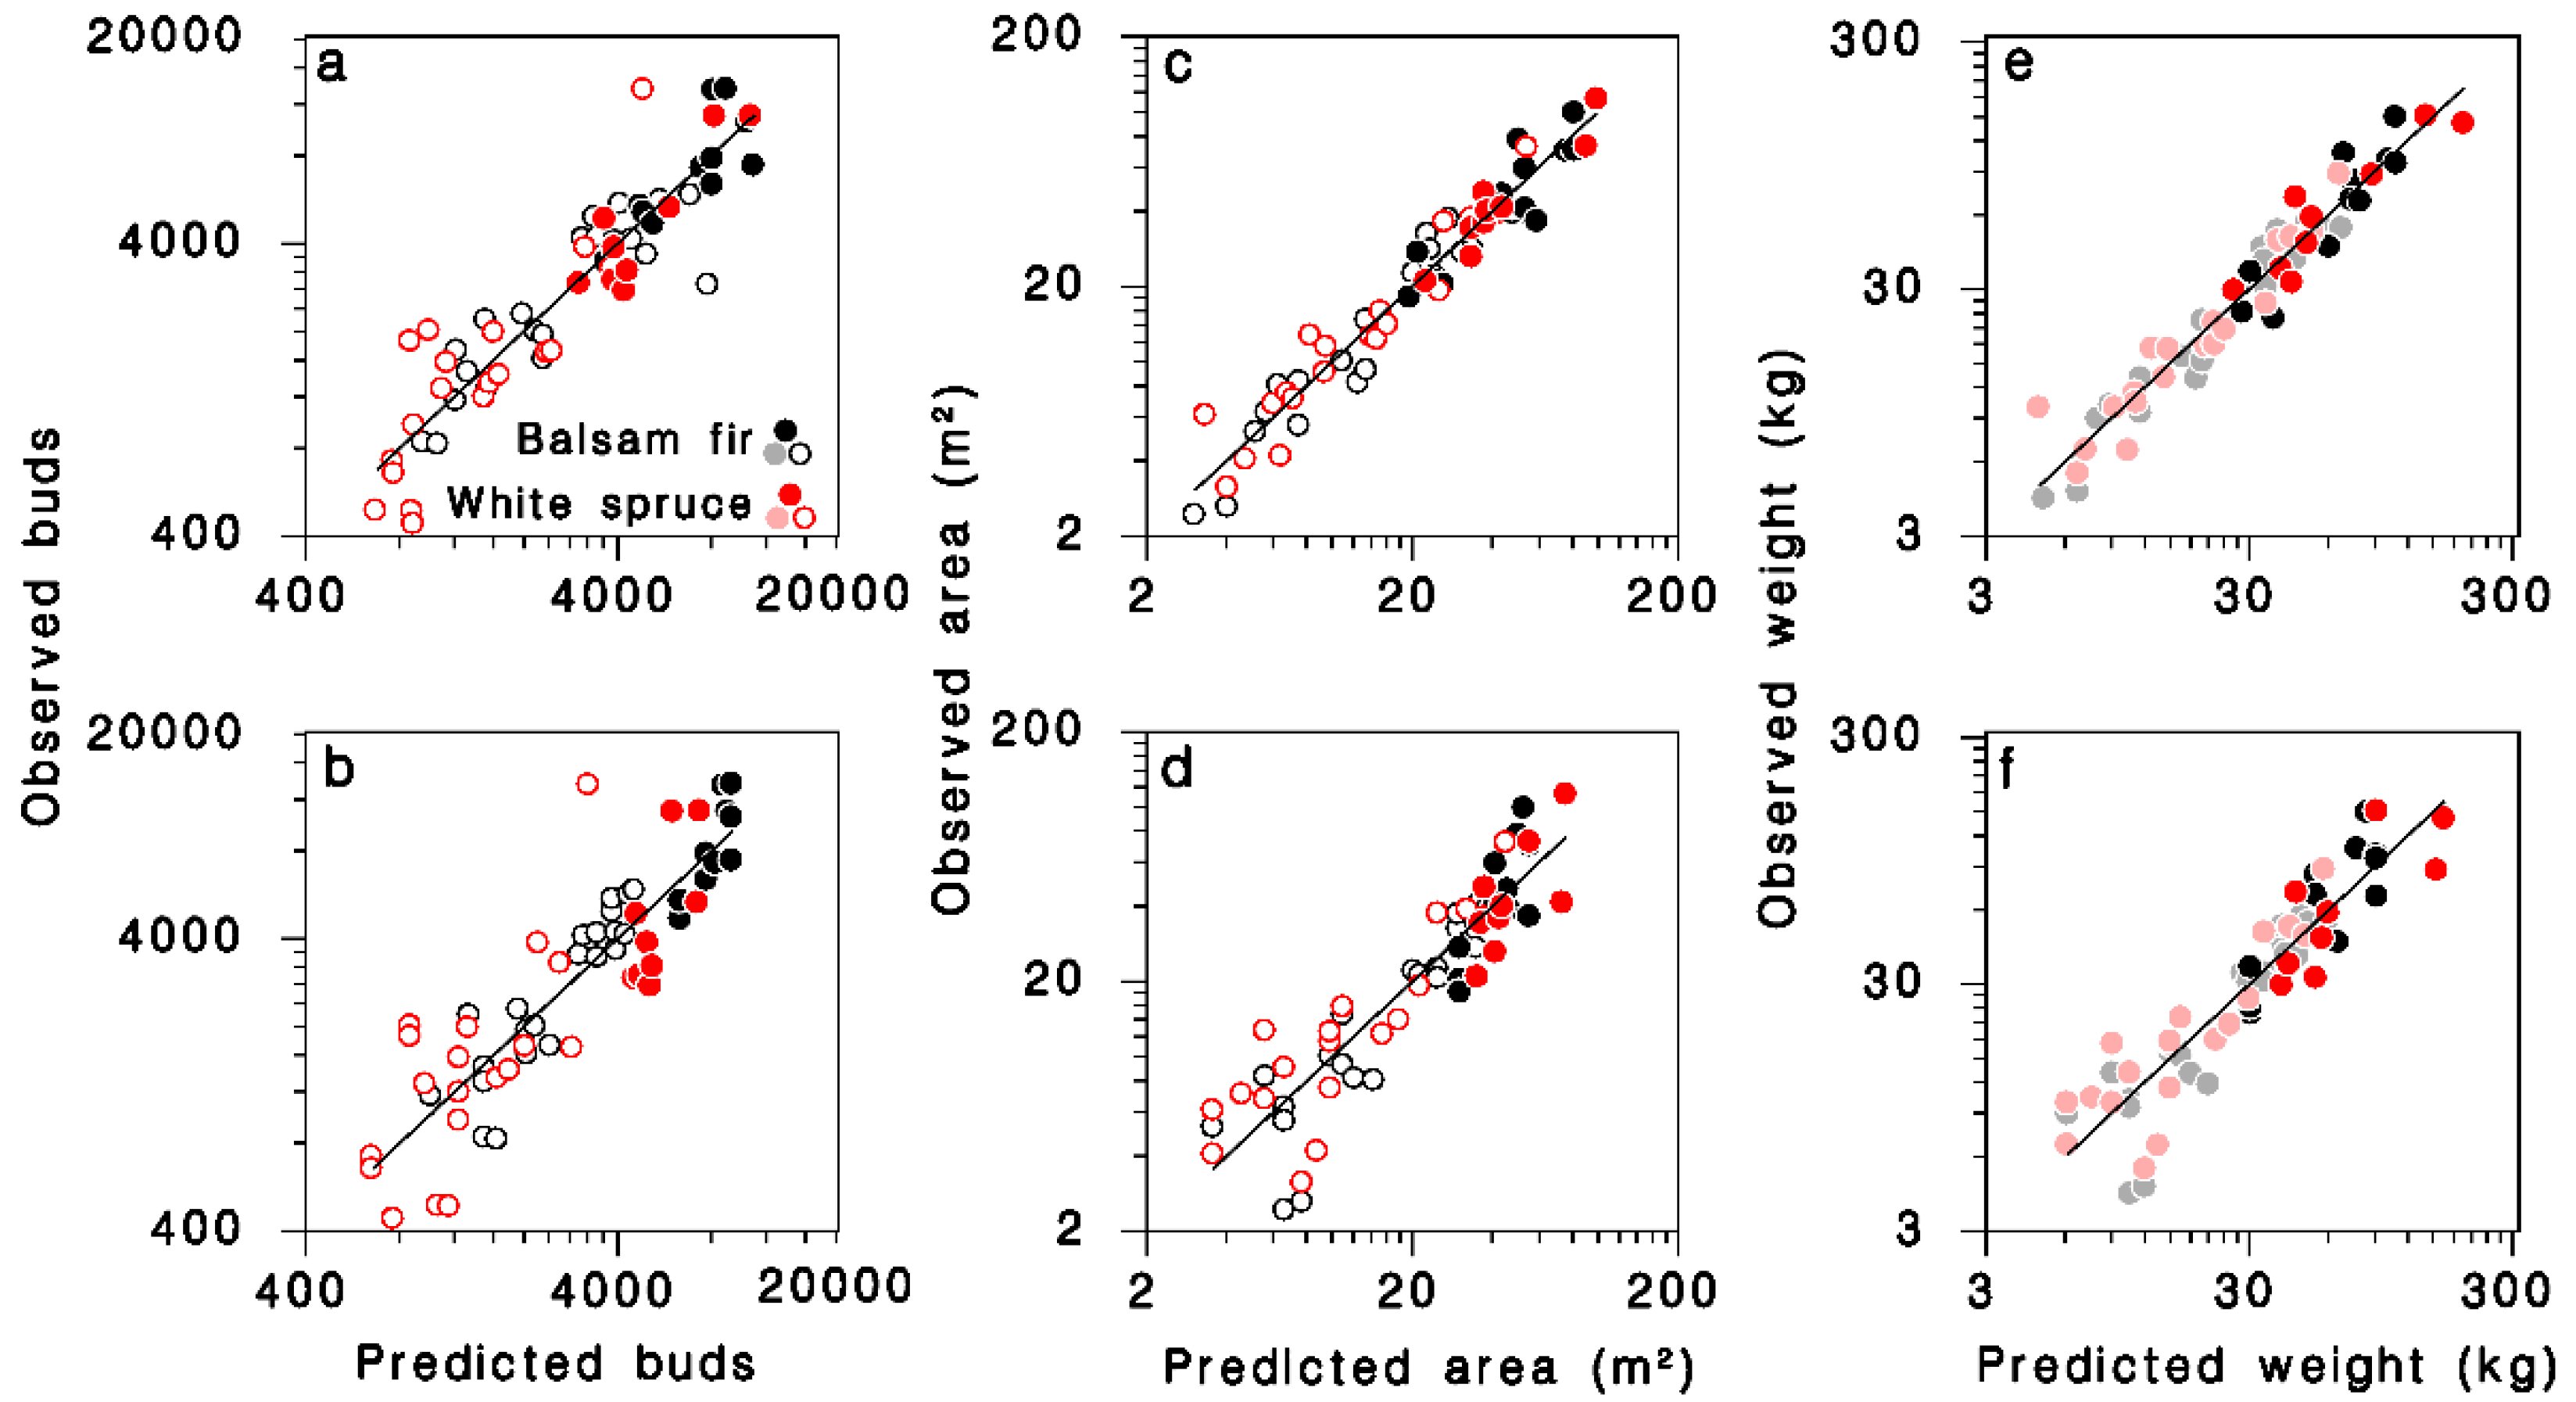
Using Equations (9)–(11), the total number of buds (B), foliage weight (W) and branch area (S) per tree for each tree in the 1965 and 1980 samples were calculated. The total number of buds B was related significantly to tree DBH D and number of live nodes K through complex interactions with species and crown closure. The predictive equation obtained after reducing regression model (4) to only significant terms (Table 3; Figure 3a; log scale R2 = 0.85; regular scale R2 = 0.73) was:
Table 3.
Models relating total number of buds, foliage weight and branch area to tree DBH D, number of live nodes K, tree species and crown closure, in trees sampled in 1965 (open-grown) and 1980 (closed-canopy) at Black Sturgeon Lake. AD: Anderson–Darling residual normality test.
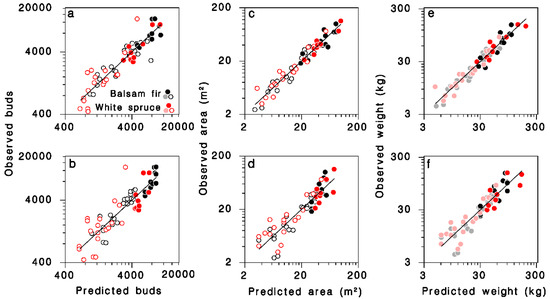
Figure 3.
Relationships between observed and predicted (a,b) number of buds, (c,d) branch area, and (e,f) foliage weight for all trees in the dataset. Equations (12), (14) and (16) in (a,c,e), respectively. Equations (13), (15) and (17) in (b,d,f), respectively. Black: balsam fir; red: white spruce; open circles: open-grown; closed circles: closed-canopy. Lines: equality. (e,f): dimmed color symbols for open-grown trees, weights estimated, not measured.
The simpler model using only D as continuous predictor in Equation (5), provided a slightly lower, but still quite satisfactory fit to the observations (Table 3; Figure 3b; log scale R2 = 0.77; regular scale R2 = 0.67):
The predictions from this simple model agree with an equation calculated from observations of Miller [29] for balsam fir, at least for trees with DBH < 25 cm (grey-dashed line in Figure 4a). It should be noted that the larger trees in Miller’s sample (>30 cm DBH) were, in his words, “open-growing”. The number of buds on mature, closed-canopy white spruce was smaller than on corresponding balsam fir trees with the same DBH.
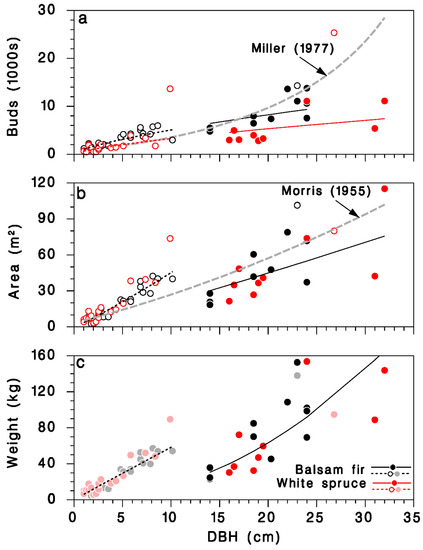
Figure 4.
Relationships between DBH D and amount of foliage on open-grown and closed-canopy balsam fir and white spruce trees: (a) total number of buds, (b) total foliated branch area, and (c) total foliated branch weight. Black: balsam fir; red: white spruce; open circles and doted lines: open-grown trees; closed circles and solid lines: closed-canopy. Lines: (a) Equation (13), grey dashed line: relationship for balsam fir from Miller [29]; (b) Equation (15), grey dashed line: relationship for balsam fir from Morris [21]; (c) Equation (17). (c): Dimmed color symbols for open-grown trees, weights estimated, not measured.
The major determinant of total branch surface area (S) was DBH (D); contributions of crown closure, the number of foliated nodes K and their interaction were also highly significant. The final, reduced regression model obtained was (Table 3; Figure 3c; log scale R2 = 0.94; regular scale R2 = 0.89):
A simpler model using only D as continuous predictor did not differ between tree species (Table 3; Figure 3d; log scale R2 = 0.83; regular scale R2 = 0.76), and was very similar to a model published by Morris [21] (grey dashed line in Figure 4b):
The relationship between total foliage weight W, DBH D and the number of nodes in the live crown K on open-grown or closed-canopy balsam fir and white spruce (Table 3; Figure 3e; log scale R2 = 0.93; regular scale R2 = 0.88) can be expressed as:
In simpler form, using only D as continuous predictor, the model remains accurate (Table 3; Figure 3f; log scale R2 = 0.84; regular scale R2 = 0.75):
We found no previously published relationships between tree DBH and foliated branch weight for balsam fir or white spruce. Because of missing weight observations in open-grown trees in our dataset, the corresponding foliage weight predictions should be used cautiously (Figure 4c).
3.5. Bud Density and Grouping
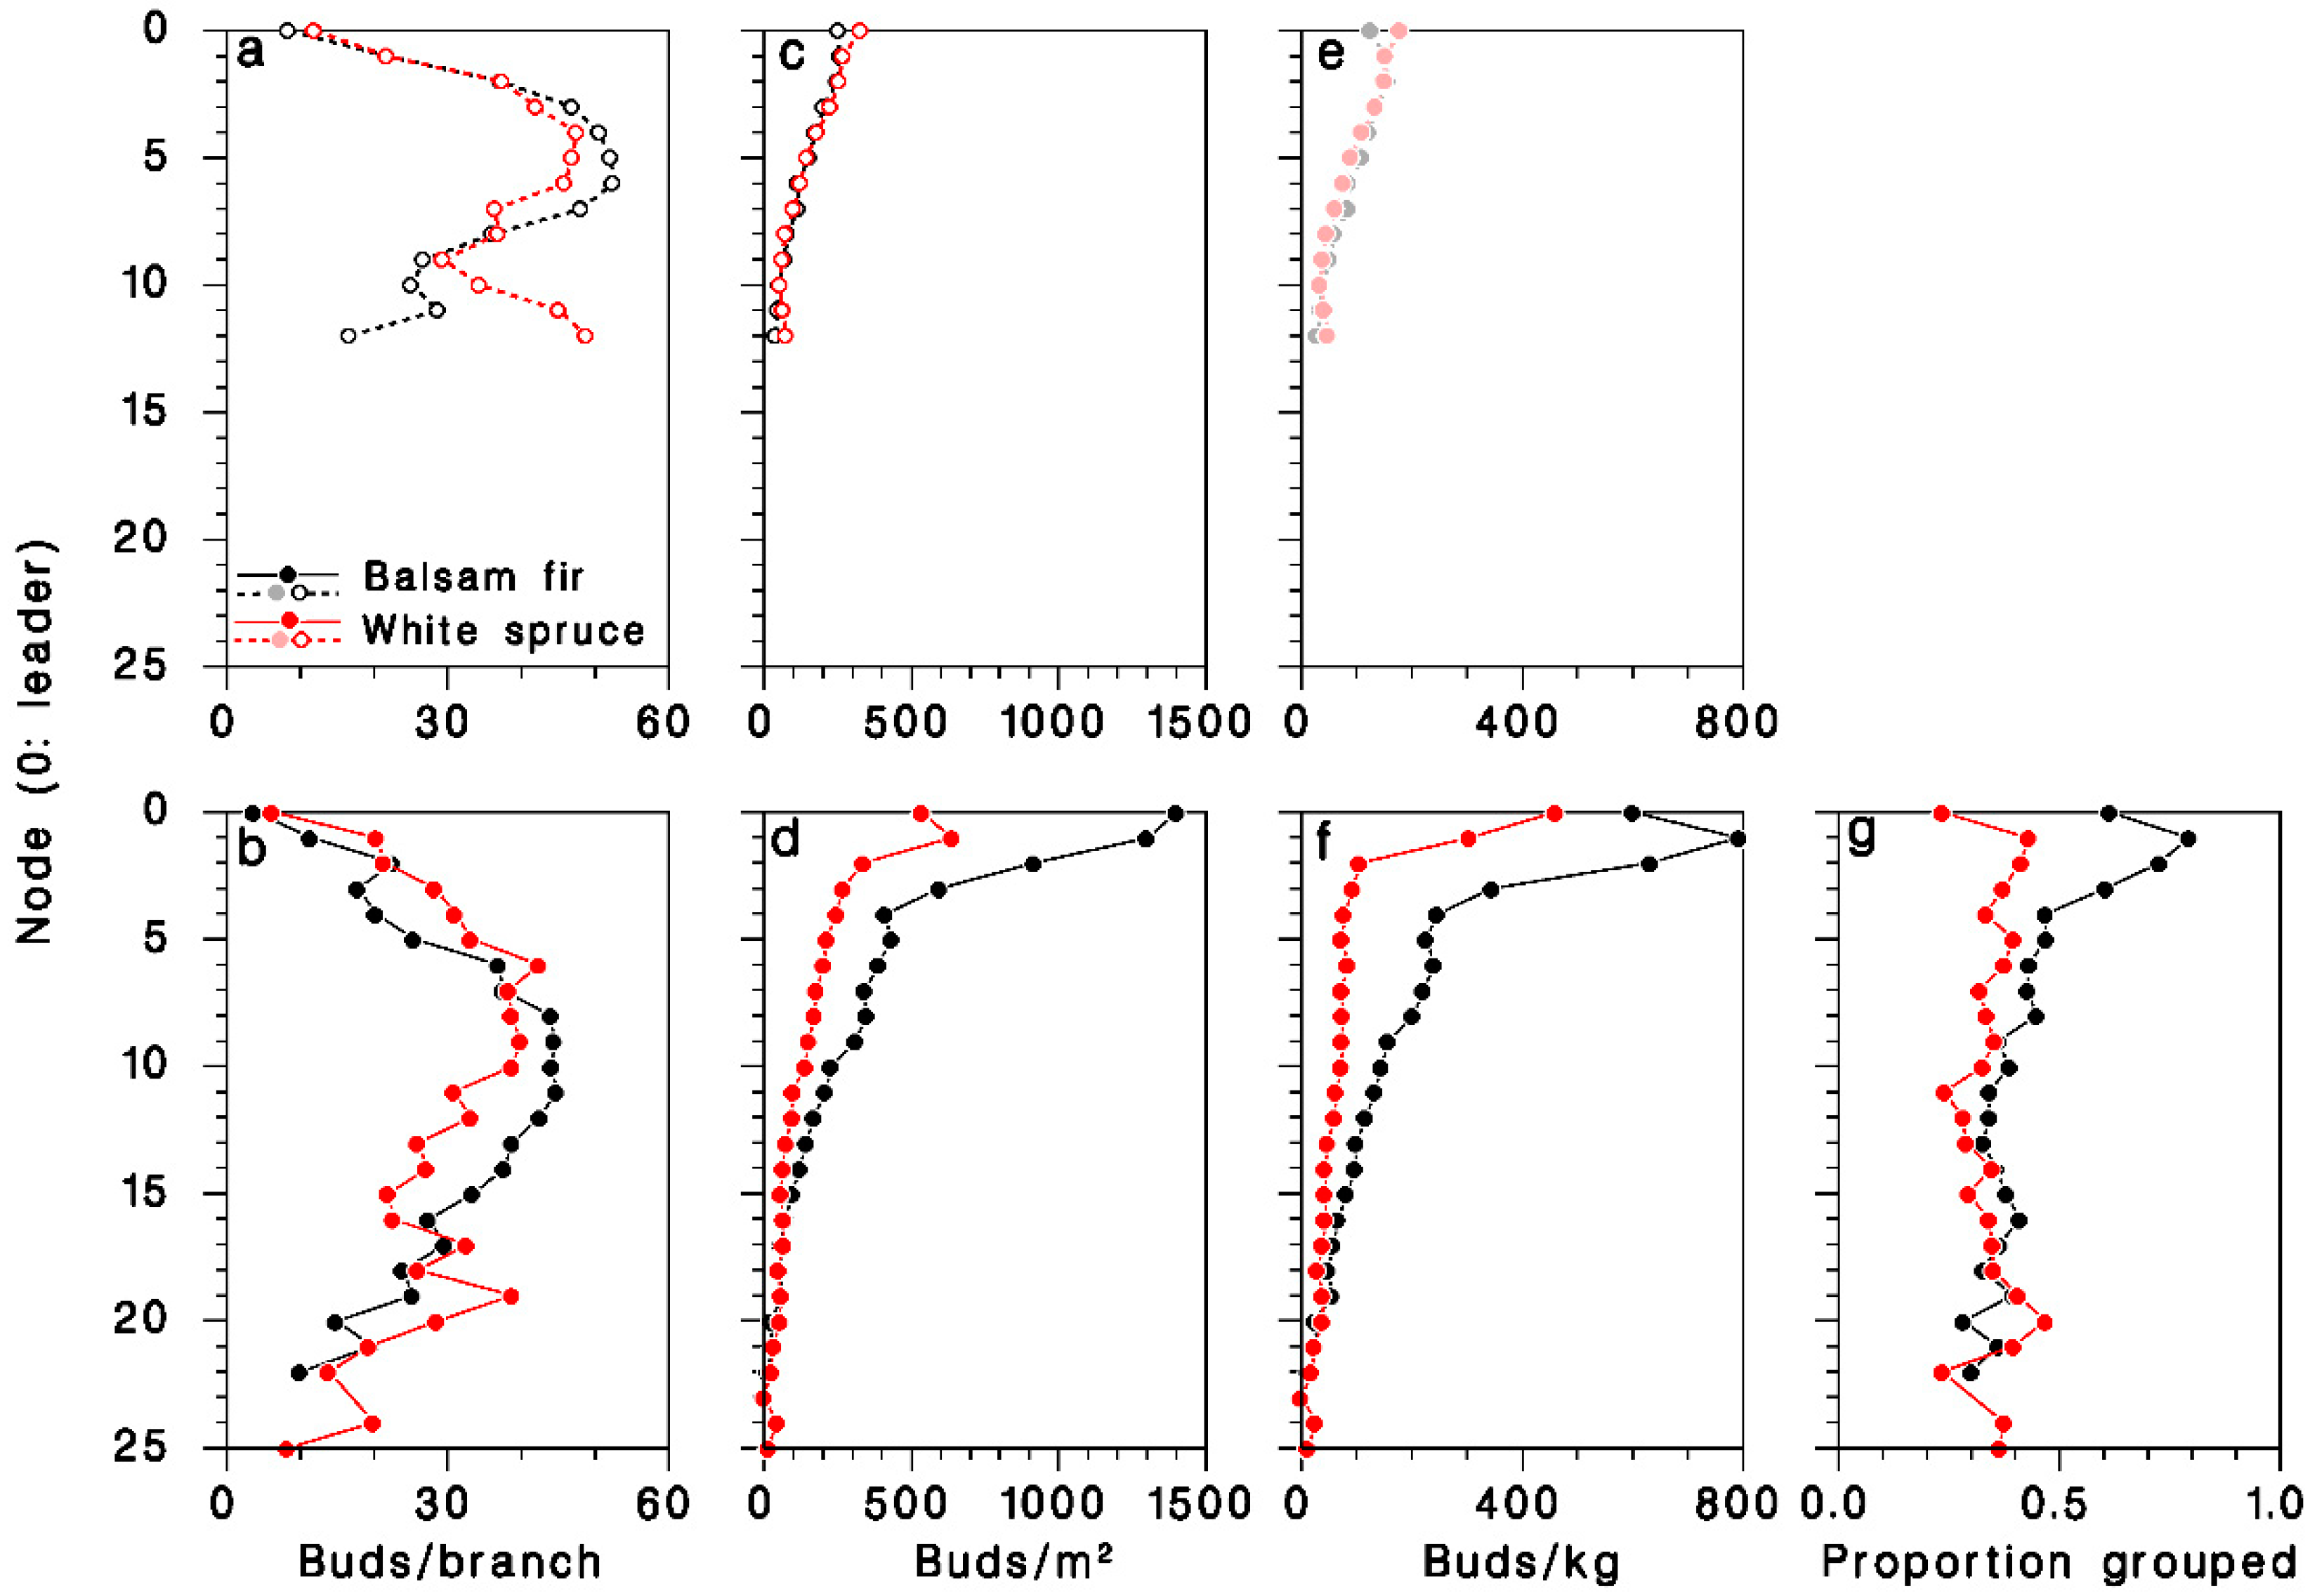
The number of buds per branch was slightly but significantly lower (ANOVA F = 174.7, df = 1, 2663, p < 0.001) on young, open-grown trees (36.5 ± 0.9), than on mature, closed-canopy trees (57.4 ± 1.5). It varied considerably over the live crown, and was consistently higher at mid-crown (Figure 5a,b). Bud density, expressed per unit of foliated branch area, was significantly higher in mature, closed-canopy trees (ANOVA F = 71.1, df = 1.2663, p < 0.001) than in young, open-grown trees, and highest at the top of the crown (Figure 5c,d). It was considerably higher (interaction F = 45.9, df = 1.2663, p < 0.001) in mature closed-canopy balsam fir (497 ± 61 buds/m2) than in mature closed-canopy white spruce (212 ± 12 buds/m2) or in young, open-grown trees of either species (165 ± 3 and 176 ± 5 buds/m2 in balsam fir and white spruce, respectively). Expressed per unit of foliated branch weight, bud density was also significantly higher in mature, closed-canopy trees (ANOVA F = 147.6, df = 1.2662, p < 0.001) than in young, open-grown trees, and was also at its highest at the top the crown (Figure 5e,f). It was much higher (interaction F = 122.7, df = 1.2662, p < 0.001) in mature closed-canopy balsam fir (260 ± 16 buds/kg) than in mature closed-canopy white spruce (111 ± 7 buds/kg) or in young, open-grown trees of either species (107 ± 2 and 104 ± 3 buds/kg in balsam fir and white spruce, respectively).
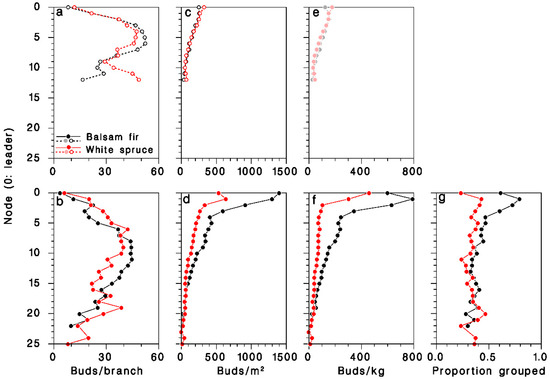
Figure 5.
Distribution of foliage in the live crown of (a–c) young open-grown and (d–f) mature closed-canopy balsam fir (black symbols) and white spruce (red sybols). (a,d): Buds per m2 of foliage; (b,e) buds per kg of foliage; (c,f) buds per whole branch. (g): Proportion of buds in clusters (two or more). (e): Dimmed color symbols for open-grown trees, weights estimated, not measured.
In mature, closed-canopy trees, the frequency of buds growing in clusters of two or more rather than singly was much higher (χ2 = 304.9; df = 1; p < 0.001) on balsam fir (41.5%, n = 25,492) than on white spruce (33.9%, n = 24,988), a difference that was most pronounced in the upper half of the live crown (Figure 5g).
Over the first 10 nodes of the mature, open-grown balsam fir tree examined in 1980, 31.3% (1816/5803) of buds grew singly. Yet only 17% (25/150) of the budworm found on that foliage had established feeding sites on single buds. Most buds (56%) grew in clusters of three or more, and most (68%) spruce budworm larvae were found in those clusters. Thus, spruce budworm larvae showed a clear preference for clusters of three buds, compared to single buds (test of homogeneity χ2 = 17.6; df = 3; p = 0.001).
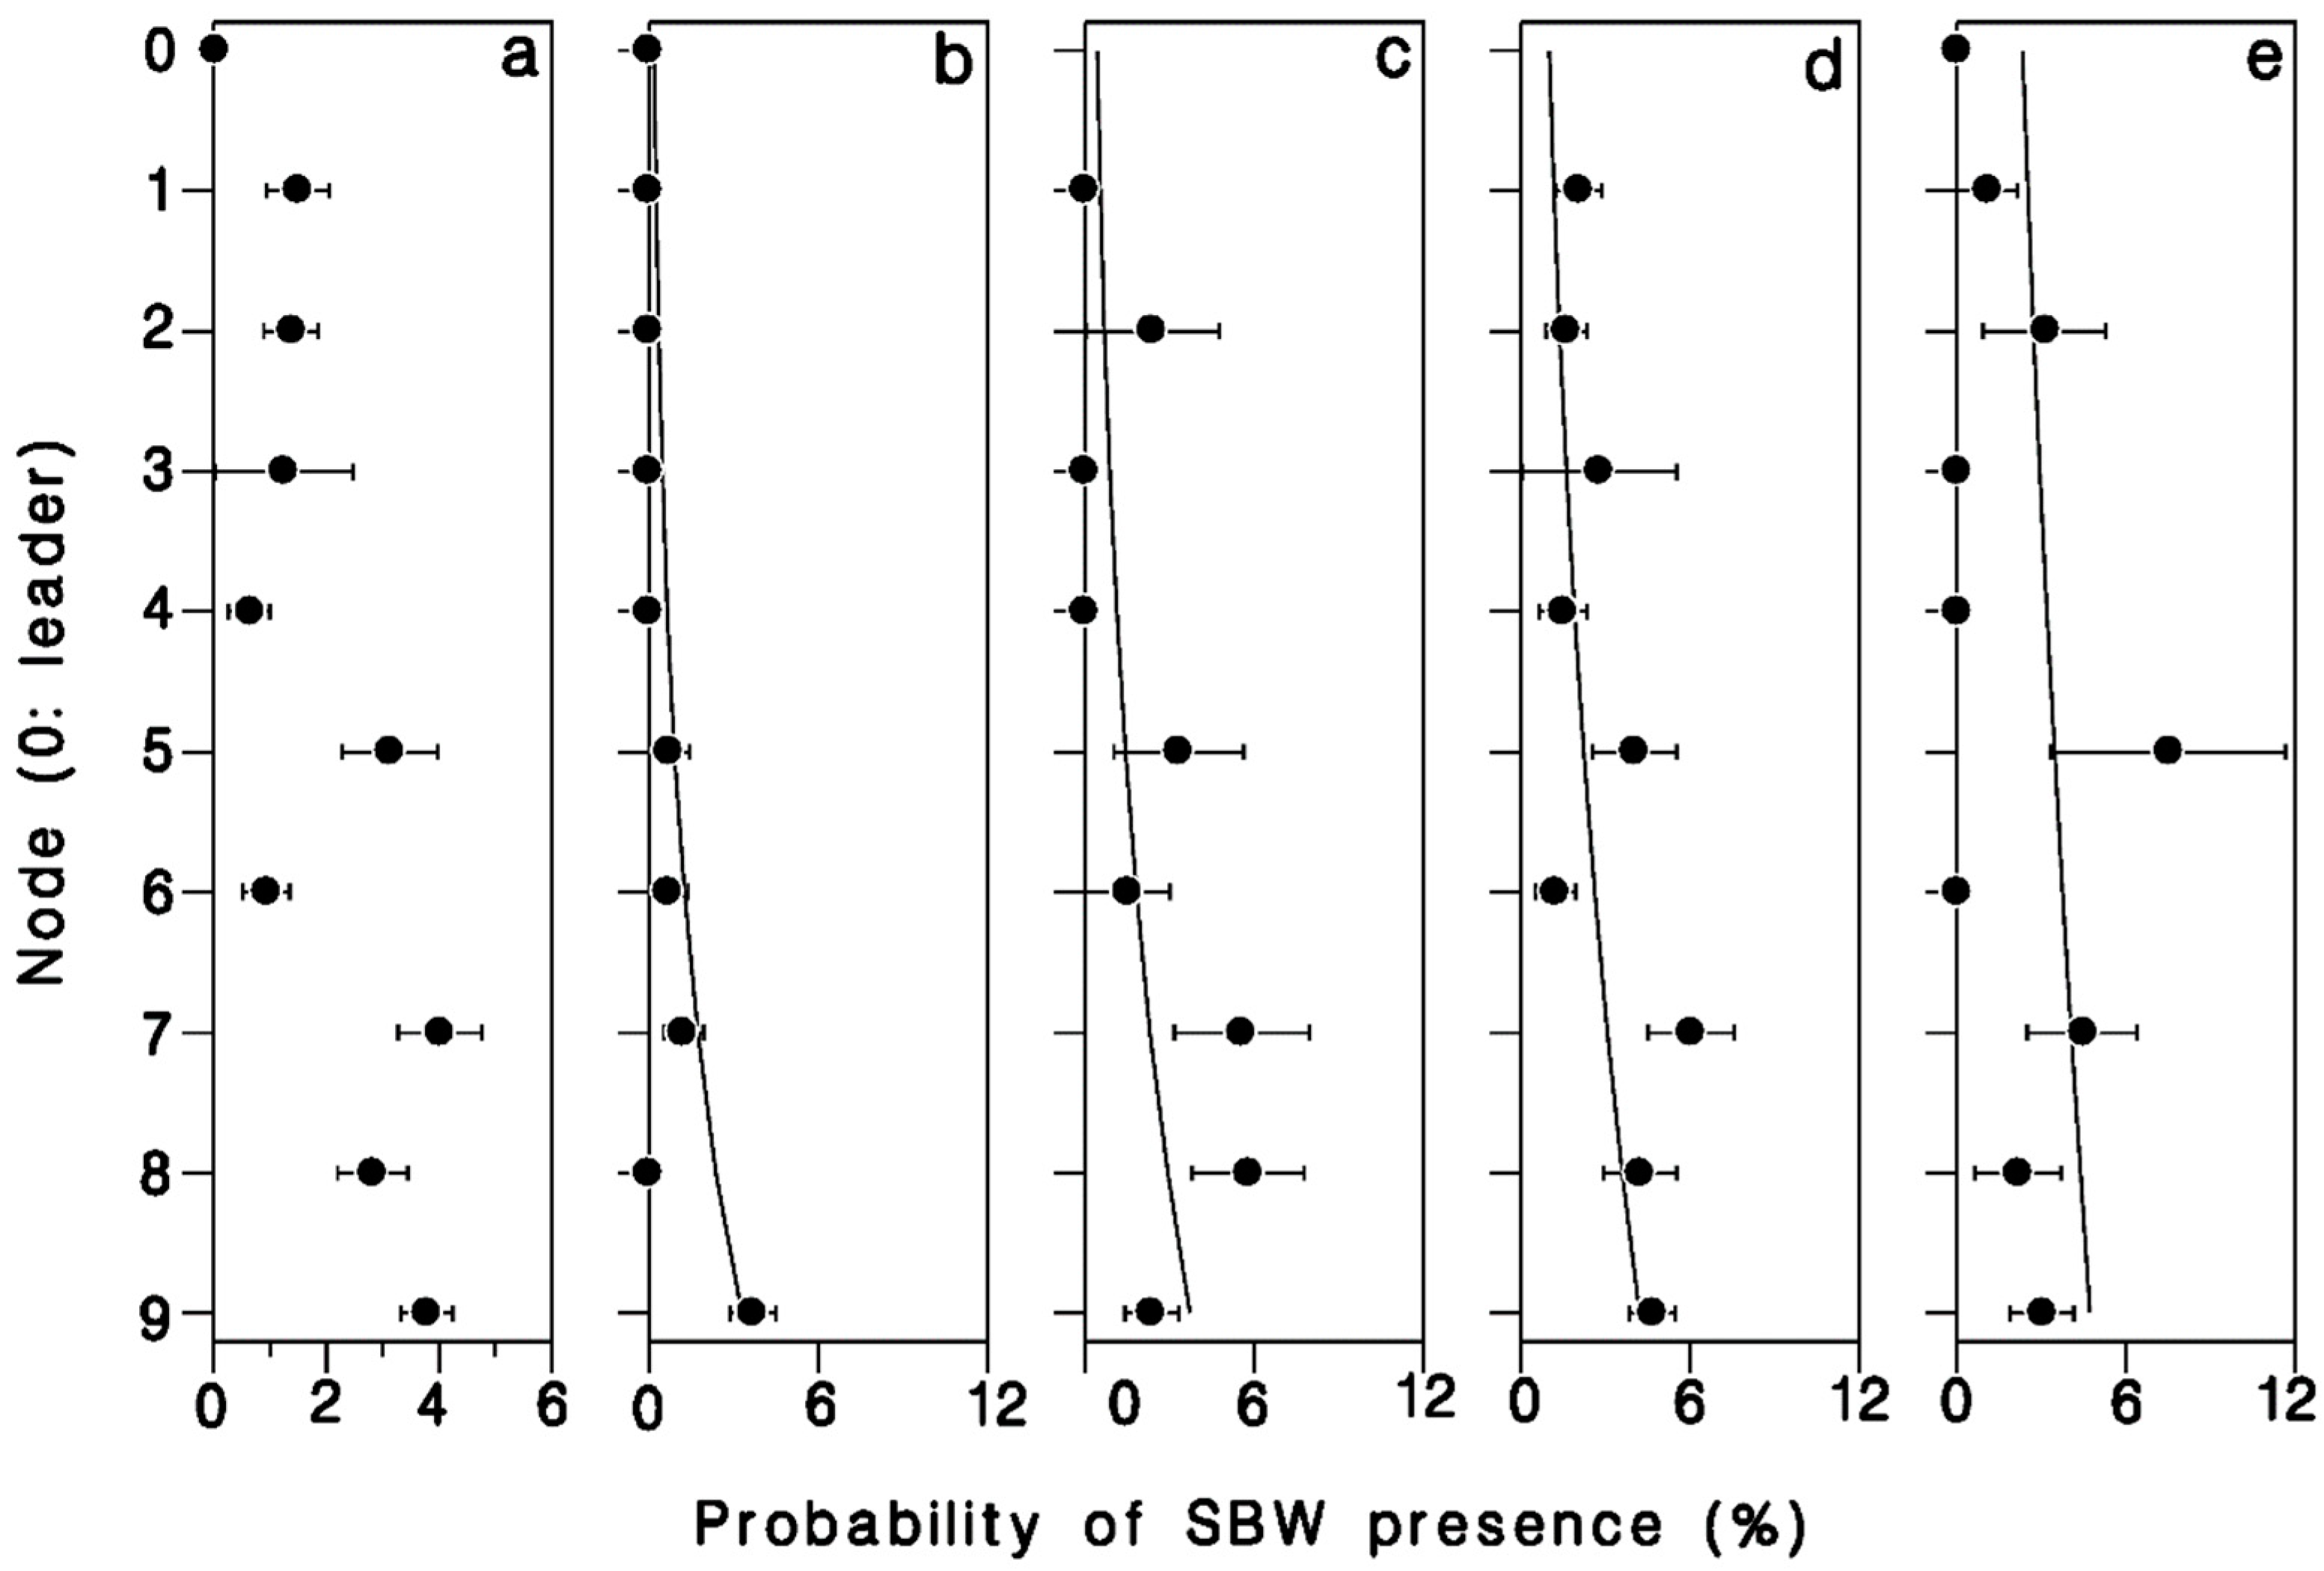
There was a strong relationship between position in the crown, number of buds in a cluster, and the probability of infestation by budworm (Table 4). The odds of buds being infested with budworm increased nearly 6 × from leader to 9th node (Wald’s χ2 = 11.95; df = 1; p = 0.001; Figure 6a). Buds were also 30% more likely to be budworm infested for each additional bud per cluster (Wald’s χ2 = 8.73; df = 1; p = 0.003; Figure 6). There was a significant interaction between bud-cluster size and crown level in the likelihood of budworm infestation (Wald’s χ2 = 4.75; df = 1; p = 0.029). Budworm larvae were increasingly more likely to settle in single buds or double-bud clusters further down in the live crown (Figure 6a,b), whereas the likelihood of budworm infestation in clusters of three or more buds was less dependent on their position in the crown.
Table 4.
Logistic regression of budworm presence in buds in response to position in the crown (node) and number of buds in a cluster. Based on a total of 150 budworm larvae found in 5803 buds in the first 10 nodes of the live crown of a mature, open-grown balsam fir tree, Black Sturgeon Lake, 1980.
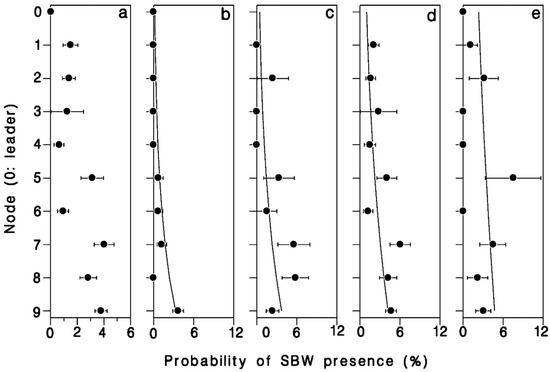
Figure 6.
Proportion of buds harboring a spruce budworm larva, (a) overall, (b) single buds, (c) buds in pairs, (d) buds in clusters of 3, and (e) buds in clusters of 4 or more. Horizontal error bars: binomial standard deviation. Based on a total of 150 budworm larvae found in 5803 buds in the first 10 nodes in the crown of a mature, open-grown balsam fir tree at Black Sturgeon Lake in 1980.
4. Discussion and Conclusions
Our measurements indicate that the density of foliage (number of buds, foliage weight or branch surface area) that is palatable to spruce budworm larvae (i.e., annual growth) is higher on mature balsam fir than on white spruce, or on young, open grown trees of either species. This is compatible with the detailed observations of Wu et al. [34]. In addition, growing shoots tend to grow more frequently in clusters on balsam fir than on white spruce. Spruce budworm larvae either prefer to establish feeding sites in buds growing in clusters rather than in single buds, or survive better in them, at least on balsam fir. It was noticed by early workers on spruce budworm that “sixth-instar budworms normally web two or more shoots together, forming a feeding shelter” [35]. This would seem more easily done on a host tree that tends to grow its shoots in clusters. This preference may result from an interaction between the position of bud clusters on branches and the phototropic responses of larvae searching for feeding sites after spring emergence [36]. In balsam fir, bud clusters tend to occur in larger proportions at or near branch tips higher in the crown as a result of branch growth geometry [37]. The preference of budworm larvae for bud clusters may also be caused by a preference of larvae for larger or earlier-flushing terminal buds [38] through either behavioral adaptation or differential survival. Thus, not only does balsam fir foliage contain a higher proportion of growing foliage than white spruce, this foliage may also be distributed more favorably, because potential feeding sites composed of clustered buds are more common on balsam fir. These observations lead to the hypothesis that establishment of early larval feeding stages of the spruce budworm is favored on balsam fir over white spruce if only because of the higher relative abundance and more suitable distribution of growing foliage in the live crown. This difference in the density and clustering of buds between balsam fir and white spruce may explain some of the difference in vulnerability of these two host species to spruce budworm [16]. However, it is not clear that establishment of feeding sites, survival rates or performance of budworm larvae is better on balsam fir than on white spruce. White spruce shoots, while more often growing singly, are at least 30% heavier than balsam fir shoots [39]. They are also more nutritious [40]. Spruce budworm larvae also develop faster on white spruce than on balsam fir [12], in part because of microclimate [41].
Absolute density estimates of budworm populations per unit ground surface area can be obtained from relative density estimates (spruce budworm larvae, pupae, eggs per m2, kg or shoot at mid-crown) multiplied by estimates of the absolute amount of foliage (number of buds or current shoots, foliage surface area or weight) per unit ground area. Such estimates can be obtained from a survey of host trees where the DBH and the number of nodes in the live crown is known. These data can be used with Equations (12), (14) or (16) directly, depending on the units used to express relative density. Often times however, the number of nodes in the live crown is not known. Tree height information may be used to estimate the number of nodes through Equation (6), although it can be expected that this relationship will vary depending on stocking in closed-canopy stands. When no live crown or tree height information is available, Equations (13), (15) or (17) can be used to provide somewhat less precise estimates of the total amount of foliage per tree.
The measurements reported in this study were made on trees from a single location in northwestern Ontario, and as such may not be representative of all genetic and environmental sources of variation in tree architecture exhibited by balsam fir and white spruce throughout their vast area of distribution in North America. However, our results are very consistent with observations made by others in New Brunswick, Canada, [21,29]. In addition, the trees that we measured had not suffered significant defoliation damage from spruce budworm. The number of buds, and probably foliage surface area and weight, are altered by severe defoliation damage [42,43,44]. Therefore, it is likely that modifications to the equations reported here would be needed for use in heavily defoliated stands.
Author Contributions
Conceptualization, investigation, resources; supervision, project administration, funding acquisition, C.J.S. and J.R.; methodology, formal analysis, data curation, writing, visualization, J.R. All authors have read and agreed to the published version of the manuscript.
Funding
This research was funded entirely by Natural Resources Canada and received no external funding.
Institutional Review Board Statement
Not applicable.
Informed Consent Statement
Not applicable.
Data Availability Statement
Data supporting reported results can be found at https://open.canada.ca/data/en/dataset/ed78394d-97a6-4688-b934-8f1aac82484a (accessed on 28 November 2021). Doi:10.23687/ed78394d-97a6-4688-b934-8f1aac82484a.
Conflicts of Interest
The authors declare no conflict of interest.
References
- Morris, R.F. The dynamics of epidemic spruce budworm populations. Mem. Entomol. Soc. Can. 1963, 95, 1–12. [Google Scholar] [CrossRef] [Green Version]
- Royama, T. Population dynamics of the spruce budworm, Choristoneura fumiferana. Ecol. Monogr. 1984, 54, 429–462. [Google Scholar] [CrossRef] [Green Version]
- Royama, T. Analytical Population Dynamics; Chapman & Hall: New York, NY, USA, 1992; p. 371. [Google Scholar] [CrossRef]
- Nealis, V.G. Comparative ecology of conifer-feeding spruce budworms (Lepidoptera: Tortricidae). Can. Entomol. 2016, 148 (Suppl. S1), S22–S57. [Google Scholar] [CrossRef] [Green Version]
- Pureswaran, D.S.; Johns, R.; Heard, S.B.; Quiring, D. Paradigms in eastern spruce budworm (Lepidoptera: Tortricidae) population ecology: A century of debate. Environ. Entomol. 2016, 45, 1333–1342. [Google Scholar] [CrossRef] [PubMed]
- Royama, T.; Eveleigh, E.S.; Morin, J.R.B.; Pollock, S.J.; McCarthy, P.C.; McDougall, G.A.; Lucarotti, C.J. Mechanisms underlying spruce budworm outbreak processes as elucidated by a 14-year study in New Brunswick, Canada. Ecol. Monogr. 2017, 87, 600–631. [Google Scholar] [CrossRef]
- Johns, R.C.; Bowden, J.J.; Carleton, D.R.; Cooke, B.J.; Edwards, S.; Emilson, E.J.S.; James, P.M.A.; Kneeshaw, D.; MacLean, D.A.; Martel, V.; et al. Conceptual framework for the spruce budworm early intervention strategy: Can outbreaks be stopped? Forests 2019, 10, 910. [Google Scholar] [CrossRef] [Green Version]
- MacLean, D.A.; Amireault, P.; Amos-Binks, L.; Carleton, D.; Hennigar, C.; Johns, R.; Régnière, J. Positive results of an early intervention strategy to suppress a spruce budworm outbreak after five years of trials. Forests 2019, 10, 448. [Google Scholar] [CrossRef] [Green Version]
- Cooke, B.J.; Nealis, V.G.; Régnière, J. Insect defoliators as periodic disturbances in northern forest ecosystems. In Plant Disturbance Ecology, 2nd ed.; Johnson, E.A., Miyanishi, K., Eds.; Academic Press: Amsterdam, The Netherlands, 2020; pp. 423–461. [Google Scholar] [CrossRef]
- Greenbank, D.O. Host species and the spruce budworm. Mem. Entomol. Soc. Can. 1963, 31, 219–223. [Google Scholar] [CrossRef]
- Blais, J.R. Some relationships of the spruce budworm, Choristoneura fumiferana (Clem.) to black spruce, Picea mariana (Moench) Voss. For. Chron. 1957, 33, 364–372. [Google Scholar] [CrossRef] [Green Version]
- Nealis, V.G.; Régnière, J. Insect-host relationships influencing disturbance by the spruce budworm in a boreal mixedwood forest. Can. J. For. Res. 2004, 34, 1870–1882. [Google Scholar] [CrossRef] [Green Version]
- Régnière, J.; Saint-Amant, R.; Duval, P. Predicting insect distributions under climate change based on physiological responses: Spruce budworm as an example. Biol. Inv. 2012, 14, 1–16. [Google Scholar] [CrossRef]
- Pureswaran, D.S.; De Grandpré, L.; Paré, D.; Taylor, A.; Barrette, M.; Morin, H.; Régnière, J.; Kneeshaw, D. Climate-induced changes in host-insect phenology may drive ecological state-shift in boreal forests. Ecology 2015, 96, 1480–1491. [Google Scholar] [CrossRef]
- Pureswaran, D.S.; Neau, M.; Marchand, M.; De Grandpré, L.; Kneeshaw, D. Phenological synchrony between eastern spruce budworm and its host trees increases with warmer temperatures in the boreal forest. Ecol. Evol. 2019, 9, 576–586. [Google Scholar] [CrossRef] [PubMed]
- Hennigar, C.R.; MacLean, D.A.; Quiring, D.T.; Kershaw, J.A., Jr. Differences in spruce budworm defoliation among balsam fir and white, red, and black spruce. For. Sci. 2008, 54, 158–166. [Google Scholar] [CrossRef]
- Sanders, C.J. A Summary of Current Techniques for Sampling Spruce Budworm Populations and Estimating Defoliation in Eastern Canada. Natural Resources Canada, Canadian Forest Service, Sault Ste. Marie, ON, Canada., Information Report O-X-306. 33p. 1980. Available online: https://cfs.nrcan.gc.ca/publications/download-pdf/8982 (accessed on 29 March 2022).
- Sanders, C.J. Monitoring spruce budworm population density with sex pheromone traps. Can. Entomol. 1988, 120, 175–183. [Google Scholar] [CrossRef]
- Régnière, J.; Lysyk, T.J.; Auger, M. Population density estimation of spruce budworm, Chorsitoneura fumiferana (Clem.) (Lepidoptera: Tortricidae) on balsam fir and white spruce from 45-cm mid-crown branch tips. Can. Entomol. 1989, 121, 267–281. [Google Scholar] [CrossRef]
- Allen, D.C.; Dorais, L.; Kettela, E.G. Survey and detection. In Managing the Spruce Budworm in Eastern North America. Spruce Budworms Handbook; Schmitt, D.M., Grimble, D., Searcy, J.L., Eds.; US Department of Agriculture, Forest Service, Cooperative State Research Service: Chicago, IL, USA, 1984; 620, pp. 23–36. Available online: https://handle.nal.usda.gov/10113/CAT89231731 (accessed on 29 March 2022).
- Morris, R.F. The development of sampling techniques for forest insect defoliators, with particular reference to the spruce budworm. Can. J. Zool. 1955, 33, 225–294. [Google Scholar] [CrossRef]
- Régnière, J.; Nealis, V.G. Ecological mechanisms of population change during outbreaks of the spruce budworm. Ecol. Entomol. 2007, 32, 461–477. [Google Scholar] [CrossRef]
- Nealis, V.; Régnière, J. Ecology of outbreak populations of the western spruce budworm. Ecosphere 2021, 12, e03667. [Google Scholar] [CrossRef]
- Jennings, D.T.; Houseweart, M.W.; Dimond, J.B. Dispersal losses of early-instar spruce budworm (Lepidoptera: Tortricidae) larvae in strip clearcut and dense spruce-fir forests of Maine. Environ. Entomol. 1983, 12, 1787–1792. [Google Scholar] [CrossRef]
- Nealis, V.G.; Régnière, J. The risk of dispersal in western spruce budworm. Agric. For. Entomol. 2009, 11, 213–223. [Google Scholar] [CrossRef]
- Morris, R.F.; Cheshire, W.F.; Miller, C.A.; Mott, G.D. The numerical response of avian and mammalian predators during a gradation of the spruce budworm. Ecology 1958, 39, 487–494. [Google Scholar] [CrossRef]
- Régnière, J.; Venier, L.; Welsh, D. Avian predation in a declining outbreak population of the spruce budworm, Choristoneura fumiferana (Lepidoptera: Tortricidae). Insects 2021, 12, 720. [Google Scholar] [CrossRef] [PubMed]
- Régnière, J.; Nealis, V.G. The fine-scale population dynamics of spruce budworm: Survival of early instars related to forest condition. Ecol. Entomol. 2008, 33, 362–373. [Google Scholar] [CrossRef]
- Miller, C.A. The feeding impact of spruce budworm on balsam fir. Can. J. For. Res. 1977, 7, 76–84. [Google Scholar] [CrossRef]
- Kleinschmidt, S.; Baskerville, G.L.; Solomon, D.S. Foliage Weight Distribution in the Upper Crown of Balsam Fir; USDA Forest Service, Northeastern Forest Experiment Station: Broomann, PA, USA, 1980. [CrossRef]
- Régnière, J.; Cooke, B.J.; Béchard, A.; Dupont, A.; Therrien, P. Dynamics and management of rising outbreak spruce budworm populations. Forests 2019, 10, 748. [Google Scholar] [CrossRef] [Green Version]
- Lethiecq, J.-L.; Régnière, J. Comparative Description of the Physical Environment and Vegetation of Six Sites Used by the Canadian Forestry Service in the Study of Spruce Budworm Population Dynamics. Natural Resources Canada, Canadian Forest Service, Quebec City, QC, Canada., Information Report LAU-X-83, 1988, 46p. Available online: https://cfs.nrcan.gc.ca/publications/download-pdf/21262 (accessed on 29 March 2022).
- Anderson, T.W.; Darling, D.A. Asymptotic theory f certain “goodness-of-fit” criteria based on stochastic processes. Ann. Math. Stat. 1952, 23, 193–212. [Google Scholar] [CrossRef]
- Wu, Y.; MacLean, D.A.; Hennigar, C.; Taylor, A.R. Interactions among defoliation level, species, and soil richness determine foliage production during and after simulated spruce budworm attack. Can. J. For. Res. 2020, 50, 565–580. [Google Scholar] [CrossRef]
- Wellington, W.G. The light reactions of the spruce budworm, Choristoneura fumiferana Clemens (Lepidoptera: Toritricidae). Can. Entomol. 1948, 80, 56–82. [Google Scholar] [CrossRef]
- Powell, G.R. Patterns of development in Abies balsamea crowns and effects of megastrobilus production on shoots and buds. Can. J. For. Res. 1977, 7, 498–509. [Google Scholar] [CrossRef]
- Powell, G.R. Postdormancy development and growth of microsporangiate and megasporangiate strobili of Abies balsamea. Can. J. Bot. 1970, 48, 419–428. [Google Scholar] [CrossRef]
- Talerico, R.L. Summary of life history and hosts of the spruce budworms. In Proceedings. Forest Defoliator-Host Interactions: A Comparison between Gypsy Moth and Spruce Budworms; General Technical Report NE-85; USDA Forest Service, Northeastern Station: Radnor, PA, USA, 1979; pp. 1–4. Available online: https://www.fs.fed.us/nrs/pubs/gtr/gtr_ne85.pdf (accessed on 29 March 2022).
- Régnière, J.; You, M. A simulation model of spruce budworm (Lepidoptera: Tortricidae) feeding on balsam fir and white spruce. Ecol. Model. 1991, 54, 277–297. [Google Scholar] [CrossRef]
- Mattson, W.J.; Haack, R.A.; Lawrence, R.K.; Slocum, S.S. Considering the nutritional ecology of the spruce budworm in its management. For. Ecol. Manag. 1991, 39, 183–210. [Google Scholar] [CrossRef]
- Lysyk, T.J. Stochastic model of eastern spruce budworm (Lepidoptera: Tortricidae) phenology on white spruce and balsam fir. J. Econ. Entomol. 1989, 82, 1161–1168. [Google Scholar] [CrossRef]
- Piene, H. The sensitivity of young white spruce to budworm defoliation. North. J. Appl. For. 1991, 8, 168–171. [Google Scholar] [CrossRef]
- Piene, H.; MacLean, D.A. Spruce budworm defoliation and growth loss in young balsam fir: Patterns of shoot, needle and foliage weight production over a nine-year outbreak cycle. For. Ecol. Manag. 1999, 123, 115–133. [Google Scholar] [CrossRef]
- Piene, H.; MacLean, D.A.; Landry, M. Spruce budworm defoliation and growth loss in young balsam fir: Relationships between volume growth and foliage weight in spaced and unspaced, defoliated and protected stands. For. Ecol. Manag. 2003, 179, 37–53. [Google Scholar] [CrossRef]


Publisher’s Note: MDPI stays neutral with regard to jurisdictional claims in published maps and institutional affiliations. |
© 2022 by the authors. Licensee MDPI, Basel, Switzerland. This article is an open access article distributed under the terms and conditions of the Creative Commons Attribution (CC BY) license (https://creativecommons.org/licenses/by/4.0/).