Abstract
Wood is complex in its chemical composition that has an important influence on its chemical behavior and mechanical strength. The complexity is reflected in the ultrastructure of the wood cell wall. In particular, the concentration of main components (cellulose, hemicelluloses and lignin) changes depending on many factors such as the different type or parts of wood, and varies in different cell wall layers. From an ultrastructural standpoint, we describe the current level of knowledge about chemical characteristics of the wood cell walls. The information of distribution of main components in the cell walls of normal wood, reaction wood and water-logged archaeological wood, the cellulose microfibrils orientation, and the interactions between main components were presented based on the use of advanced techniques including transmission electron microscopy, scanning electron microscopy, spectral imaging and nuclear magnetic resonance. In addition, the chemical changes of the wood cell wall during pretreatment are discussed. This mini-review not only provides a better understanding of wood chemistry, but also brings new insights into cell wall recalcitrance.
1. Introduction
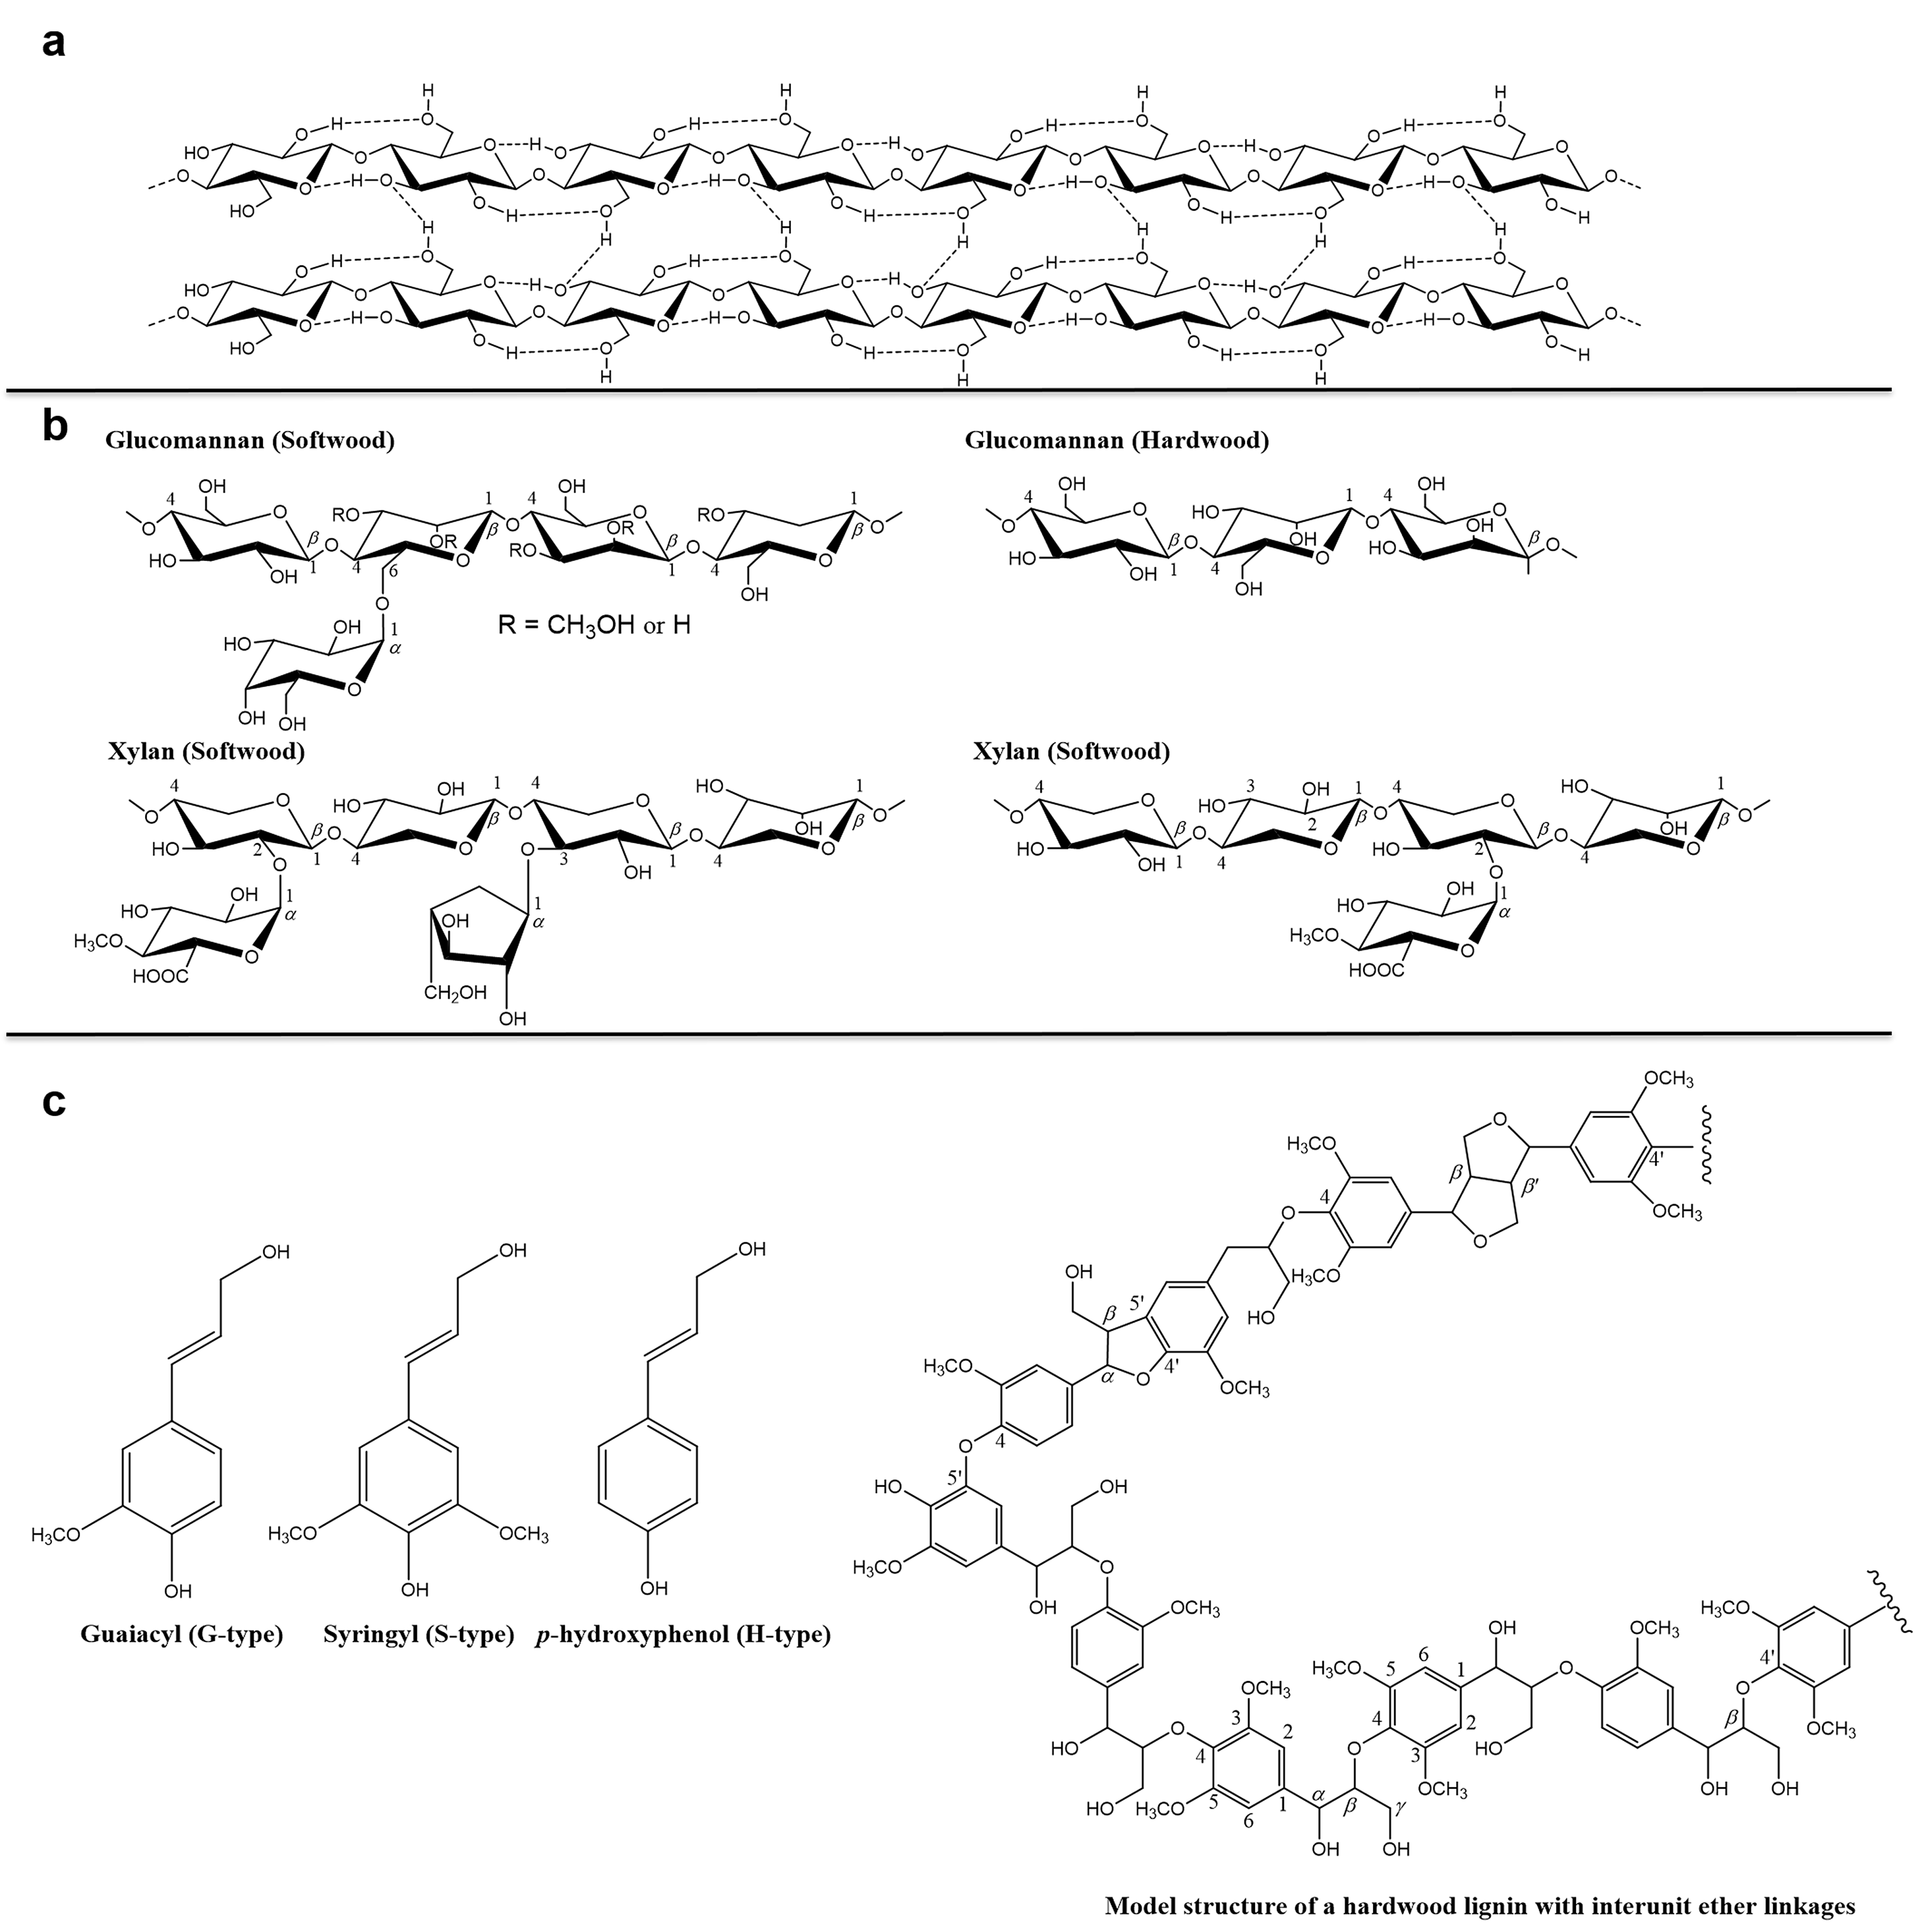
Wood cell wall is a multi-component system, mainly consisting of cellulose, hemicellulose and lignin, which differ from one another in chemical structure and physical properties. Figure 1a shows the main structure of cellulose, which is an unbranched linear polymer of -glucopyranoside residues connected by -(1,4)-glycosidic linkages [1]. The glycosidic link is stabilized and stiffened by two hydrogen bonds. One is between C6 and C2 hydroxyl, and the other is betweenC5 oxygen and C3 hydroxyl). Hemicelluloses are polysaccharides in the wood cell walls with equatorial β-(1,4)-linked backbones, such as xyloglucans, xylan, mannans and glucomannans, and β-(1,3 or 1,4)-glucans (Figure 1b) [2]. Lignin is an irregular organic polymer made up of phenyl-propane units with variable methoxyl group substitutions on the aromatic rings (Figure 1c) [3]. In addition, the wood contains pectin, starch and proteins and low molecular weight components such as extractives, water-soluble organic compounds as well as inorganic compounds (Table 1) [4]. The content of these components also varies in different parts of the same wood, such as earlywood and latewood, bark and xylem [5].
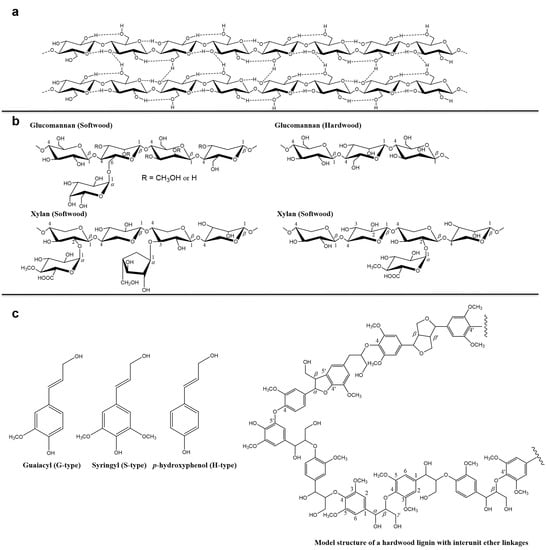
Figure 1.
Schematic structure of (a) cellulose, (b) hemicellulose and (c) lignin.

Table 1.
Typical chemical components of wood [4].
From the ultrastructure perspective, cellulose microfibrils form the cell wall framework embedded in the matrix of lignin and hemicelluloses, which have protective and structural functions conferring resistance to chemical, microbial or enzymatic deconstruction. The hemicellulose and lignin also have the function of binding the cellulose microfibrils, they act similarly to an adhesive [6]. The cell wall recalcitrance not only affects the utilization of timbers, but also becomes a major barrier to cost-efficient biofuel production from lignocellulose [7,8]. Elucidating the cell wall recalcitrance requires a detailed understanding of the cell wall ultrastructure and its chemical characteristics.
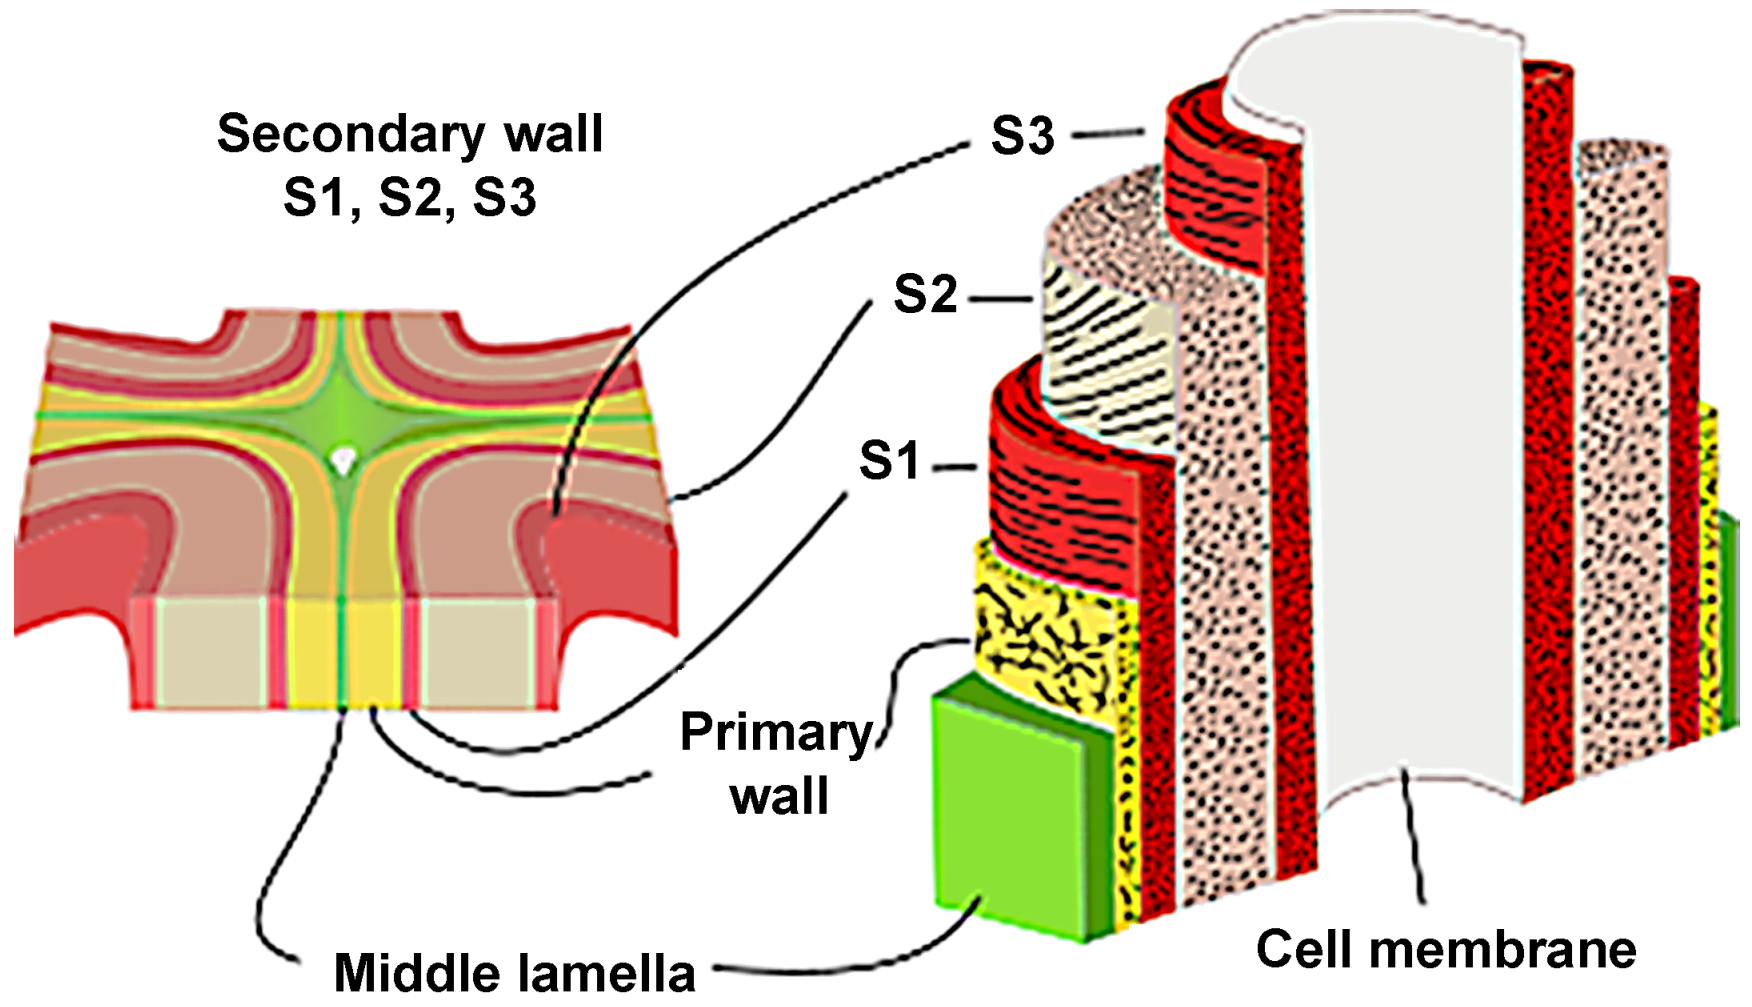
The wood cell wall is a heterogeneous material with a layered construction that generally consists of the middle lamella, primary wall and the secondary wall (Figure 2). The secondary wall (SW) is usually divided into three layers: an outside layer (S1), a middle layer (S2), and an interior layer (S3), where the S2 layer is the thickest and plays a key role in preserving wood’s strength [9]. The concentration of the components is variable in these layers, resulting in different chemical properties from layer to layer. To comprehensively investigate the chemical characteristics of wood cell wall, advanced techniques have been employed for bridging the gap between cell wall architecture and chemistry.

Figure 2.
Layered construction of wood cell wall.
Studies on the chemical characteristics of wood cell walls have a long history, spanning macro- to micro-scale dimensions. To understand the features of wood chemistry from a macro-scale dimension, researchers first looked at powders or fibers. In this case, various techniques such as chromatography, infrared spectroscopy, X-ray diffraction, and liquid nuclear magnetic resonance spectroscopy are used to characterize the molecular structure of wood components; however, most of the current methods are destructive. They rely on sequential extractions followed by compositional analysis, or they necessitate partial disintegration of wood tissue with environmentally harmful solvents. The physical status and molecular interactions of biomolecules are fundamentally disturbed by these events, potentially leading to erroneous conclusions about cell wall structure. Non-destructive characterisation approaches for wood inquiry are necessary to overcome this issue. Furthermore, the focus of study has shifted to smaller sizes in recent years.
Transmission electron microscopy (TEM) and scanning electron microscopy (SEM) are classic and powerful tools in elucidating ultrastructure of wood cell walls. They utilize electron beam instead of visible light. The electron beam is bent under the action of external magnetic field or electric field to form a “lens”. The wavelength of electron (the wavelength of 100 kV electrons is 0.0037 nm) is shorter than that of visible light (the wavelength of purple light is 400 nm) [10]. According to optical theory, the resolution limit of an electron microscope is much better than that of an optical microscope. By combining TEM with chemical staining or immunolabeling approaches, it is possible to describe the ultrastructure and chemical characteristics of wood cell wall simultaneously; however, these techniques require an extensive sample preparation, especially in ultra-thin sectioning and antibody preparation, and cannot deliver chemical information regarding the components directly. The spectroscopy coupled with microscopy, i.e., spectral imaging technique, overcomes this drawback [11]. In this case, the chemical characteristics are provided by spectra, and the architecture of the wood cell wall is visualized by a microscope. The techniques include ultraviolet microscope, fluorescence microscope, confocal laser scanning microscope, infrared microscope and confocal Raman microscope. The ultraviolet microscope is applied to study the distribution of lignin based on the characteristic absorption of lignin and phenols at 280 nm wavelength of ultraviolet light [12]. Because the conjugated groups of lignin have auto-fluorescence, the distribution of lignin can also be achieved by fluorescence microscopy and confocal laser scanning microscopy. Unfortunately, the distribution of polysaccharides cannot be obtained by these three techniques since the polysaccharides have no ultraviolet absorption effect and auto-fluorescence characteristics. In contrast, infrared microscope and confocal Raman microscope are prospective techniques that can directly provide molecular vibration spectra containing the chemical characteristics of all components and structural information simultaneously [13]. These two techniques employ different light source. The former uses continuous band in infrared region while the latter uses monochromatic laser. Limited by the diffraction, the spatial resolution of confocal Raman microscope is much better than that of infrared microscope. In conclusion, the electron microscopy brings us to the world of ultrastructure and the combination of microscopy and spectroscopy lends “color” to this world. Acquiring high-quality images is just the beginning of studying the ultrastructure and chemical characteristics of wood cell walls. Scientists are more interested in interpreting the secrets locked within images.
This mini-review summarized the chemical characteristics in wood cell walls with an emphasis on ultrastructure. From micro- to nano-scale, we discuss the patterns of main components distribution in the cell walls of normal wood, reaction wood and water-logged archaeological wood, the cellulose microfibrils orientation, and the interactions between main components. In addition, the chemical changes of wood cell walls during pretreatment are discussed. We hope that this mini-review will contribute to the knowledge of the interaction between the main components of the wood cell wall. One can pay more attention to the supramolecular structure of cellulose, hemicellulose and lignin. We believe that this is the fundamental challenge to overcome the recalcitrance of wood cell walls.
2. Distribution of Cellulose in Wood Cell Wall
The most prevalent natural polymer on the planet is cellulose, which is more plentiful in the secondary walls of wood cell walls as a structural material. Because the tight connection and partial chemical interaction between the components of the wood cell wall impede the extraction of cellulose from wood, a fairly thorough chemical treatment is required to achieve relatively pure cellulose [14]. In Table 2, Fengel summarized the distribution of the main components of the cell wall [15]. The results revealed that the different thicknesses of the S1 and of the S2 in springwood and in summerwood caused a different distribution of the polysaccharides. The concentration of polysaccharides in summerwood was higher in S2 compared to springwood; however, the chemical treatment essentially disrupts the physical state and molecular interactions of biomolecules, and thus may mislead our understanding of cell wall chemistry.
Table 2.
Distribution of the chemical components in the walls of softwood tracheids (spruce).
Infrared imaging and Raman imaging are non-destructive methods for investigation of cellulose distribution, as well as lignin and hemicelluloses distribution. They are completely complementary providing characteristic fundamental vibrations that are extensively used for the determination and identification of molecular structure. The Infrared and Raman features can be assigned not only to groups of cellulose, but also to hemicellulose and lignin. Table 3 and Table 4 show the band assignments of infrared and Raman spectroscopy, respectively [16,17]. The distribution of components can be visualized by integrating the intensity of characteristic spectral bands.
Table 3.
Assignments of infrared bands in spruce (Picea abies (L.) Karst.) [16].
Table 4.
Assignments of infrared bands in poplar (Populus nigra × Populus deltoids) [17].
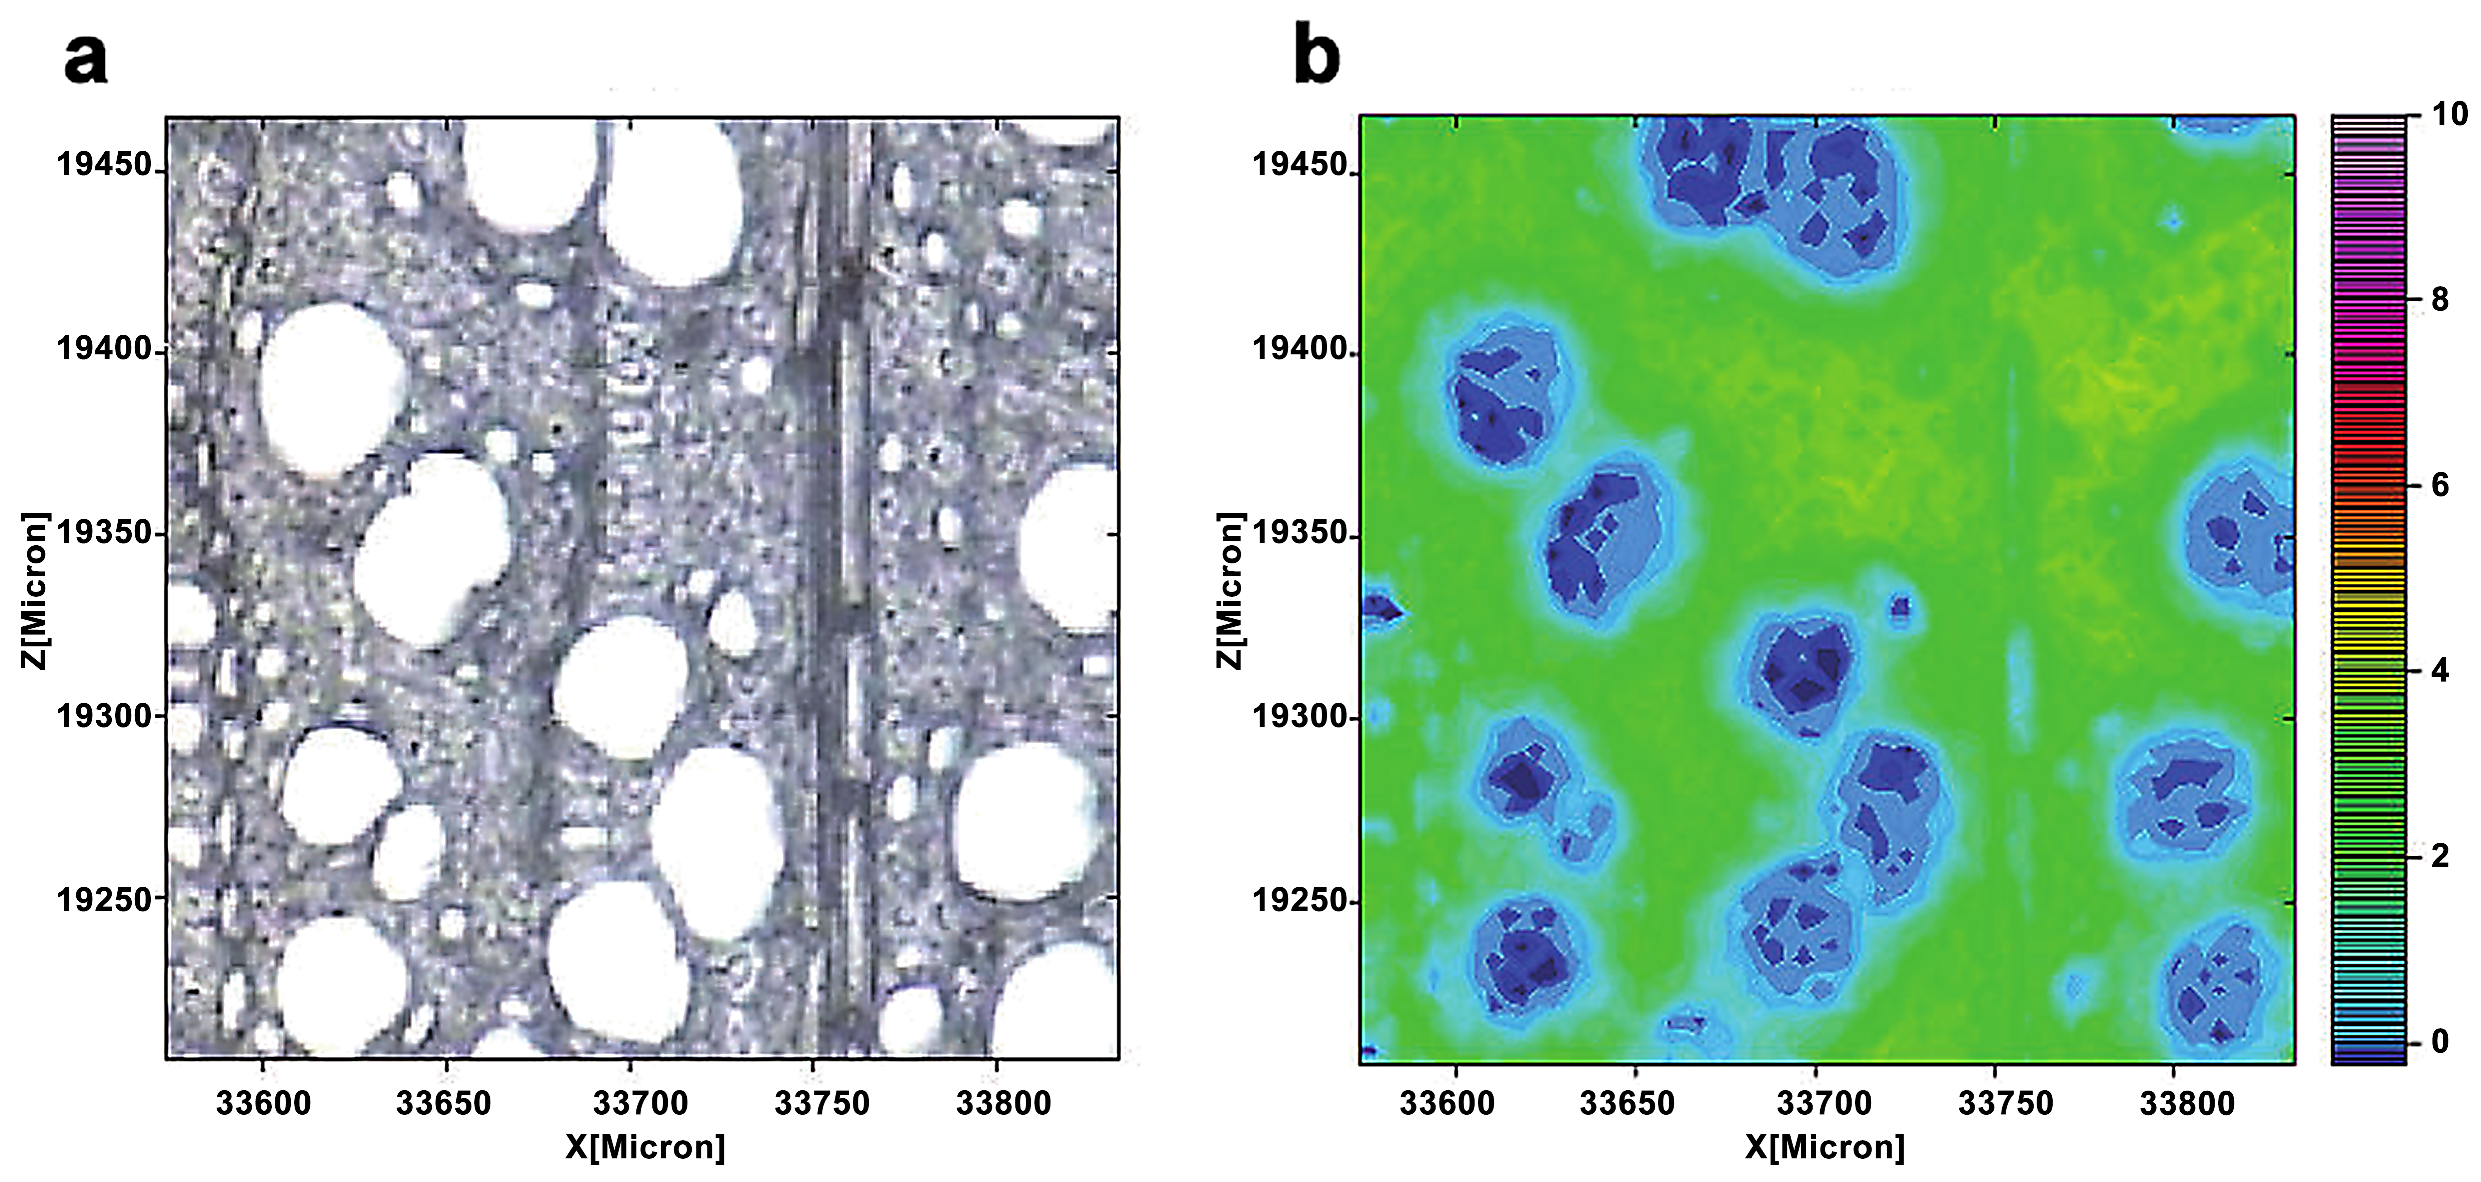
Müller and Polle employed a Fourier transform infrared microscope and a focal plane array detector to show the distribution of cellulose in European beech (Fungus sylvatica L.) wood. [18]. Each spectra included the normal range of wavenumbers for cellulose (1390–1350 cm−1) (Figure 3). The cellulose dispersion was rather uniform, as seen by wide patches of green coloring. However, the spatial resolution of infrared imaging is lower. The layered structure of an individual wall is often difficult to distinguish. This is owing to the usage of longer-wavelength infrared light as a light source for infrared imaging. The larger spot size increases the detection area and reduces the spatial resolution.

Figure 3.
A light microscopic image of a cross-section of a beech (a). The cellulose distribution was seen by combining the spectra images for the wavenumber range 1390–1350 cm−1 (b). From blue (low) to pink (high), the color scale denotes increasing cellulose concentration.
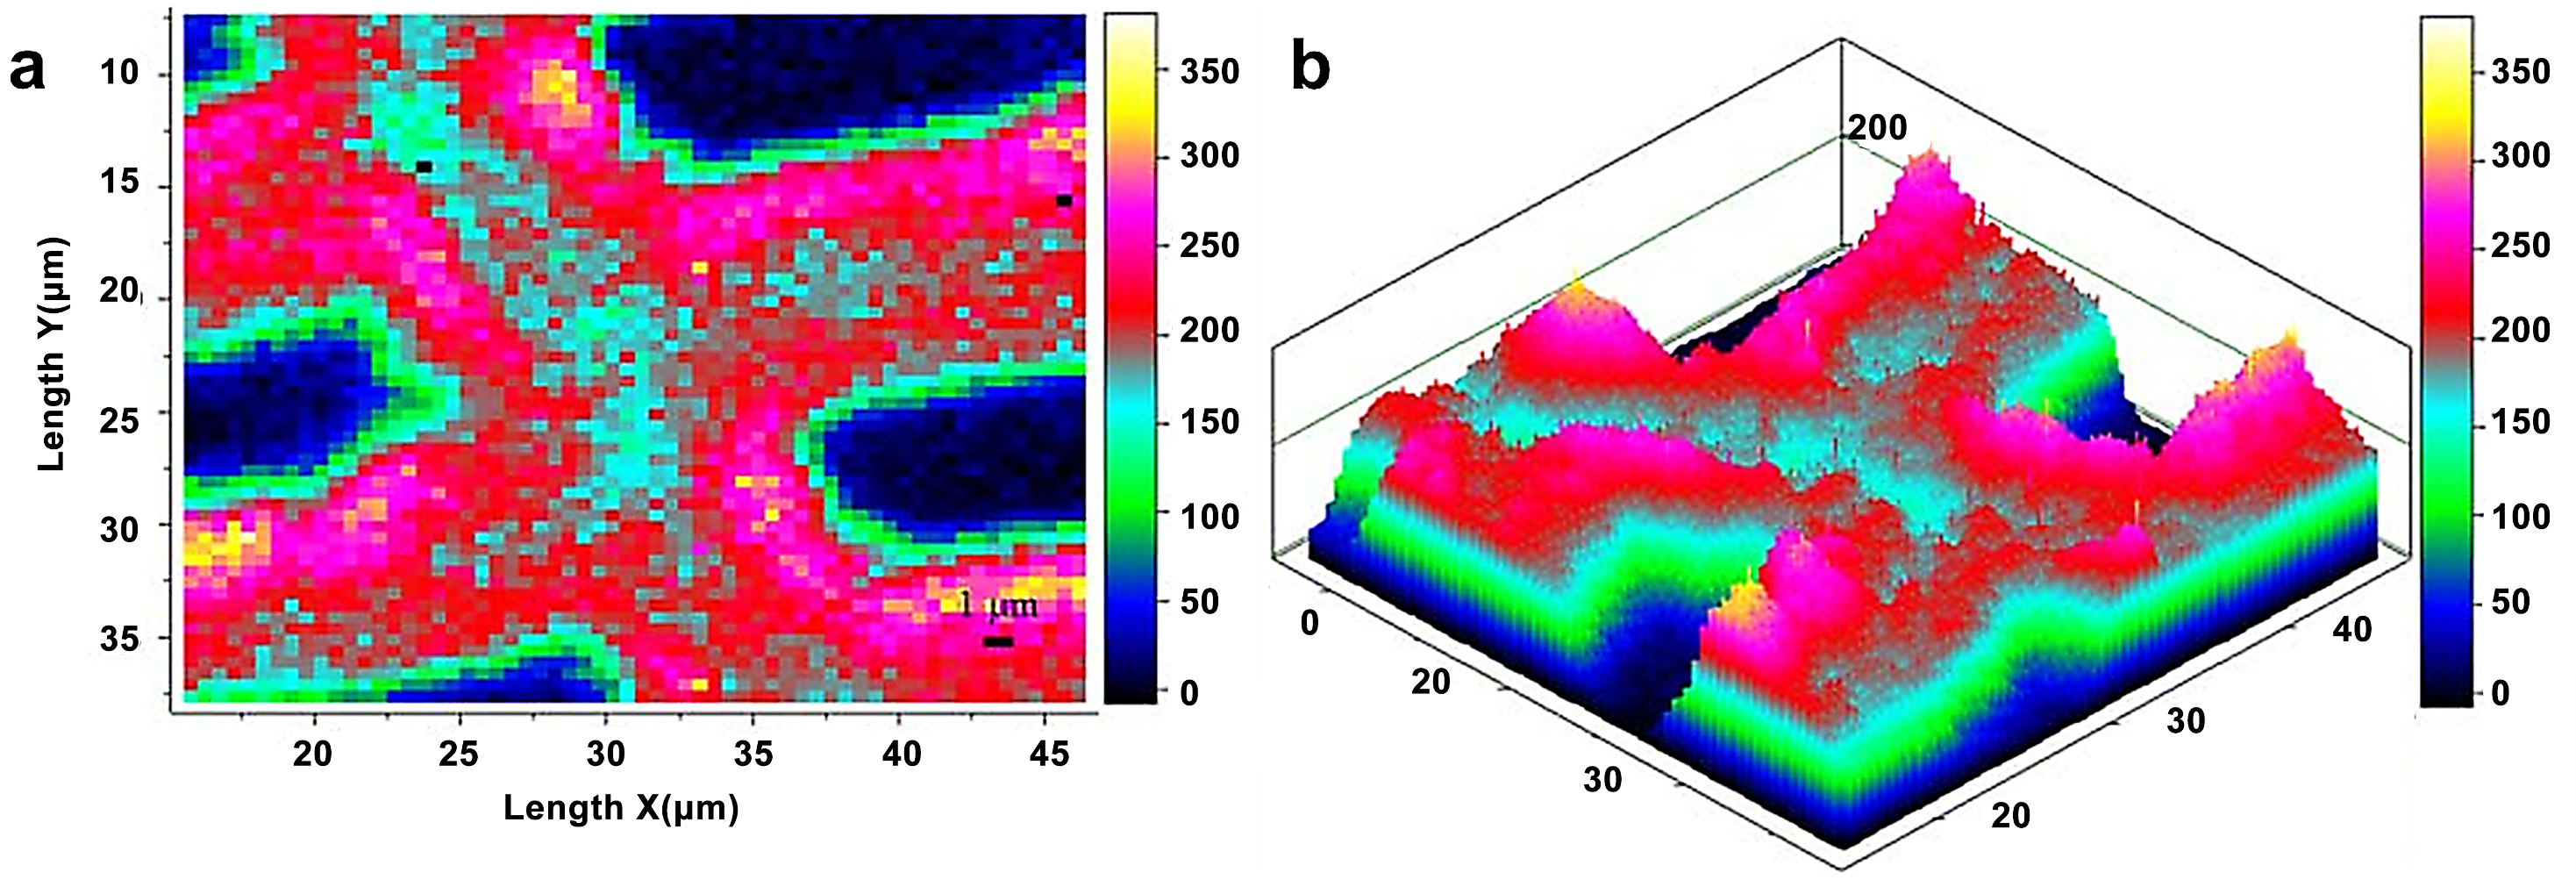
Raman imaging uses a visible laser with a shorter wavelength as the light source, which compensates for the spectral resolution limit in infrared imaging. Raman imaging for investigation of wood samples was described by Gierlinger et al. [19]. Agarwal et al. studied the distribution of cellulose in the fibers of Picea mariana by integrating the wavenumber range 1178–978 cm−1 (Figure 4) [20]. The distribution of cellulose was relatively uniform. Compared with CML and cell corner, the cellulose concentration of the S2 layer was.
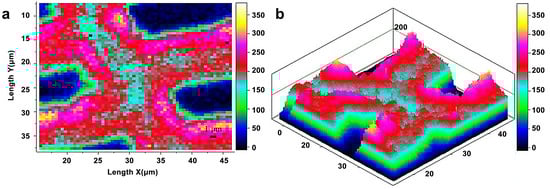
Figure 4.
Raman images of cellulose spatial distribution in cell wall: two-dimensional (a) and three-dimensional (b) representations. Bright white/yellow locations indicate high cellulose concentration; dark blue/black regions indicate very low concentration, e.g., lumen area.
3. Distribution of Hemicellulose in Wood Cell Wall
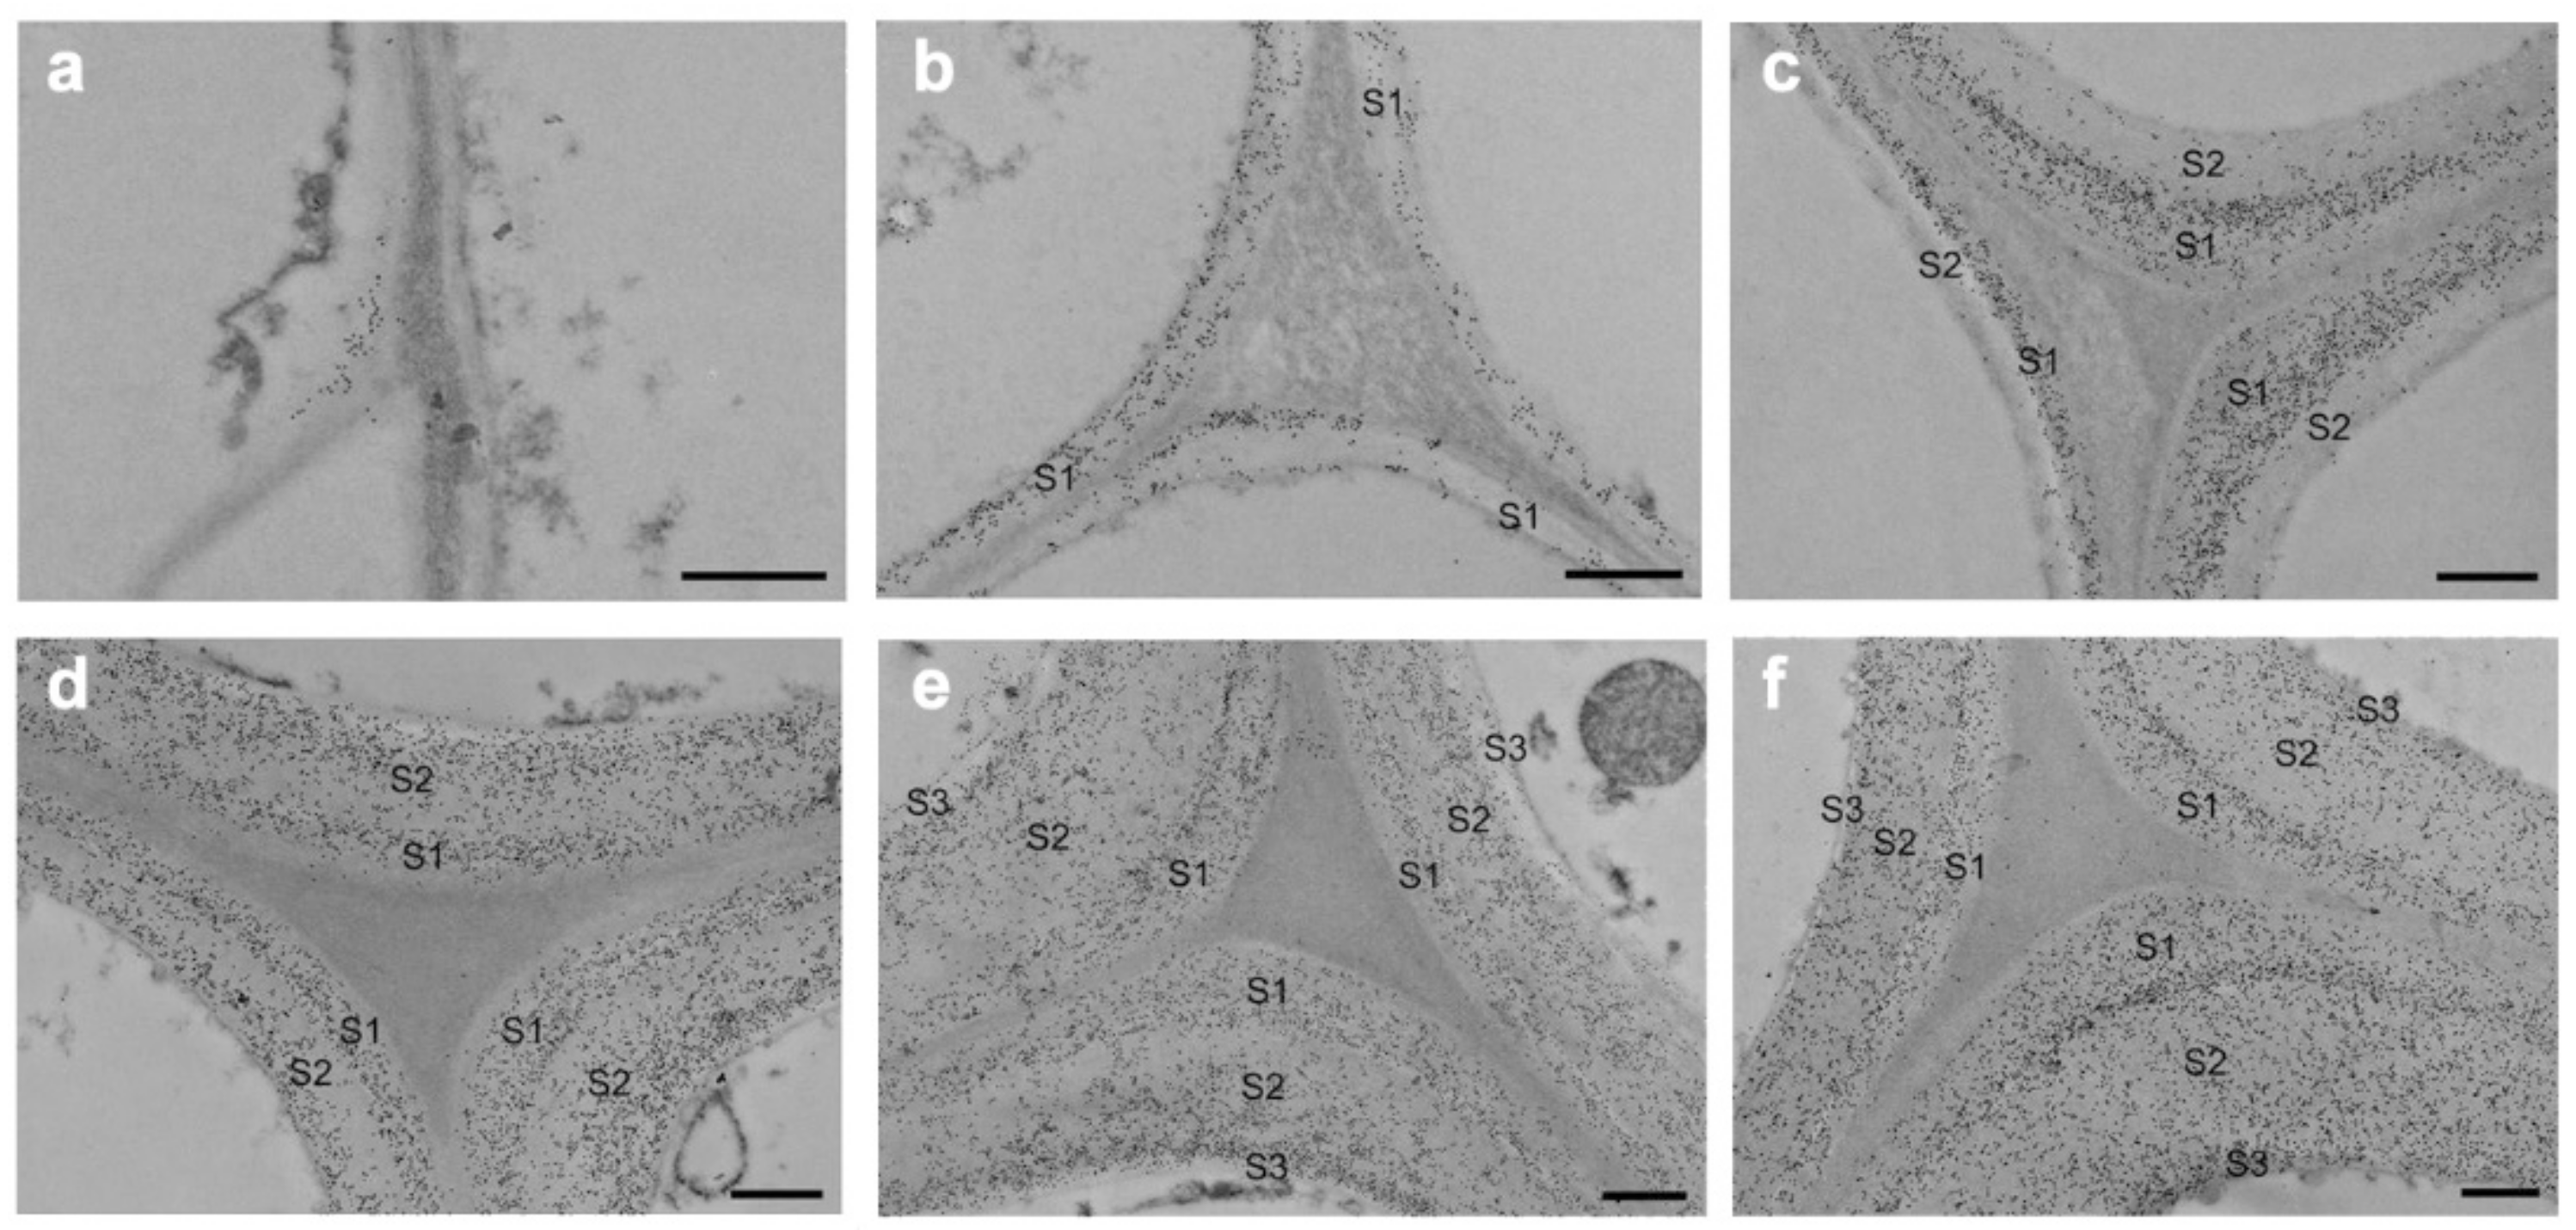
Hemicelluloses bind to cellulose and lignin in physical and chemical ways [21]. The detailed structure of the hemicelluloses and quantity differ greatly between the many varieties of wood and the different sorts of cells. The use of TEM and immunolabeling to study the deposition of major hemicelluloses throughout tissue development and differentiation yielded detailed results. The glucomannans are the most prevalent hemicelluloses in softwoods, with a linear backbone of randomly-(1,4)-linked D-glucosyl and D-mannosyl residues. The D-galactosyl residues are occasionally connected to the backbone with-(1,6)-glycosidic linkages, and the glucosyl and mannosyl units are roughly 1:3. Except glucomannans’ galactosyl side chain, softwood glucomannans also contain partially substituted hydroxyl groups with O-acetyl groups at C-2 and C-3 of the mannosyl residues [22]. Ruel and Joseleau employed the enzyme-gold complex approach to show that glucomannans are mostly found in the secondary wall of the spruce (Picea abies) but not in the compound middle lamella (primary wall plus middle lamella, CML) [23]. Immunogold labeling was used to analyze the distribution of glucomannans in Chamaecyparis obtuse’s differentiating tracheids [24]. The glucomannans were discovered to be limited to the secondary wall of tracheids. During cell wall construction, the labeling density momentarily rose and subsequently dropped in the outer and inner layers of the secondary wall. Kim et al. applied immunogold labeling coupled with TEM to describe the precise geographical and temporal distribution of glucomannans in differentiating earlywood tracheids of Cryptomeria japonica (Figure 5) [25]. Glucomannans started to build up in the cell corner early in the S1 production process, and their distribution in the cell wall was uneven. In mature tracheids, the boundary between the S1 and S2 layers and the innermost part of the cell wall presented stronger labeling than other parts of the cell wall.
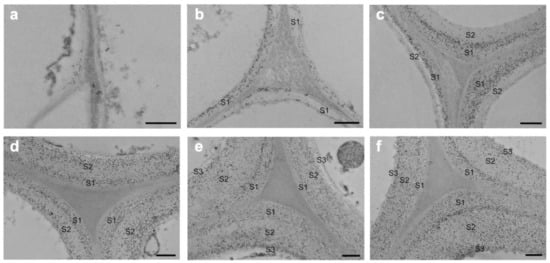
Figure 5.
Immunogold localization of glucomannans in Cryptomeria japonica tracheids that are differentiating and differentiated: (a) tracheids in the early stages of S1 development; (b) tracheids in the formation stage of S1 layer; (c) tracheids in the early stages of S2 development; (d) tracheids in the formation stage of S2layer; (e) tracheids in the early stages of S3 development; (f) mature tracheids. Bar = 500 nm [16].
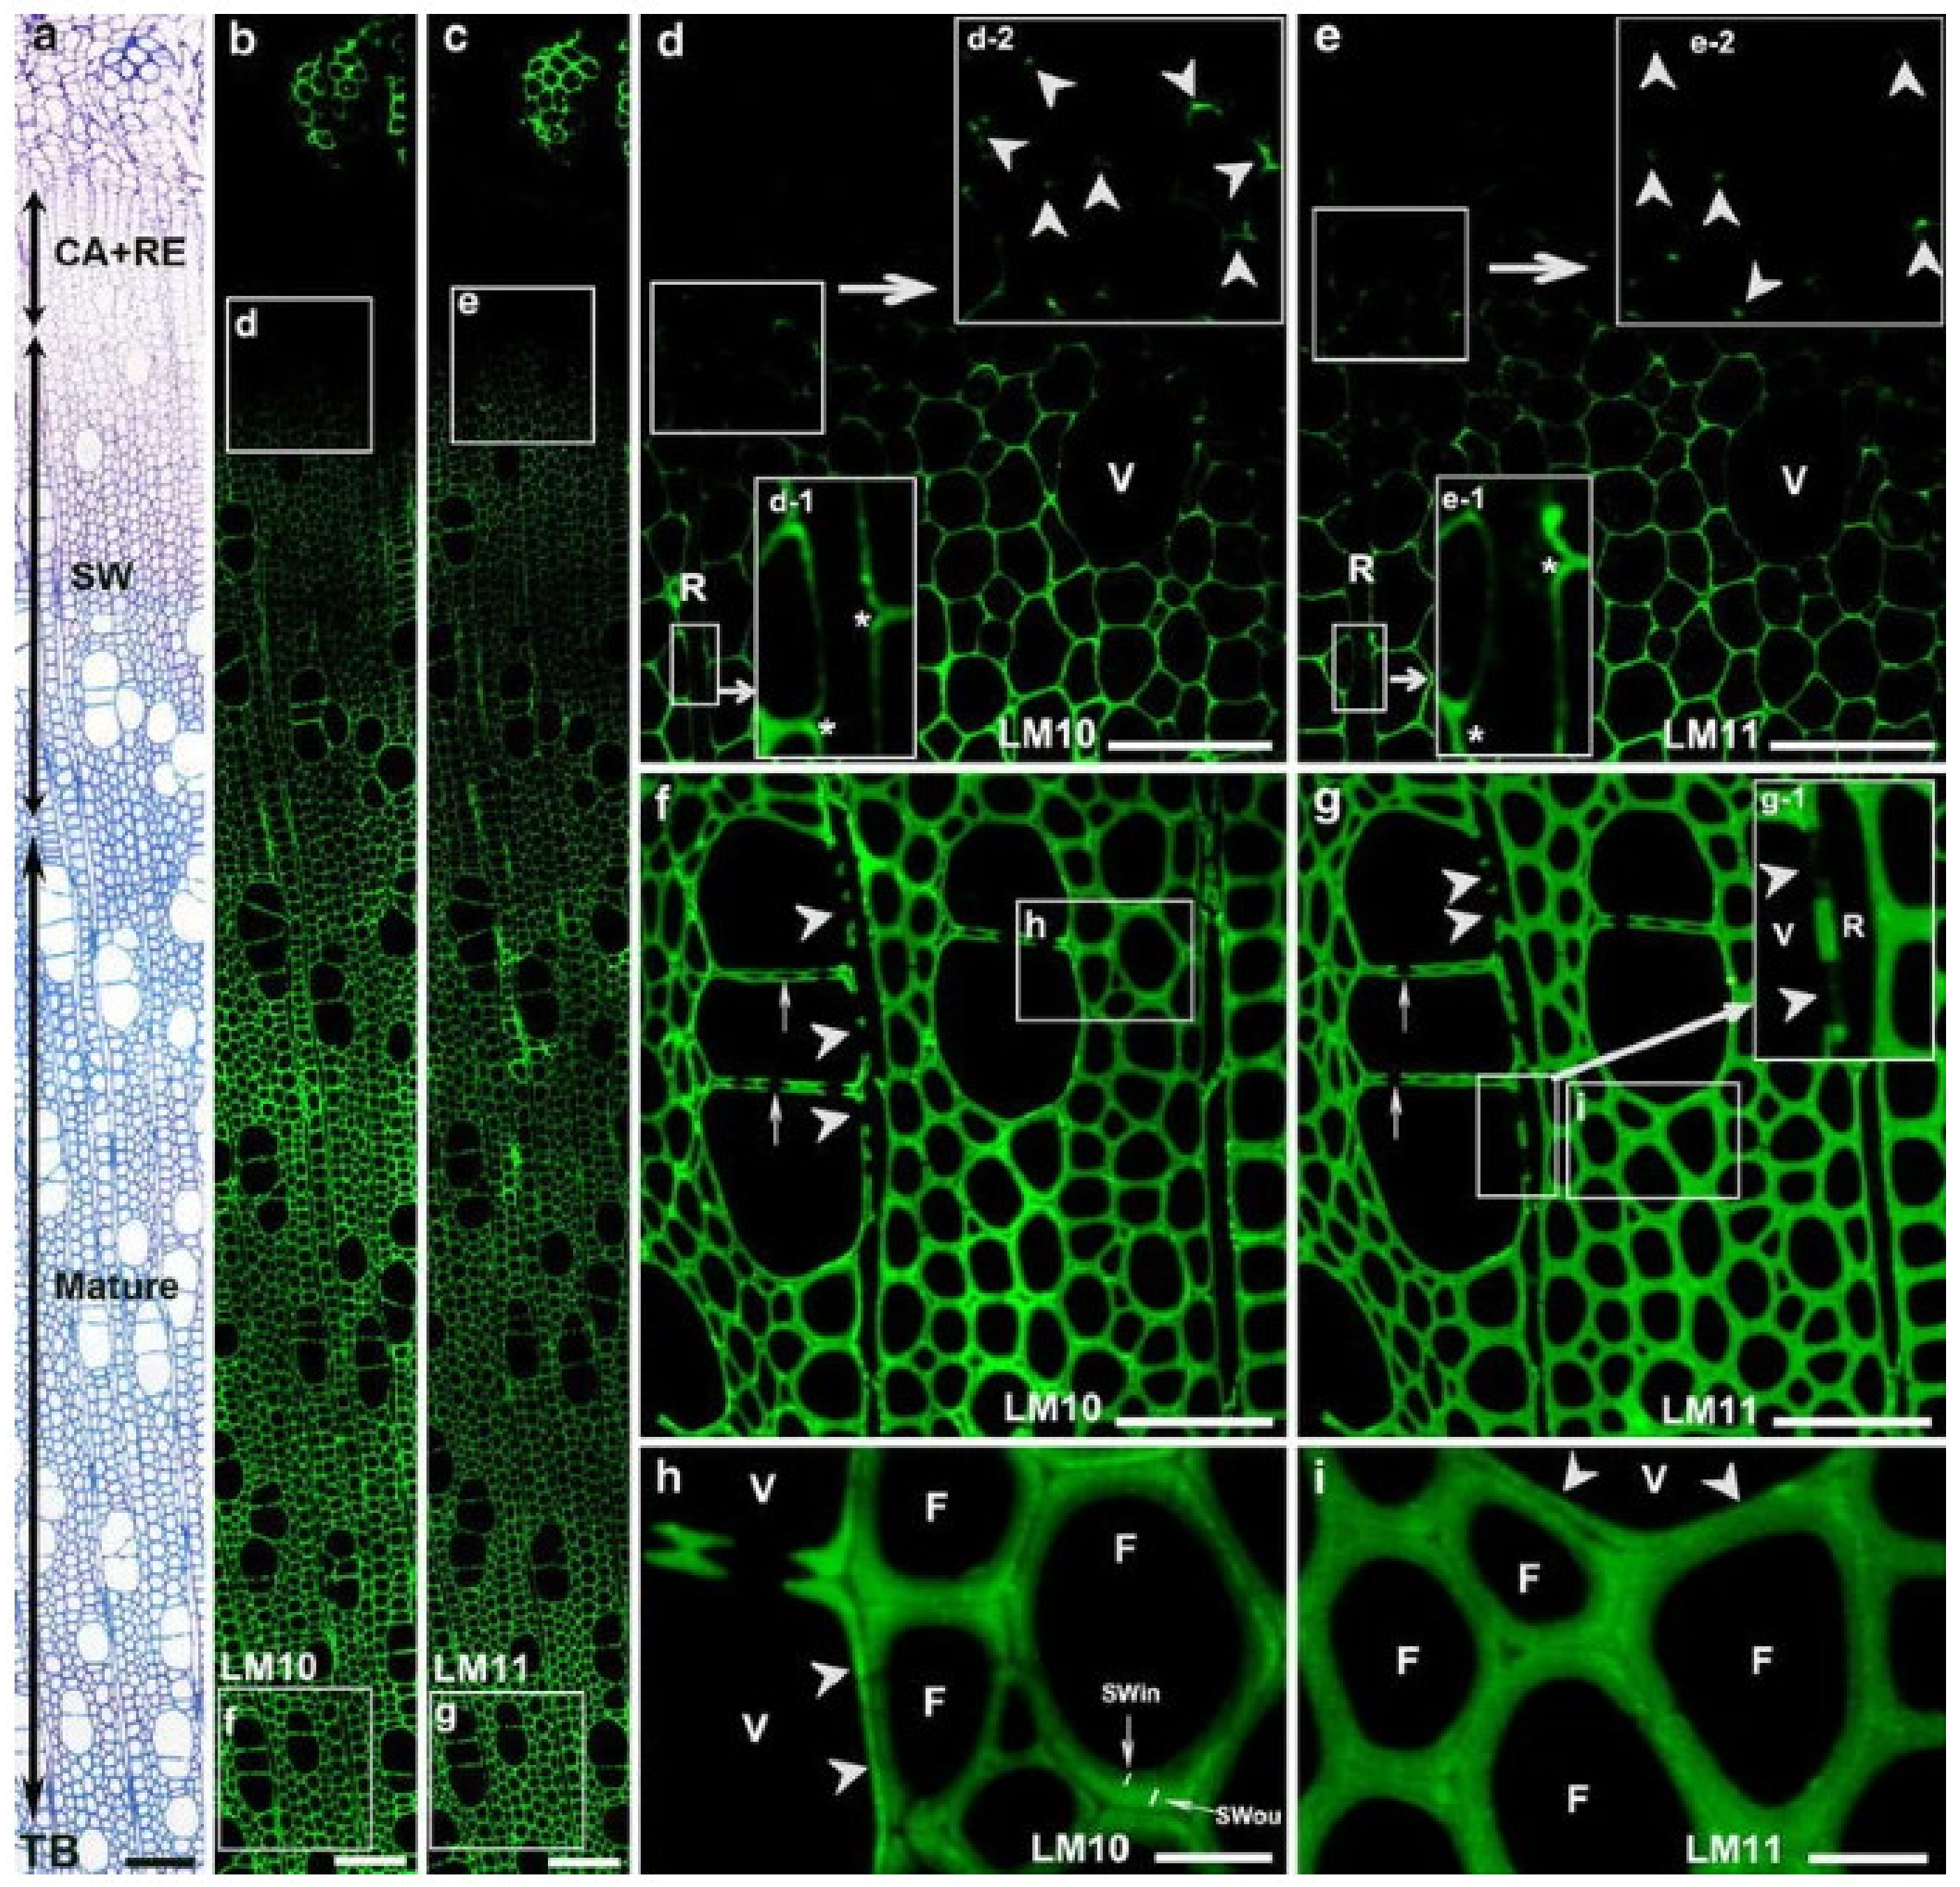
The primary hemicellulose in hardwoods is O-acetyl-4-O-methylglucuronoxylan, which accounts for roughly 30% of gross cell wall compositions. It is made composed of a β-(1,4)-xylan backbone with acetyl groups and 4-O-methyl-α-D glucuronic acid side chains. The circulation of xylans in separating Populus xylem strands has been explored using immunofluorescence with LM10 and LM11 antibodies (Figure 6) [26]. In particular, LM10 immune response ties to low-subbed xylans, though LM11 counter acting agent ties to high-subbed xylans notwithstanding low-subbed xylans. Xylan labeling was first observed in fibers in the S1 in cell corner areas, then in vasculature and ray cells. In the mature cell wall, fibers had a heterogeneous labeling pattern, with low substituted xylans being more strongly labeled in the outside than inner cell wall. Vessels, on the other hand, displayed homogeneous labeling in the mature cell wall, with low substituted xylans showing greater staining than fibers. The presence of xylan in ray cells was discovered much later than in fibers or arteries. Labeling was identified in fibers and vessels at the start of secondary cell wall production, with consistent labeling in the cell wall independent of developmental stage.
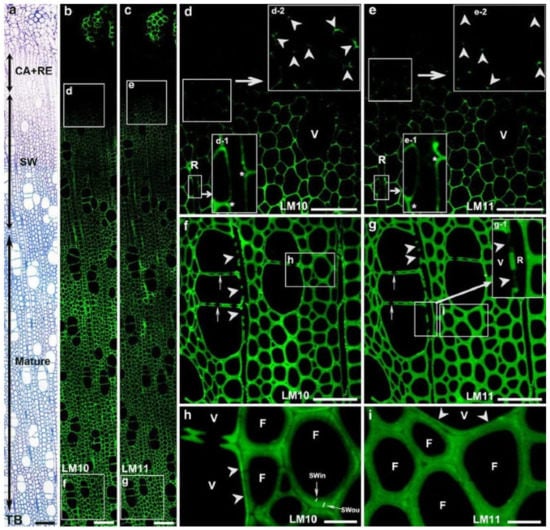
Figure 6.
Immunofluorescence localization of xylans in differentiating xylem with LM10 and LM11 antibodies. Strong xylan labeling was detected in differentiating xylem (a–c). (d,e) Enlargement of cells marked with squares in (b,c), respectively. Xylan labeling was first detected in the corner of the fiber cell wall at the early stage of secondary cell wall formation (inserts d-2 and e-2 in (d,e); arrowheads). Note no xylan labeling in ray cell walls (R, inserts d-1 and e-1 in d, e; asterisks). (f,g) Mature xylem. CA: cambial zone; RE: radial expansion zone; TB: toluidine blue staining. Bar = 100 μm (a–c), 50 μm (d–g), 10 μm (h,i) [17].
Raman imaging would be another powerful tool for studying the hemicelluloses distribution if the issue of strong spectral overlap from cellulose and hemicelluloses was addressed. Zeng et al. described a method for removing xylan from maize stover cell walls that combines spectroscopic analysis with using chemical/enzymatic methods to remove xylan [27]. They used xylanases to specifically digest large portions of xylan in a carefully pretreated corn stover substrate and produced a series of artificial xylan “concentration ladders” in corn stover substrates. By comparing the Raman spectra from xylan model compounds obtained from different sources and with different degrees of polymerization, several Raman peaks associated with xylan content in cell walls for label-free imaging xylan in plant cell wall were identified. Although they claimed that no detectable lignin or cellulose was digested by the assay, it is difficult to guarantee that the original xylan didn’t change during chemical/enzymatic treatment. In addition, multivariate analysis has the ability to discriminate the spectra of cellulose and hemicellulose [28]. Self-modeling curve resolution (SMCR) is a typical multivariate method for settling an unadulterated part from a bunch of spectra without any recourse to a spectral library. As shown in Figure 7, the spectra of cellulose and hemicellulose were reconstructed by SMCR and the semi-quantitative concentrations were identified. The results showed that cellulose was mostly concentrated in the secondary wall of poplar fibers, whilst the distribution of hemicellulose was almost uniform throughout the cell wall of fibers except for a higher concentration found in the S1 and the outer S2 layer. The xylem ray and the vessel had relatively high hemicellulose concentrations which are comparable to the outer S2 layer of fibers, but the cellulose concentration was relatively low in these two cell types. This is in keeping with with the results acquired by the immunofluorescent labeling of the LM10 antibody.
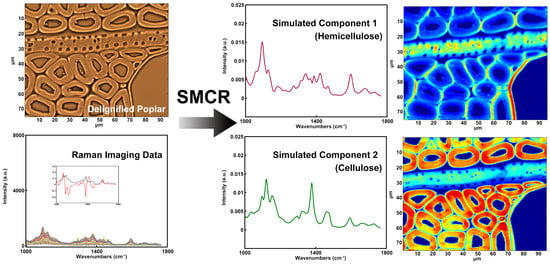
Figure 7.
Raman spectra and corresponding distribution images: simulated component 1 (hemicellulose); simulated component 2 (cellulose).
4. Distribution of Lignin in Wood Cell Wall
The distribution of lignin in the wood cell wall is seen using TEM and potassium permanganate (KMnO4) staining. The permanganate ion (MnO4−) acts as a powerful oxidant, oxidizing the functional groups of the lignin molecules’ alcohol to aldehyde and carbonic acid. Manganese dioxide (MnO2), a water-insoluble reaction product, is placed on the ultrathin slice to see the reaction sites [29]. TEM or SEM combined with brominating technique of energy dispersive X-ray analysis (EDXA) has the potential to offer the distribution of lignin. Moreover, the immunogold labeling technique allows TEM to detect lignin monomeric composition and the nature of lignin structural internal linkages. A number of early studies revealed that the compound middle lamella is more highly lignified than SW in typical softwood tracheids [30,31,32,33,34]. The lignin content in the S1 or S3 layers of the loblolly pine (Pinus taeda L.) are higher than in the S2 layer [35]. Hardwoods, in contrast to softwoods, include a diverse range of cell types, e.g., fibers, vessels, and parenchyma. Although the distribution of lignin in the secondary walls and intermediate layers of hardwood fibers is comparable to that of softwood tracheids, the secondary walls of hardwood fibers are often less lignified than those of softwood tracheids. Figure 8 depicts the distribution of lignin in the xylem of the poplar (Populus nigra) as measured by TEM and potassium permanganate staining [36]. The inhomogeneous distribution of lignin is shown in Figure 8.
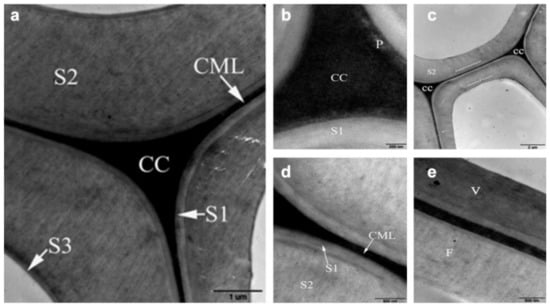
Figure 8.
TEM images showing the heterogeneous distribution of lignin in poplar cell wall: (a) ultrastructure of adjoining fibers with different layers; (b) lignin concentration in the primary wall intermediates between CC and S1; (c) the outer and inner parts of the S2 layer appear more electron dense than the middle part; (d) the lignin distribution in the S1 and S2 layer is distinctly heterogeneous; (e) the lignification of vessel (V) is higher than fiber (V).
An ultraviolet microscope is a quantitative tool for visualizing variations in lignin concentration in the wood cell wall. As previously mentioned, lignin and phenols have a characteristic absorption effect by ultraviolet light. Fukazawa and Imagawa employed this technique to study the lignin content within one growth increment of Japanese fir (Abies sachalinensis) [37]. The lignin content of the earlywood was higher than that of latewood in adult wood. Möller et al. found that the middle lamella of Pinus radiate cell wall was first lignified, followed by the secondary wall. The lignification of middle lamella was higher than that of the secondary wall [38]. Prislan et al. studied the formation and lignification of xylem cells in beech (Fagus sylvatica L.) by ultraviolet microscope (Figure 9) [39]. They found that the lignification began in the newly formed xylem tissue on the 2nd of May. After 1 month, the developing earlywood portion contained fully differentiated vessels with completed wall deposition and lignification, and differentiated fibers and axial parenchyma became visible after 2 months.
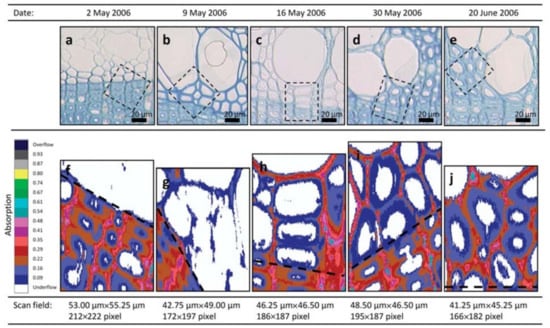
Figure 9.
Progressive differentiation and lignification of newly formed xylem tissue in the tree from 2 May to 20 June 2006. (a–e) Light microscopic pictures of the first formed tissue near the growth ring boundary stained with toluidine blue showing different stages of cell wall development; the frames indicate the area of scanning fields. (f–j) Images of ultraviolet microscope analysis showing the absorbance values at different stages of cell wall lignification; black dashed lines indicate the growth ring boundaries. The progressive lignification can be followed from (f) no absorbance detected on the 2 May to (j) maximal absorbance of completely formed fibers on the 20 June 2006.
Infrared and Raman spectroscopy have inherent advantages for studying lignin. Lignin has characteristic peaks around 1600 cm−1 in infrared and Raman spectra due to its specific aromatic ring. Müller and Polle employed the Fourier transform infrared microscopy to visualize the distribution of lignin in European beech (Fungus sylvatica L.) [18]. The typical range of wavenumbers for cellulose (1530–1490 cm−1) was integrated into each spectrum (Figure 10). The lignin distribution in the measured region was heterogeneous, with a higher concentration of lignin in cell walls in the top portion, as evidenced by a brighter reddish coloration. Agarwal et al. studied the distribution of lignin in the fibers of Picea mariana by integrating the wavenumber range 1519–1712 cm−1 (Figure 11) [20]. The lignin concentration in a distinct morphological region was not uniform and varied significantly. The lignin concentration of CC was the highest on average.
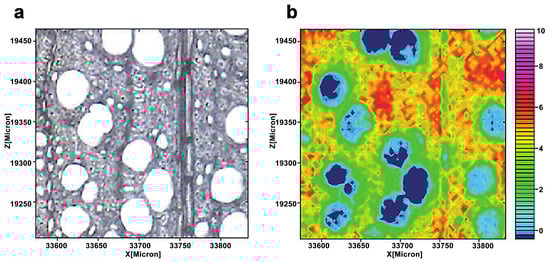
Figure 10.
A light microscopic image of a cross-section of a beech (a). The lignin distribution was seen by combining the spectra pictures for the wavenumber range 1530–1490 cm−1 (b). From blue (low) to pink (high), the color scale denotes increasing cellulose concentration.
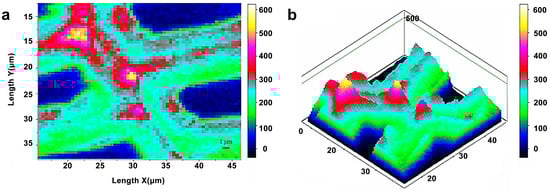
Figure 11.
Raman images of lignin spatial distribution in cell wall: two-dimensional (a) and three-dimensional (b) representations. Bright white/yellow locations indicate high lignin concentration; dark blue/black regions indicate very low concentration, e.g., lumen area.
5. Distribution of Components in Reaction Wood and Water-Logged Archaeological Wood
Although the distribution of the main components in the wood cell wall varies among tree species and different cell types, we can still trace some patterns of main components deposition. In general, the cellulose and hemicellulose are mostly concentrated in the secondary wall while the lignin is concentrated along the CML and in the cell corner; however, these patterns may change in reaction wood and water-logged archaeological wood.
Reaction woods are found in leaning stems and branches formed by an external force like as landslide, gravity or snowfall [40]. The reaction wood emerges on the bottom side of leaning stems or branches in softwoods, where the xylem reacts to the compression stress. As a result, this type of reaction wood is known as compression wood. There was a positive correlation between normal wood main mechanical properties and density, as well as compression wood bending strength, elastic modulus, and air-dried density [41]. However, there was no significant correlation between compressive strength along the grain and air-dried density. Tension wood, also known as reaction wood, grows on the top side of leaning stems or branches in hardwoods, where the xylem loads the tensile tension. Tension wood has significant ultrastructural variations. In some species, there is a secondary wall layer consisting mainly of cellulose microfibrils almost parallel to the fiber axis, called the glial layer or G-layer [42]. The compression wood and tension wood are differ from normal wood in their anatomical appearance. For compression wood, the differences involve a more lignified outer S2 layer, the lack of an S3 layer, and the existence of intercellular spaces in the cell corners [43]. With reduced lignification of the middle lamella and increased lignification of the secondary wall, the lignin distribution shifts dramatically across the cell wall. The lignification of the cell corner and outer S2 layer is typically equivalent in mild compression wood, although the S1 and S2 layers are less lignified. The high lignification of the outer S2 layer increases the contribution of middle lamella lignin to overall lignin content, which is reduced by the intercellular gaps of severe compression wood. Tension wood is distinguished by the presence of a cellulose-rich gelatinous layer as part of the secondary wall in fibers. In maple and oak, the gelatinous layer was divided into concentric sub-layers that appeared as single rings or many concentric zones of high and low contrast. Potassium permanganate staining was observed at the interface of continuous concentric layers in maple, while it was more widespread across the gelatinous layer in oak, indicating aromatic compound deposition inside the cellulose structure of the gelatinous layer [44].
Wood from ancient times can be preserved underwater or in water-damaged conditions for centuries or even thousands of years. When discovered, water-logged archaeological wood often appears to be well preserved. Its conservation is especially important when valuable archaeological artifacts are found, or when the wood and its tree rings represent a unique source of information about past environmental conditions, as well as the culture and way of life of ancient peoples. Čufar et al. evaluated the state of deterioration of ash (Fraxinus sp.) and oak (Quercus sp.) which was buried in water-logged condition at prehistoric settlements on the Ljubljansko barje, Slovenia, aged approx. 5200 and 4500 years [45]. The chemical properties of the samples were investigated by TEM and UV microscopy. In all cell types, the remaining parts of the secondary walls showed a strong delignification. The compound middle lamellae appeared structurally intact, but had lower UV-absorbance than normal wood of the same species. The cell corners were topochemically unchanged, as shown by high analogue UV-absorbance. The UV-absorbance maxima at a wavelength of 278 nm corresponded to those of hardwood lignins. The oak heartwood was generally better preserved than the ash wood. Within each species, the 4500 year-old samples generally appeared better preserved than 5200-year old samples.
6. Chemical Changes of Wood Cell Wall during Pretreatment
In the process of separating and extracting the main components of the wood, we need to pretreat the wood to break the natural degradation resistance barrier of the cell wall. The pretreatment’s goals are to break down the lignin structure and disturb the crystalline structure of cellulose, allowing enzymes easier access to the carbohydrates during hydrolysis. Various pretreatment technologies have been proposed to achieve these objectives, and were characterized by wet chemistry methods [46]. However, due to the heterogeneous nature of wood cell wall, wet chemistry methods suffered from the classical ensemble average limitation presented by analysis of these mixtures of complex biomass. The gathered data are sometimes inconclusive and, in part, contradictory. To overcome these issues, the techniques that bridge the gap between the cell wall architecture and the chemistry have been utilized to multi-scale visualization and characterization of wood cell wall deconstruction during pretreatment. Table 5 lists some literatures that emphasize on cell wall ultrastructural changes during typical pretreatment by using alkaline, dilute acid, hydrothermal, ionic liquid and deep eutectic solvent.
Table 5.
Pretreatment methods from references discussing cell wall deconstruction.
Alkaline pretreatment resulted in swelling and delignification that mainly occurred in the secondary wall but had little effect on the CC. The pretreatment exposed the embedded microfibrils from non-cellulosic polymers clearly, enlarged the diameter of microfibrils, and increased the surface porosity, thus facilitating better transport of enzyme [47,48,49]. In addition, alkaline pretreatment caused increased cellulose crystallinity and depolymerized hemicelluloses, which affected the enzymatic conversion to glucose together.
The mechanisms of dilute acid pretreatment and hydrothermal pretreatment are similar. Both of them selectively solubilized hemicelluloses and lignin to facilitate loosening of the cell wall structure. As a special phenomenon, lignin formed droplets that were concurrently coalesced on wall surface that in turn exposed more microfibrils deep in walls to be enzymatically hydrolyzed. The dilute acid pretreatment released a greater number of hemicelluloses from opposite wood than compression wood [50]. The dissolution of hemicelluloses was not uniform and varied across the tracheid wall. For the hydrothermal pretreatment, the S2 layer was differentiated into two regions, namely a heavily-damaged region (outer and thin inner S2) with more polysaccharides removed, and a light-damaged region (middle S2) which still remained relatively intact. The removal of polysaccharides (mainly hemicelluloses) rather than lignin played a critical role in the visible damage of cell wall, such as cavities, gaps and collapses [51]. Specifically, hydrothermal pretreatment (poplar) initially removed the lignin-free xylan from the middle layer of the secondary wall, followed by the lignin-bound xylan, but the cellulose-bound xylan was seldom removed by this pretreatment [52]. A reduction of redeposited lignin droplets in the S2 layer was observed [53].
Ionic liquids (IL) typically defined as liquids with salts composed of anions and cations with melting points typically less than 100 °C. By designing anions and cations, ionic liquids had ability to fully solubilize some or all components of the plant cell wall and liberated the fermentable sugars. The wood cell walls dissolution during the pretreatment can be clearly divided into two stages: the slow penetration of IL, and the rapid dissolution of lignin and carbohydrates [54]. Most of the cellulose microfibrils were solubilized but chain migration was restricted and a small percentage of microfibrils persisted during swelling [55]. In addition, ionic liquid induced crystalline transformation on cellulose with enlarged distance of lattice planes, reduction of both crystallinity and crystallite size [56]; however, the biomass conversion was greatly enhanced due to the cell wall deconstruction and lignin dissolution, rather than the decrystallization or crystallinity transformation of substrates [57].
Deep eutectic solvents, which are composed entirely of ions and have been proved a useful solvent for removal of lignin and hemicelluloses, share many properties with ionic liquids. The pretreatment with choline chloride/levulinic acid had high lignin removal, morphological disruption and decreased crystallinity. During the pretreatment, cellulose microfibrils had micro-voids and cracks in anisotropic directions. Non- or low-substituted xylan was directly removed from secondary walls, exposing more cellulose for enzyme attack after the pretreatment with Choline chloride/lactic acid. The high-substituted xylan and lignin were synergistically dissolved from the CC [58].
7. Orientation of Cellulose Microfibrils
The cellulose is synthesized as crystalline fibrils with highly ordered architecture. Nishiyama et al. studied the crystal and molecular structure together with the hydrogen-bonding system in cellulose Iα and Iβ [59,60]. It was found that cellulose Iα has a triclinic lattice whereas cellulose Iβ is featured by a monoclinic lattice. However, it doesn’t completely to resolve the biosynthesis and ultrastructure of cellulose. The simplicity of repeated glucose unit does not indicate a complicated arrangement of crystalline and amorphous regions at the fibril level. In addition, the polysaccharide matrix polymers and hemicelluloses include varieties of different chemical structures, including lignin, which is a polyphenolic incrusting polymer. Specifically, different properties and functions of inter- and intra-timbers depend on the chemical composition of the cell walls and the arrangement of the cellulose microfibrils in the different layers [61]. The orientation of cellulose microfibrils in the secondary wall is commonly referred to as microfibril angle (MFA). The model shown in Figure 12 reflects the current thinking on the wall structure of “normal” fibers and tracheids was summarized. In the primary wall, the microfibrils are arranged almost perpendicular to the cell axis. The S1 layer cellulose microfibrils are arranged in either leftward or rightward rotation, with an angle of 50° to 70° to the fibril axis. The MFA of the S2 layer varies from 50° to 70° in the earlywood of softwoods, while in latewood it varies from 5° to 10°. The MFA of the S3 layer was 70° to 90° and the arrangement of cellulose microfibrils is similar to the S1 layer.
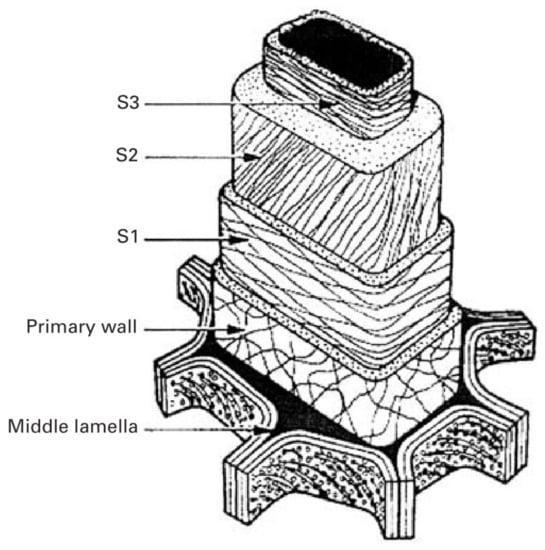
Figure 12.
Schematic diagram of cellulose microfibrils in wood cell wall.
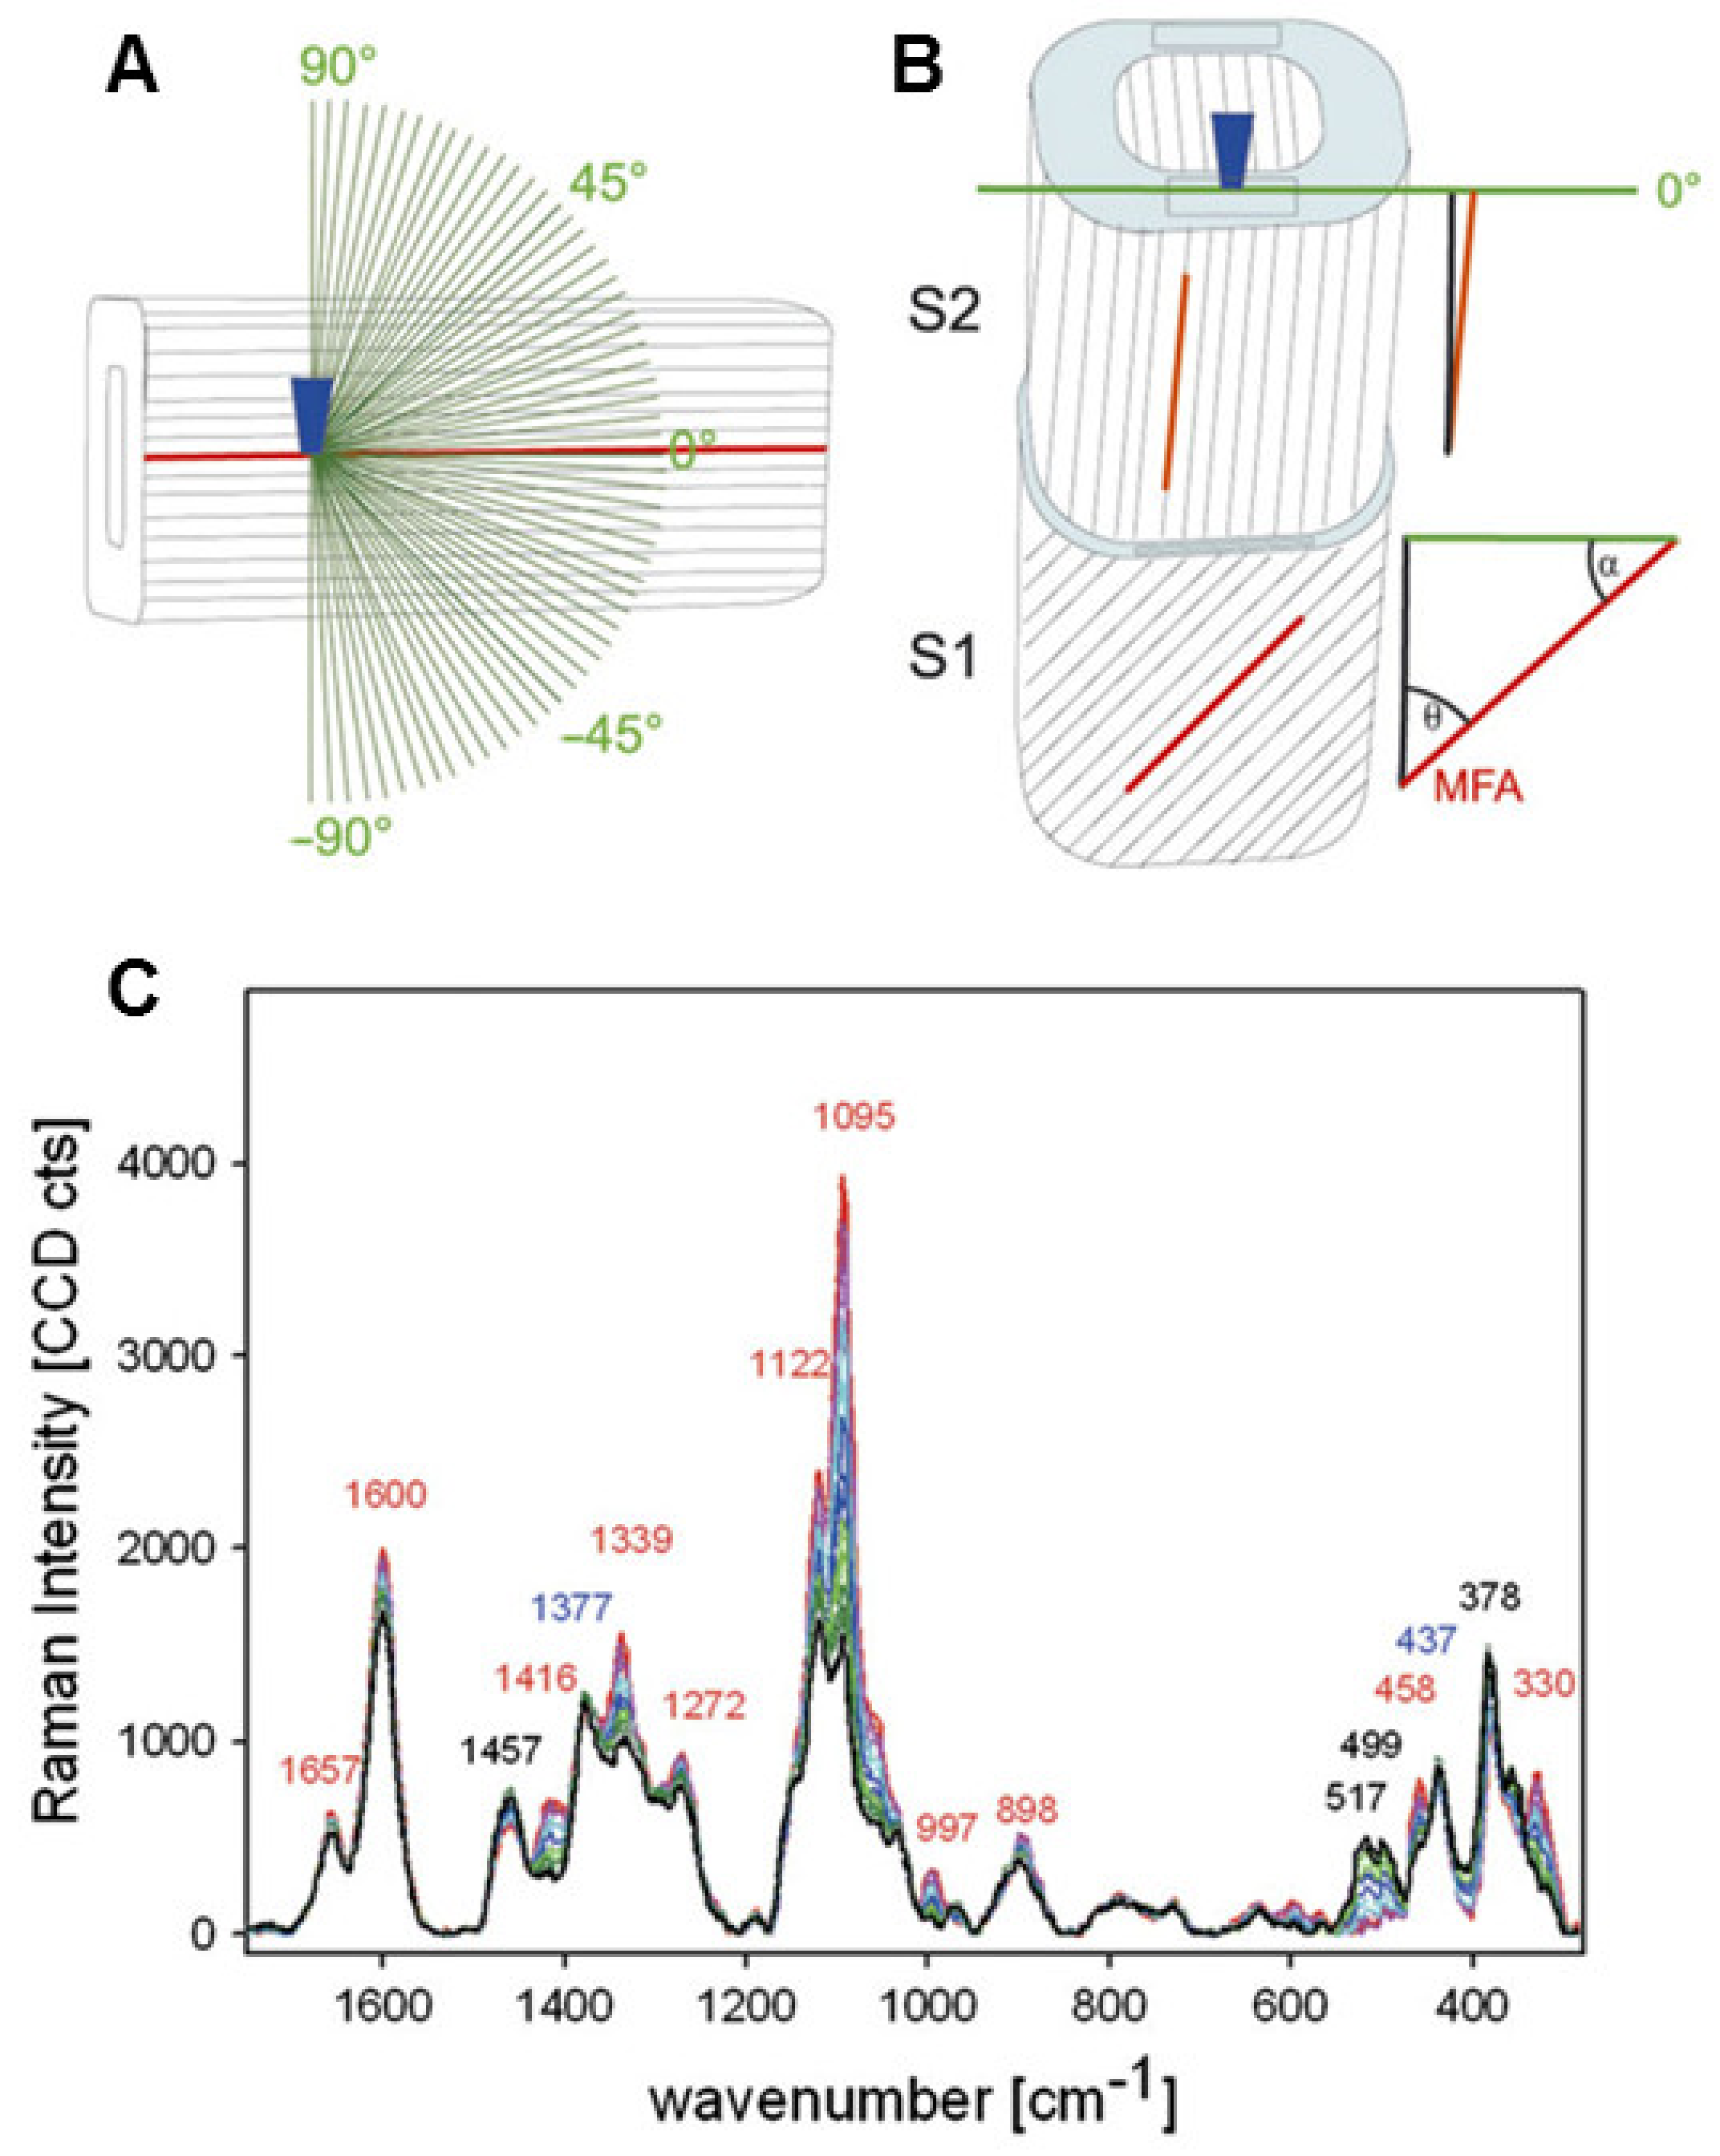
Techniques for investigating MFA, including polarization microscopy, transmission ellipsometry, X-ray diffraction, confocal microscopy, and micro-Raman spectroscopy, as reported by Huang et al. [62]. Here, we would like to introduce the Raman imaging technique for in-situ identifying orientation of cellulose microfibrils. Based on the theory background of the orientation measurements, polarization characteristics of Raman scattering are related to the polarizability tensor and contain information regarding the symmetry and the orientation of chemical groups [63]. Raman band anisotropy measurements allow for retrieval of this information if the Raman tensor is known [64]. Gierlinger et al. utilized the polarized Raman spectroscopies for studying cellulose microfibrils, in which the orientation of the glycosidic COC relative to the fibril axis has been demonstrated [65]. Figure 13 demonstrates how the fingerprint region of Picea abies changes as the incident laser’s polarisation direction is rotated. When the electric vector was altered from perpendicular (90°, black) to parallel (0°) with regard to the fibril axis, most of the bands increased. The band showed the greatest rise at 1095 cm−1, which was ascribed to COC stretching. They used quadratic linear regression and partial least square regression to describe the orientation-dependent variations in band height ratios and spectra. Between 1096 cm−1 and 1122 cm−1, the best model statistics were obtained.
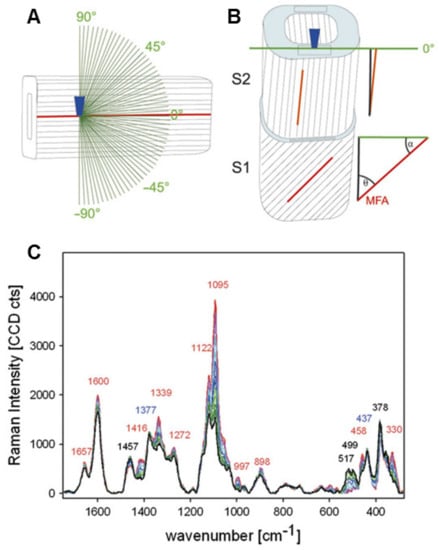
Figure 13.
The experimental set-up is depicted schematically in this diagram. (A) A microscopic objective (dark blue) focuses the laser beam within the tangential S2 layer of a single latewood fibre, where the cellulose fibril orientation is known to be parallel with respect to the fibre axis. (B) A cross-sectional area (light blue) of wood samples is focussed by a laser beam (microscopic objective, dark blue). (C) Variations in the fingerprint region of baseline-corrected spectra obtained from one point of the tangential S2 layer of a mechanically isolated single spruce latewood fibre while rotating the incident laser’s polarisation direction in 3° steps from parallel.
Sun et al. developed a MATLAB code to determine intensity at the characteristic peak of interest and performed ellipse fitting to determine the microfibrils orientation [66]. They detected differences between wild-type rice plants and the rice brittle culm mutant, which shows a more disordered cellulose microfibril arrangement, and differences between different tissues of a wild-type rice plant. The non-destructive property is the greatest advantage of Raman imaging. A mapping of variations in molecular orientation throughout an individual cell would allow us to detect nodes in molecular organization and their relation to cell morphology [67]; however, the technique still needs to be improved, especially in terms of model building. There is little published data on ellipse fitting for prediction of relationship between molecular orientation and Raman intensity.
8. Models of Cell Wall Structure
The different molecular structures of lignin and polysaccharides cause different supramolecular arrangements of these components within the cell wall. The molecule chains of cellulose are arranged in fibrillar units whereas the lignin consists of a three-dimensional network incorporated between the cellulose fibrils [68]. How does cellulose, hemicellulose and lignin organize cell wall of native wood tissue is one of the most challenging problems to address [69]. Studies using chemical and physical methods illustrated that the distribution of various components in wood cell walls is heterogeneous. Even in the sub-microscopic and supramolecular range there are variations in the distribution of the components. The research on the supramolecular structure of the cell wall was very active in the 1960s to 1980s. A lamellation of lignin concentrically to the lumen was observed in the secondary wall by electron microscopy. Micro-density measurements resulted in average distances of 7 to 8.5 nm for the lignin layers of softwoods and about 10 nm for hardwoods [70]. Polarized infrared spectra and birefringence provided evidence that the hemicelluloses are arranged parallel to the cellulose fibrils in the cell wall [71].
Fengel proposed a model of cell wall ultrastructure which takes into account cellulose, hemicellulose and lignin (Figure 14) [72]. It explains that cellulose fiber units are composed of hemicellulose layers of different thicknesses. The smallest units (3 nm in diameter) are separated from each other by monomolecular layers of hemicellulose and the largest units (25 nm in diameter) are enclosed by hemicelluloses and lignin.
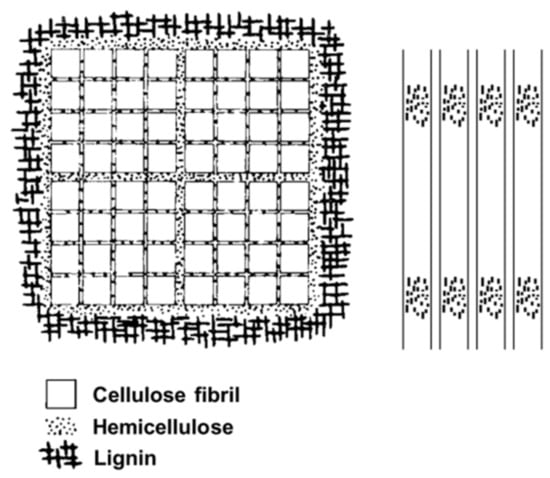
Figure 14.
Models of cell wall components developed by Fengel.
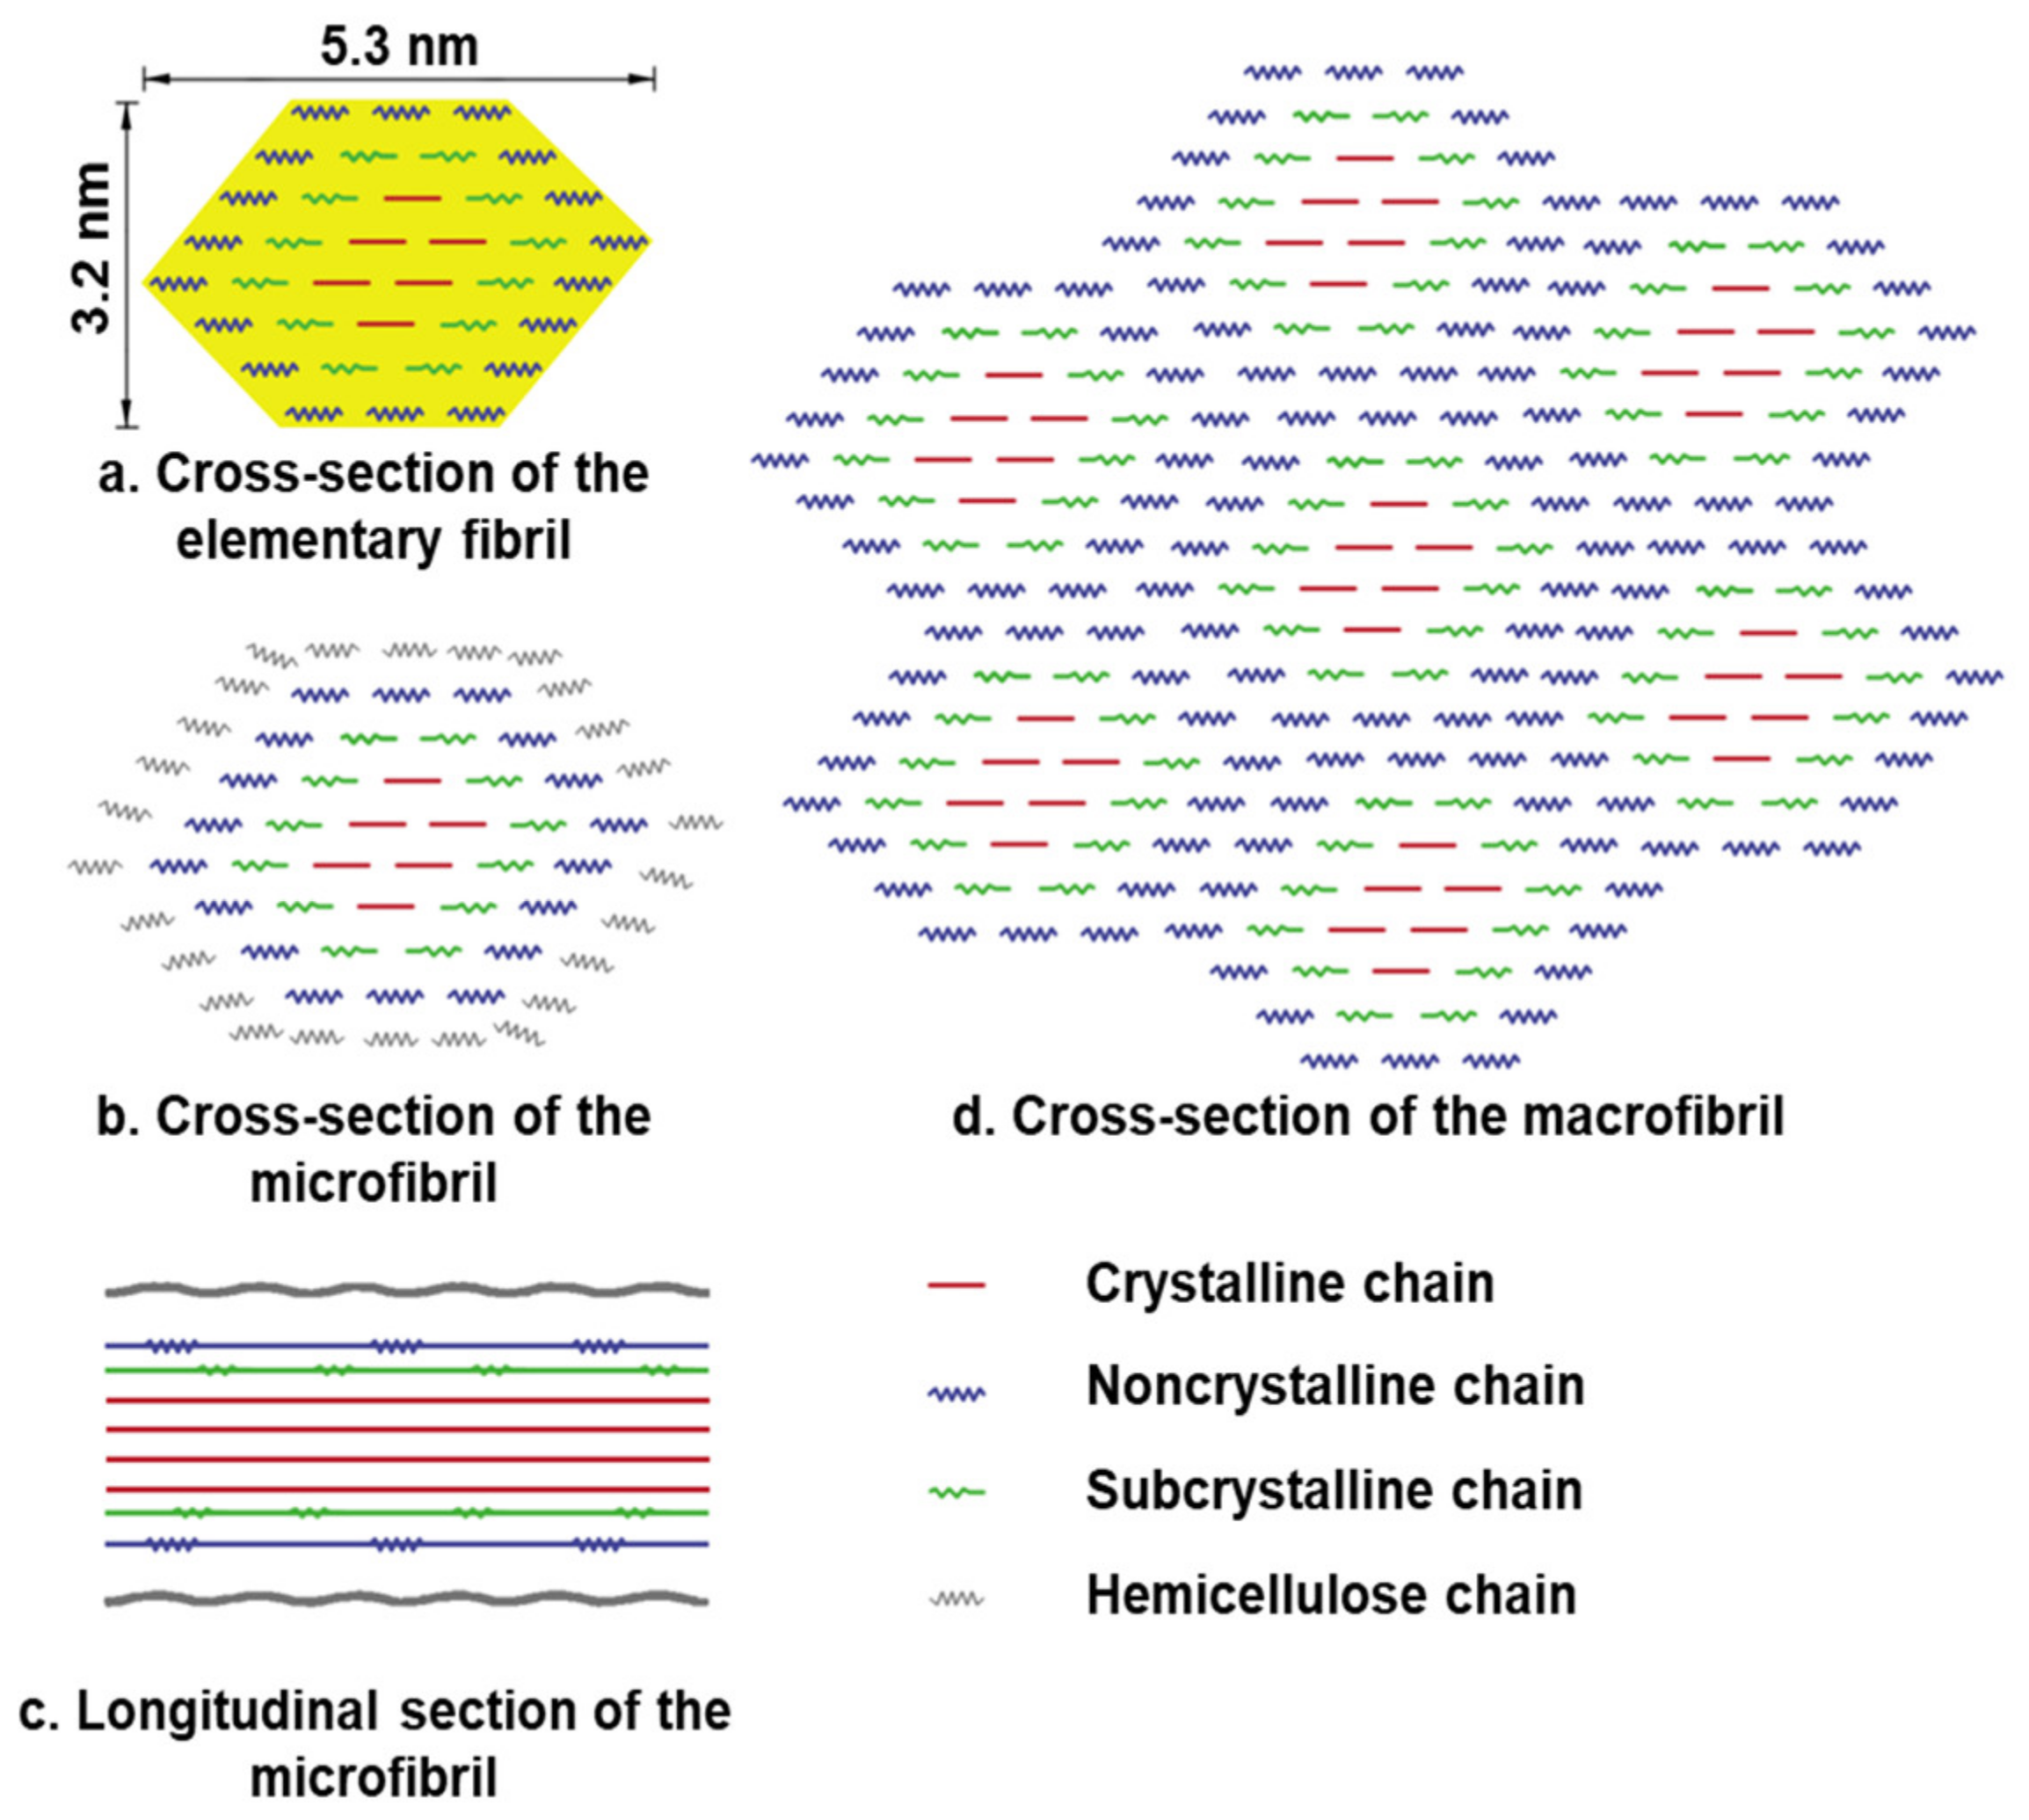
The crystalline and amorphous regions of cellulose alternate in their secondary structure. According to Ding’s model (from maize parenchyma), the elementary fibril is made up of rosettes containing 36 cellulose synthase proteins that produce 36-D-glucans in higher plants (Figure 15) [73]. These 36 glucan chains subsequently join together via hydrogen bonds and van der Waals forces to produce the elementary fibril’s crystalline core and subcrystalline shell structure [74]. The hydrogen linked supramolecular structure of cellulose is one of the reasons for its resistance to microbial degradation.
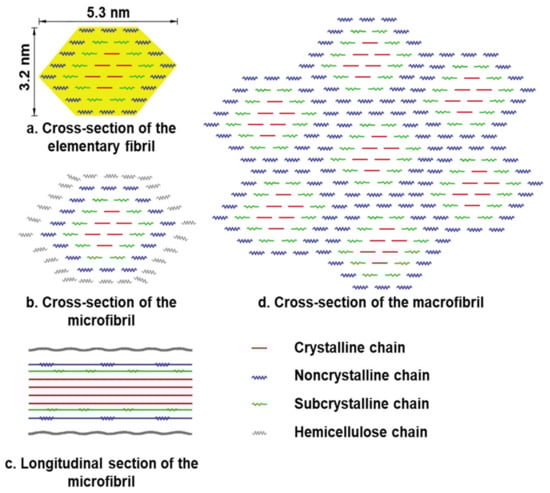
Figure 15.
Secondary structure of cellulose. (a) Cross-section of the 36-glucan-chained elementary fibril. (b) Microfibril cross-section with hemicellulose coating on the surface of the elementary fibril. (c) The microfibril’s longitudinal section. (d) Macrofibril cross-section generated by elementary fibrils.
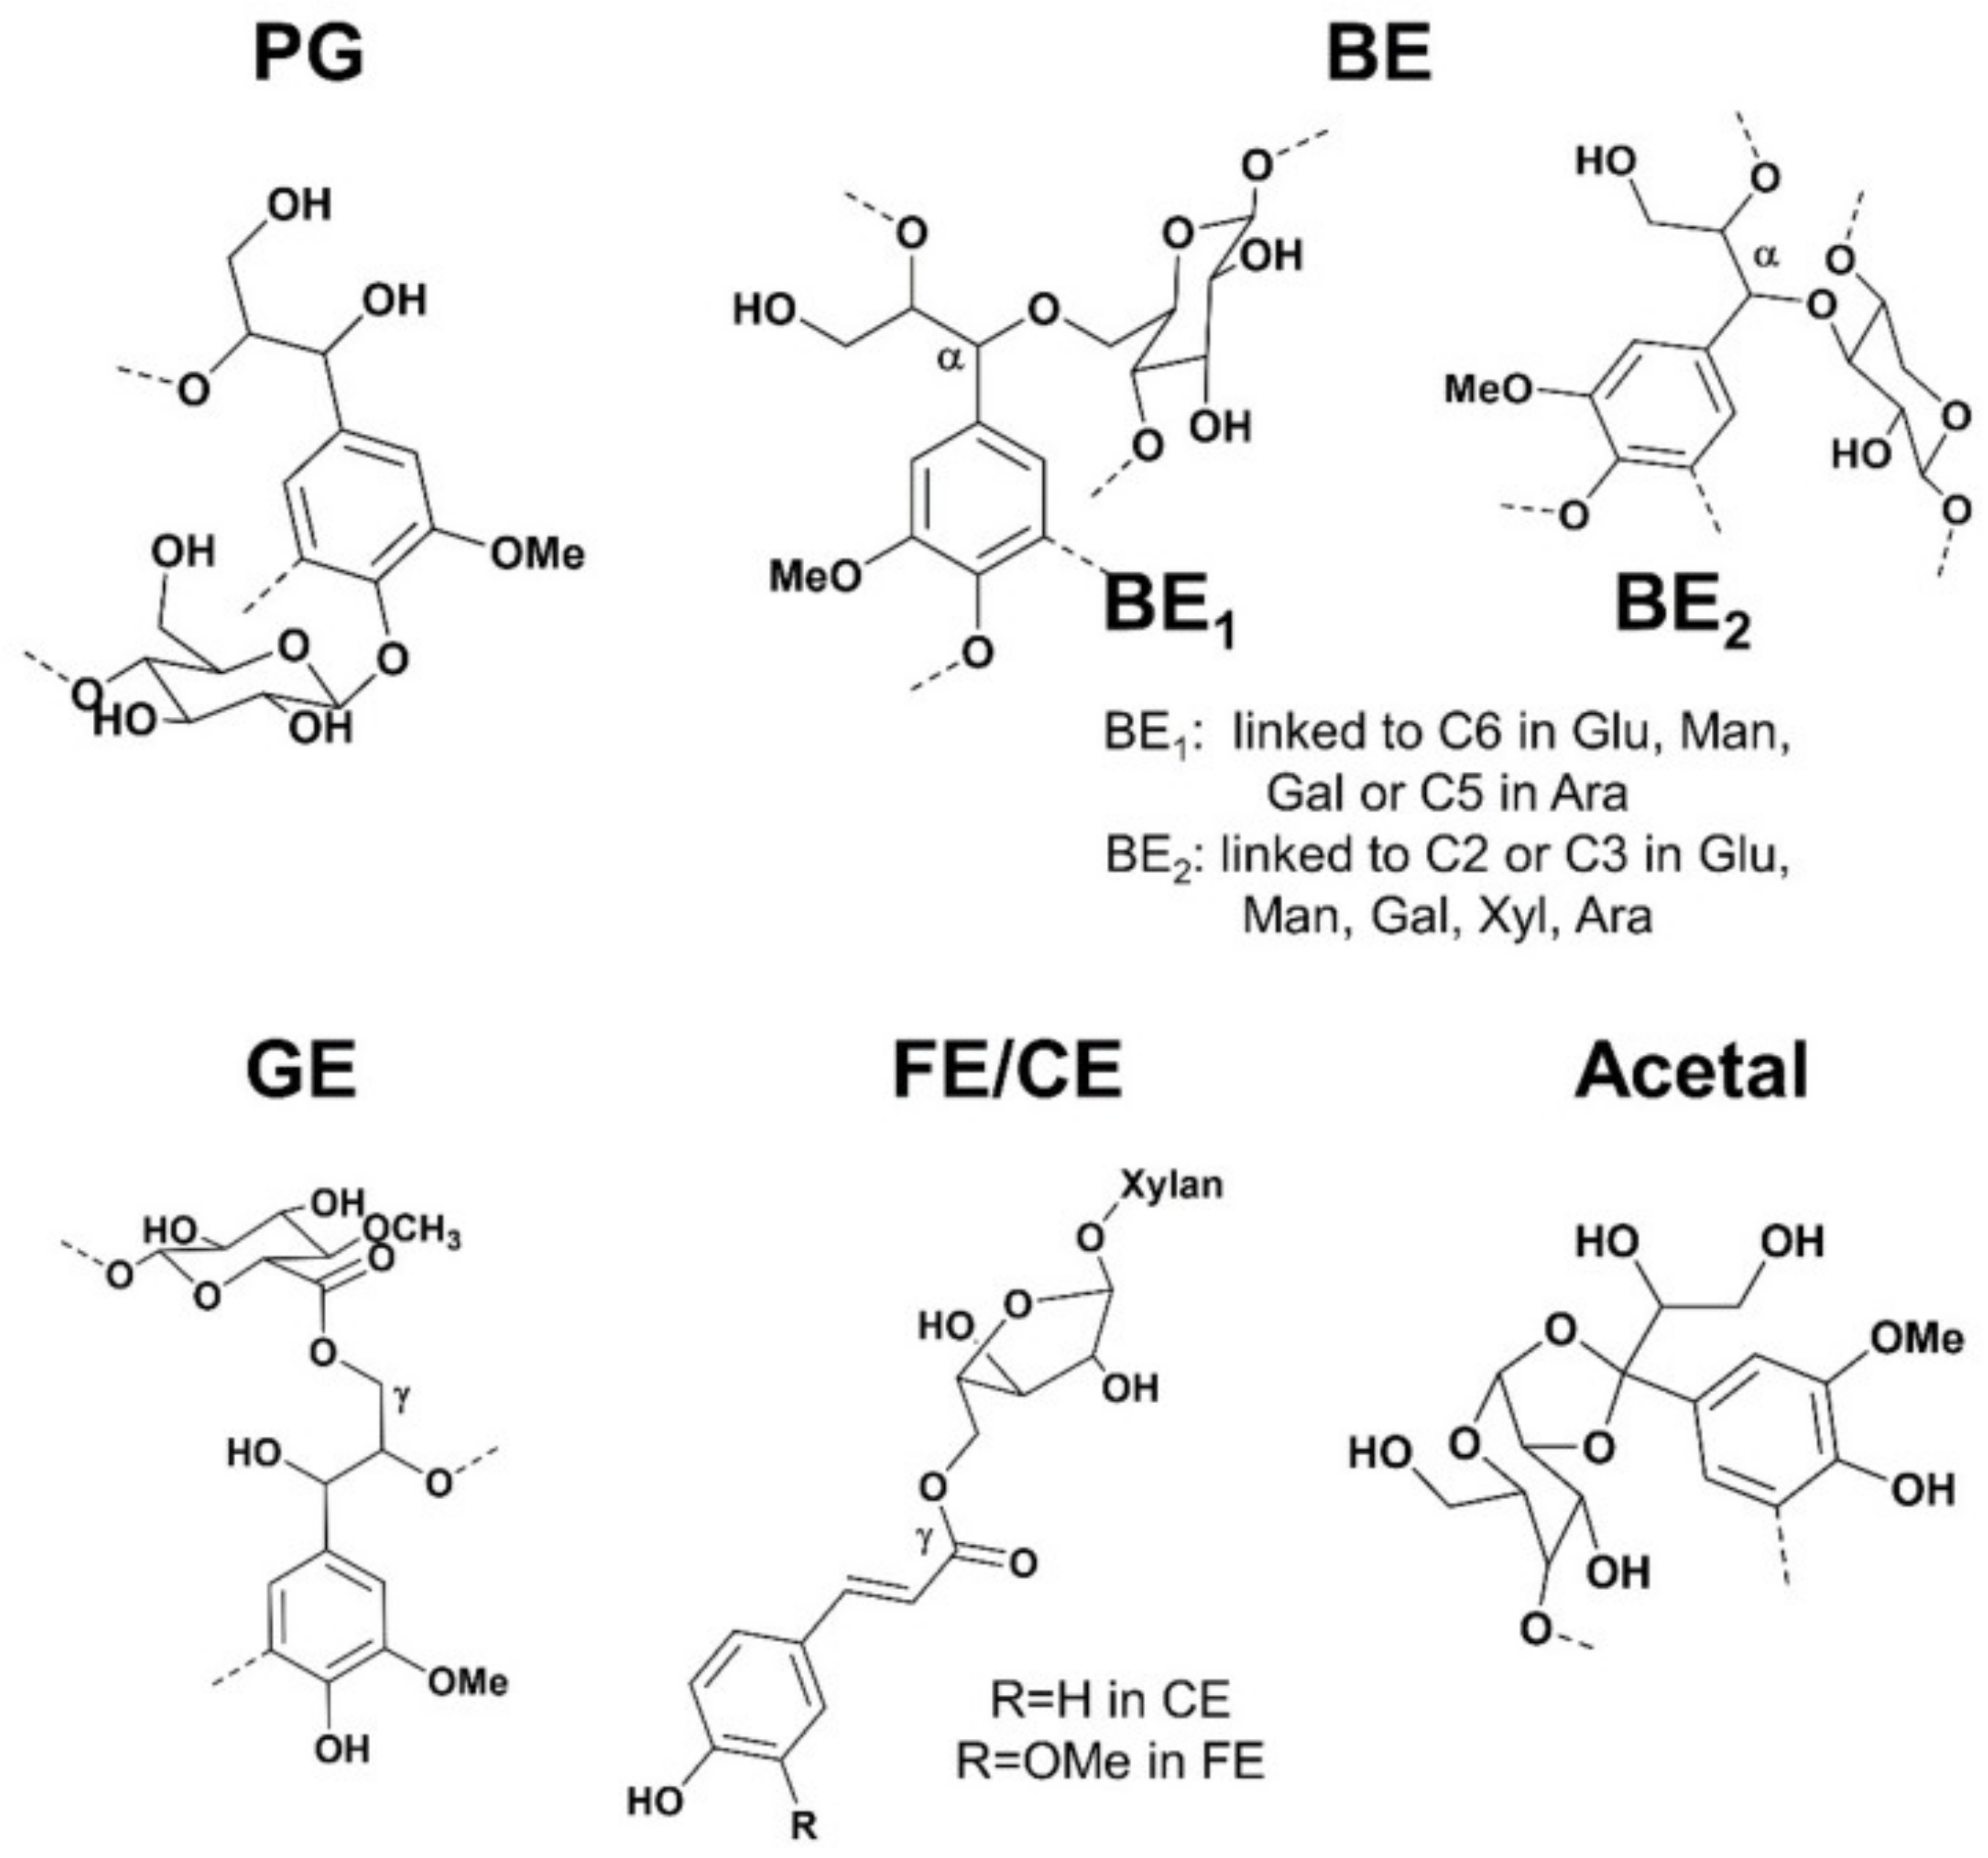
The hemicelluloses should be considered as a coupling agent between cellulose and lignin in the supramolecular range [75]. More specifically, the presence of lignin-carbohydrate linkages, which form so-called Lignin-Carbohydrate Complexes (LCC), is thought to play a key role in the recalcitrance of wood cell walls [76]. The origins of this concept can be traced to “glycolignose” explaining the inability in separating the lignins and carbohydrates in 1866. Later, several research appeared later, including extensive investigations of the residues left after wood extraction and various characterisation techniques [77]. Despite evidence of LCC presence, conclusive verification of their existence in wood remains elusive, even after 150 years, due to disputed isolation and analytical procedures. Confusing statements about LCC categorization are at the heart of these issues. Even the most widely used analytical technique for LCC, nuclear magnetic resonance (NMR), hasn’t been able to definitively assign all lignin carbohydrate (LC) connections. The LCC has been a source of contention over the previous decade, particularly when it comes to their involvement to biomass recalcitrance. Giummarella et al. concluded five types of lignin-carbohydrate bonds suggested in the literature, namely, phenyl glycosides (PG), benzyl ethers (BE), γ-esters (GE), ferulate/coumarate esters (FE/CE) and hemiacetal/acetal linkages (Figure 16) [78].

Figure 16.
Lignin-Carbohydrate Bonds (LC) suggested structures in wood and grass. PG = phenyl glycosides, BE = benzyl ethers; GE = γ-esters; FE = ferulate esters; CE = coumarate esters.
Recently, solid NMR analysis of Arabidopsis xylan revealed two conformations: twofold and threefold helical screw [79]. The former gives the segment a flattened shape that allows it to interface with the surface of cellulose. Electrostatic forces between hydroxyl groups in xylan and methoxyl groups in lignin were shown to interact with the latter, which has a non-flattened conformation [78]. The findings also revealed that hemicelluloses play an essential role in the formation of three-dimensional structures in wood cell walls, and that electrostatic forces regulated interactions between lignin and xylan, with covalent interactions (i.e., the LCC) being of minor consequence. The statement challenges the original suggestion that the LCC plays a crucial role in the recalcitrance of wood cell wall. A revised model of lignin-polysaccharide packing the secondary cell wall is shown in Figure 17 [80,81].
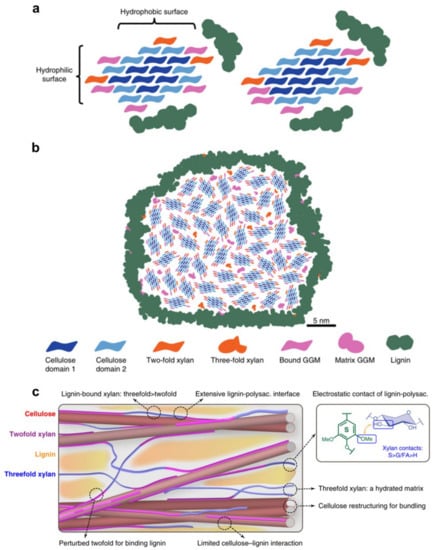
Figure 17.
(a) Possible models of the molecular architecture of softwood; (b) Model of spruce cell wall macrofibril; (c) Secondary cell wall model by Kang et al.
9. Conclusions and Perspectives
A detailed knowledge of the ultrastructure and chemical characteristics of wood cell wall is essential to promote better utilization of wood. The physical and mechanical properties of wood varied depending on the species, growing environment, age and location. Many researches have been carried out on the layering structure and compositional distribution of wood cell wall. However, most of them were achieved in a two-dimensional plane. An accepted three-dimensional model of wood cell wall at nanoscale remained to be established. Knowledge of the cell wall sub-layer structure at the nanoscale is limited. It is still under debate that whether elementary fibril has 36 glucan chains. In addition, the interactions of cellulose, hemicellulose and lignin require further exploration. There are technical challenges in characterizing heterogeneous wood materials, so progress in related analyses has been slow. We need more direct evidence to precisely understand the nature of the linkages between components with the help of advanced characterization techniques. In this case, the superior analytical technique is NMR that reveals the nature of the lignin-carbohydrate bond and provides greater details of main components interactions. On the other hand, spectral imaging is a valuable complementary method for in-situ visualization of the components interactions. The spatial resolution of the relevant instruments has been increasing in the past few years, and we look forward to new discoveries in the near future.
Author Contributions
Writing, X.Z. and L.L.; Supervision, F.X. All authors have read and agreed to the published version of the manuscript.
Funding
National Natural Science Foundation of China (32001272); National Natural Science Foundation of China (22178028); Programme of Introducing Talents of Discipline to Universities (Project 111, B21022).
Institutional Review Board Statement
Not applicable.
Informed Consent Statement
Not applicable.
Data Availability Statement
Not applicable.
Acknowledgments
The authors gratefully acknowledge the financial support from the National Natural Science Foundation of China (32001272, 22178028) and the Programme of Introducing Talents of Discipline to Universities (Project 111, B21022).
Conflicts of Interest
The authors declare no conflict of interest.
References
- Fry, S.C. The Growing Plant Cell Wall: Chemical and Metabolic Analysis; Longman Scientific & Technical: New York, NY, USA, 1988. [Google Scholar]
- Puls, J. Chemistry and biochemistry of hemicelluloses: Relationship between hemicellulose structure and enzymes required for hydrolysis. Macromol. Symp. 1997, 120, 183–196. [Google Scholar] [CrossRef]
- Freudenberg, K.; Neish, A.C. Constitution and Biosynthesis of Lignin; Springer: Berlin/Heidelberg, Germany, 1968. [Google Scholar]
- Alén, R. Structure and chemical composition of wood. For. Prod. Chem. 2000, 3, 11–57. [Google Scholar]
- Terzopoulou, P.; Kamperidou, V. Chemical characterization of Wood and Bark biomass of the invasive species of Tree-of-heaven (Ailanthus altissima (Mill.) Swingle), focusing on its chemical composition horizontal variability assessment. Wood Mater. Sci. Eng. 2021. [Google Scholar] [CrossRef]
- Langan, P.; Petridis, L.; O’Neill, H.M.; Pingali, S.V.; Foston, M.; Nishiyama, Y.; Schulz, R.; Lindner, B.; Hanson, B.L.; Harton, S.; et al. Common processes drive the thermochemical pretreatment of lignocellulosic biomass. Green Chem. 2014, 16, 63–68. [Google Scholar] [CrossRef]
- Wyman, C. What is (and is not) vital to advancing cellulosic ethanol. Trends Biotechnol. 2007, 25, 153–157. [Google Scholar] [CrossRef]
- Lynd, L.R.; Laser, M.S.; Bransby, D.; E Dale, B.; Davison, B.; Hamilton, R.; Himmel, M.; Keller, M.; McMillan, J.D.; Sheehan, J.; et al. How biotech can transform biofuels. Nat. Biotechnol. 2008, 26, 169–172. [Google Scholar] [CrossRef]
- Sarkandi, A.F.; Montazer, M. Green Chemistry for Sustainable Textiles; Elsevier: Amsterdam, The Netherlands, 2021; pp. 137–152. [Google Scholar]
- Reza, M.; Kontturi, E.; Jääskeläinen, A.-S.; Vuorinen, T.; Ruokolainen, J. Transmission electron microscopy for wood and fiber analysis—A review. BioResources 2015, 10, 6230–6261. [Google Scholar] [CrossRef]
- Wang, Y.; Jin, Y.C. Application review of microscopic techniques on the investigation of lignocellulosic biomass pretreatment process. J. Nanjing For. Univ. 2016, 59, 155. [Google Scholar]
- Schmitt, U.; Ander, P.; Barnett, J.R.; Emons, A.M.C.; Jeronimidis, G. Wood Fibre Cell Walls: Methods to Study Their Formation, Structure and Properties; Uppsala University: Uppsala, Sweden, 2004; pp. 119–130. [Google Scholar]
- Guo, X.; Wu, Y.; Yan, N. Characterizing spatial distribution of the adsorbed water in wood cell wall of Ginkgo biloba L. by μ-FTIR and confocal Raman spectroscopy. Holzforschung 2017, 71, 415–423. [Google Scholar] [CrossRef]
- Himmel, M.E.; Ding, S.Y.; Johnson, D.K.; Adney, W.S.; Nimlos, M.R.; Brady, J.W.; Foust, T.D. Biomass recalcitrance: Engineering plants and enzymes for biofuels production. Science 2007, 315, 804–807. [Google Scholar] [CrossRef] [Green Version]
- Fengel, D. The ultrastructure of cellulose from wood. Part 2: Problems of the isolation of cellulose. Wood Sci. Technol. 1970, 4, 15–35. [Google Scholar] [CrossRef]
- Fackler, K.; Stevanic, J.S.; Ters, T.; Hinterstoisser, B.; Schwanninger, M.; Salmén, L. FT-IR imaging microscopy to localise and characterise simultaneous and selective white-rot decay within spruce wood cells. Holzforschung 2011, 65, 411–420. [Google Scholar] [CrossRef]
- Gierlinger, N. Chemical imaging of poplar wood cell walls by confocal Raman microscopy. Plant Physiol. 2006, 140, 1246–1254. [Google Scholar] [CrossRef] [PubMed] [Green Version]
- Müller, G.; Polle, A. Imaging of lignin and cellulose in hardwood using fourier transform infrared microscopy-comparison of two methods. N. Z. J. For. Sci. 2009, 39, 225–231. [Google Scholar]
- Gierlinger, N.; Keplinger, T.; Harrington, M. Imaging of plant cell walls by confocal Raman microscopy. Nat. Protoc. 2012, 7, 1694–1708. [Google Scholar] [CrossRef]
- Agarwal, U.P. Raman imaging to investigate ultrastructure and composition of plant cell walls: Distribution of lignin and cellulose in black spruce wood (Picea mariana). Planta 2006, 224, 1141–1153. [Google Scholar] [CrossRef]
- Pauly, M.; Gille, S.; Liu, L.; Mansoori, N.; de Souza, A.; Schultink, A.; Xiong, G. Hemicellulose biosynthesis. Planta 2013, 238, 627–642. [Google Scholar] [CrossRef]
- Fengel, D.; Wegener, G. Wood: Chemistry, Ultrastructure, Reactions; Walter de Gruyter: Berlin, Germany, 2011. [Google Scholar]
- Ruel, K.; Joseleau, J.-P. Use of enzyme-gold complexes for the ultrastructural localization of hemicelluloses in the plant cell wall. Histochemistry 1984, 81, 573–580. [Google Scholar] [CrossRef]
- Maeda, Y.; Awano, T.; Takabe, K.; Fujita, M. Immunolocalization of glucomannans in the cell wall of differentiating tracheids in Chamaecyparis obtusa. Protoplasma 2000, 213, 148–156. [Google Scholar] [CrossRef]
- Kim, J.S.; Awano, T.; Yoshinaga, A.; Takabe, K. Temporal and spatial immunolocalization of glucomannans in differentiating earlywood tracheid cell walls of Cryptomeria japonica. Planta 2010, 232, 545–554. [Google Scholar] [CrossRef]
- Kim, J.S.; Sandquist, D.; Sundberg, B.; Daniel, G. Spatial and temporal variability of xylan distribution in differentiating secondary xylem of hybrid aspen. Planta 2012, 235, 1315–1330. [Google Scholar] [CrossRef] [PubMed]
- Zeng, Y.; Yarbrough, J.M.; Mittal, A.; Tucker, M.P.; Vinzant, T.B.; Decker, S.R.; Himmel, M.E. In situ label-free imaging of hemicellulose in plant cell walls using stimulated Raman scattering microscopy. Biotechnol. Biofuels 2016, 9, 256. [Google Scholar] [CrossRef] [PubMed] [Green Version]
- Zhang, X.; Chen, S.; Ramaswamy, S.; Kim, Y.S.; Xu, F. Obtaining pure spectra of hemicellulose and cellulose from poplar cell wall Raman imaging data. Cellulose 2017, 24, 4671–4682. [Google Scholar] [CrossRef]
- Schmitt, U.; Melcher, E. Section staining with potassium permanganate for transmission electron microscopy: A useful tool for lignin localisation. Wood Fibre Cell Walls: Methods to Study Their Formation, Structure and Properties 2004, 105–117. [Google Scholar]
- Fromm, J.; Rockel, B.; Lautner, S.; Windeisen, E.; Wanner, G. Lignin distribution in wood cell walls determined by TEM and backscattered SEM techniques. J. Struct. Biol. 2003, 143, 77–84. [Google Scholar] [CrossRef]
- Donaldson, L.A. Mechanical constraints on lignin deposition during lignification. Wood Sci. Technol. 1994, 28, 111–118. [Google Scholar] [CrossRef]
- Singh, A.P.; Donaldson, L.A. Ultrastructure of tracheid cell walls in radiata pine (Pinus radiata) mild compression wood. Can. J. Bot. 1999, 77, 32–40. [Google Scholar]
- Tirumalai, V.; Agarwal, U.; Obst, J. Heterogeneity of lignin concentration in cell corner middle lamella of white birch and black spruce. Wood Sci. Technol. 1996, 30, 99–104. [Google Scholar] [CrossRef]
- Donaldson, L.A.; Singh, A.P.; Yoshinaga, A.; Takabe, K. Lignin distribution in mild compression wood of Pinus radiata. Can. J. Bot. 1999, 77, 41–50. [Google Scholar]
- Saka, S.; Thomas, R. A study of lignification in loblolly pine tracheids by the SEM-EDXA technique. Wood Sci. Technol. 1982, 16, 167–179. [Google Scholar] [CrossRef]
- Ma, J.; Zhang, Z.; Yang, G.; Mao, J.; Xu, F. Ultrastructural topochemistry of cell wall polymers in Populus nigra by transmission electron microscopy and Raman imaging. BioResources 2011, 6, 3944–3959. [Google Scholar]
- Fukazawa, K.; Imagawa, H. Quantitative analysis of lignin using an UV microscopic image analyser. Variation within one growth increment. Wood Sci. Technol. 1981, 15, 45–55. [Google Scholar] [CrossRef]
- Möller, R.; Koch, G.; Nanayakkara, B.; Schmitt, U. Lignification in cell cultures of Pinus radiata: Activities of enzymes and lignin topochemistry. Tree Physiol. 2006, 26, 201–210. [Google Scholar] [CrossRef] [PubMed] [Green Version]
- Prislan, P.; Koch, G.; Čufar, K.; Gričar, J.; Schmitt, U. Topochemical investigations of cell walls in developing xylem of beech (Fagus sylvatica L.). Holzforschung 2009, 63, 482–490. [Google Scholar] [CrossRef]
- Zobel, B.J.; Van Buijtenen, J.P. Wood Variation: Its Causes and Control; Springer Science & Business Media: New York, NY, USA, 2012. [Google Scholar]
- Liao, S.X.; Cui, K.; Sun, Q.F. Comparative study on physical and mechanical properties of normal and compressed woods from Pinus yunnanensis plantations. J. Northwest For. Univ. 2013, 28, 161–164. [Google Scholar]
- Pilate, G.; Chabbert, B.; Cathala, B.; Yoshinaga, A.; Leple, J.-C.; Laurans, F.; Lapierre, C.; Ruel, K. Lignification and tension wood. C. R. Biol. 2004, 327, 889–901. [Google Scholar] [CrossRef]
- Donaldson, L.; Singh, A. Cellular Aspects of Wood Formation; Springer: Berlin/Heidelberg, Germany, 2013; pp. 225–256. [Google Scholar]
- Lehringer, C.; Daniel, G.; Schmitt, U. TEM/FE-SEM studies on tension wood fibres of Acer spp., Fagus sylvatica L. and Quercus robur L. Wood Sci. Technol. 2009, 43, 691–702. [Google Scholar] [CrossRef]
- Čufar, K.; Koch, G.; Schmitt, U.; GričAr, J.; Zupančič, M. Anatomy, Cell Wall Structure and Topochemistry of Water-Logged Archaeological wood aged 5200 and 4500 years. IAWA J. 2008, 29, 55–68. [Google Scholar] [CrossRef] [Green Version]
- Kumar, P.; Barrett, D.M.; Delwiche, M.J.; Stroeve, P. Methods for pretreatment of lignocellulosic biomass for efficient hydrolysis and biofuel production. Ind. Eng. Chem. Res. 2009, 48, 3713–3729. [Google Scholar] [CrossRef]
- Ji, Z.; Ma, J.F.; Xu, F. Multi-scale visualization of dynamic changes in poplar cell walls during alkali pretreatment. Microsc. Microanal. 2014, 20, 566–576. [Google Scholar] [CrossRef]
- Ji, Z.; Ling, Z.; Zhang, X.; Yang, G.H.; Xu, F. Impact of Alkali Pretreatment on the Chemical Component Distribution and Ultrastructure of Poplar Cell Walls. Bioresources 2014, 9, 4159–4172. [Google Scholar] [CrossRef] [Green Version]
- Ding, D.Y.; Li, P.Y.; Zhang, X.M.; Ramaswamy, S.; Xu, F. Synergy of hemicelluloses removal and bovine serum albumin blocking of lignin for enhanced enzymatic hydrolysis. Bioresour. Technol. 2019, 273, 231–236. [Google Scholar] [CrossRef]
- Zhou, X.; Ma, J.; Ji, Z.; Zhang, X.; Ramaswamy, S.; Xu, F.; Sun, R.-C. Dilute acid pretreatment differentially affects the compositional and architectural features of Pinus bungeana Zucc. compression and opposite wood tracheid walls. Ind. Crops Prod. 2014, 62, 196–203. [Google Scholar] [CrossRef]
- Chen, S.; Zhang, X.; Ling, Z.; Ji, Z.; Ramarao, B.V.; Ramaswamy, S.; Xu, F. Probing and visualizing the heterogeneity of fiber cell wall deconstruction in sugar maple (Acer saccharum) during liquid hot water pretreatment. RSC Adv. 2016, 6, 79297–79306. [Google Scholar] [CrossRef]
- Ma, J.; Zhang, X.; Zhou, X.; Xu, F. Revealing the Changes in Topochemical Characteristics of Poplar Cell Wall During Hydrothermal Pretreatment. Bioenergy Res. 2014, 7, 1358–1368. [Google Scholar] [CrossRef]
- Ma, J.; Ji, Z.; Chen, J.C.; Zhou, X.; Kim, Y.S.; Xu, F. The mechanism of xylans removal during hydrothermal pretreatment of poplar fibers investigated by immunogold labeling. Planta 2015, 242, 327–337. [Google Scholar] [CrossRef]
- Zhang, X.; Ma, J.; Ji, Z.; Yang, G.-H.; Zhou, X.; Xu, F. Using Confocal Raman Microscopy to Real-Time Monitor Poplar Cell Wall Swelling and Dissolution during Ionic Liquid Pretreatment. Microsc. Res. Tech. 2014, 77, 609–618. [Google Scholar] [CrossRef]
- Lucas, M.; Wagner, G.L.; Nishiyama, Y.; Hanson, L.; Samayam, I.P.; Schall, C.A.; Langan, P.; Rector, K.D. Reversible swelling of the cell wall of poplar biomass by ionic liquid at room temperature. Bioresour. Technol. 2011, 102, 4518–4523. [Google Scholar] [CrossRef] [Green Version]
- Ling, Z.; Chen, S.; Zhang, X.M.; Takabe, K.; Xu, F. Unraveling variations of crystalline cellulose induced by ionic liquid and their effects on enzymatic hydrolysis. Sci. Rep. 2017, 7, 10230. [Google Scholar] [CrossRef]
- Chen, S.; Zhang, X.; Ling, Z.; Xu, F. Characterization of the Micromorphology and Topochemistry of Poplar Wood during Mild Ionic Liquid Pretreatment for Improving Enzymatic Saccharification. Molecules 2017, 22, 115. [Google Scholar] [CrossRef] [Green Version]
- Li, P.; Zhang, Q.; Zhang, X.; Zhang, X.; Pan, X.; Xu, F. Subcellular dissolution of xylan and lignin for enhancing enzymatic hydrolysis of microwave assisted deep eutectic solvent pretreated Pinus bungeana Zucc. Bioresour. Technol. 2019, 288, 121475. [Google Scholar] [CrossRef] [PubMed]
- Nishiyama, Y.; Sugiyama, J.; Chanzy, H.; Langan, P. Crystal structure and hydrogen bonding system in cellulose Iα from synchrotron X-ray and neutron fiber diffraction. J. Am. Chem. Soc. 2003, 125, 14300–14306. [Google Scholar] [CrossRef] [PubMed]
- Nishiyama, Y.; Langan, P.; Chanzy, H. Crystal structure and hydrogen-bonding system in cellulose Iβ from synchrotron X-ray and neutron fiber diffraction. J. Am. Chem. Soc. 2002, 124, 9074–9082. [Google Scholar] [CrossRef] [PubMed]
- Barnett, J.R.; Bonham, V.A. Cellulose microfibril angle in the cell wall of wood fibres. Biol. Rev. 2004, 79, 461–472. [Google Scholar] [CrossRef]
- Huang, C. Comparison of microfibril angle measurement techniques. Microfibril Angle Wood 1998, 177–205. [Google Scholar]
- Sourisseau, C. Polarization measurements in macro-and micro-Raman spectroscopies: Molecular orientations in thin films and azo-dye containing polymer systems. Chem. Rev. 2004, 104, 3851–3892. [Google Scholar] [CrossRef]
- Sereda, V.; Sawaya, M.R.; Lednev, I.K. Structural organization of insulin fibrils based on polarized Raman spectroscopy: Evaluation of existing models. J. Am. Chem. Soc. 2015, 137, 11312–11320. [Google Scholar] [CrossRef]
- Gierlinger, N.; Luss, S.; Konig, C.; Konnerth, J.; Eder, M.; Fratzl, P. Cellulose microfibril orientation of Picea abies and its variability at the micron-level determined by Raman imaging. J. Exp. Bot. 2010, 61, 587–595. [Google Scholar] [CrossRef]
- Sun, L.; Singh, S.; Joo, M.; Vega-Sanchez, M.; Ronald, P.; Simmons, B.; Adams, P.; Auer, M. Non-invasive imaging of cellulose microfibril orientation within plant cell walls by polarized Raman microspectroscopy. Biotechnol. Bioeng. 2016, 113, 82–90. [Google Scholar] [CrossRef] [Green Version]
- Atalla, R.H.; Agarwal, U.P. Raman microprobe evidence for lignin orientation in the cell walls of native woody tissue. Science 1985, 227, 636–638. [Google Scholar] [CrossRef]
- Fengel, D. The ultrastructure of cellulose from wood. Part 1: Wood as the basic material for the isolation of cellulose. Wood Sci. Technol. 1969, 3, 203–217. [Google Scholar] [CrossRef]
- Boerjan, W.; Ralph, J.; Baucher, M. Lignin biosynthesis. Annu. Rev. Plant Biol. 2003, 54, 519–546. [Google Scholar] [CrossRef] [PubMed]
- Walker, J.C.F. Basic wood chemistry and cell wall ultrastructure. In Primary Wood Processing; Springer: Dordrecht, The Netherlands, 2006; pp. 23–67. [Google Scholar]
- Pérez, S.; Mazeau, K. Conformations, structures, and morphologies of celluloses. In Polysaccharides: Structural Diversity and Functional Versatility, 2nd ed.; Dumitriu, S., Ed.; Marcel Dekker: New York, NY, USA, 2005. [Google Scholar]
- Fengel, D. Ultrastructural behaviour of cell wall polysaccharides. Tappi 1970, 53, 497–503. [Google Scholar]
- Ding, S.-Y.; Himmel, M.E. The maize primary cell wall microfibril: A new model derived from direct visualization. J. Agric. Food Chem. 2006, 54, 597–606. [Google Scholar] [CrossRef] [PubMed]
- Gross, A.S.; Bell, A.T.; Chu, J.-W. Preferential interactions between lithium chloride and glucan chains in N,N-dimethylacetamide drive cellulose dissolution. J. Phys. Chem. B 2013, 117, 3280–3286. [Google Scholar] [CrossRef]
- Page, D.H. A note on the cell-wall structure of softwood tracheids. Wood Fiber 1976, 7, 246–248. [Google Scholar]
- Terrett, O.M.; Dupree, P. Covalent interactions between lignin and hemicelluloses in plant secondary cell walls. Curr. Opin. Biotechnol. 2019, 56, 97–104. [Google Scholar] [CrossRef] [Green Version]
- Balakshin, M.; Capanema, E.; Berlin, A. Isolation and analysis of lignin–carbohydrate complexes preparations with traditional and advanced methods: A review. Stud. Nat. Prod. Chem. 2014, 42, 83–115. [Google Scholar]
- Giummarella, N.; Pu, Y.; Ragauskas, A.J.; Lawoko, M. A critical review on the analysis of lignin carbohydrate bonds. Green Chem. 2019, 21, 1573–1595. [Google Scholar] [CrossRef]
- Simmons, T.J.; Mortimer, J.C.; Bernardinelli, O.D.; Pöppler, A.-C.; Brown, S.P.; de Azevedo, E.R.; Dupree, R.; Dupree, P. Folding of xylan onto cellulose fibrils in plant cell walls revealed by solid-state NMR. Nat. Commun. 2016, 7, 13902. [Google Scholar] [CrossRef]
- Kang, X.; Kirui, A.; Widanage, M.C.D.; Mentink-Vigier, F.; Cosgrove, D.J.; Wang, T. Lignin-polysaccharide interactions in plant secondary cell walls revealed by solid-state NMR. Nat. Commun. 2019, 10, 347. [Google Scholar] [CrossRef] [PubMed]
- Terrett, O.M.; Lyczakowski, J.J.; Yu, L.; Iuga, D.; Franks, W.T.; Brown, S.P.; Dupree, R.; Dupree, P. Molecular architecture of softwood revealed by solid-state NMR. Nat. Commun. 2019, 10, 4978. [Google Scholar] [CrossRef] [PubMed] [Green Version]


Publisher’s Note: MDPI stays neutral with regard to jurisdictional claims in published maps and institutional affiliations. |
© 2022 by the authors. Licensee MDPI, Basel, Switzerland. This article is an open access article distributed under the terms and conditions of the Creative Commons Attribution (CC BY) license (https://creativecommons.org/licenses/by/4.0/).