Article

Proof-of-Principle That Cellular Automata Can Be Used to Predict Infestation Risk by Reticulitermes grassei (Blattodea: Isoptera)

1
BioISI-Biosystems & Integrative Sciences Institute, Faculty of Sciences, University of Lisbon, Campo Grande, C8 bdg, 1749-016 Lisboa, Portugal
2
MED-Mediterranean Institute for Agriculture, Environment and Development, Instituto de Investigação e Formação Avançada, Universidade de Évora, Pólo da Mitra, Ap. 94, 7006-554 Evora, Portugal
3
Instituto Superior de Agronomia, Universidade de Lisboa, Tapada da Ajuda, 1349-017 Lisboa, Portugal
4
LEAF-Linking Landscape, Environment, Agriculture and Food, Tapada da Ajuda, 1349-017 Lisboa, Portugal
5
Department Wood Science and Engineering, Luleå University of Technology, Forskargatan 1, S-93197 Skelleftea, Sweden
6
Department of Wood Processing and Biomaterials, Faculty of Forestry and Wood Sciences, Czech University of Life Sciences Prague, Kamýcká 1176, Praha 6-Suchdol, 16521 Prague, Czech Republic
7
Department of Wood Engineering, Polytechnic Institute of Viseu, Av. Cor. José Maria Vale de Andrade, 3504-510 Viseu, Portugal
8
Centre for Natural Resources, Environment and Society-CERNAS-IPV Research Centre, Av. Cor. José Maria Vale de Andrade, 3504-510 Viseu, Portugal
9
Structures Department, National Laboratory for Civil Engineering, Av. do Brasil, 101, 1700-066 Lisbon, Portugal
10
cE3c, Centre for Ecology, Evolution and Environmental Changes, Azorean Biodiversity Group, University of Azores, 9700-042 Angra do Heroísmo, Portugal
*
Author to whom correspondence should be addressed.
Forests 2022, 13(2), 237; https://doi.org/10.3390/f13020237
Submission received: 16 December 2021 / Revised: 13 January 2022 / Accepted: 1 February 2022 / Published: 3 February 2022
(This article belongs to the Special Issue Evaluation and Protection of Wood and Wood Products)

Abstract

:
Over the past few decades, species distribution modelling has been increasingly used to monitor invasive species. Studies herein propose to use Cellular Automata (CA), not only to model the distribution of a potentially invasive species but also to infer the potential of the method in risk prediction of Reticulitermes grassei infestation. The test area was mainland Portugal, for which an available presence-only dataset was used. This is a typical dataset type, resulting from either distribution studies or infestation reports. Subterranean termite urban distributions in Portugal from 1970 to 2001 were simulated, and the results were compared with known records from both 2001 (the publication date of the distribution models for R. grassei in Portugal) and 2020. The reported model was able to predict the widespread presence of R. grassei, showing its potential as a viable prediction tool for R. grassei infestation risk in wooden structures, providing the collection of appropriate variables. Such a robust simulation tool can prove to be highly valuable in the decision-making process concerning pest management.

1. Introduction

Given the importance of monitoring potential pest species and understanding their responses to different environmental conditions, species distribution modelling has assumed an increasingly significant role over the last few decades [1,2]. Species distribution models have attempted to disentangle species-environment relationship by using sites of known occurrence and non-occurrence, together with environmental variables over a wider study area [3]. However, data relating to true absence are rarely available, as the absence of a given species may not be clearly distinguished from a lack of record. Hence, presence-only datasets are commonly used in analytical biology [4].
In order to model these types of datasets, several statistical methods have been proposed [4,5]. For this study, Cellular Automata (CA) [6] was selected, because of its inherent simplicity and versatility, as it can simulate a variety of real-world systems, including biological and ecological ones. CA is defined as being an infinite set of finite automata spatially organized in cells. Each automaton can evolve between discrete states defined by transition functions that consider the states of the neighboring automata [7]. Despite having a relatively simple conceptual basis, CA can handle very complex ecological systems and, as a result, is popular for studying spatially extended dynamics [7].
Reticulitermes Holmgren is a Holarctic genus of subterranean termite indigenous to North America, the Mediterranean and Black Sea regions eastern Asia [8]. Both within their native range and invaded areas, several Reticulitermes species have pest status because they use wood and woody materials as their food source; their high economic impact makes them one of the major deterioration agents of wood in buildings [9].
Subterranean termites are social insects organized in a caste system (colony) where each cast plays a certain role: the workers, which look for food as part of their role of sustaining the colony; the soldiers, which mainly defend the colony from predators; the winged reproductives, whose mission is mainly the colony dispersion [10]. They require contact to soil and moisture for the colony to establish and live. They also have negative phototropism and, as a result, they usually live in galleries underground (or inside the wood), built by themselves [10]. This behavior makes it difficult to find and control them, as often an infestation is only detected at a relatively late stage.
The genus Reticulitermes Holmgren is suggested to be originally from the West European zone [11], although these termites are widespread globally, which is due to their invasive traits that increase the probability of creating viable propagules [12]. In Europe, seven Reticulitermes species have been described as native to the region, covering a Mediterranean strip ranging from the Iberian Peninsula to north-eastern Greece, Crete and Cyprus [9,13,14,15,16,17,18]. Termite damage to wooden structures and agriculture products, in these areas, are increasing, and colonization in areas more northerly to their natural range, together with impacts of climate change are concerning. The highly invasive Reticulitermes flavipes (Kollar) is spreading its range in Europe [19] and has already been identified in the most westerly points of Europe, including the Azorean islands [8,20] and Tenerife, with their voracious presence in the latter creating havoc in 2019 [21].
In mainland Portugal, the only subterranean termite that has been identified to date belongs to the species Reticulitermes grassei Clément [9] which was, up until 2006, included in the complex Reticulitermes lucifugus. R. grassei originated from southwestern Europe (Iberian Peninsula and France) and was identified in Britain and in Faial Island of the Azores (~2000) [20,22]. More recently, R. grassei has also been identified in Zurich, Swizerland, a country with no native termites [23]. The first written reports of termites in Portugal date back to the early 20th Century [24], but their presence and impact in buildings has since been the object of several different reports, including initial models of distribution [25]. The importance of this species in the conservation of historic buildings has also been reported, together with the last published distribution maps [26].
In this work, termite distribution in urban areas in Portugal from 1970 to 2001 (the most recent date for the publication of distribution models for R. grassei in Portugal [25]), was processed using Cellular Automata in a first approach to develop a simulation tool that can be used to help predict R. grassei infestation risk. At this stage, we do not aim to add extra data to those previously published, but to discuss the potential of the approach towards this future development of a truly infestation risk predictor.

2. Materials and Methods

An evaluation of termite distribution in the Portuguese mainland from 1970 to 2001 was undertaken to develop a simulation tool that can be used to predict R. grassei infestation risk.
To define the initial conditions of the simulation, an account of termite existence reports up until 1970 was carried out. This led to a representation of the Portuguese counties which have reports of termite occurrence prior to the defined starting date (Figure 1a).
Consequently, using the Universal Transverse Mercator (UTM), as previously reported by Nobre and Nunes in 2001 [25], the Portuguese mainland territory was divided into 50 × 50 km cells (Figure 1b) so that a Cellular Automata could be developed and simulated throughout time. At this stage, the choice for 50 × 50 km cells was made taking into consideration the available supporting information and its resolution power (lower cell sizes, albeit potentially more accurate, lack data; bigger cell sizes lack the discriminatory powers of the variables considered). The Portuguese mainland landscape was represented and simulated as a 11 × 6 grid. This led to the identification of the cells in which termite presence could be considered, according to the counties these cells encompass (Figure 2). In addition, the cells in which no Portuguese territory existed were programmed to never have termites (the probability of a transition from not having termites to having termites was considered 0). This adjustment made the area considered for the simulation 112.500 km2, a much closer value to the real 92.212 km2, when comparing to the 165.000 km2 considered prior to this adjustment. Markov chains were considered for each cell, allowing the creation of a stochastic model to predict the cells’ next state. The transition matrix of each cell was different, as the conditions of the encompassed territory changed.
For each cell, two different states were defined: (1) Termites are present; (2) Termites are not present; the transition between the two was dependent on both the cells characteristics, i.e., human population (HP), insolation (IS), days of rainfall in a year (DR) and leptosols (LS), and the presence/absence of termites in the surrounding cells. The elements taken into consideration to analyze the cells’ probability to host termites were the ones that Nobre and Nunes [25] found as the most relevant to calculate the probability of the presence of R. grassei, which is given by:
P R. grassei = 1 1 + e z
where z is given by:
z = −8.2253 + 0.5769HP − 0.5967LS + 1.0364IS + 0.9936DR
However, in order for termite presence in the surrounding cells to be incorporated into the probability of R. grassei presence, the following formula was postulated:
P R. grassei = 1 1 + e z + 1 1 + e z N E
with NE being a neighborhood termite presence and possibly exhibiting two different potential values (0 or 1, depending on whether termites exist in at least one of the neighboring cells, while considering a Moore neighborhood, i.e., the 8 surrounding cells around a central square on a two-dimensional lattice).
To calculate z, the values of HP, LS, IS, and DR must be defined in classes, as shown in Table 1, Table 2, Table 3 and Table 4, respectively. The classification of each cell that encompassed more than one county, regarding the LS, IS, and DR, was done according to class prevalence, meaning that the class given to a cell was the one which represented most of the counties in the given cell. For HP, the total inhabitants of the counties in a given cell were calculated, and the class given to that cell was done accordingly.
After class fitting, the probabilities for each cell were calculated and used in the simulations. The simulation tool was developed in Python 3.8 [27], and the modules used for the simulations were Pandas [28] and NumPy [29].
Additionally, a simple map with the R. grassei presence, as reported up to 2020 on a termite occurrence data base maintained by the National Laboratory for Civil Engineering (LNEC), was constructed, to further evaluate our predictions. The rationality behind this is based on the reported observation of termite occurrence being linked to the infestation of wood in buildings, which implies a delay of the reporting process and results in a cumulative dataset where current reported incidences likely reflect events that initiated years before.

3. Results

The 31-year span simulation resulted in the termite distribution throughout mainland Portugal presented in Figure 3. According to the simulation, termite distribution in the Portuguese mainland should have been almost complete, with termites being expected to exist in all but three counties of the Portuguese mainland territory (Figure 3). The lower probability for termite infestation to occur in the three north-east counties resulted from the prevalent landscape conditions combined with the reduced number of neighboring cells’ a consequence to it being in the extremities of the simulated model.
The constructed map of reported R. grassei infestations until 2020 (Figure 4b) is shown against the initial map of the reported cases until 1970 (Figure 4a) for easiness of comparison.

4. Discussion

The model herein predicted the widespread risk of presence of R. grassei, with the exception of a single cell. Interestingly, this cell corresponded to the lowest population density (the cells class for HP was 6). Furthermore, the region showed a relatively large area of leptosols, characterized by either a very shallow soil over hard rock or a deeper soil that was extremely gravelly and/or stony (leptosols class 3). Either way, these are soils that theoretically hinder subterranean nesting and foraging activities, and hence lead to a decrease in that cell’s probability to host subterranean termites.
Nevertheless, as Nobre and Nunes [25] mentioned, there is a clear association between the data used and human variables, meaning that the model (and, consequently, the simulation tool which was based on it) is not supposed to be used to address the question of natural termite distribution nor of habitat selection, but only of the association between human societies development and termite infestation of buildings.
Based on the previously found relevant ecological variables to R. grassei distribution [25], the developed model predicted a more widespread presence of the termites than previously reported in 2001. This is, however, not surprising and can be described by two factor classifications:
Inherent to the CA Approach
(a)
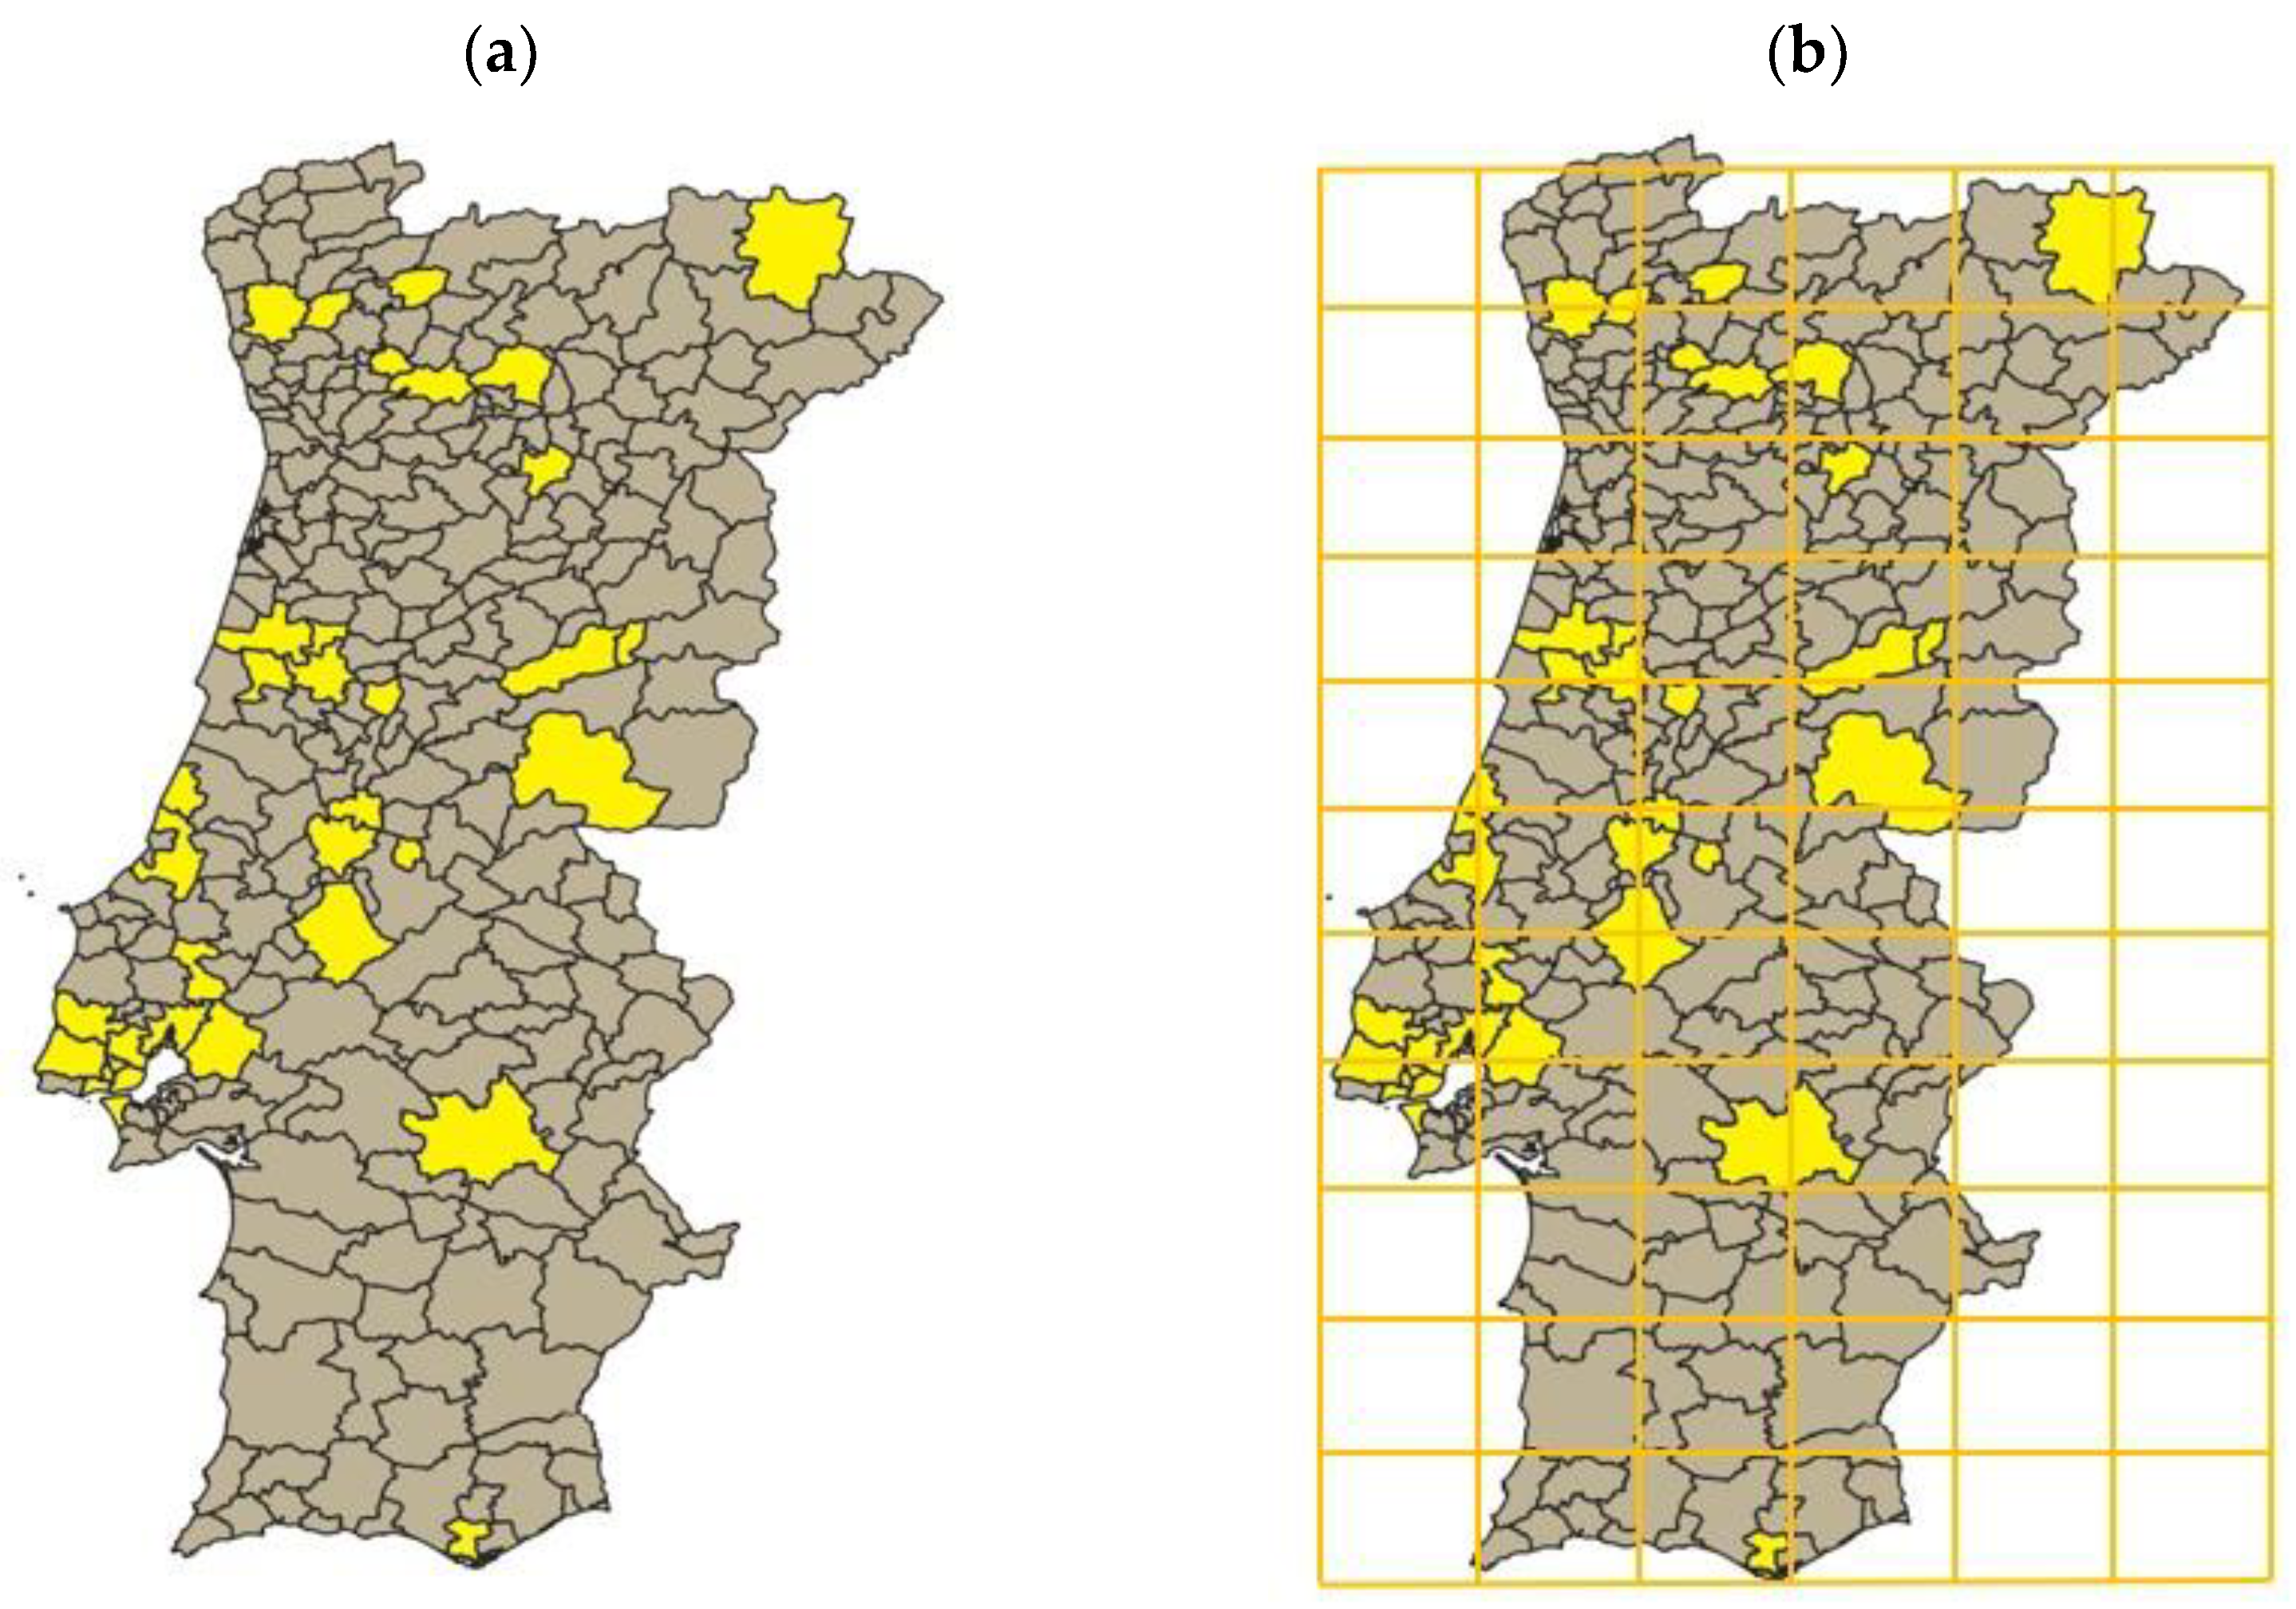
The classification of each cell for LS, IS, and DR was undertaken according to the most frequent class present in the totality of the region. However, if smaller cells had been considered, the classes of each zone might have been different, which would have led to larger, or smaller, probabilities for termite infestation;
(b)
Relatively large cells were considered; thus, the HP class of each cell was invariably high (larger cells comprehend more counties and, hence, more people), meaning that the class given for a specific cell was, most of the times, larger than 8. This had a very significant impact as, according to Nobre and Nunes [25], HP weight in the probability for R. grassei existence increases exponentially with class increase;
(c)
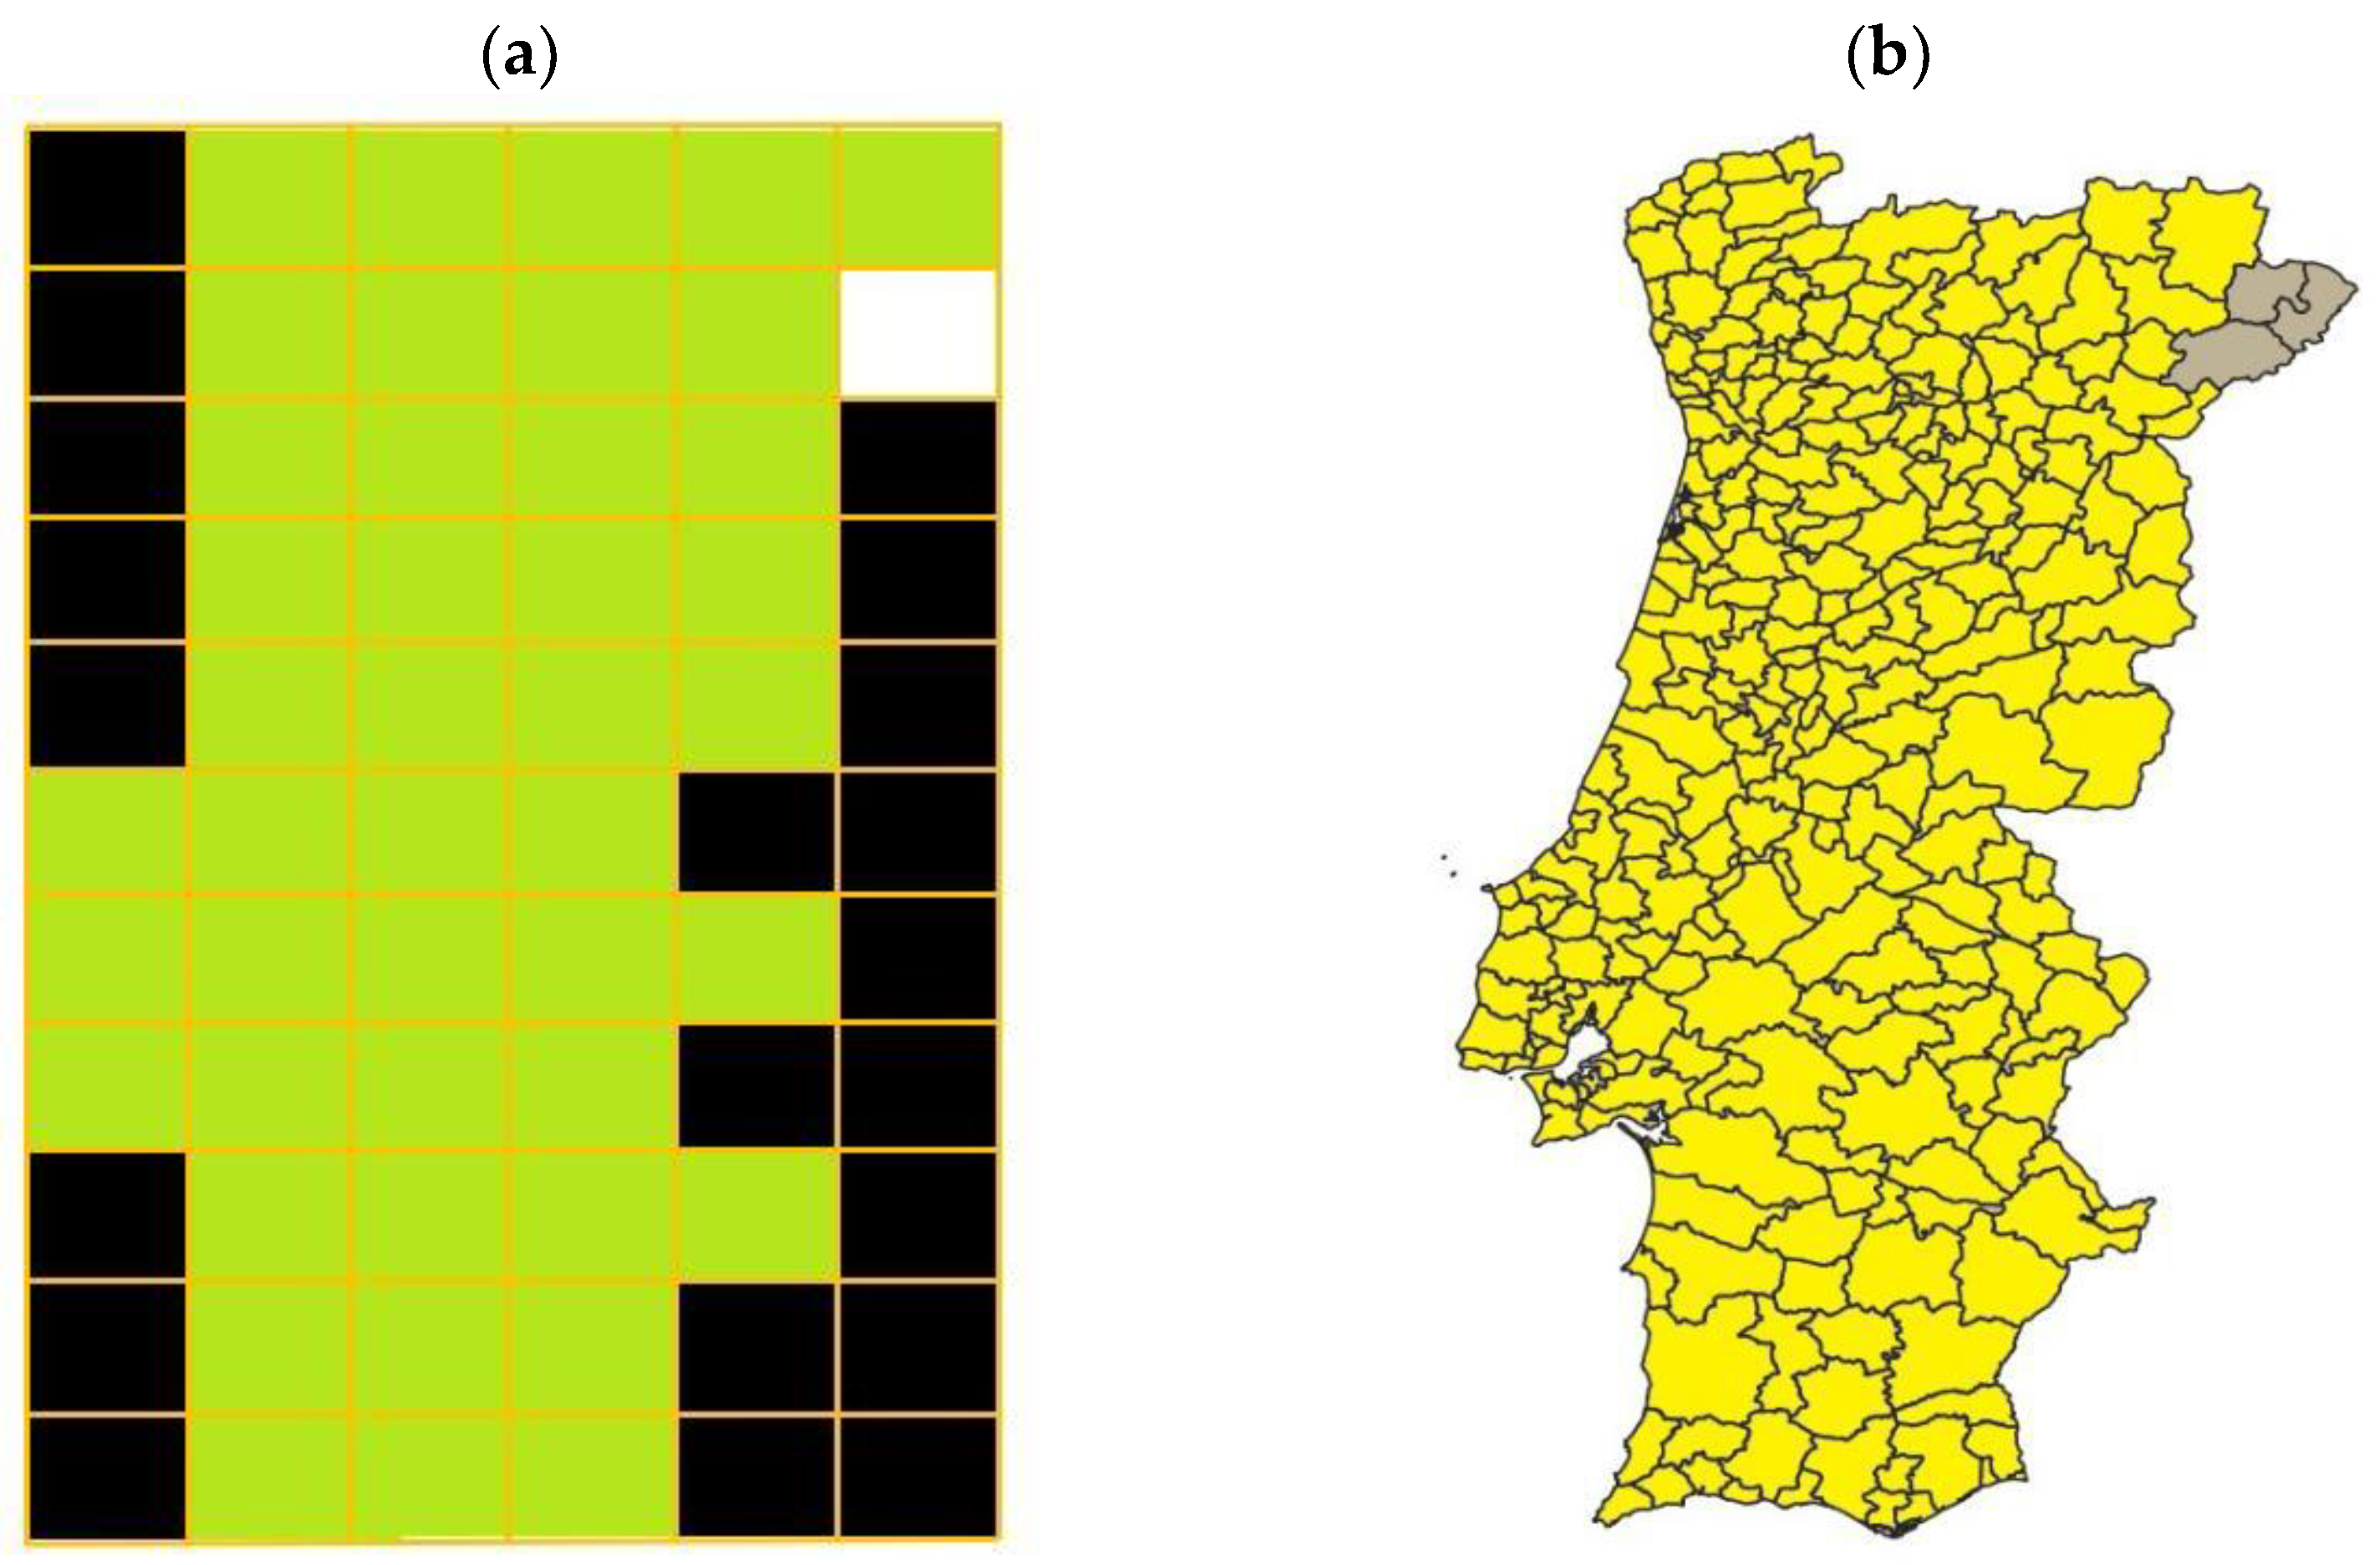
Termite presence in the neighboring cells was postulated to double the probability of termite establishment in each cell. However, this value was not mathematically estimated, meaning that the real predicted influence on the R. grassei probability could possibly be different (and vary with the number of surrounding cells with termite pest infestation, something that was also not considered in the developed simulation tool).
Inherent to Data Collection and Variables Used
(a)
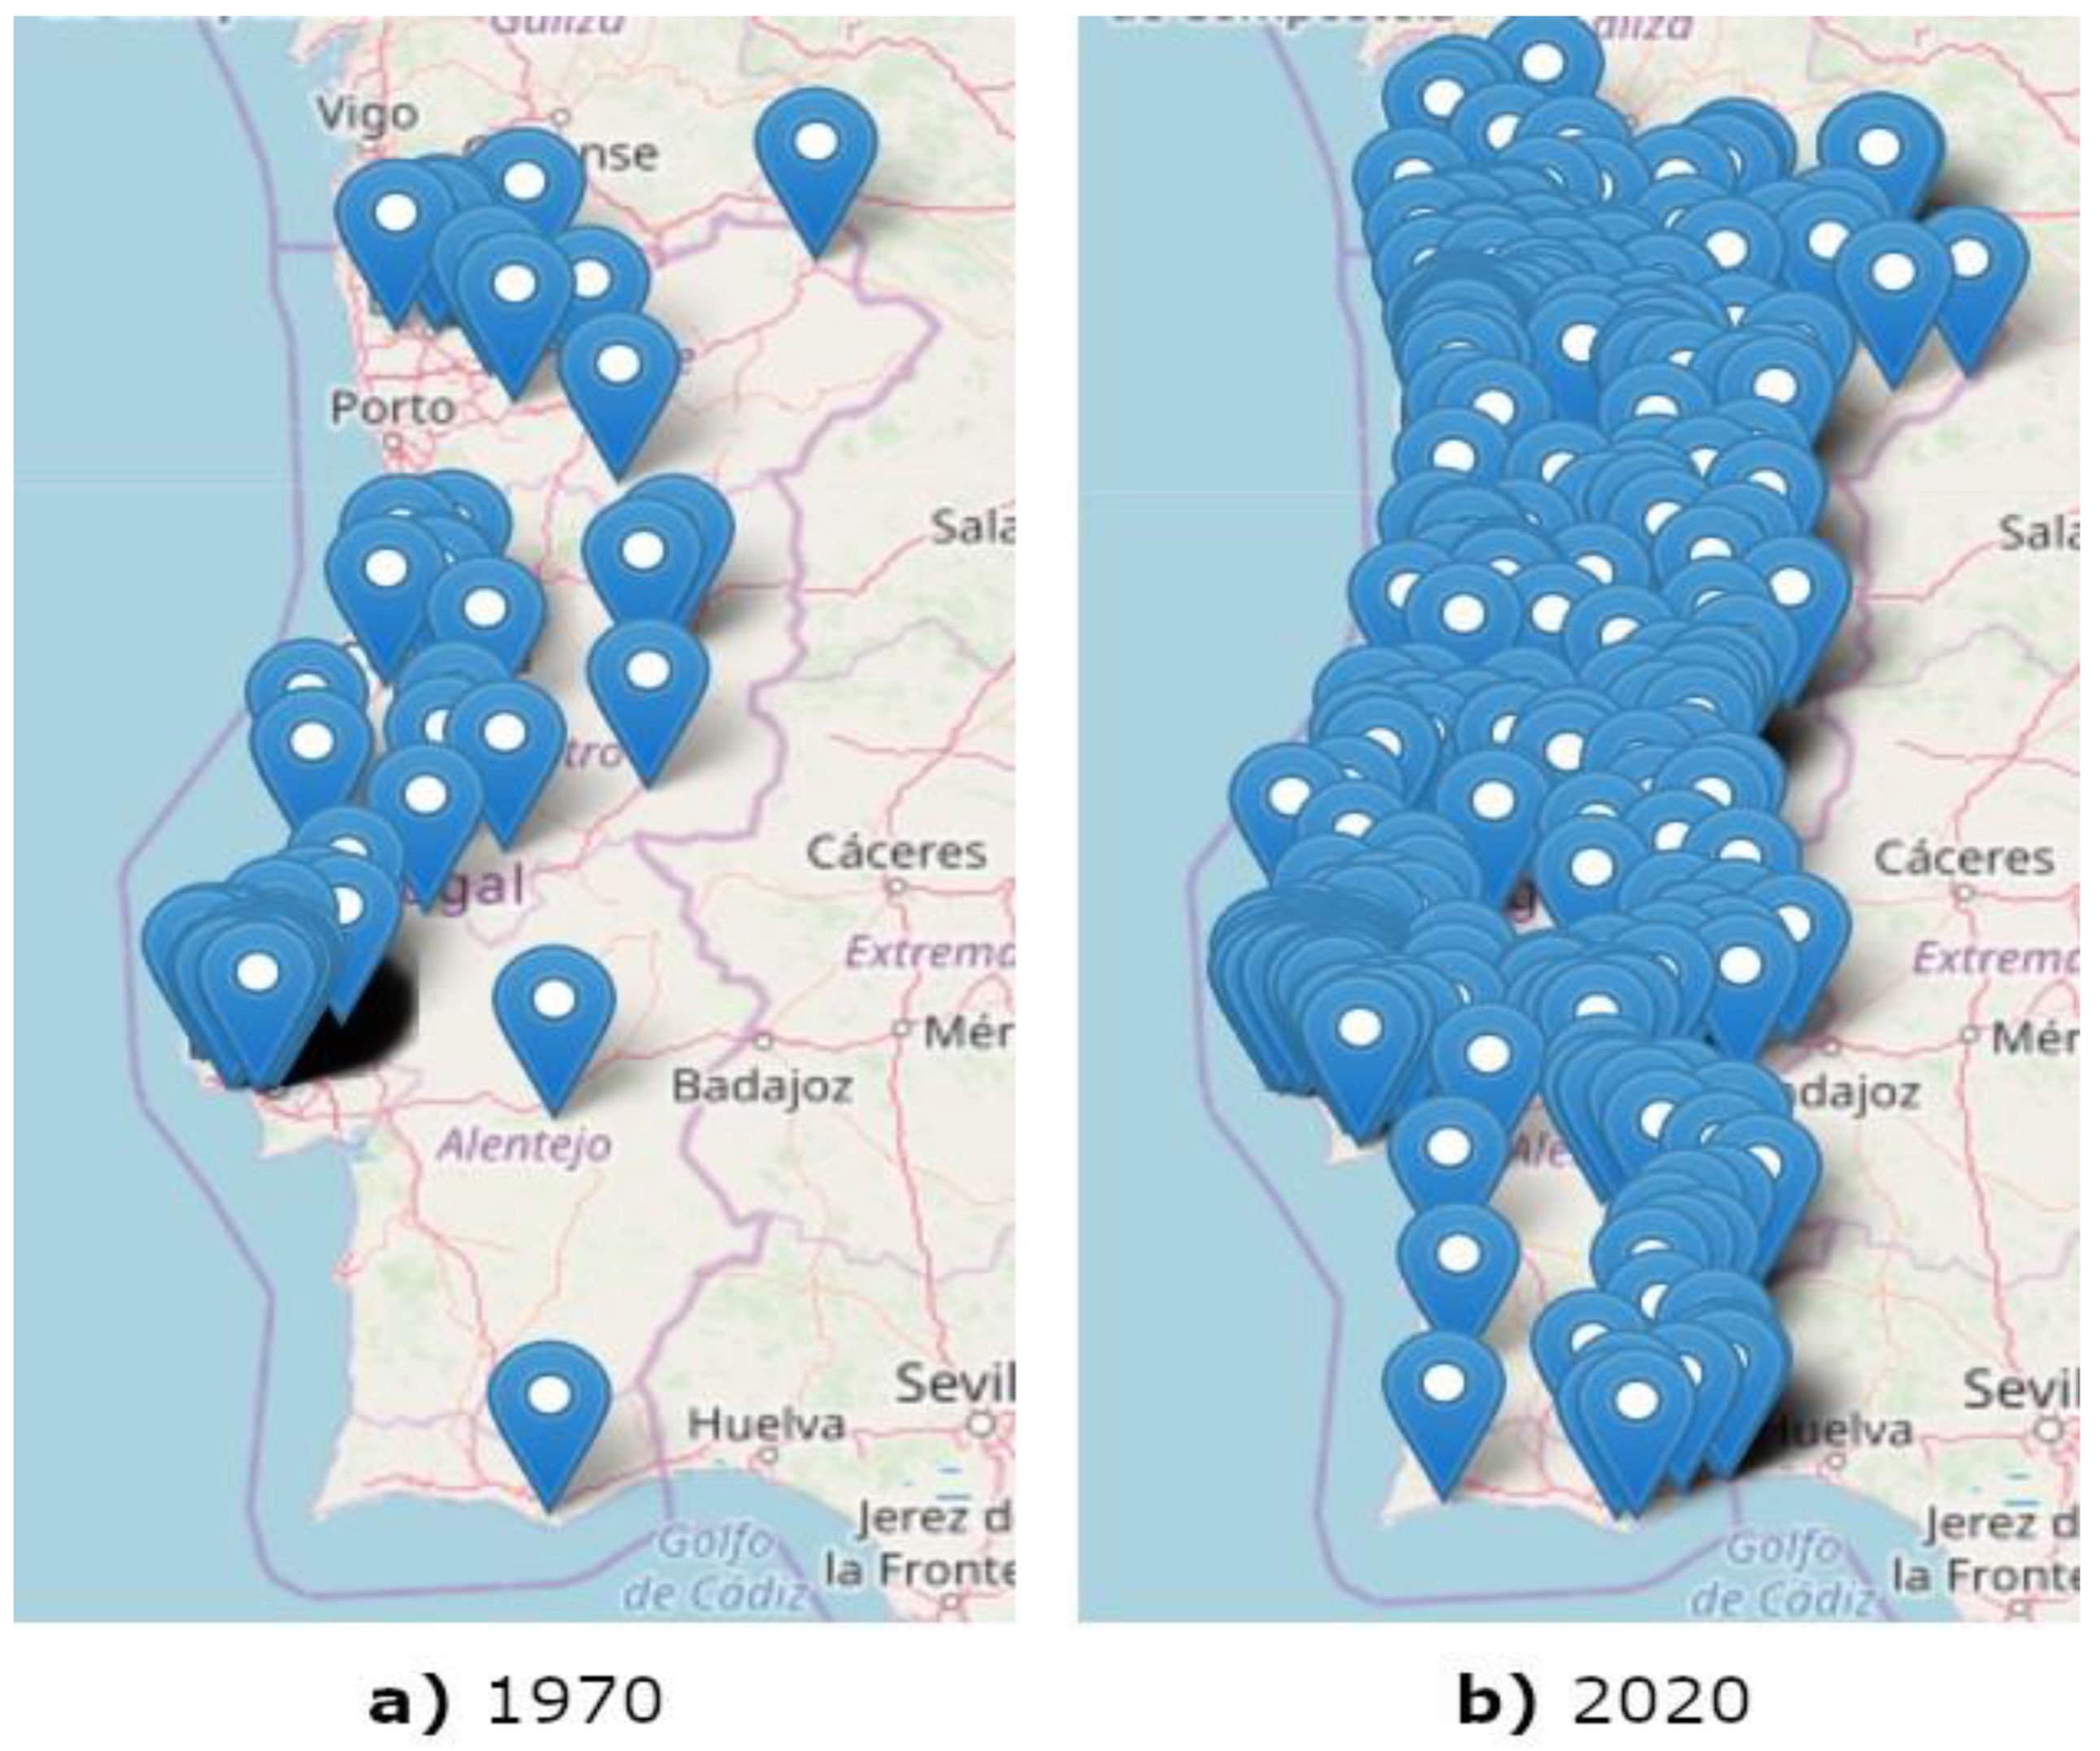
Almost every reported observation of termites was performed due to an infestation of wood in buildings. This means that there could be many other locations where termites existed (and were deteriorating agents of wood in buildings) but were not reported to date. This would suggest that, as years go by and the number of reports increase, the number of affected counties should also increase. This is exactly what has happened and, nowadays, R. grassei distribution in applied wood in mainland Portugal covers a much larger area (as can be seen in Figure 4b).
(b)
The variables used were ecological variables only, whereas the presence data were almost exclusively from infestations reports. No variables considering timeframe and infestation dynamics as well as on the likelihood of infestation report and time since first occurrence were considered.
The potential of the approach is clear, albeit the indicated need of improvement towards a better fitting infestation model. For designing such a model, it is necessary to include meaningful variables related to building materials, building physics, infestation dynamics, and human infestation tolerance threshold. To achieve this, a stepwise approach similar to that undertaken with the ecological variables is suggested. Once the significant variables are identified, the CA approach could be applied towards a more robust R. grassei infestation risk map.
Enhancement of prediction capability could also be achieved with a more refined size cell. As such, it would be relevant to simulate the Portuguese mainland landscape with progressively but feasible smaller cells to select the scale in which no more significant predictability improvement could be reached. Needless to say, the simulation tool should be updated with a new and revised mathematical model for the probability of R. grassei existence that includes environmental and ecological variables and building and sociological ones. This should be done alongside the incorporation of a term that considers the number of neighboring cells where termites are present to calculate the likelihood of termite presence at a given time point. Finally, it would be interesting to also add a graphical interface for a better visualization of the termite population in the considered grid throughout time. Once such a robust infestation risk model is obtained, similar postulations considering different climate change scenarios may be determined, thus increasing its value as a termite pest management tool.

5. Conclusions

The possibility of predicting the infestation risk by R. grassei using CA has been shown. Such a simulation tool, once optimized, will be useful in the control of termite infestation. The prediction of an event before it happens is an extremely valuable tool in decision making within a sustainable pest management framework. However, there are still several improvements that need to be undertaken for the developed simulation model to be considered as a viable prediction tool for R. grassei infestation risk map.

Author Contributions

Conceptualization, J.G.N.S., L.N. and T.N.; methodology, J.G.N.S. and T.N.; software, J.G.N.S.; validation, J.G.N.S., T.N. and L.N.; formal analysis, L.N.; investigation, J.G.N.S.; resources, L.N. and D.J.; data curation, L.N., S.D. and B.E.; writing—original draft preparation, J.G.N.S., S.D. and T.N.; writing—review and editing, all authors; visualization, J.G.N.S.; supervision, L.N.; project administration, L.N. All authors have read and agreed to the published version of the manuscript.

Funding

TN was supported by the “Fundação para a Ciência e Tecnologia” (FCT–Portugal), through the research project PTDC/ASP-PLA/30650/2017. DJ was supported through the project “Advanced research supporting the forestry and wood-processing sector’s adaptation to global change and the 4th industrial revolution”, OP RDE (Grant No. CZ.02.1.01/0.0/0.0/16_019/0000803) and CT WOOD—a center of excellence at Luleå University of Technology supported by the Swedish wood industry.

Institutional Review Board Statement

Not applicable.

Informed Consent Statement

Not applicable.

Data Availability Statement

Not applicable.

Conflicts of Interest

The authors declare no conflict of interest.

References

  1. Guisan, A.; Thuiller, W. Predicting species distribution: Offering more than simple habitat models. Ecol. Lett. 2005, 8, 993–1009. [Google Scholar] [CrossRef] [PubMed]
  2. Elith, J.; Leathwick, J. Predicting species distributions from museum and herbarium records using multiresponse models fitted with multivariate adaptive regression splines. Divers. Distrib. 2007, 13, 265–275. [Google Scholar] [CrossRef]
  3. Tonini, F.; Divino, F.; Lasinio, G.J.; Hochmair, H.H.; Scheffrahn, R.H. Predicting the geographical distribution of two invasive termite species from occurrence data. Environ. Entomol. 2014, 43, 1135–1144. [Google Scholar] [CrossRef] [Green Version]
  4. Phillips, S.J.; Anderson, R.P.; Schapire, R.E. Maximum entropy modeling of species geographic distributions. Ecol. Model. 2006, 190, 231–259. [Google Scholar] [CrossRef] [Green Version]
  5. Warton, D.I.; Shepherd, L.C. Poisson point process models solve the “pseudo-absence problem” for presence-only data in ecology. Ann. Appl. Stat. 2010, 4, 1383–1402. [Google Scholar]
  6. von Neumann, J. Theory of Self-Reproducing Automata; University of Illinois Press: Urbana, IL, USA, 1966; Volume 1102024. [Google Scholar]
  7. Breckling, B.; Peer, G.; Matsinos, Y.G. Modelling Complex Ecological Dynamics; Springer: Berlin/Heidelberg, Germany, 2011; pp. 105–117. [Google Scholar]
  8. Austin, J.W.; Szalanski, A.L.; Myles, T.G.; Borges, P.A.; Nunes, L.; Scheffrahn, R.H. First record of Reticulitermes flavipes (Isoptera: Rhinotermitidae) from Terceira Island (Azores, Portugal). Fla. Entomol. 2012, 95, 196–198. [Google Scholar] [CrossRef] [Green Version]
  9. Nobre, T.; Nunes, L.; Eggleton, P.; Bignell, D. Distribution and genetic variation of Reticulitermes (Isoptera: Rhinotermitidae) in Portugal. Heredity 2006, 96, 403–409. [Google Scholar] [CrossRef] [Green Version]
  10. Cruz, H.; Jones, D.; Nunes, L. Wood. In Materials for Construction and Civil Engineering; Gonçalves, M.C., Margarido, F., Eds.; Springer International Publishing: Cham, Switzerland, 2015; pp. 557–583. [Google Scholar]
  11. Meulenkamp, J.E.; Sissingh, W.; Calvo, J.P.; Daams, R.; Studencka, B.; Londeix, L.; Cahuzac, B.; Kovac, M.; Nagymarosy, A.; Rusu, A.; et al. Late Lutetian (44–41 Ma). In Atlas Peri-Tethys, Palaeogeographical Maps—Explanatory Notes; Crasquin, S., Ed.; CCGM/CGMW: Paris, France, 2000; pp. 163–170. [Google Scholar]
  12. Evans, T.A.; Forschler, B.T.; Grace, J.K. Biology of invasive termites: A worldwide review. Annu. Rev. Entomol. 2013, 58, 455–474. [Google Scholar] [CrossRef] [Green Version]
  13. Clément, J.-L.; Bagnères, A.-G.; Uva, P.; Wilfert, L.; Quintana, A.; Reinhard, J. Biosystematics of Reticulitermes termites in Europe: Morphological, chemical and molecular data. Insectes Soc. 2001, 48, 202–215. [Google Scholar] [CrossRef]
  14. Luchetti, A.; Marini, M.; Mantovani, B. Filling the European gap: Biosystematics of the eusocial system Reticulitermes (Isoptera, Rhinotermitidae) in the Balkanic Peninsula and Aegean area. Mol. Phylogenet. Evol. 2007, 45, 377–383. [Google Scholar] [CrossRef]
  15. Luchetti, A.; Velona, A.; Mueller, M.; Mantovani, B. Breeding systems and reproductive strategies in Italian Reticulitermes colonies (Isoptera: Rhinotermitidae). Insectes Soc. 2013, 60, 203–211. [Google Scholar] [CrossRef]
  16. Lefebvre, T.; Chaline, N.; Limousin, D.; Dupont, S.; Bagnères, A.-G. From speciation to introgressive hybridization: The phylogeographic structure of an island subspecies of termite, Reticulitermes lucifugus corsicus. BMC Evol. Biol. 2008, 8, 38. [Google Scholar] [CrossRef] [Green Version]
  17. Lefebvre, T.; Vargo, E.L.; Zimmermann, M.; Dupont, S.; Kutnik, M.; Bagnères, A.-G. Subterranean termite phylogeography reveals multiple postglacial colonization events in southwestern Europe. Ecol. Evol. 2016, 6, 5987–6004. [Google Scholar] [CrossRef]
  18. Ghesini, S.; Marini, M. Morphology and phylogeny of Reticulitermes sp. (Isoptera, Rhinotermitidae) from Cyprus. Bull. Entomol. Res. 2012, 102, 672–681. [Google Scholar] [CrossRef]
  19. Baudouin, G.; Bech, N.; Bagnères, A.-G.; Dedeine, F. Spatial and genetic distribution of a north American termite, Reticulitermes flavipes, across the landscape of Paris. Urban Ecosyst. 2018, 21, 751–764. [Google Scholar] [CrossRef]
  20. Ferreira, M.T.; Borges, P.A.V.; Nunes, L.; Myles, T.G.; Guerreiro, O.; Scheffrahn, R.H. Termites (Isoptera) in the Azores: An overview of the four invasive species currently present in the archipelago. Arquipel. Life Mar. Sci. 2013, 30, 39–55. [Google Scholar]
  21. Hernández-Teixidor, D.; Suárez, D.; García, J.; Mora, D. First report of the invasive Reticulitermes flavipes (Kollar, 1837) (Blattodea, Rhinotermitidae) in the Canary Islands. J. Appl. Entomol. 2019, 143, 478–482. [Google Scholar] [CrossRef]
  22. Jenkins, T.M.; Dean, R.E.; Verkerk, R.; Forschler, B.T. Phylogenetic analyses of two mitochondrial genes and one nuclear intron region illuminate European subterranean termite (Isoptera: Rhinotermitidae) gene flow, taxonomy, and introduction dynamics. Mol. Phylogenet. Evol. 2001, 20, 286–293. [Google Scholar] [CrossRef] [Green Version]
  23. Ghesini, S.; Müller, G.; Marini, M. First record of the subterranean termite Reticulitermes grassei in Switzerland. Bull. Insectol. 2020, 73, 149–151. [Google Scholar]
  24. Seabra, A. Quelques observations sur le Calotermes flavicollis (Fab.) et le Termes lucifugus Rossi. Bol. Soc. Port. Ciênc. Nat. 1907, 1, 122–123. [Google Scholar]
  25. Nobre, T.; Nunes, L. Preliminary assessment of the termite distribution in Portugal. Silva Lusit. 2001, 9, 217–224. [Google Scholar]
  26. Nunes, L. Termite infestation risk in Portuguese historic buildings. In Proceedings of the Cost Action IE0601 “Wood Science for Conservation of Cultural Heritage” Conference, Braga, Portugal, 5–7 November 2008; Firenze University Press: Firenze, Italy, 2010; pp. 1000–1006. [Google Scholar]
  27. Van Rossum, G.; Drake, F.L., Jr. Python Tutorial; Centrum voor Wiskunde en Informatica Amsterdam: Amsterdam, The Netherlands, 1995; Volume 620. [Google Scholar]
  28. McKinney, W. Data structures for statistical computing in Python. In Proceedings of the 9th Python in Science Conference (SciPy2010), Austin, TX, USA, 28 June–3 July 2010; pp. 56–61. Available online: https://conference.scipy.org/proceedings/scipy2010/pdfs/mckinney.pdf (accessed on 16 December 2021).
  29. Harris, C.R.; Millman, K.J.; van der Walt, S.J.; Gommers, R.; Virtanen, P.; Cournapeau, D.; Wieser, E.; Taylor, J.; Berg, S.; Smith, N.J.; et al. Array programming with NumPy. Nature 2020, 585, 357–362. [Google Scholar] [CrossRef] [PubMed]
Figure 1. (a) Portuguese mainland counties where termite presence was reported until 1970. The counties represented in yellow are the ones where observations existed, whereas the ones in grey are the ones where no termites were reported until 1970. (b) Portuguese mainland divided into a 11 × 6 grid, where each resulting cell has a 50 × 50 km dimension.
Forests 13 00237 g001
Figure 2. Cell grid representing the Portuguese mainland where termite observation reports existed before 1970. Each cell was defined according to termite presence (green) or absence (white) or to its being outside the Portuguese mainland territory (black).
Forests 13 00237 g002
Figure 3. (a) Cell grid representing the Portuguese mainland where, according to the simulation, termites existed in 2001. Each cell was defined according to termite presence (green) or absence (white) or to its being outside the Portuguese mainland territory (black). (b) Portuguese mainland counties where termite existence is predicted to have existed, according to the simulations, in 2001. Termite presence is indicated in yellow, and their absence in grey.
Forests 13 00237 g003
Figure 4. Maps with the locations, represented by blue dots, where R. grassei presence was reported until 1970 (a) and 2020 (b).
Forests 13 00237 g004
Table 1. Class division for human population (HP), depending on the number of inhabitants in each region.
Number of HabitantsClass
<20001
[2000–4000]2
[4000–6000]3
[6000–8000]4
[8000–10,000]5
[10,000–20,000]6
[20,000–30,000]7
[30,000–40,000]8
[40,000–60,000]9
[60,000–100,000]10
[100,000–400,000]11
>400,00012
Table 2. Class division for leptosols (LS), depending on the percentage of leptosols in each region.
LeptosolsClass
0%1
<25%2
[25–50]%3
[50–75]%4
>75%5
Table 3. Class division for insolation (IS), depending on the hours of sunshine per year for each cell.
Hours of Sunshine (per Year)Class
[1100–8002]1
[2101–2400]2
[2401–2700]3
[2701–3000]4
[3001–3200]5
Table 4. Class division for days of rainfall in a year (DR), depending on the hours of sunshine per year for each cell.
Days of Rainfall (per Year)Class
01
[1–50]2
[51–75]3
[76–100]4
[101–110]5
Publisher’s Note: MDPI stays neutral with regard to jurisdictional claims in published maps and institutional affiliations.

