Abstract
Insights on tree species and competition effects on seasonal stem growth are critical to understanding the impacts of changing climates on tree productivity, particularly for eucalypts species that occur in narrow climatic niches and have unreliable tree rings. To improve our understanding of climate effects on forest productivity, we examined the relative importance of species, competition and climate to the seasonal stem growth of co-occurring temperate eucalypts. We measured monthly stem growth of three eucalypts (Eucalyptus obliqua, E. radiata, and E. rubida) over four years in a natural mixed-species forest in south-eastern Australia, examining the relative influences of species, competition index (CI) and climate variables on the seasonal basal area increment (BAI). Seasonal BAI varied with species and CI, and was greatest in spring and/or autumn, and lowest in summer. Our study highlights the interactive effects of species and competition on the seasonal stem growth of temperate eucalypts, clearly indicating that competitive effects are strongest when conditions are favourable to growth (spring and autumn), and least pronounced in summer, when reduced BAI was associated with less rainfall. Thus, our study indicates that management to reduce inter-tree competition would have minimal influence on stem growth during less favourable (i.e., drier) periods.
1. Introduction
Knowledge of relationships between tree growth and climate variation is essential to understand the impacts of climate change on forest ecosystems [1]. However, impacts of climate on tree productivity are difficult to quantify due to the strong influences of short-term and localized variations [2]. Climate change is expected to shift the length of seasons, alter rainfall patterns, and increase the frequency and intensity of extreme weather events within forests [3,4]. These climatic changes are expected to impact both tree productivity [5] and tree mortality [6], thus affecting the carbon storage capacity of forests. There are already signs in some temperate forests of decreased productivity associated with local temperature and rainfall change in recent decades [7]. Nonetheless, much remains unknown about climate impacts on forest productivity due to the myriad influences on tree growth, including species form and growth traits, within-stand growth environment, and multiple, ever-changing weather patterns [8].
Climate, growth traits, and local stand environments influence tree productivity. In drought conditions, trees are less productive [9,10,11,12]. Exposure to very cold temperatures or very hot temperatures can limit tree growth [13,14]. However, tree growth responses to temperature and rainfall can depend on their competitive context [11,15,16]. For example, North American pine trees with a history of strong competition were predisposed to growth decline, and sometimes death, with the addition of short-term climatic stress, such as an unusually hot summer [17,18]. Tree species [19], crown-class [12], size [20], and exposure to tree-to-tree competition [21] may all influence the growth response of trees when they are exposed to changes in climate [22]. Tree-to-tree competition influences the growth rate of trees by modifying access to resources, such as water, nutrients and sunlight [23,24]. Strong competition can decrease basal area growth [25], and set a maximum boundary to growth [10]. The interactive effects of competition, climate variability and growth attributes such as species, crown class and size, in driving temperate tree growth remain uncertain in many environments [11], including those in temperate Australia.
Eucalypts dominate native forests in Australia, with over 800 Eucalyptus species [1,26,27]. Temperate eucalypt forests occupy much of south-eastern Australia (extending over millions of hectares from Queensland to Tasmania) and are frequently dominated by mixes of eucalypt species [28,29,30]. Nonetheless, the viability of individual eucalypt species within temperate forests under a changing climate is uncertain, because their distributions are typically restricted to narrow climate niches of mean annual temperatures of less than three degrees Celsius [31]. Previous investigations of eucalypt tolerance to variations in temperature and rainfall have relied on species distribution data, to indicate limits to potential shifts in future distributions [27]. However, these studies do not account for species’ adaptation to changes in climate [26], noting that in situ studies of tree productivity over time provide a stronger means to examine sensitivities to climate variability [32]. Evidence from eucalypt seedlings and plantations demonstrates that their growth is responsive to seasons [33,34]. However, seedling- and plantation-based studies cannot adequately represent the growth environment of established eucalypts in structurally complex natural forests, particularly those characterised by multiple species, size cohorts and crown strata [35]. Temperate eucalypt forests have the potential to sequester large amounts of carbon under favourable climatic conditions [36,37]. The responsiveness of tree productivity to changes in climate is often studied by dendrochronology, and associated measurements of tree growth rings [38,39]. However, temperate eucalypts can grow for much of the year [35,40,41] and typically lack the clear growth rings that record previous growth responses to environmental change [42]. Alternatively, long-term tree-stem growth measurements can reveal climate impacts on tree productivity, because short-term stem growth is sensitive to various climate variables [32,40,43]. For example, temperature influences stem-diameter changes, both directly through effects on cambial activity [44], and indirectly through effects on photosynthesis [45].
Competition is likely to be an important factor in determining eucalypt growth [46]. Thinning has demonstrated positive effects on stem growth in sub-tropical eucalypts, particularly for less shade-tolerant species [47]. Competition effects on eucalypt growth have been found to be greatest when competing trees share genetic similarities [48]. This suggests that the composition of tree species in eucalypt forests could influence overall growth rates. There might also be variation in the ability of individual eucalypt species to tolerate and respond to competition [47], and across other environmental gradients. Evidence from a southern temperate eucalypt forest indicated that competition had a much greater explanatory effect than climate on diameter growth, and that competition effects were strongest at the most productive sites [46]. This suggests that in temperate eucalypt forests, competition could be most important when other factors do not limit growth, as quantified in other forest types [21].
In this study, we examined the interacting effects of tree species and inter-tree competition (including crown class) on the seasonal stem growth of three co-occurring temperate eucalypt species (Eucalyptus obliqua L’Her., Eucalyptus radiata Sieber ex DC.), Eucalyptus rubida H. Deane and Maiden. Hinko-Najera et al. (2019) demonstrated a strong influence of temperature on monthly stem growth in the same forest, although their study only included dominant trees of two eucalypt species that encompassed a narrow diameter and competition range [40]. We expand on their study by including an additional species (E. radiata), a wider range of tree diameters, and trees from both dominant and more suppressed crown classes, encompassing a wider range of competitive environments. Using four years of monthly basal area increments and distant-dependent measurements of competition, we examined the relative influences and interactions of multiple factors—tree species, inter-tree competition and climatic variables—on seasonal stem growth. Our aim was to improve the quantitative understanding of eucalypt growth in complex natural forests, and to identify potential vulnerabilities and management options relating to eucalypt growth under changing climates.
2. Materials and Methods
The study site was adjacent to an eddy covariance flux tower site in the Wombat State Forest, in central Victoria, south-eastern Australia, (37°25′20″ S, 144°05′40″ E). The site is at 705 m elevation, has a cool temperate climate with a long-term mean annual rainfall of 879 mm (1900–2010; http://www.bom.gov.au (accessed on 15 November 2021), Daylesford, ~11 km from the study site), and mean annual temperature of 11 °C. The winter period is cold and wet, whereas the summer period is usually drier and warm to hot. Temperature, soil moisture and rainfall data were continuously collected on site [40]. Air temperature (HMP-45C probe, Vaisala, FIN) was measured at 2 m and 30 m height, soil moisture (CS616, Campbell Scientific, AUS) was measured at 10 cm depth and rainfall was monitored with a tipping bucket rain gauge (CS702, Hydrological Services Pty Ltd., Sydney, Australia) at 1 m height in 30 min intervals.
The Wombat State Forest is a dry sclerophyll open forest [49], dominated by mixes of fire-tolerant eucalypt species. The eucalypt species studied were E. obliqua (commonly known as ‘messmate stringybark’), E. radiata, (‘narrow-leaved peppermint’) and E. rubida (‘candlebark gum’). The understory is sparsely covered with predominantly perennial grasses—mostly types of Poa spp., and Pteridium esculentum. The site is part of the traditional lands of the Dja Dja Wurrung and Wurrundjeri Woi Wurrung peoples of the Kulin nations [50,51]. Post-colonisation, the site was likely extensively harvested—if not cleared—in the mid-1800s as a result of the gold rush [52]. The site was selectively harvested and burned by low-intensity prescribed fire in the 1900s, but has remained relatively undisturbed since the 1970s [35].
The monthly stem growth of individual eucalypt trees was measured within three long-term plots (plot radius = 40 m), established in 2012 [35]. The basal area within each plot ranged from 40 to 44 m2 ha−1 [32]. Subject trees included eight to nine of the largest trees per species per plot, of each of the three most abundant tree species, on the basis that the largest trees would contribute most to overall productivity [53]. This equated to 24–25 trees per plot, 72 trees in total across three plots. Averaged by crown class and species, the diameters (underbark at breast height, 1.3 m) of the study trees ranged from 20 to 58 cm, and the heights ranged from 22 to 29 m (Table 1).

Table 1.
Characteristics of the study’s individual trees including the numbers by crown class and species, and the mean DBHUB (diameter underbark), height, competition index (CI), and mean annual basal area increment (BAI). Standard errors of the mean are in parentheses.
From 2013 to 2017, monthly stem-diameter growth at breast height was assessed using steel dendrometer bands (accuracy ~0.1 mm in circumference; DB20, ICT International Pty Ltd., Armidale, Australia). To account for the variable thickness of dead bark in shrinkage and swelling, dead and loose bark was removed prior to the fitting of dendrometer bands. The bands on E. rubida trees were refitted at least once per year after seasonal bark shedding.
To standardise the effects of tree size on growth, monthly changes in circumference, which were predominantly increases, were converted into monthly basal area increments (BAIs). This calculation involved a starting diameter size, to reflect the proportion of growth relative to tree size [54,55,56]. The BAI was calculated with the formula below:
where DBHt is the measured diameter in centimetres from the current month, and DBHt−1 is the measured diameter in centimetres from the previous month. Basal area increments (in centimetres) were calculated per month, according to the measurement interval, and then aggregated to seasonal (3-monthly) sums. This study examined the dendrometer-band data from summer 2013–2014 to spring 2017, to incorporate four years of each season (2014–2017), with the monthly BAIt summed up to the three-monthly seasonal BAIseason per year for each subject tree.
The crown class of each subject tree was determined with a field assessment [35], using crown classes as defined by Smith (1986) [57], which indicate the level of access to direct sunlight. The crown class of each tree was identified as ‘dominant and co-dominant’ (canopy fully lit, only minor lateral shading), ‘intermediate’ (overgrown but still partly lit from above) or ‘suppressed’ (fully shaded). Of the selected study trees, the E. obliqua included all canopy classes, whereas E. rubida and E. radiata were absent from the dominant class. The E. radiata trees were predominantly in the suppressed category (13 of 23 trees).
This study assessed individual competition for each of the 72 subject trees based on the distance-dependent competition index (CI) from Hegyi (1974) [58]:
where DBHNT refers to the underbark diameter at breast height (DBH, at 1.3 m) of a neighbouring tree in centimetres, DBHST refers to the underbark DBH of the subject tree in centimetres, and distST-NT refers to the distance between the neighbouring tree and the subject tree in meters [58]. We used the iterative distance-dependent Hegyi competition index because distance-dependent models are most reliable in predicting variations in stem growth [59]. This is in contrast to a distance-independent index, which is typically a simpler measure such as the number of trees in an area, or a measure of crown competition [60].
Trees with a DBH ≥ 20 cm and within an 11 m radius of the subject tree were assessed as neighbouring trees. The assessment radius of 11 m was roughly equivalent to 0.4 times the mean tree height and was consistent with radii used in individual tree competition analyses elsewhere [24]. Neighbour tree assessments involved measuring DBH with a diameter tape and bark thickness at DBH with a ‘Gill-type’ needle gauge [61] on both the north and south sides. Double the mean bark thickness (×2) was subtracted from the overbark DBH to provide an estimate of underbark DBH. Distance and angle between the subject tree and each neighbouring tree were measured using a Trupulse 360B (Laser Technology Inc, Centenial, CO, USA). Neighbouring trees were assessed as active or passive competitors based on distance and spatial allocation [62]. If trees overlapped within any 30° competition sector, the trees furthest away were considered passive competitors, and only the tree that was the closest within that 30° sector was recorded as an active competitor. In our analysis, we used the CI which included active competitors only, because initial analyses confirmed that this CI had the strongest effect on stem growth compared with the CI including all living neighbour trees.
Statistical analyses were performed in R Studio version 1.4.1717 [63]/R-version 4.1.1 [64]. Correlations between CI and crown class were used to examine their collinearity. Linear mixed effect models (LMEMs; using the “nlme” package [65]) were used to assess the effects of species, competition, temperature and rainfall, and their interactions on seasonal stem growth (BAIseason). Temperature and rainfall variable selection for the model was based on their overall importance on monthly stem growth from a previous study, which found that the mean maximum temperature and total rainfall best explained the overall variance in BAIseason [37]. Soil moisture was considered as a predictor variable, but was excluded due to correlations with the mean maximum temperature (Pearson’s correlation r = −0.77). Temperature and rainfall were prioritized as variables because these were expected to have the most influence on longer-term growth patterns. Longer-term stem diameter changes, over periods of months and years, are not readily influenced by ambient weather and water-related processes [66]. Water-related swelling and shrinking of stems generally occur at sub-daily timesteps [67,68]; therefore, they are less important than growth-related processes for diameter growth (or BAI) at monthly or seasonal time scales [69]
Seasonal time lags (up to three seasons) of the temperature and rainfall variables were also considered, based on the initial best-fitted linear or quadratic relationships with BAI and the exclusion of highly correlated climate variables (Pearson’s correlation r > 0.7) to avoid auto-correlation in models. Fixed factors in the model included species, competition, and temperature and rainfall variables. Trees nested in plots were included as random effects. The initial, complete model structure was:
where BAI is the seasonal (3-monthly) basal area increment in cm2, I is the intercept, SP is the species, CI the numeric competition index, T.max.mean is the continuous numeric seasonal (3-monthly) mean monthly maximum temperature, T.max.mean2 is the quadratic term of T.max.mean based on the initial temperature response curve fit of BAI across all seasons, and Rain_sum is the continuous numeric seasonal (3-monthly) sum of rainfall, or their (T.max.mean, T.max.mean2, Rain_sum) seasonal lags, plus the various interaction terms (I-) between fixed effects, and (1| plot/trees) as the random term.
BAI = I + SP * CI + T.max.mean + T.max.mean2 + Rain_sum + I−SP: T.max.mean + I−SP: T.max.mean2 + I−SP: Rain_sum + (1|plot/trees)
The influence of species, competition and climate variables on seasonal BAI was assessed for each season using a modified version of the above model that excluded the T.max.mean2 based on the initial regression analysis for each season. A first-order autoregressive correlation structure was included in the model to account for the temporal autocorrelation of repeated measures of the same tree, and a variance structure was included when necessary (i.e., the model performance improved) to account for heterogeneity of the residuals [70].
To identify the best LMEM, non-significant fixed-effect values (p-value > 0.05) were dropped stepwise until all included fixed-effect values were significant. The LMEMs were fitted several times to find the best significant fit, which most accurately explained the variation in the data including the fewest explanatory variables [71], based on the lowest Akaike information criterion (AIC) [72]. The AIC value was used to evaluate fit because it indicates the likelihood of the model in relation to the number of variables used [71]. Plots of the residuals were examined to confirm homoscedasticity [73], and goodness-of-fit measures were calculated with the “MuMIn” package [74], producing marginal (R2 m) and conditional (R2 c) coefficients of determination [75]. R2 c indicates the variance explained by the whole model, and R2 m represents the variance explained by the fixed effects and their interactions. Partial R2 m values of fixed effects were calculated using the “r2glmm” package [76].
3. Results
3.1. Seasonal Variation in Temperature, Rainfall and Soil Moisture
Patterns in seasonal temperature were consistent throughout this study (Figure 1). Typically, summer reached a monthly mean maximum temperature of 24.6 °C in January, decreasing to a monthly mean minimum of 2.1 °C by mid-winter (July). Soil moisture was also distinctly seasonal, with moisture content at 10 cm depth typically highest in winter and lowest in the summer months. Rainfall patterns were more variable across the years, with the highest rainfall generally in winter and autumn (Figure 1). Rainfall was particularly high during the winter and spring of 2016 (>400 mm per season), and in early autumn in 2017 (Figure 1).
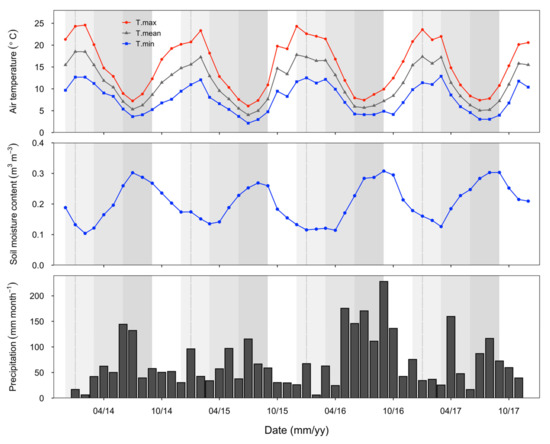
Figure 1.
Temperature, soil moisture at 10 cm depth, and rainfall data from the eddy covariance flux site (adjacent to the study site) for the period of this study. Temperature and soil moisture values are the monthly means, and precipitation values are monthly sums. Seasons are indicated with different background shading: summer (December–February, lightest grey shade), autumn (March–May, grey shade) and winter (June–August, darkest grey shade), spring (September–November, no background).
3.2. Stem Growth in Relation to Species, Crown Class and Competition
Basal area increment (BAI, cm2) varied across species and crown classes (Table 1). The mean annual BAI ranged from 9.5 cm2 to 52.2 cm2 in E. obliqua, 12.3 cm2 to 35.1 cm2 in E. rubida, and 1.5 cm2 to 16.0 cm2 in E. radiata. Trees with lower competition indices had the greatest mean annual BAI, and trees with higher competition indices had the lowest BAIs (i.e., the suppressed E. radiata had both the greatest mean CI and the lowest mean annual BAI, whereas the dominant E. obliqua had both the lowest mean CI and the highest mean annual BAI; Table 1).
Mean annual BAI values of E. radiata were consistently lower than E. obliqua and E. rubida in all crown classes (Table 1). For example, the BAI of co-dominant E. radiata trees was less than half the BAI of co-dominant E. obliqua and E. rubida (Table 1). The competition index had a clear influence on the total BAI over the four years of both E. obliqua and E. rubida (Figure 2), whereas the relationship between competition index and total BAI was not significant for E. radiata, which were mostly in the suppressed class (Figure 2 and Table 1).
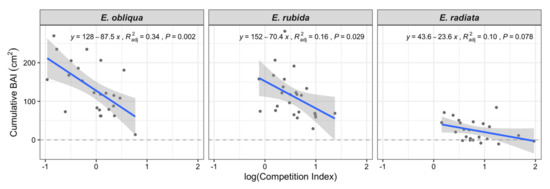
Figure 2.
Variation in total cumulative basal area increment (BAI, cm2) over the four-year study period with the Hegyi tree competition index (based on active competitors within 11 m of the subject tree) for each species (shown in facets). Adjusted R2 and p values relate to the regression lines.
CI increased by species in the order E. obliqua < E. rubida < E. radiata (Table 1 and Figure 2). Overall, tree CI increased from dominant to suppressed crown classes (Figure 3); for example, the mean CI of E. obliqua (the only species in all crown classes) ranged from 0.59 (dominant) to 1.63 (suppressed; Table 1).
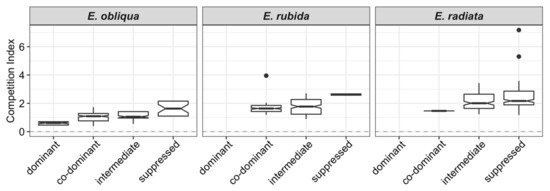
Figure 3.
Notched boxplots of competition indices (based on active competitors within 11 m of the subject tree) by crown classes within each species (dominant to suppressed). Overlapping notches of box plots indicate no significant difference between box plots.
3.3. Stem Growth by Season
BAI was greatest in autumn and spring, but was highly variable, reflecting the range of growth conditions of individual trees across species, competition, and crown class (Figure 4 and Figure 5). BAI was positive for all trees throughout autumn and winter, occasionally negative for some trees in spring, and often negative in summer (Figure 4). The seasonal BAI increased for E. obliqua and E. rubida trees in spring, whereas it mostly stagnated for E. radiata trees (Figure 4 and Figure 5). Seasonal growth also varied between years. The BAI in summer was often more positive in 2015 and 2017 compared with 2014 and 2016 (Figure 4). The BAI was greatest in 2017, particularly in autumn, when the largest mean seasonal growth (10.5 cm2) was 40% higher than the autumn growth in previous years (mean BAI 6.7 cm2). In contrast, the mean BAI was 0 in summer 2014, and approximately 3.0 cm2 lower than the following years (Figure 4).
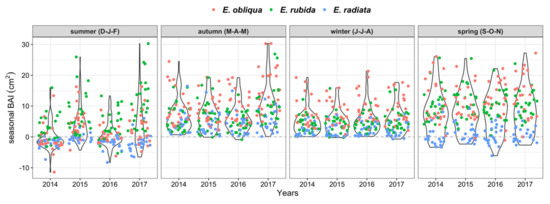
Figure 4.
Total basal area increments (BAIs, cm2) per 3-monthly season by species and study year. Points are individual values per tree, with the overlaying violin plots illustrating the data distribution (wider bulbs indicate higher data density).
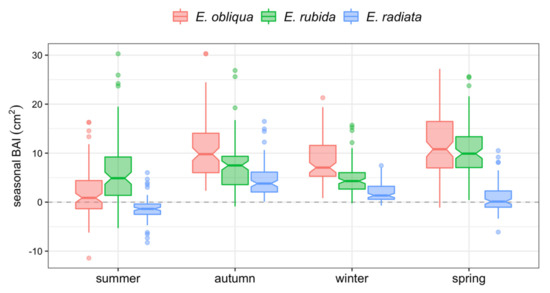
Figure 5.
Notched box plots of total BAI per 3-monthly season by species. The central lines of individual box plots represent the median seasonal BAIs (cm2). Overlapping notches indicate no significant differences between box plots.
E. obliqua and E. radiata trees had four distinct periods of growth. BAIs of E. obliqua trees decreased in the order spring > autumn > winter > summer (Figure 5), whereas BAIs for E. radiata trees decreased in the order autumn >winter > spring > summer. In contrast, the summer BAI of E. rubida was often greater than the summer BAI of E. obliqua and E. radiata, and comparable to the winter BAI, with the greatest BAI of E. rubida trees observed in spring and autumn (Figure 5).
3.4. Interactive Effects of Season, Competition and Species on Stem Growth
Seasonal BAIs across all species significantly decreased with log CI in all seasons (Figure 6). Regressions of seasonal BAI with log CI explained 33% to 45% of seasonal BAI in autumn, winter or spring, with the greatest negative slopes in autumn and spring (Figure 6). In comparison, summer BAI was not related to CI, except in the case of E. rubida (Figure 6). In addition, the strength of autumn, winter and spring BAI relationships with CI varied among species, with the greatest slopes and variance explained for E. obliqua (encompassing the lower end of the CI range), and comparatively weaker relationships for both E. rubida (mid-range CI) and E. radiata (upper CI range; Figure 6).
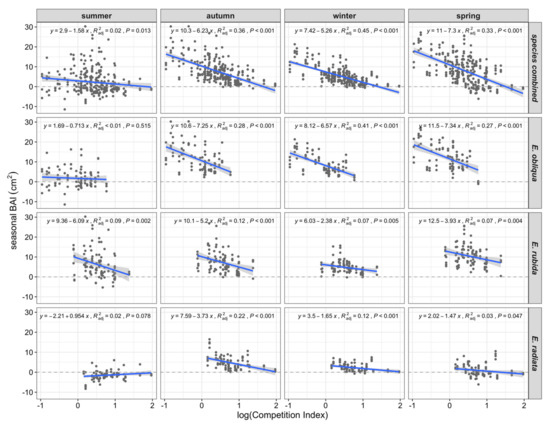
Figure 6.
Scatterplots and linear regressions (blue lines plus 95% confidence interval in grey) of seasonal (3-monthly) basal area increment (BAI, cm2) and log-transformed CI, by season, species and all species combined.
The best-fitting LMEM for seasonal BAI explained 73% of the variation in the full dataset (Table 2). The most important explanatory variables in decreasing order were: T.max.mean2, CI, and T.max.mean, followed by species interactions with CI and temperature or rainfall variables (Table 2). Consistent with the clear but variable relationships in Figure 6, CI, species, or their interaction were the top two explanatory variables in the autumn, winter and spring LMEMs, which explained 56% to 87% of variation in seasonal BAI (Table 3). Rainfall and species were most important in the summer LMEM, which indicated no clear influence of CI alone, although a significant species by CI interaction (Table 3) was consistent with higher growth rates and a significant BAI–CI relationship for E. rubida but not for other species in summer (Figure 6). In addition to negative effects of CI and species differences, seasonal time lags of rainfall positively influenced stem growth in autumn and winter. The autumn LMEM showed a significant and positive effect of rainfall with a lag of two seasons (i.e., rainfall from previous spring) on BAI (Table 3), whereas autumn rainfall had a significant effect on winter BAI (Table 3).
Table 2.
Best-fitting model of seasonal BAI for all trees combined. Values are the p-values of only significant fixed effects and their interactions, which are in order of most to least important. R2 c indicates the variance explained by the full model, whereas R2 m indicates the variance explained by only the fixed effects. ‘Dir’ indicates the direction of the relation of single fixed effects with the response variable. Fixed effect abbreviations: ‘T.max.mean’, mean monthly maximum temperature per season (and its quadratic term ‘T.max.mean2′); ‘CI’ competition index; ‘Rain_sum’, sum of rainfall per season.
Table 3.
Best-fitting models of BAI per season with only significant (p-values) fixed effects and their interactions, which are in order of most to least important. R2 c indicates the variance explained by the complete model, whereas R2 m indicates the variance explained by only the fixed effects. ‘Dir’ indicates the direction of the relation of single fixed effects with the response variable. Fixed effect abbreviations: ‘T.max.mean’, mean monthly maximum temperature per season (and its quadratic term ‘T.max.mean2’); ‘CI’, competition index; ‘Rain_sum’, sum of rainfall per season; ‘Rain_sum_lagXs’, sum of rainfall from the previous X (= 1 or 2) seasons.
4. Discussion
4.1. Seasonal Stem Growth of Temperate Eucalypts Is Species-Dependent
Our study demonstrates that temperate eucalypt stems in natural mixed-species evergreen forests grow in all seasons, although this growth varies with species, competition, season and year. We quantified clear peak stem growth periods in autumn and spring, which is consistent with previous studies in the same forest [40,41] and with studies of eucalypt seedlings and plantations [33,34,77].
Seasonal stem growth patterns differed significantly by species, even within the same crown class. Overall, the magnitude of stem growth rates was comparable between E. obliqua and E. rubida, whereas stem growth for E. radiata was consistently less than the other species. Despite differences in magnitude, the stem growth of all three species was distinctly seasonal. Although E. obliqua trees had their highest growth rates in spring and autumn, stem growth was near zero during summer. Decreases in stem growth—or even contractions—in summer could be reflective of the drier and hotter weather conditions during this time, but could also be mechanistically linked to the preferential allocation of assimilated carbon towards crown expansion [35].
Peak growth rates for E. rubida were similar to those of E. obliqua, but it was the only species able to maintain notable stem growth during summer at rates comparable to winter, and the only species to grow in all seasons, marking three distinct periods of growth. This is in contrast to a previous study by Griebel et al. (2017) [35], who found that E. obliqua and E. rubida had similar growth patterns, with no marked difference in growth during summer. This may be due to differences in the years examined. Griebel et al. (2017) [35] included the summer of 2012–2013, which had exceptionally hot and dry weather, when growth was consistently low across all species. Continued growth during summer might indicate that E. rubida is less sensitive to limitations in soil water availability or higher atmospheric demand for water [78], which might also relate to the higher maximum temperature optima of E. rubida (17 °C) than E. obliqua (15 °C) [40]. Griebel et al. (2020) [78] showed that although both species maintained high transpiration rates during a 5-day heatwave, E. rubida exceeded those of E. obliqua. E. radiata, the species with the least overall growth, had peak stem growth in autumn, which continued, although at a lower rate, into winter. Thus, autumn was a key period for stem growth for all examined species and crown classes.
4.2. Seasonal Stem Growth of Temperate Eucalypts Is Strongly Influenced by Competition
In addition to species, stem growth was strongly influenced by competition. Our study clearly showed that stem growth rates decreased with increasing inter-tree competition. The negative competition effect on stem growth was most evident when growth rates were greatest and climate conditions were favourable for growth. This is in accordance with studies from other forest types, where tree stem growth was more responsive to competition when other factors, such as climate, were not limiting [21,79].
The increasing trend of inter-tree competition indices from the dominant to the suppressed crown classes seems to indicate that overall higher stem growth rates with a decrease in competition were somewhat influenced by greater light availability in the more dominant crown positions. Thus, the effect of competition on stem growth rates was most obvious for E. obliqua, which was the only species present in all crown classes. Competition had little effect on the stem growth of trees with a CI > 2.5, where trees, predominantly E. radiata, showed very little growth in general, across all seasons. This indicates that E. radiata trees were continuously outcompeted by the other two species, and thus showed a less pronounced seasonality in stem growth rates compared with trees in less competitive environments. Similar stem growth responses were reported for Abies balsamea trees, where inter-stem competition had only a minor effect on the growth of trees with limited crown access to light, but had a greater effect on the growth of those trees with crowns that had good access to light [80].
Trees in uncompetitive environments can have stronger seasonality in stem growth due to their greater sensitivity to climate conditions [81,82]. This does not mean that trees in more competitive environments are not affected by climatic conditions, just that their growth is chronically constrained by other limiting factors. Previous studies have proposed trees under more competitive environments are more likely to decline in the instance of short-term climatic stress [17,83,84]. Competition reduction—or thinning—has been proposed to adapt forest plantations to climate change [85,86]; however, our findings suggest that competition is less relevant to tree growth during periods limited by climatic factors. This is consistent with a recent study in a European beech forest, which found that thinning did not increase trees’ resilience to drought [87].
4.3. Species, Climate and Competition Interact to Drive the Stem Growth of Temperate Eucalypts
Species and competition interacted to influence stem growth during favourable seasons. This is consistent with research from other forest types, where the effects of competition and seasonal climate varied with species and crown class, and were generally heterogeneous across sites and forest-types [81,82,88]. Favourable growing conditions are species-dependent, and the effect of competition is most evident when growing conditions are favourable; therefore, competition effects may be most limiting to growth within species [48]. Species niche separations—in their diversity of timing of resource-use, and thus, seasonal growth patterns—underpin the co-existence of multiple species, which has been demonstrated in co-existing species in other forest types [89,90].
Temperature was most strongly associated with stem growth in the overall models, reflecting an overall bell-shaped relationship in this forest type [40]. We acknowledge that relationships of stem growth with temperature are not necessarily causative, particularly because temperature effects were likely confounded with soil moisture content (i.e., indicated by a strong negative correlation). Nonetheless, bell-shaped relationships between monthly stem growth and temperature were consistent with similar shaped relationships between gross primary productivity and mean air temperature that controlled for other climate variables across a broad range of Australian wooded ecosystems [91]. The importance of temperature was not evident in seasonal LMEMs, when competition and rainfall were of greater importance. Rainfall was the most important climate variable influencing stem growth during summer. This was evident in differences of inter-annual summer growth periods. Stem growth rates during the summers of 2015 and 2017 were distinctively higher than the summers of 2014 and 2016, consistent with double the summer rainfall in 2015 and 2017.
Seasonal time lags of rainfall also influenced stem growth rates during autumn and winter. Rainfall from the previous spring had a positive effect on autumn stem growth, whereas autumn rainfall positively influenced winter stem growth. Considering the effect of rainfall lags, the very high rainfall in spring 2016 (September, October and November), may explain the high growth rate in 2017, particularly in summer and autumn. Hinko-Najera et al. (2019) [40] demonstrated that autumn rainfall positively influenced monthly peak stem growth in autumn and the following spring for (co-)dominant trees in the same forest. They also found that a lack of rainfall in the preceding 6 months had a negative effect on summer growth rates [40]. Time-lag responses of tree stem growth to rainfall have previously been reported for temperate and Mediterranean trees [92,93], and highlight the importance of soil water recharge during wetter periods, which can lead to prolonged water availability to trees in subsequent periods [40].
4.4. Study Limitations
The unequal distribution of dominant and co-dominant trees across the different species is a limitation of our study, and is a product of the natural variability in mixed species forests and historical forest management practices. Previous studies in the same forest have found it difficult to locate stems within plots where crown classes are evenly distributed across set diameter classes [94]. The predominance of E. obliqua in the canopy has been recorded in this area since 1988 [95]. Ideally, there would have been more E. radiata stems in the dominant and co-dominant classes. There is a possibility that this could be a factor of age [96], because there may have been more E. radiata trees selectively harvested during operations dating back to the 1940s [94].
5. Conclusions
Species, competition and seasonal climate have strong effects on stem growth, and thus, the productivity, of temperate evergreen eucalypts. Our study highlights species-specific responses to seasonal climate that are likely key to the successful co-existence of temperate eucalypts in a natural mixed-species forest. Competition had a strong effect on productivity, with trees under high competition having very little to no growth across the seasons. Favourable growing conditions in spring and autumn were important periods of stem growth, particularly for those trees in less competitive environments. This demonstrated that competition interacted with seasonal climate to drive stem growth and was most important when climactic conditions were favourable. As such, our study indicates that management to reduce inter-tree competition would have the most influence on stem growth during periods of favourable growth, and minimal influence when climatic conditions were less favourable, such as during dry periods. Furthermore, because favourable growing conditions are species-dependent, our study indicates that supporting mixed-species forests is advantageous to tree productivity and forest health. This study demonstrates that seasonal stem growth strongly interacts with competition and species in temperate eucalypts, and that long-term growth studies are invaluable to provide detailed insights into how variations in climate may drive inter-annual changes in stem growth, and thus, productivity, in native mixed-species eucalypt forests.
Author Contributions
Conceptualization and study design: L.T.B., N.H.-N. and E.P.-P.; data collection: A.G., J.C.N.-U., E.P.-P. and N.H.-N.; data curation and analysis: E.P.-P. and N.H.-N.; writing—original draft preparation: E.P.-P., N.H.-N. and L.T.B.; writing—review and editing: E.P.-P., N.H.-N., L.T.B., A.G. and J.C.N.-U. All authors have read and agreed to the published version of the manuscript.
Funding
This research was part of the Integrated Forest Ecosystem Research program funded by the Victorian State Government Department of Environment, Land, Water and Planning. This work was supported by the Australian Terrestrial Ecosystem Research Network (TERN), as part of the Australian National Cooperative Research Infrastructure System (NCRIS), that provide funding to the OzFlux network.
Institutional Review Board Statement
Not applicable.
Informed Consent Statement
Not applicable.
Data Availability Statement
Data will be made available on Figshare upon paper acceptance.
Acknowledgments
The authors acknowledge that this research was conducted on the unceded lands of the Dja Dja Wurrung and Wurundjeri Woi Wurrung peoples of the Kulin Nations. We thank Tom Martin, Oli Moraes and Carmen Haines for their generous assistance in data collection.
Conflicts of Interest
The authors declare no conflict of interest. The funders had no role in the design of the study; in the collection, analyses, or interpretation of data; in the writing of the manuscript, or in the decision to publish the results.
References
- Butt, N.; Pollock, L.; McAlpine, C.A. Eucalypts Face Increasing Climate Stress. Ecol. Evol. 2013, 3, 5011–5022. [Google Scholar] [CrossRef]
- Babst, F.; Poulter, B.; Trouet, V.; Neuwirth, B.; Wilson, R.; Carer, M.; Grabnel, M.; Tegel, W.; Evanic, T.; Panayotov, M.; et al. Site- and Species-specific Responses of Forest Growth to Climate across the European Continent. Glob. Ecol. Biogeogr. 2013, 22, 706–717. [Google Scholar] [CrossRef]
- Bussotti, F.; Pollastrini, M. Traditional and Novel Indicators of Climate Change Impacts on European Forest Trees. Forests 2017, 8, 137. [Google Scholar] [CrossRef]
- Pachauri, R.K.; Meyer, L.A. Climate Change 2014: Synthesis Report. Contribution of Working Groups I, II and III to the Fifth Assessment Report of the Intergovernmental Panel on Climate Change; IPCC: Geneva, Switzerland, 2014; pp. 1–151. [Google Scholar]
- Wamelink, G.; Wieggers, H.; Reinds, G.; Kros, J.; Mol-Dijkstra, J.; Van Oijen, M.; De Vries, W. Modelling Impacts of Changes in Carbon Dioxide Concentration, Climate and Nitrogen Deposition on Carbon Sequestration by European Forests and Forest Soils. For. Ecol. Manag. 2009, 258, 1794–1805. [Google Scholar] [CrossRef]
- Allen, C.; Macalady, A.K.; Chenchouni, H.; Bachelet, D.; McDowell, N.; Vennetier, M.; Kitzberger, T.; Rigling, A.; Breshears, D.; Hogg, E.H.; et al. A Global Overview of Drought and Heat-Induced Tree Mortality Reveals Emerging Climate Change Risks for Forests. For. Ecol. Manag. 2010, 259, 660–684. [Google Scholar] [CrossRef]
- Zhao, M.; Running, S. Drought-Induced Reduction in Global Terrestrial Net Primary Production from 2000 through 2009. Science 2010, 329, 940–943. [Google Scholar] [CrossRef] [PubMed]
- Hlasny, T.; Trombik, J.; Bosela, M.; Merganic, J.; Marusak, R.; Seben, V.; Stepanek, P.; Kubista, J.; Trnka, M. Climatic Drivers of Forest Productivity in Central Europe. Agric. For. Meteorol. 2017, 234, 258–273. [Google Scholar] [CrossRef]
- Bottero, A.; D’Amato, A.W.; Palik, B.J.; Bradford, J.B.; Fraver, S.; Battaglia, M.A.; Asherin, L.A. Density-Dependent Vulnerability of Forest Ecosystems to Drought. J. Appl. Ecol. 2017, 54, 1605–1614. [Google Scholar] [CrossRef]
- Dorman, M.; Perevolotsky, A.; Sarris, D.; Svoray, T. The Effect of Rainfall and Competition Intensity on Forest Response to Drought: Lessons Learned from a Dry Extreme. Oecologia 2015, 177, 1025–1038. [Google Scholar] [CrossRef]
- Gleason, K.E.; Bradford, J.B.; Bottero, A.; D’Amato, A.W.; Fraver, S.; Palik, B.J.; Battaglia, M.A.; Iverson, L.; Kenefic, L.; Kern, C.C. Competition Amplifies Drought Stress in Forests across Broad Climatic and Compositional Gradients. Ecosphere 2017, 8, e01849. [Google Scholar] [CrossRef]
- Martín-Benito, D.; Cherubini, P.; del Río, M.; Cañellas, I. Growth Response to Climate and Drought in Pinus Nigra Trees of Different Crown Classes. Trees 2008, 22, 363–373. [Google Scholar] [CrossRef]
- Kozlowski, T.T.; Pallardy, S.G. Acclimation and Adaptive Responses of Woody Plants to Environmental Stresses. Bot. Rev. 2002, 68, 270–334. [Google Scholar] [CrossRef]
- Niinemets, U. Responses of Forest Trees to Single and Multiple Environmental Stresses from Seedlings to Mature Plants: Past Stress History, Stress Interactions, Tolerance and Acclimation. For. Ecol. Manag. 2010, 260, 1623–1639. [Google Scholar] [CrossRef]
- Clark, J.S.; Bell, D.M.; Kwit, M.C.; Zhu, K. Competition-Interaction Landscapes for the Joint Response of Forests to Climate Change. Glob. Chang. Biol. 2014, 20, 1979–1991. [Google Scholar] [CrossRef]
- Ettinger, A.K.; HilleRisLambers, J. Climate Isn’t Everything: Competitive Interactions and Variation by Life Stage Will Also Affect Range Shifts in a Warming World. Am. J. Bot. 2013, 100, 1344–1355. [Google Scholar] [CrossRef]
- Linares, J.C.; Camarero, J.J.; Carreira, J.A. Competition Modulates the Adaptation Capacity of Forests to Climatic Stress: Insights from Recent Growth Decline and Death in Relict Stands of the Mediterranean Fir Abies Pinsapo. J. Ecol. 2010, 98, 592–603. [Google Scholar] [CrossRef]
- Slack, A.W.; Kane, J.M.; Knapp, E.E.; Sherriff, R.L. Contrasting Impacts of Climate and Competition on Large Sugar Pine Growth and Defense in a Fire-Excluded Forest of the Central Sierra Nevada. Forests 2017, 8, 244. [Google Scholar] [CrossRef]
- Drobyshev, I.; Gewehr, S.; Berninger, F.; Bergeron, Y.; McGlone, M. Species Specific Growth Responses of Black Spruce and Trembling Aspen May Enhance Resilience of Boreal Forest to Climate Change. J. Ecol. 2012, 101, 231–242. [Google Scholar] [CrossRef]
- Merian, P.; Lebourgeois, F. Size-Mediated Climate–Growth Relationships in Temperate Forests: A Multi-Species Analysis. For. Ecol. Manag. 2011, 261, 1382–1391. [Google Scholar] [CrossRef]
- Sanchez-Salguero, R.; Carlos-Linares, J.; Camarero, J.; Madrigal-Gonzalez, J.; Hevia, A.; Sanchez-Miranda, A.; Ballesteros-Canovas, J.; Alfaro-Sanchez, R.; Garcia-Cervigon, A.; Bigler, C.; et al. Disentangling the Effects of Competition and Climate on Individual Tree Growth: A Retrospective and Dynamic Approach in Scots Pine. For. Ecol. Manag. 2015, 358, 12–25. [Google Scholar] [CrossRef]
- Teets, A.; Fraver, S.; Weiskittel, A.R.; Hollinger, D.Y. Quantifying Climate-Growth Relationships at the Stand Level in a Mature Mixed-Species Conifer Forest. Glob. Chang. Biol. 2018, 24, 3587–3602. [Google Scholar] [CrossRef] [PubMed]
- Zhang, J.; Huang, S.; He, F. Half-Century Evidence from Western Canada Shows Forest Dynamics Are Primarily Driven by Competition Followed by Climate. Proc. Natl. Acad. Sci. USA 2015, 112, 4009–4014. [Google Scholar] [CrossRef] [PubMed]
- Maleki, K.; Kiviste, A.; Korjus, H. Analysis of Individual Tree Competition Effect on Diameter Growth of Silver Birch in Estonia. For. Syst. 2015, 24, 8. [Google Scholar]
- Rivas, J.J.C.; Gonzalez, J.G.A.; Aguirre, O.; Hernandez, F. The Effect of Competition on Individual Tree Basal Area Growth in Mature Stands of Pinus Cooperi Blanco in Durango (Mexico). Eur. J. For. Res. 2005, 124, 133–142. [Google Scholar] [CrossRef]
- Booth, T.; Pinkard, E.; Broadhurst, L.; Prober, S.; Dillon, S.; Bush, D.; Pinyopusarerk, K.; Doran, J.; Ivkovich, M.; Young, A. Native Forests and Climate Change: Lessons from Eucalypts. For. Ecol. Manag. 2015, 347, 18–29. [Google Scholar] [CrossRef]
- González-Orozco, C.E.; Pollock, L.J.; Thornhill, A.H.; Mishler, B.D.; Knerr, N.; Laffan, S.W.; Miller, J.T.; Rosauer, D.F.; Faith, D.P.; Nipperess, D.A.; et al. Phylogenetic Approaches Reveal Biodiversity Threats under Climate Change. Nat. Clim. Chang. 2016, 6, 1110. [Google Scholar] [CrossRef]
- Costermans, L. Native Trees and Shrubs of South-Eastern Australia: Covering Areas of New South Wales, Victoria and South Australia.; Reed New Holland Publishers: Sydney, NSW, Australia, 2009. [Google Scholar]
- ABARES. Australia’s State of the Forests Report 2018; ABARES, Australian Government Department of Agriculture and Water Resources: Canberra, Australia, 2018; pp. 1–600.
- Australian Government Department of Sustainability, Environment, Water, Population and Communities. Interim Biogeographic Regionalisation for Australia (IBRA); Australian Government Department of Sustainability, Environment, Water, Population and Communities: Canberra, Australia, 2012; p. 1.
- Hughes, L.; Cawsey, E.; Westoby, M. Climatic Range Sizes of Eucalyptus Species in Relation to Future Climate Change. Glob. Ecol. Biogeogr. Lett. 1996, 1, 23–29. [Google Scholar] [CrossRef]
- Forner, A.; Aranda, I.; Granier, A.; Valladares, F. Differential Impact of the Most Ex- Treme Drought Event over the Last Half Century on Growth and Sap Flow in Two Coexisting Mediterranean Trees. Plant. Ecol. 2014, 215, 703–719. [Google Scholar] [CrossRef]
- Ashton, D.H. The Seasonal Growth of Eucalyptus Regnans F. Muell. Aust. J. Bot. 1975, 23, 239–252. [Google Scholar] [CrossRef]
- Cremer, K.W. Temperature and Other Climatic Influences on Shoot Development and Growth of Eucalyptus Regnans. Aust. J. Bot. 1975, 23, 27–44. [Google Scholar] [CrossRef]
- Griebel, A.; Bennett, L.; Arndt, S. Evergreen and Ever Growing—Stem and Canopy Growth Dynamics of a Temperate Eucalypt Forest. For. Ecol. Manag. 2017, 389, 417–426. [Google Scholar] [CrossRef]
- Keith, H.; Mackey, B.; Lindenmayer, D. Re-Evaluation of Forest Biomass Carbon Stocks and Lessons from the World’s Most Carbon-Dense Forests. Proc. Natl. Acad. Sci. USA 2009, 106, 11635–11640. [Google Scholar] [CrossRef] [PubMed]
- Hinko-Najera, N.; Isaac, P.; Beringer, J.; van Gorsel, E.; Ewenz, C.; McHugh, I.; Exbrayat, J.-F.; Livesley, S.J.; Arndt, S.K. Net Ecosystem Carbon Exchange of a Dry Temperate Eucalypt Forest. Biogeosciences 2017, 14, 3781–3800. [Google Scholar] [CrossRef]
- Esper, J.; Cook, E.R.; Schweingruber, F.H. Low-Frequency Signals in Long Tree-Ring Chronologies for Reconstructing Past Temperature Variability. Science 2002, 295, 2250–2253. [Google Scholar] [CrossRef] [PubMed]
- Fritz, H. Tree Rings and Climate; Academic Press: London, UK, 1976. [Google Scholar]
- Hinko-Najera, N.; Najera-Umaña, J.; Smith, M.G.; Löw, M.; Griebel, A.; Bennett, L.T. Relationships of Intra-Annual Stem Growth with Climate Indicate Distinct Growth Niches for Two Co-Occurring Temperate Eucalypts. Sci. Total Environ. 2019, 690, 991–1004. [Google Scholar] [CrossRef] [PubMed]
- Hopkins, E.R. Fluctuations in the Girth of Regrowth Eucalypt Stems. Aust. For. 1968, 32, 95–110. [Google Scholar] [CrossRef]
- Keenan, R.J. Climate Change and Australian Production Forests: Impacts and Adaptation. Aust. For. 2017, 80, 197–207. [Google Scholar] [CrossRef]
- Muller, B.; Pantin, F.; Génard, M.; Turc, O.; Freixes, S.; Piques, M.; Gibon, Y. Water Deficits Uncouple Growth from Photosynthesis, Increase C Content, and Modify the Relationships between C and Growth in Sink Organs. J. Exp. Bot. 2011, 62, 1715–1729. [Google Scholar] [CrossRef] [PubMed]
- Lenz, A.; Hoch, G. Korner Early Season Temperature Controls Cambial Activity and Total Tree Ring Width at the Alpine Treeline. Plant Ecol. Divers. 2011, 6, 365–375. [Google Scholar] [CrossRef]
- Overdieck, D. CO2, Temperature, and Trees; Ecological Research Monographs; Springer: Singapore, 2016; ISBN 978-981-10-1859-6. [Google Scholar]
- Prior, L.D.; Bowman, D.M.J.S. Across a Macro-Ecological Gradient Forest Competition Is Strongest at the Most Productive Sites. Front. Plant Sci. 2014, 5, 157–167. [Google Scholar] [CrossRef]
- Glencross, K.; West, P.W.; Nichols, J.D. Species Shade Tolerance Affects Tree Basal Area Growth Behaviour in Two Eucalypt Species in Thinned and Unthinned Even-Aged Monoculture. Aust. For. 2016, 79, 157–167. [Google Scholar] [CrossRef]
- Boyden, S.; Brinkley, D.; State, J.L. Competition among “Eucalyptus” Tree Depends Genetic Variation and Resource Supply. Ecology 2008, 89, 2850–2859. [Google Scholar] [CrossRef] [PubMed]
- Specht, R. Foliage Projective Cover and Standing Biomass. In Vegetation Classification in Australia; Gillson, A., Anderson, D., Eds.; CSIRO: Canberra, Australia, 1981; pp. 10–21. [Google Scholar]
- Victorian Aboriginal Heritage Council. Wurundjeri Woi Wurrung Cultural Heritage Aboriginal Corporation Map 1 June 2021; Victoria Aboriginal Heritage Council: East Melbourne, VIC, Australia, 2021; p. 1.
- Recognition and Settlement Agreement—Volume 1 of 2 under the Traditional Owner Settlement Act 2010 (Vic) between Dja Dja Wurrung Clans Aboriginal Corporation and The State of Victoria; Dja Dja Wurrung Clans Aboriginal Corporation and the Honourable Robert Clark, MP, Attorney-General for and on behalf of the State of Victoria; Dja Dja Wurrung Clans Aboriginal Corporation: Bendigo, VIC, Australia, 2013; pp. 1–53.
- Matthews, N.; Missingham, B. Social Accountability and Community Forest Management: The Failure of Collaborative Governance in the Wombat Forest. Dev. Pract. 2009, 19, 1052–1063. [Google Scholar] [CrossRef]
- Bennett, L.T.; Aponte, C.; Tolhurst, K.G.; Löw, M.; Baker, T.G. Decreases in Standing Tree-Based Carbon Stocks Associated with Repeated Prescribed Fires in a Temperate Mixed-Species Eucalypt Forest. For. Ecol. Manag. 2013, 306, 243–255. [Google Scholar] [CrossRef]
- Montserud, R.; Sterba, H. A Basal Area Increment Model for Individual Trees Growing in Even- and Uneven-Aged Forest Stands in Austria. For. Ecol. Manag. 1996, 80, 57–80. [Google Scholar] [CrossRef]
- Tenzin, J.; Tenzin, K.; Hasenauer, H. Individual Tree Basal Area Increment Models for Broadleaved Forests in Bhutan. Forestry 2017, 90, 367–380. [Google Scholar] [CrossRef]
- Wykoff, W.R. A Basal Area Increment Model for Individual Conifers in the Northern Rocky Mountains. For. Sci. 1990, 36, 1077–1104. [Google Scholar] [CrossRef]
- Smith, D. The Practice of Silviculture, 8th ed.; John Wiley & Sons: New York, NY, USA, 1986. [Google Scholar]
- Hegyi, F. A Simulation Model for Managing Jackpine Stands. In Proceedings of IUFRO Meeting S4.01.04 on Growth Models for Tree and Stand Simulation; Fries, J., Ed.; Royal College of Forestry: Stockholm, Sweden, 1974; pp. 74–90. [Google Scholar]
- Contreras, M.; Affleck, D.; Chung, W. Evaluating Tree Competition Indices as Predictors of Basal Area Increment in Western Montana Forests. For. Ecol. Manag. 2011, 262, 1939–1949. [Google Scholar] [CrossRef]
- Ledermann, T. Evaluating the Performance of Semi-Distance-Independent Competition Indices in Predicting the Basal Area Growth of Individual Trees. Can. J. For. Res. 2010, 40, 796–805. [Google Scholar] [CrossRef]
- Gill, A.; Brack, C.; Hall, T. Bark Probe—An Instrument for Measuring Bark. Aust. For. 1982, 45, 206–208. [Google Scholar] [CrossRef]
- Lee, W.; Von Gadow, K. Iterative Selection of Competitor Trees in Pinus Densiflora Stands. Allg. Forst Jagdztg. 1997, 168, 41–45. [Google Scholar] [CrossRef]
- RStudio Team. RStudio: Integrated Development for R; RStudio: Boston, MA, USA, 2020. [Google Scholar]
- R Core Team. R: A Language and Environment for Statistical Computing. R Foundation for Statistical Computing; R Core Team: Vienna, Austria, 2021. [Google Scholar]
- Pinheiro, J.; Bates, D.; DebRoy, S.; Sarkar, D. Nlme: Linear and Nonlinear Mixed Effects Models.; R Core Team: Vienna, Austria, 2018. [Google Scholar]
- Etzold, S.; Sterck, F.; Bose, A.K.; Braun, S.; Buchmann, N.; Eugster, W.; Gessler, A.; Kahmen, A.; Peters, R.L.; Vitasse, Y.; et al. Number of Growth Days and Not Length of the Growth Period Determines Radial Stem Growth of Temperate Trees. Ecol. Lett. 2022, 25, 427–439. [Google Scholar] [CrossRef]
- Zweifel, R. Radial Stem Variations—A Source of Tree Physiological Information Not Fully Exploited Yet. Plant Cell Environ. 2016, 39, 231–232. [Google Scholar] [CrossRef] [PubMed]
- Mencuccini, M.; Salmon, Y.; Mitchell, P.; Hölttä, T.; Choat, B.; Meir, P.; O’Grady, A.; Tissue, D.; Zweifel, R.; Sevanto, S.; et al. An Empirical Method That Separates Irreversible Stem Radial Growth from Bark Water Content Changes in Trees: Theory and Case Studies. Plant Cell Environ. 2017, 40, 290–303. [Google Scholar] [CrossRef] [PubMed]
- Zweifel, R.; Eugster, W.; Etzold, S.; Dobbertin, M.; Buchmann, N.; Häsler, R. Link between Continuous Stem Radius Changes and Net Ecosystem Productivity of a Subalpine Norway Spruce Forest in the Swiss Alps. New Phytol. 2010, 187, 819–830. [Google Scholar] [CrossRef]
- Zuur, A.; Leno, E.; Walker, N.; Saveliev, A.; Smith, G. Mixed Effects Models and Extensions in Ecology with R; Statistics for Biology and Health; Springer: New York, NY, USA, 2009. [Google Scholar]
- Jupiter, D. Snug as a Bug: Goodness of Fit and Quality of Models. J. Foot Ankle Surg. 2017, 56, 1357–1360. [Google Scholar] [CrossRef]
- Akaike, H. Information Theory as an Extension of the Maximum Likelihood Principle. In Second International Symposium on Information Theory; Petrov, F., Csaki, F., Eds.; Akademiai Kiado: Budapest, Hungary, 1973; pp. 267–281. [Google Scholar]
- Tang, M.; Slud, E.; Pfeiffer, R. Goodness of Fit Tests for Linear Mixed Models. J. Multivar. Anal. 2014, 130, 176–193. [Google Scholar] [CrossRef]
- Bartoń, K. MuMIn: Multi-Model Inference. R Package Version 1.43.17; R Foundation for Statistical Computing: Vienna, Austria, 2020. [Google Scholar]
- Nakagawa, S.; Schielzeth, H. A General and Simple Method for Obtaining R2 from Generalized Linear Mixed-Effects Models. Methods Ecol. Evol. 2013, 4, 133–142. [Google Scholar] [CrossRef]
- Jaeger, B. R2glmm: Computes R Squared for Mixed (Multilevel) Models; R Foundation for Statistical Computing: Vienna, Austria, 2017. [Google Scholar]
- Millner, J.P.; Kemp, P.D. Seasonal Growth of Eucalyptus Species in New Zealand Hill Country. New For. 2012, 43, 31–44. [Google Scholar] [CrossRef]
- Griebel, A.; Bennett, L.T.; Metzen, D.; Pendall, E.; Lane, P.N.J.; Arndt, S.K. Trading Water for Carbon: Maintaining Photosynthesis at the Cost of Increased Water Loss During High Temperatures in a Temperate Forest. J. Geophys. Res. Biogeosciences 2020, 125, e2019JG005239. [Google Scholar] [CrossRef]
- Carnwath, G.; Nelson, C. The Effect of Competition on Responses to Drought and Interannual Climate Variability of a Dominant Conifer Tree of Western North America. J. Ecol. 2016, 104, 1421–1431. [Google Scholar] [CrossRef]
- Duchesneau, R.; Lesage, I.; Messier, C.; Morin, H. Effects of Light and Intraspecific Competition on Growth and Crown Morphology of Two Size Classes of Understory Balsam Fir Saplings. For. Ecol. Manag. 2001, 140, 215–225. [Google Scholar] [CrossRef]
- Ford, K.R.; Breckheimer, I.K.; Franklin, J.F.; Freund, J.A.; Kroiss, S.J.; Larson, A.J.; Theobald, E.J.; HilleRisLambers, J. Competition Alters Tree Growth Responses to Climate at Individual and Stand Scales. Can. J. For. Res. 2017, 47, 53–62. [Google Scholar] [CrossRef]
- Amaia Laskurain, N.; Aldezabal, A.; Odriozola, I.; Julio Camarero, J.; Miguel Olano, J. Variation in the Climate Sensitivity Dependent on Neighbourhood Composition in a Secondary Mixed Forest. Forests 2018, 9, 43. [Google Scholar] [CrossRef]
- Arzac, A.; Tabakova, M.; Khotcinskaia, K.; Koteneva, A.; Kirdyanov, A.; Olano, J. Linking Tree Growth and Intra-Annual Density Fluctuations to Climate in Suppressed and Dominant Pinus Sylvestris L. Trees in the Forest-Steppe of Southern Siberia. Dendrochronologia 2021, 67, 1–11. [Google Scholar] [CrossRef]
- Lu, K.; Chen, N.; Zhang, C.; Dong, X.; Zhao, C. Drought Enhances the Role of Competition in Mediating the Relationship between Tree Growth and Climate in Semi-Arid Areas of Northwest China. Forests 2019, 10, 804. [Google Scholar] [CrossRef]
- Ferreira, L.; Constantino, M.; Borges, J.G.; Garcia-Gonzalo, J.; Barreiro, S. A Climate Change Adaptive Dynamic Programming Approach to Optimize Eucalypt Stand Management Scheduling: A Portuguese Application. Can. J. For. Res. 2016, 46, 1000–1008. [Google Scholar] [CrossRef]
- Moreno-Fernández, D.; Aldea, J.; Gea-Izquierdo, G.; Cañellas, I.; Martín-Benito, D. Influence of Climate and Thinning on Quercus Pyrenaica Willd. Coppices Growth Dynamics. Eur. J. Forest Res. 2021, 140, 187–197. [Google Scholar] [CrossRef]
- Bosela, M.; Štefančík, I.; Marčiš, P.; Rubio-Cuadrado, Á.; Lukac, M. Thinning Decreases Above-Ground Biomass Increment in Central European Beech Forests but Does Not Change Individual Tree Resistance to Climate Events. Agric. For. Meteorol. 2021, 306, 108441. [Google Scholar] [CrossRef]
- Trugman, A.T.; Medvigy, D.; Anderegg, W.R.L.; Pacala, S.W. Differential Declines in Alaskan Boreal Forest Vitality Related to Climate and Competition. Glob Chang. Biol. 2018, 24, 1097–1107. [Google Scholar] [CrossRef] [PubMed]
- Lang, A.C.; Härdtle, W.; Baruffol, M.; Böhnke, M.; Bruelheide, H.; Schmid, B.; von Wehrden, H.; von Oheimb, G. Mechanisms Promoting Tree Species Co-Existence: Experimental Evidence with Saplings of Subtropical Forest Ecosystems of China. J. Veg. Sci. 2012, 23, 837–846. [Google Scholar] [CrossRef]
- Rodríguez de Prado, D.; Riofrío, J.; Aldea, J.; Bravo, F.; Herrero de Aza, C. Competition and Climate Influence in the Basal Area Increment Models for Mediterranean Mixed Forests. For. Ecol. Manag. 2022, 506, 119955. [Google Scholar] [CrossRef]
- Bennett, A.C.; Arndt, S.K.; Bennett, L.T.; Knauer, J.; Beringer, J.; Griebel, A.; Hinko-Najera, N.; Liddell, M.J.; Metzen, D.; Pendall, E.; et al. Thermal Optima of Gross Primary Productivity Are Closely Aligned with Mean Air Temperatures across Australian Wooded Ecosystems. Glob. Chang. Biol. 2021, 27, 4727–4744. [Google Scholar] [CrossRef] [PubMed]
- Martin-Benito, D.; Kint, V.; del Rio, M.; Muys, B.; Cañellas, I. Growth Responses of West-Mediterranean Pinus Nigra to Climate Change Are Modulated by Competition and Productivity: Past Trends and Future Perspectives. For. Ecol. 2011, 262, 1030–1040. [Google Scholar] [CrossRef]
- Rohner, B.; Weber, P.; Thurig, E. Bridging Tree Rings and Forest Inventories: How Cli- Mate Effects on Spruce and Beech Growth Aggregate over Time. For. Ecol. Manag. 2016, 360, 159–169. [Google Scholar] [CrossRef]
- Kellas, J.; Edgar, J.; Squire, R. Response of Messmate Stringybark Regrowth to Release in Irregular Stands of Mixed Eucalypts. Australas. J. Environ. Manag. 1987, 50, 253–259. [Google Scholar] [CrossRef]
- Kellas, J.; Jarrett, R.G.; Morgan, B.J.T. Changes in Species Composition Following Recent Shelterwood Cutting in Mixed Eucalypt Stands in the Wombat Forest, Victoria. Aust. For. 1988, 51, 112–118. [Google Scholar] [CrossRef]
- Bountis, D.; Milios, E. Does Crown Class Classification Improve the Initation and Development Analysis of Post-Fire Pinus Brutia Stands? Cerne 2017, 23, 61–68. [Google Scholar] [CrossRef][Green Version]


Publisher’s Note: MDPI stays neutral with regard to jurisdictional claims in published maps and institutional affiliations. |
© 2022 by the authors. Licensee MDPI, Basel, Switzerland. This article is an open access article distributed under the terms and conditions of the Creative Commons Attribution (CC BY) license (https://creativecommons.org/licenses/by/4.0/).