Abstract
Fungal-biogeography studies have shown global patterns of biotic interactions on microbial biogeography. However, the mechanisms underlying these patterns remain relatively unexplored. To determine the dominant factors affecting forest soil fungal diversity in China, soil and leaves from 33 mountain forest reserves were sampled, and their properties were measured. We tested three hypotheses and established the most realistic one for China. The results showed that the soil fungal diversity (Shannon index) varied unimodally with latitude. The relative abundance of ectomycorrhizae was significantly positively correlated with the leaf nitrogen/phosphorus. The effects of soil available phosphorus and pH on fungal diversity depended on the ectomycorrhizal fungi, and the fungal diversity shifted by 93% due to available phosphorus, potassium, and pH. Therefore, we concluded that latitudinal changes in temperature and the variations in interactions between different fungal guilds (ectomycorrhizal, saprotrophic, and plant pathogenic fungi) did not have a major influence. Forest soil fungal diversity was affected by soil pH, available phosphorus, and potassium, which are driven by the phosphorus limitation of trees.
1. Introduction
Forest soil fungi are an important type of microorganism involved in the decomposition of organic matter in the forest soil, which can provide nutrients to plants through symbiosis with plants, and forest soil fungi diversity plays a pivotal role in maintaining the balance of the forest ecosystem [1]. The latitudinal gradient in forest soil fungal biodiversity has recently attracted considerable interest from ecologists [2,3]. Previously, little was known about how the fungal biodiversity of forest soils varies across latitudinal gradients [4,5]. Although fungal-biogeography studies have shown global patterns of biotic interactions in microbial biogeography, the mechanisms underlying these patterns remain relatively unexplored because it is difficult to distinguish the relevant factors that possibly modulate the soil fungi diversity [5,6]. At present, no key factors have been identified that can explain the global biogeographic pattern of microorganisms [7,8]. In addition, studies have focused mainly on single predictors rather than the mechanisms underlying these biogeographical patterns, making some of the findings of the studies questionable [9]. However, to date, knowledge of the mechanisms underlying soil fungi distribution has lagged behind in comparison with that of microorganisms. Additionally, there are few studies on the geographic mechanism of soil fungal diversity in different forest types [2]. Soil fungi play pivotal roles in the maintenance of the functions of forest ecosystems, and it is of great significance to investigate the major factors that can explain soil fungal diversity [10,11].
In general, as the latitude increases (from the warm tropics to the cold polarities), biodiversity gradually decreases [12]. Some studies suggest that soil fungi in forest ecosystems follow a similarly universal latitudinal trend caused by temperature change, even though bacteria tend to not follow this pattern [13,14]. The possible underlying mechanism is that the latitude changes in temperature are often associated with variations in plant productivity and biodiversity, and the soil fungi diversity in warm, tropical soils is higher than that in cold poles [15,16,17]. The strongest evidence supporting this theory is that soil fungal richness is negatively correlated across the latitudinal gradients globally [5,18]. Another theory suggests that forest soil fungal biodiversity is mainly determined by plant–fungal interactions or interactions between different fungal guilds [16,19]. Soil symbiotic fungi (e.g., ectomycorrhizal fungi [EMF]) and plants belong to a mutually beneficial symbiosis relationship, and there is a close material exchange and energy circulation between soil fungi and plants, especially in high-latitude environments with limited nutrients [20,21]. The high abundance of EMF possibly promotes nutrient exchange between plants and fungi, thereby meeting the nutrient requirements of plants, and subsequently improves fungal diversity via positive plant–EMF feedback [22]. Furthermore, it is reported that plant pathogenic fungi in soils play essential roles in promoting the coexistence of plant species [23]. Thus, the forest soil fungal biodiversity may be affected by plant–soil–fungal interactions [24,25,26].
Recently, more attention has been paid to nutrient limitations, especially phosphorus (P) limitations, which affect soil fungal biodiversity [27]. Globally, as the latitude increases, forest ecosystems vary from P limitation to nitrogen (N) limitation, but most of the forest areas in China are P limited [28]. A meta-analysis of 65 field studies across the Earth’s major forest ecosystems revealed that P limitations may shift with changes in biodiversity [29]. Research and model simulation based on resource optimization theory revealed that the biodiversity of forests was P limited [30,31]. Similarly, soil fungal diversity may also be affected by P limitations following the resource optimization theory. The changes of soil P bioavailability in different plant ecosystems possibly affect the material exchange and energy flow between plants and between plant–soil fungi, which affect the soil fungi biodiversity [32,33,34]. Forest soil fungal diversity alleviates the P limitation of plants by regulating the form of soil bioavailable P [8,35]. Plant symbiotic fungi (such as EMF) play pivotal roles in plant–microbe–soil interactions because they can exchange P and other nutrients [8,35,36]. P limitation may thus be considered a key factor affecting fungal diversity in forest ecosystems with diverse microbial species [33].
Which theory can best reflect the actual mechanism of forest soil fungal diversity construction? To address this question, we explored the following three hypotheses: (1) fungal diversity is mainly correlated with latitudinal change in temperature; (2) the latitudinal change of forest soil fungal diversity is mainly determined by the various interactions between different fungal guilds (such as EMF, saprotrophic, and plant pathogenic fungi); (3) the latitudinal change of forest soil fungal diversity is mainly dominated by the shift in the P limitation of trees. If the first hypothesis is the most realistic, the forest soil fungal diversity should be positively correlated with latitude [13]. If the second hypothesis is the most realistic, fungal guilds (such as ectomycorrhizal, saprotrophic, and plant pathogenic fungi) should be correlated with soil fungal diversity [37]. Finally, if the third hypothesis is the most realistic, the forest soil fungal diversity should be correlated with leaf N/P, which could reflect the P limitation of plants, along with soil available nutrition (such as P and potassium (K)) or pH [38]. To test these three hypotheses and establish which is the most realistic one for China, leaf and soil samples were collected from 33 forest reserves across China.
2. Materials and Methods
2.1. Soil and Leaf Sampling
The leaves and soil samples needed for the experiment were collected from 33 mountain forest reserves in China (Figure 1). These forest reserves are located within the range of latitude (21.40°–53.56° N) and longitude (101.03°–128.52° E). These areas are characterized by rich vegetation types (tropical forest, subtropical forest, temperate deciduous broadleaf forest, temperate mixed coniferous–broadleaf forest, boreal forest), mean annual precipitation (from 299 mm to 2209 mm), mean annual temperature (from −5.5 °C to 22.7 °C), mean annual humidity (from 46.4% to 80%), mean annual evapotranspiration (from 604 mm to 1278 mm) (Table 1). In each forest reserve, 9–15 sampling plots were randomly selected along the same aspect of the mountain, and 5 topsoil samples (5 cm depth) were randomly collected and immediately stored in a precooled polyethylene bag in each plot. At the same time, leaves of the dominant trees’ species in each plot were sampled; specifically, 10 leaves were sampled from 2–5 healthy adult trees, and leaves were merged into a mixed sample for subsequent analysis. More details regarding the methods are available in Song and Zhou [39]. All meteorological data in the present study were downloaded from the National Meteorological Science Data Center of China (http://data.cma.cn (accessed on 14 April 2019)).
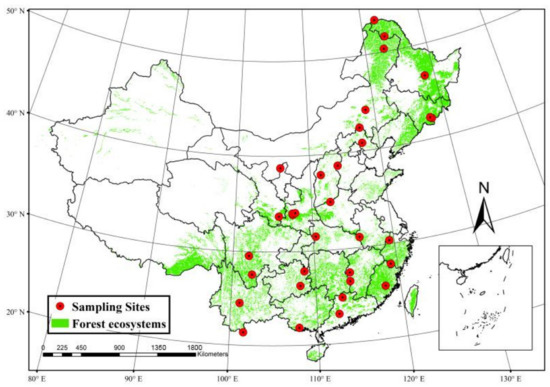
Figure 1.
Map of forest station that was used for sampling.

Table 1.
Location, climate, and vegetation information of sampling sites.
2.2. Soil and Leaf Analysis
The MoBio PowerSoil DNA extraction kit (Carlsbad, CA, USA) was used to extract the DNA of soil samples. The primer sets ITS3 (5′–GCATCGATGAAGAACGCAGC–3′) and ITS4 (5′–TCCTCCGCTTATTGATATGC–3′) were used to determine the fungal community composition by polymerase chain reaction (PCR). The PCR reactions were performed as follows: 98 °C for 30 s, followed by 35 cycles of 98 °C for 10 s, 52 °C for 25 s, and 72 °C for 30 s, final extension 72 °C for 8 min. The EZNA Gel Extraction Kit (Omega BioTek, Doraville, GA, USA) and MiSeq NextGen platform (Illumina, San Diego, CA, USA) were used to purify and sequence the PCR products, respectively. After removing low-quality bases, FLASH (version 1.2) was used to merge paired-end reads [40]. MOTHUR (version 1.36) was used to demultiplex merged sequences to samples based on their unique barcodes [41]. Operational taxonomic units (OTUs) were clustered at the 97% similarity threshold by using USEARCH. OTUs were classified into different functional taxa by using FUNGuild [42]. After the samples were dried and ground, a Finnigan MAT 253 Isotope Ratio Mass Spectrometer and Flash 2000 EA-HT Elemental Analyzer (Thermo Fisher Scientific Inc., Waltham, MA, USA) were used to measure the values of δ13C, N, and P contents of the leaf samples. More details and the representative fungal OTU sequences can be found in Song and Zhou [39].
2.3. Statistical Analysis
The R packages “lavaan” and “piecewiseSEM” for structural equation modeling (SEM) were used to determine the pathways related to the observed effects of environmental predictors [43,44]. Fisher’s C test was used to confirm the goodness of the modeling results. The illustration of the forest distribution map and the statistical analyses were performed by ArcGIS 10.2 (ESRI Inc., Redlands, CA, USA) and IBM SPSS Statistics 23.0 (IBM Inc., Endicott, NY, USA), respectively.
3. Results
3.1. Latitudinal Variations
As the latitude increased, the soil fungi Shannon index increased first and then decreased, and reached a peak at around 40° N (Figure 2A). The leaf N/P and the relative abundance of EMF were significantly positively correlated with latitude (Figure 2B,C). Soil available P increased with latitude and then decreased significantly with latitude (Figure 2D). Soil available K and pH increased with latitude significantly (Figure 2E,F). The relative abundances of saprophytic fungi and plant pathogenic fungi were not correlated with latitude.
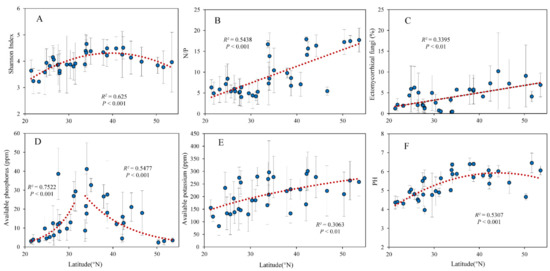
Figure 2.
Relationship between latitude and (A) Shannon diversity index of soil fungi, (B) leaf N/P, soil (C) EMF relative abundance, (D) available P, (E) available K, and (F) pH.
3.2. Associations with Leaf N/P and Soil Fungal Communities
The soil fungi Shannon index was related to leaf N/P significantly in a unimodal trend and peaked at a value of approximately 10 (Figure 3A). The fungi Shannon index was significantly positively correlated with soil available P, K, and pH (Figure 3B–D). The EMF was significantly positively correlated with leaf N/P as well (Figure 4A). Soil pH, available P, and K were associated with leaf N/P in unimodal trends and peaked at a value of approximately 15 (Figure 4B–D). As the plant pathogens increased, the EMF continued to decrease; there was a significant negative correlation between the plant pathogens and EMF (Figure S1A). The leaf δ13C varied with the plant pathogens in a bathtub-curve pattern (Figure S1B). Soil available P significantly decreased with the EMF relative abundance (Figure S1C).
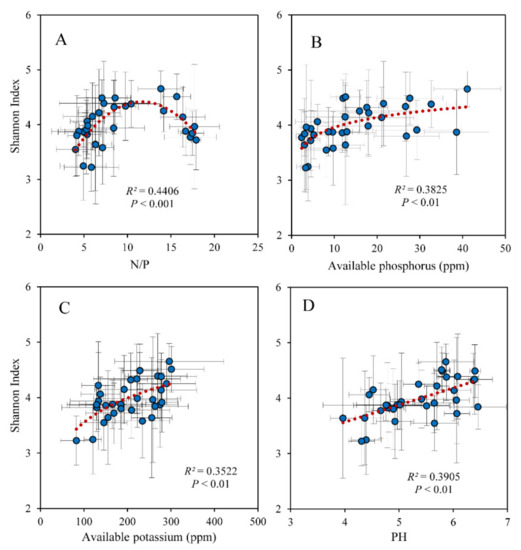
Figure 3.
Relationship between Shannon diversity index of soil fungi and (A) the N/P of leaves and soil (B) available P, (C) available K, and (D) pH.
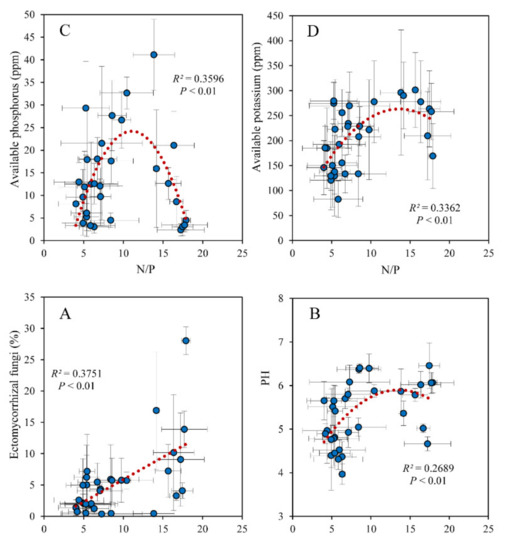
Figure 4.
Relationship between the N/P of leaves and soil and (A) EMF relative abundance, (B) pH, (C) available P, and (D) available K.
The SEM explained 66% of the variation in the fungal Shannon index and provided evidence that leaf N/P played essential roles in regulating the influence of latitudinal fungal diversity (Figure 5). In addition, the effects of soil available P and pH on fungal diversity depended on EMF, with the fungal Shannon index appearing to be shifted by 93% due to soil available P, K, and pH, respectively (Figure 5). These findings suggest that the P limitation of trees is the major predictor of soil fungal diversity.
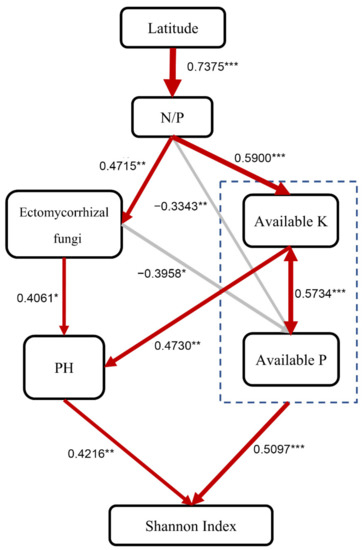
Figure 5.
Structural equation model describing the influence of driving factors on the forest soil fungal OTU Shannon index in China. The numbers next to the arrows indicate the effect size of the relationship. Red represents positive correlation, and grey represents negative correlation. * p < 0.05, ** p < 0.01, *** p < 0.001. Fisher’s C = 25.823, P = 0.172, DF = 20, AIC = 71.823, BIC = 106.243.
4. Discussion
4.1. Biogeographical Variations in Soil Fungal Communities
The temperature in China gradually decreases from south to north, thus causing the plant and animal diversity to gradually decrease. If the forest soil fungal diversity was al-so following this pattern, it should be positively correlated with latitude [13,45,46]. However, the soil fungal diversity (Shannon index) showed a parabolic variation across latitudes; this shows that the first hypothesis was not the most realistic.
Certain studies suggest that such a peak (40° N) in fungal diversity might be caused by the variation in plant–soil interactions, in which EMF was the most important factor [24,25,26,47]. They found that the latitude variation of soil EMF diversity was similar to the variation in the entire fungal diversity, which indicates that soil fungal diversity was mainly dominated by EMF [25,48]. Furthermore, the plant pathogenic fungi could also strongly affect the soil fungal diversity through the negative density-dependent hypothesis in forests [23]. However, we found that the EMF increased with latitude, indicating that the survival of trees in cold regions was more dependent on EMF than that in warm regions [47,49]. There was no significant relationship between saprotrophic and plant pathogenic fungal diversity and latitude. These results showed that fungal guilds were not correlated with latitude. Instead, EMF can inhibit pathogens, which is beneficial to plants [50]. Furthermore, leaf δ13C can reflect plant long-term water-use efficiency, and it was reported that plant pathogenic fungi could affect leaf δ13C [51,52]. These findings showed that EMF improved the host performance, ecosystem services, and plant diversity through positive density dependence or protection of plants [23,53,54], but soil fungal diversity does not rely on them. Therefore, the second hypothesis is also not the most realistic [37].
4.2. Associations between P Limitation and Soil Fungal Diversity
The soil fungi Shannon index first increased and then decreased with leaf N/P, and it reached a peak at a value of approximately 10 at around 40° N. Generally, leaf N/P reached a value of approximately 10, indicating that the nutritional limitation of plants shifted from P to N limitation. Therefore, the correlation between leaf N/P and fungal Shannon index suggests that the soil fungal diversity was strongly affected by nutritional limitation [55,56]. Leaf N/P was positively significantly correlated with latitude, in contrast with the global pattern [38]. Although we collected leaves of only dominant trees, the variation in whole plant leaf N/P with latitude is moderate in China [57]. As the latitude increased, the relative abundance of EMF also increased significantly, which is possibly due to the competitive dominance of EMF symbiotic with the most common tree species [53,58]. EMF can inhibit the mycorrhizal root colonization of neighboring arbuscular mycorrhizal herbs by promoting litter accumulation and limiting nutrient access, which enhances the competitive advantage of EMF trees [59,60]. During such processes, the dominant trees have been shown to absorb more nutrients, especially N, thus making the leaf N/P of the most common trees higher than other plants in high latitude areas, while the leaf N/P of whole plants was not significantly different from that of lower latitudes [61,62,63,64]. Meanwhile, tree roots deposit their exudates into the soil to promote mineral transformation and improve stress resistance [65,66], thus leading to soil available K being positively correlated with latitude.
Soil available P significantly increased with latitude and then decreased significantly with latitude, which was similar to the latitude variation of the fungal Shannon index. This indicates that fungal diversity was strongly affected by the plant utilization of P. Trees in colder areas or areas with P limitation rely more on EMF; therefore, the EMF was significantly positively correlated with latitude and leaf N/P [33,49]. More EMF, together with more root exudates, could release more available P and K under P limitation but would also acidify the soil [67,68,69]. Compared with arbuscular mycorrhizal fungi (AMF), the acidification effect of EMF is not strong. Moreover, EMF can absorb acidic exudates from roots; therefore, EMF can reduce soil acidification [70,71]. However, when trees were under extreme P limitation (leaf N/P > 15), the root–microbial systems absorbed more P and K. They also deposit more exudates into the soil so that the acidification is enhanced, resulting in lower soil pH and decreasing available P and K. Therefore, soil pH and available P and K concentrations were unimodally related to leaf N/P. Higher soil pH and available P and K concentrations are beneficial to soil fungi diversity [31,33,51]; therefore, there was a very significant positive correlation between soil fungi Shannon index and soil available P, K, and pH.
5. Conclusions
Compared with temperature and the various interactions between different fungal guilds, the P limitation of the trees was more similar to the dominant factor which influenced the latitudinal variations of forest soil fungal diversity in China. The SEM constructed from the observed effects of environmental predictors explained 66% of the variation in the fungal Shannon index, and the fungal Shannon index changed by 93% due to soil available P, K, and pH variation driven by P limitation. Our study indicated that P limitation was the major factor that influenced the diversity and stability of the underground fungal community. Therefore, more attention should be paid to nutrient limitation in future research on the mechanisms of fungal diversity.
Supplementary Materials
The following are available online at https://www.mdpi.com/article/10.3390/f13020223/s1, Figure S1: Relationships between soil–plant pathogen and (A) EMF relative abundance and (B) leaf δ13C. Relationship between (C) soil available P and EMF relative abundance.
Author Contributions
W.S. developed the ideas and designed the experiments. W.S. and L.Z. performed the experiments and wrote the manuscript. All authors have read and agreed to the published version of the manuscript.
Funding
This study was sponsored by the National Natural Science Foundation of China (31770363), the Key Laboratory of Ecology and Environment in Minority Areas (Minzu University of China), National Ethnic Affairs Commission, (10301-2021000302) and the National Training Pro-gram of Innovation and Entrepreneurship for Undergraduates (URTP2021210046).
Institutional Review Board Statement
Not applicable.
Informed Consent Statement
Not applicable.
Data Availability Statement
The representative fungal OTU sequences have been published in Song and Zhou [39].
Acknowledgments
We would like to thank Yijun Zhou for participating in the research, revising the manuscript, and providing financial support. We also thank Yao Wang for assisting in the experiments.
Conflicts of Interest
The authors declare no conflict of interest.
References
- Guerra, C.A.; Heintz-Buschart, A.; Sikorski, J.; Chatzinotas, A.; Guerrero-Ramírez, N.; Cesarz, S.; Beaumelle, L. Blind spots in global soil biodiversity and ecosystem function research. Nat. Commun. 2020, 11, 3870. [Google Scholar] [CrossRef] [PubMed]
- Xu, X.; Wang, N.; Lipson, D.; Sinsabaugh, R.; Schimel, J.; He, L.; Soudzilovskaia, N.A.; Tedersoo, L. Microbial macroecology: In search of mechanisms governing microbial biogeographic patterns. Glob. Ecol. Biogeogr. 2020, 29, 1870–1886. [Google Scholar] [CrossRef]
- Geisen, S.; Wall, D.H.; van der Putten, W.H. Challenges and opportunities for soil biodiversity in the Anthropocene. Curr. Biol. 2019, 29, 1036–1044. [Google Scholar] [CrossRef] [PubMed]
- Tedersoo, L.; Bahram, M.; Põlme, S.; Kõljalg, U.; Yorou, N.S. Fungal biogeography. Global diversity and geography of soil fungi. Science 2014, 346, 1256688. [Google Scholar] [CrossRef] [PubMed]
- Bahram, M.; Hildebrand, F.; Forslund, S.K.; Anderson, J.L.; Soudzilovskaia, N.A.; Bodegom, P.M.; Bengtsson-Palme, J.; Anslan, S.; Coelho, L.P.; Harend, H.J.N. Structure and function of the global topsoil microbiome. Nature 2018, 560, 233–237. [Google Scholar] [CrossRef] [PubMed]
- Kraft, N.J.; Comita, L.S.; Chase, J.M.; Sanders, N.J.; Swenson, N.G.; Crist, T.O.; Stegen, J.C.; Vellend, M.; Boyle, B.; Anderson, M.J.; et al. Disentangling the drivers of β diversity along latitudinal and elevational gradients. Science 2011, 333, 1755–1758. [Google Scholar] [CrossRef] [PubMed]
- Fierer, N. Embracing the unknown: Disentangling the complexities of the soil microbiome. Nat. Rev. Microbiol. 2017, 15, 579–590. [Google Scholar] [CrossRef]
- Lladó, S.; López-Mondéjar, R.; Baldrian, P. Drivers of microbial community structure in forest soils. Appl. Microbiol. Biotechnol. 2018, 102, 4331–4338. [Google Scholar] [CrossRef]
- Prosser, J.I. Putting science back into microbial ecology: A question of approach. Philos. Trans. R. Soc. Lond. B Biol. Sci. 2020, 375, 20190240. [Google Scholar] [CrossRef]
- Frąc, M.; Hannula, S.E.; Bełka, M.; Jędryczka, M. Fungal biodiversity and their role in soil health. Front. Microbiol. 2018, 9, 707. [Google Scholar] [CrossRef]
- Powell, J.R.; Karunaratne, S.; Campbell, C.D.; Yao, H.; Robinson, L.; Singh, B.K. Deterministic processes vary during community assembly for ecologically dissimilar taxa. Nat. Commun. 2015, 6, 8444. [Google Scholar] [CrossRef] [PubMed]
- Brown, J.H. Why are there so many species in the tropics? J. Biogeogr. 2014, 41, 8–22. [Google Scholar] [CrossRef] [PubMed]
- Liu, S.; Wang, H.; Tian, P.; Yao, X.; Sun, H.; Wang, Q.; Delgado-Baquerizo, M. Decoupled diversity patterns in bacteria and fungi across continental forest ecosystems. Soil Biol. Biochem. 2020, 144, 107763. [Google Scholar] [CrossRef]
- Nkongolo, K.K.; Narendrula-Kotha, R. Advances in monitoring soil microbial community dynamic and function. J. Appl. Genet. 2020, 61, 249–263. [Google Scholar] [CrossRef]
- Wang, Q.; Liu, S.; Tian, P. Carbon quality and soil microbial property control the latitudinal pattern in temperature sensitivity of soil microbial respiration across Chinese forest ecosystems. Glob. Chang. Biol. 2018, 24, 2841–2849. [Google Scholar] [CrossRef]
- Hu, Y.; Veresoglou, S.D.; Tedersoo, L.; Xu, T.; Ge, T.; Liu, L.; Chen, Y.; Hao, Z.; Su, Y.; Rillig, M.C.; et al. Contrasting latitudinal diversity and co-occurrence patterns of soil fungi and plants in forest ecosystems. Soil Biol. Biochem. 2019, 131, 100–110. [Google Scholar] [CrossRef]
- Pugnaire, F.I.; Morillo, J.A.; Peñuelas, J.; Reich, P.B.; Bardgett, R.D.; Gaxiola, A.; Wardle, D.A.; van der Putten, W.H. Climate change effects on plant-soil feedbacks and consequences for biodiversity and functioning of terrestrial ecosystems. Sci. Adv. 2019, 5, eaaz1834. [Google Scholar] [CrossRef]
- Lichtwardt, R.W. Biogeography and fungal systematics. Can. J. Bot. 1995, 73, 731–737. [Google Scholar] [CrossRef]
- Powell, J.R.; Rillig, M.C. Biodiversity of arbuscular mycorrhizal fungi and ecosystem function. New Phytol. 2018, 220, 1059–1075. [Google Scholar] [CrossRef]
- Tedersoo, L.; Mett, M.; Ishida, T.A.; Bahram, M. Phylogenetic relationships among host plants explain differences in fungal species richness and community composition in ectomycorrhizal symbiosis. New Phytol. 2013, 199, 822–831. [Google Scholar] [CrossRef]
- Zipfel, C.; Oldroyd, G.E. Plant signalling in symbiosis and immunity. Nature 2017, 543, 328–336. [Google Scholar] [CrossRef] [PubMed]
- Hortal, S.; Plett, K.L.; Plett, J.M.; Cresswell, T.; Johansen, M.; Pendall, E.; Anderson, I.C. Role of plant–fungal nutrient trading and host control in determining the competitive success of ectomycorrhizal fungi. ISME J. 2017, 11, 2666–2676. [Google Scholar] [CrossRef] [PubMed]
- Chen, L.; Swenson, N.G.; Ji, N.; Mi, X.; Ren, H.; Guo, L.; Ma, K. Differential soil fungus accumulation and density dependence of trees in a subtropical forest. Science 2019, 366, 124–128. [Google Scholar] [CrossRef] [PubMed]
- Bever, J.D.; Mangan, S.A.; Alexander, H.M. Maintenance of Plant Species Diversity by Pathogens. Annu. Rev. Ecol. Evol. Syst. 2015, 46, 305–325. [Google Scholar] [CrossRef]
- Wang, P.; Chen, Y.; Sun, Y.; Tan, S.; Zhang, S.; Wang, Z.; Zhou, J.; Zhang, G.; Shu, W.; Luo, C.; et al. Distinct biogeography of different fungal guilds and their associations with plant species richness in forest ecosystems. Front. Ecol. Evol. 2019, 7, 216. [Google Scholar] [CrossRef]
- Tedersoo, L. Correspondence: Analytical flaws in a continental-scale forest soil microbial diversity study. Nat. Commun. 2017, 8, 15572. [Google Scholar] [CrossRef][Green Version]
- Nehls, U.; Plassard, C. Nitrogen and phosphate metabolism in ectomycorrhizas. New Phytol. 2018, 220, 1047–1058. [Google Scholar] [CrossRef]
- Du, E.; Terrer, C.; Pellegrini, A.F.A.; Ahlström, A.; van Lissa, C.J.; Zhao, X.; Xia, N.; Wu, X.; Jackson, R.B. Global patterns of terrestrial nitrogen and phosphorus limitation. Nat. Geosci. 2020, 13, 221–226. [Google Scholar] [CrossRef]
- Kou, L.; Jiang, L.; Hättenschwiler, S.; Zhang, M.; Niu, S.; Fu, X.; Dai, X.; Yan, H.; Li, S.; Wang, H. Diversity-decomposition relationships in forests worldwide. eLife 2020, 9, e55813. [Google Scholar] [CrossRef]
- Goswami, S.; Fisk, M.C.; Vadeboncoeur, M.A.; Garrison-Johnston, M.; Yanai, R.D.; Fahey, T.J. Phosphorus limitation of aboveground production in northern hardwood forests. Ecology 2018, 99, 438–449. [Google Scholar] [CrossRef]
- Laliberté, E.; Lambers, H.; Burgess, T.I.; Wright, S.J. Phosphorus limitation, soil-borne pathogens and the coexistence of plant species in hyperdiverse forests and shrublands. New Phytol. 2015, 206, 507–521. [Google Scholar] [CrossRef] [PubMed]
- Creamer, R.E.; Hannula, S.E.; Leeuwen, J.P.V.; Stone, D.; Rutgers, M.; Schmelz, R.M.; Ruiter, P.C.; Hendriksen, N.B. Ecological network analysis reveals the inter-connection between soil biodiversity and ecosystem function as affected by land use across Europe. Appl. Soil Ecol. 2016, 97, 112–124. [Google Scholar] [CrossRef]
- Wu, H.; Xiang, W.; Ouyang, S.; Forrester, D.I.; Zhou, B.; Chen, L.; Ge, T.; Lei, P.; Chen, L.; Zeng, Y.; et al. Linkage between tree species richness and soil microbial diversity improves phosphorus bioavailability. Funct. Ecol. 2019, 33, 1549–1560. [Google Scholar] [CrossRef]
- Mezeli, M.M.; Page, S.; George, T.S.; Neilson, R.; Mead, A.; Blackwell, M.S.A.; Haygarth, P.M. Using a meta-analysis approach to understand complexity in soil biodiversity and phosphorus acquisition in plants. Soil Biol. Biochem. 2020, 142, 107695. [Google Scholar] [CrossRef]
- Baldrian, P. Forest microbiome: Diversity, complexity and dynamics. FEMS Microbiol. Rev. 2017, 41, 109–130. [Google Scholar] [CrossRef]
- Khan, A.G. Mycorrhizoremediation—An enhanced form of phytoremediation. J. Zhejiang Univ. Sci. B 2006, 7, 503–514. [Google Scholar] [CrossRef]
- Zvereva, E.L.; Kozlov, M.V. Latitudinal gradient in the intensity of biotic interactions in terrestrial ecosystems: Sources of variation and differences from the diversity gradient revealed by meta-analysis. Ecol. Lett. 2021, 24, 2506–2520. [Google Scholar] [CrossRef]
- Zhang, K.; Cheng, X.; Dang, H.; Zhang, Q. Biomass:N:K:Ca:Mg:P ratios in forest stands world-wide: Biogeographical variations and environmental controls. Glob. Ecol. Biogeogr. 2020, 29, 2176–2189. [Google Scholar] [CrossRef]
- Song, W.; Zhou, Y. Linking leaf δ15N and δ13C with soil fungal biodiversity, ectomycorrhizal and plant pathogenic abundance in forest ecosystems of China. CATENA 2021, 200, 105176. [Google Scholar] [CrossRef]
- Magoč, T.; Salzberg, S.L. FLASH: Fast length adjustment of short reads to improve genome assemblies. Bioinformatics 2011, 27, 2957–2963. [Google Scholar] [CrossRef]
- Schloss, P.D.; Westcott, S.L.; Ryabin, T.; Hall, J.R.; Hartmann, M.; Hollister, E.B.; Lesniewski, R.A.; Oakley, B.B.; Parks, D.H.; Robinson, C.J.; et al. Introducing mothur: Open-source, platform-independent, community-supported software for describing and comparing microbial communities. Appl. Environ. Microbiol. 2009, 75, 7537–7541. [Google Scholar] [CrossRef] [PubMed]
- Nguyen, N.H.; Song, Z.; Bates, S.T.; Branco, S.; Tedersoo, L.; Menke, J.; Schilling, J.S.; Kennedy, P.G. FUNGuild: An open annotation tool for parsing fungal community datasets by ecological guild. Fungal Ecol. 2016, 20, 241–248. [Google Scholar] [CrossRef]
- Rosseel, Y. Lavaan: An R package for structural equation modeling and more. Version 0.5–12 (BETA). J. Stat. Softw. 2012, 48, 1–36. [Google Scholar] [CrossRef]
- Lefcheck, J.S. piecewiseSEM: Piecewise structural equation modelling in r for ecology, evolution, and systematics. Methods Ecol. Evol. 2016, 7, 573–579. [Google Scholar] [CrossRef]
- Shi, L.-L.; Mortimer, P.E.; Ferry Slik, J.W.; Zou, X.-M.; Xu, J.; Feng, W.-T.; Qiao, L. Variation in forest soil fungal diversity along a latitudinal gradient. Fungal Divers. 2014, 64, 305–315. [Google Scholar] [CrossRef]
- Ding, J.; Travers, S.K.; Eldridge, D.J. Microbial communities are associated with indicators of soil surface condition across a continental gradient. Geoderma 2022, 405, 115439. [Google Scholar] [CrossRef]
- Tedersoo, L.; Nara, K. General latitudinal gradient of biodiversity is reversed in ectomycorrhizal fungi. New Phytol. 2010, 185, 351–354. [Google Scholar] [CrossRef]
- Peay, K.G.; Kennedy, P.G.; Talbot, J.M. Dimensions of biodiversity in the Earth mycobiome. Nat. Rev. Microbiol. 2016, 14, 434–447. [Google Scholar] [CrossRef]
- Miyamoto, Y.; Terashima, Y.; Nara, K. Temperature niche position and breadth of ectomycorrhizal fungi: Reduced diversity under warming predicted by a nested community structure. Glob. Chang. Biol. 2018, 24, 5724–5737. [Google Scholar] [CrossRef]
- Kadowaki, K.; Yamamoto, S.; Sato, H.; Tanabe, A.S.; Hidaka, A.; Toju, H. Mycorrhizal fungi mediate the direction and strength of plant-soil feedbacks differently between arbuscular mycorrhizal and ectomycorrhizal communities. Commun. Biol. 2018, 1, 196. [Google Scholar] [CrossRef]
- Cernusak, L.A.; Ubierna, N.; Winter, K.; Holtum, J.A.; Marshall, J.D.; Farquhar, G.D. Environmental and physiological determinants of carbon isotope discrimination in terrestrial plants. New Phytol. 2013, 200, 950–965. [Google Scholar] [CrossRef] [PubMed]
- Taresh, S.; Bai, S.H.; Abdullah, K.M.; Zalucki, J.; Nessa, A.; Omidvar, N.; Wang, D.; Zhan, J.; Wang, F.; Yang, J.; et al. Long-term impact of prescribed burning on water use efficiency, biological nitrogen fixation, and tree growth of understory acacia species in a suburban forest ecosystem of subtropical Australia. J. Soils Sediments 2021, 21, 3620–3631. [Google Scholar] [CrossRef]
- Bennett, J.A.; Maherali, H.; Reinhart, K.O.; Lekberg, Y.; Hart, M.M.; Klironomos, J. Plant-soil feedbacks and mycorrhizal type influence temperate forest population dynamics. Science 2017, 355, 181–184. [Google Scholar] [CrossRef] [PubMed]
- Van der Heijden, M.G.A.; Klironomos, J.N.; Ursic, M.; Moutoglis, P.; Streitwolf-Engel, R.; Boller, T.; Wiemken, A.; Sanders, I.R. Mycorrhizal fungal diversity determines plant biodiversity, ecosystem variability and productivity. Nature 1998, 396, 69–72. [Google Scholar] [CrossRef]
- Güsewell, S. N: P ratios in terrestrial plants: Variation and functional significance. New Phytol. 2004, 164, 243–266. [Google Scholar] [CrossRef]
- Wen, Y.C.; Li, H.Y.; Lin, Z.A.; Zhao, B.Q.; Sun, Z.B.; Yuan, L.; Xu, J.K.; Li, Y.Q. Long-term fertilization alters soil properties and fungal community composition in fluvo-aquic soil of the North China Plain. Sci. Rep. 2020, 10, 7198. [Google Scholar] [CrossRef]
- Ren, S.J.; Yu, G.R.; Tao, B.; Wang, S.Q. Leaf nitrogen and phosphorus stoichiometry across 654 terrestrial plant species in NSTEC. Huan Jing Ke Xue 2007, 28, 2665–2673. [Google Scholar]
- Averill, C.; Bhatnagar, J.M.; Dietze, M.C.; Pearse, W.D.; Kivlin, S.N. Global imprint of mycorrhizal fungi on whole-plant nutrient economics. Proc. Natl. Acad. Sci. USA 2019, 116, 23163–23168. [Google Scholar] [CrossRef]
- Becklin, K.M.; Pallo, M.L.; Galen, C. Willows indirectly reduce arbuscular mycorrhizal fungal colonization in understorey communities. J. Ecol. 2012, 100, 343–351. [Google Scholar] [CrossRef]
- Ferlian, O.; Goldmann, K.; Eisenhauer, N.; Tarkka, M.T.; Buscot, F.; Heintz-Buschart, A. Distinct effects of host and neighbour tree identity on arbuscular and ectomycorrhizal fungi along a tree diversity gradient. ISME Commun. 2021, 1, 40. [Google Scholar] [CrossRef]
- Toju, H.; Kishida, O.; Katayama, N.; Takagi, K. Networks Depicting the Fine-Scale Co-Occurrences of Fungi in Soil Horizons. PLoS ONE 2016, 11, e0165987. [Google Scholar] [CrossRef]
- Luo, S.; Schmid, B.; De Deyn, G.B.; Yu, S. Soil microbes promote complementarity effects among co-existing trees through soil nitrogen partitioning. Funct. Ecol. 2018, 32, 1879–1889. [Google Scholar] [CrossRef]
- Boberg, J.B.; Finlay, R.D.; Stenlid, J.; Ekblad, A.; Lindahl, B.D. Nitrogen and carbon reallocation in fungal mycelia during decomposition of boreal forest litter. PLoS ONE 2014, 9, e92897. [Google Scholar] [CrossRef] [PubMed]
- Du, E.; van Doorn, M.; de Vries, W. Spatially divergent trends of nitrogen versus phosphorus limitation across European forests. Sci. Total Environ. 2021, 771, 145391. [Google Scholar] [CrossRef] [PubMed]
- Müller, M.; Schickhoff, U.; Scholten, T.; Drollinger, S.; Böhner, J.; Chaudhary, R.P. How do soil properties affect alpine treelines? General principles in a global perspective and novel findings from Rolwaling Himal, Nepal. Prog. Phys. Geogr. Earth Environ. 2015, 40, 135–160. [Google Scholar] [CrossRef]
- Piao, H.-C.; Li, S.-L.; Yan, Z.; Li, C. Understanding nutrient allocation based on leaf nitrogen isotopes and elemental ratios in the karst region of Southwest China. Agric. Ecosyst. Environ. 2020, 294, 106864. [Google Scholar] [CrossRef]
- Fujii, K.; Shibata, M.; Kitajima, K.; Ichie, T.; Kitayama, K.; Turner, B.L. Plant–soil interactions maintain biodiversity and functions of tropical forest ecosystems. Ecol. Res. 2018, 33, 149–160. [Google Scholar] [CrossRef]
- Sasse, J.; Martinoia, E.; Northen, T. Feed Your Friends: Do Plant Exudates Shape the Root Microbiome? Trends Plant Sci. 2018, 23, 25–41. [Google Scholar] [CrossRef]
- Chalot, M.; Brun, A. Physiology of organic nitrogen acquisition by ectomycorrhizal fungi and ectomycorrhizas. FEMS Microbiol. Rev. 1998, 22, 21–44. [Google Scholar] [CrossRef]
- Liu, X.; Burslem, D.; Taylor, J.D.; Taylor, A.F.S.; Khoo, E.; Majalap-Lee, N.; Helgason, T.; Johnson, D. Partitioning of soil phosphorus among arbuscular and ectomycorrhizal trees in tropical and subtropical forests. Ecol. Lett. 2018, 21, 713–723. [Google Scholar] [CrossRef]
- Taylor, L.L.; Banwart, S.A.; Valdes, P.J.; Leake, J.R.; Beerling, D.J. Evaluating the effects of terrestrial ecosystems, climate and carbon dioxide on weathering over geological time: A global-scale process-based approach. Philos. Trans. R. Soc. Lond. B Biol. Sci. 2012, 367, 565–582. [Google Scholar] [CrossRef] [PubMed]


Publisher’s Note: MDPI stays neutral with regard to jurisdictional claims in published maps and institutional affiliations. |
© 2022 by the authors. Licensee MDPI, Basel, Switzerland. This article is an open access article distributed under the terms and conditions of the Creative Commons Attribution (CC BY) license (https://creativecommons.org/licenses/by/4.0/).