Abstract
Clonal forestry has developed rapidly in recent years and already plays a significant role in commercial tree plantations worldwide. Clonal breeding requires accurate assessments of genetic parameters, together with measurements of clonal productivity, stability, and adaptably. However, relevant studies for clones of Paulownia spp. genotypes are rare. We therefore conducted clonal tests on twenty Paulownia clones established at three sites in the temperate and subtropical regions of China. Trees were planted in a randomized block design, with four replications in each site, twenty plots in each block, and six to eight individuals of the same clone in each plot. We measured the trunk diameter at breast height (DBH), total trunk height (Ht), and individual stand volume of 7-year-old trees to estimate genetic parameters and analyze genotype–environment interactions. A combined analysis of variance indicated that clonal, site, and clone–site interactions significantly affected the three growth traits. Clonal heritability and individual heritability were 0.35–0.84 and 0.07–0.30, respectively. The phenotypic and genetic correlation coefficients among the growth traits were 0.46–0.93 and 0.85–0.99, respectively. There were extremely significant positive linear relationships between the best linear unbiased predictors for DBH and the original DBH values (R2 > 0.98). Clones 10, 2, 18, and 13 were selected for deployment based on a selection intensity of 1.4, GGE biplots, and the relative performance of harmonic means on genotypic values analysis. For these clones, the genetic gains in DBH, Ht, and volume were 18.05%, 21.46%, and 46.03%, respectively. These results provide useful information for the selection of Paulownia clones at the target sites and will provide a sound basis for improving Paulownia clonal breeding programs in the future.
1. Introduction
The genus Paulownia is native to China and is among the fastest-growing broad-leaved deciduous species in the world. Paulownia species are widely planted for timber production in subtropical and temperate regions [1]. With its light, silky texture, high dimensional stability, and good acoustic resonance, Paulownia wood is used in the manufacture of furniture, decorative materials, musical instruments, handicrafts, and other finished products [2,3]. Paulownia species have been introduced from China to many countries, including the United States, Japan, Poland, Turkey, Israel, India, Mexico, Canada, and Australia [4,5,6]. The original Paulownia species that were introduced worldwide are increasingly being replaced by superior clones such as Cotevisa 2 (Paulownia elongata S. Y. Hu × Paulownia fortunei (Seem.) Hemsl.) [7], Shantong 3 (Paulownia tomentosa (Thunb.) Steud. × Paulownia fortunei), and 9501 (natural hybrid of Paulownia fortunei), among others [5].
The clonal breeding of forest trees has developed rapidly in recent years because it is capable of producing more productive, better adapted, and more stable genotypes than natural varieties, as well as providing more promising management outcomes in commercial plantations [8,9]. The systematic clonal breeding of Paulownia in China began during the 1970s. More than 40 superior clones were obtained through the combined efforts of several generations of experts. The promotion and application of these clones have made great contributions to the Paulownia industry. However, some clones used in commercial plantations have been cultivated for multiple generations and long-term asexual propagation has produced serious problems, including species degradation. Moreover, the investigations of growth traits in superior clones have been restricted to one site per study [10,11].
Genotypes that are superior in one environment may not be correspondingly superior elsewhere [12,13]. Genotype–environment interactions (GEIs) reflect the relative stability and adaptability of different clones. When the growth traits of a given set of clones are evaluated at multiple sites, the clones are often divided into those adapted to specific sites and those adapted to a wider range of environmental conditions. Clones adapted to a narrow range of conditions are an obvious source of GEIs and differential performance across sites. Clones adapted to a wider range of sites may not produce clear GEIs. When the relative adaptation of certain clones to different environments is unclear, their use in large-scale afforestation risks poor growth and potentially irreparable losses [14]. To sustain a healthy and productive Paulownia industry, it is important to evaluate the performance of Paulownia clones in multi-environment trials.
Accurate estimation of GEIs is a serious challenge in multi-environment trials. Well-designed experiments are critical to the success of any clonal breeding program. These experiments should permit the accurate estimation of genetic parameters to produce more reliable predictions of clonal performance [15]. Interactions between clones and their environment should be fully considered so that clones can be deployed to sites where they perform optimally. Both the calculation of genetic gains and the optimal deployment of superior clones are crucial for designing optimum strategies for clonal forestry [16].
Several analytical techniques have been proposed for the accurate evaluation of GEIs. These include additive main effects–multiplication interaction (AMMI) analysis [17], factor analysis (FA) [18], genotypic main effect plus GEI (GGE) analysis [19,20,21], and best linear unbiased predictor (BLUP)-GGE combined analysis [22,23]. Among these methods, GGE analysis has attracted increasing attention from researchers because it evaluates both genetic gain and GEIs, both of which are relevant to the evaluation of clones. However, the use of GGE biplots in the selection and breeding of forest trees is still rare. One challenge to the use of such fixed-effects-only models is that the phenotypic data used often have heterogeneous error variances, and datasets are frequently imbalanced [22,24].
The calculation of BLUPs has been proposed as a breeding-value prediction method for unbalanced data. Such analyses have been used frequently in recent years [25,26]; they make use of linear mixed effects models of fixed and random effects to calculate unbiased predictions of genetic parameters, such as breeding values [27]. BLUPs can effectively process unbalanced data and eliminate the influence of non-genetic factors or heteroscedasticity among experimental sites. Studies have indicated that a GGE biplot analysis based on BLUP data is more reliable than the phenotypic mean for predicting performance in unbalanced datasets, as well as being more suitable for the evaluation of clonal stability and adaptability [23,28,29].
There have been few investigations of Paulownia genetic parameters in field experiments and no studies of GEIs. Therefore, we conducted a 7-year study of clonal tests at three sites spanning the temperate to subtropical regions of China between 2013 and 2019. We investigated variation in diameter at the breast height (DBH), trunk height (Ht), and individual stand volume of 20 Paulownia clones at each site. The objectives of this study were to estimate genetic parameters, including the coefficients of genotypic/experimental variation, heritabilities, and inter-trait correlations and to investigate GEIs and identify superior clones based on clone productivity, genotypic stability, and adaptability. The results of this study will offer insights into the selection of genotypes when establishing Paulownia plantations.
2. Materials and Methods
2.1. Plant Materials and Experimental Design
The twenty Paulownia clones used in this study were drawn from different hybrids, including nine interspecific hybrids of P. tomentosa × P. fortunei, one interspecific hybrid of P. fortunei × P. elongata, four natural hybrids of P. fortunei, one natural hybrid of P. catalpifolia, two plus-tree clones of P. fortunei, two plus-tree clones of P. elongate, and one plus-tree clone of P. fargesii. Table 1 shows detailed information about these clones.

Table 1.
Clones included in the trial and their parentage.
The three sites selected for this study were located in Xinxiang in the temperate region of Henan Province (E1), in the subtropics at Chibi Town, Hubei Province (E2), and Gongqingcheng Town, Jiangxi Province (E3) (Table 2). Site locations are shown in Figure 1. At each site, 1-year-old clonally propagated buried root seedlings with a root-collar diameter of 4.23 ± 0.5 cm were planted in the spring of 2013 in a randomized complete block design with 4 blocks, each of which contained 20 randomly distributed plots containing 6–8 seedlings of a given clone. Seedlings were planted at 4 m × 5 m spacing, and similar planting and maintenance procedures were used at each test site.
Table 2.
Geographical locations and environmental conditions at the three sites.
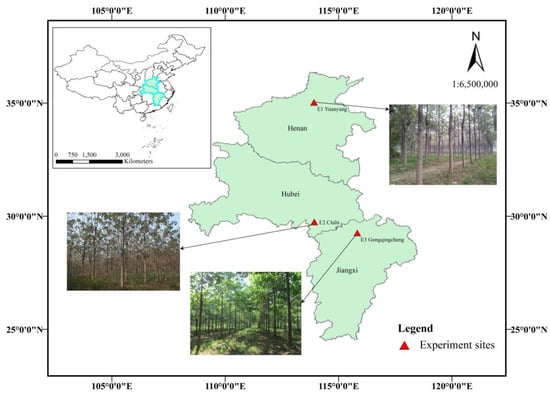
Figure 1.
Geographical locations of the three test sites.
2.2. Measurements
The genus Paulownia displays a pseudo-dichotomous branching pattern, in which the total trunk is usually formed by the original trunk and an extended trunk [30].
The 7-year-old Paulownia had reached the early selection stage [14]. We, thus, measured the following variables at the end of 2019 during winter dormancy: original trunk height (H0), trunk DBH (D1.3), trunk diameter at 2.6 m above ground (D2.6), the height of the extended trunk (H1), the diameter of the extended trunk at 0.5 m above H0 (De0.5), and the diameter of the extended trunk at 1.5 m above H0 (De1.5). An analysis of covariance was used to adjust heights and diameters to compensate for the influence of initial seedling height and DBH on experimental results. Total trunk height (Ht) and stand volumes were calculated on the basis of the H0 and H1 segments, based on Equations (1)–(7), which adapt the methods of Wu et al. [31]:
where Ht is the total trunk height, Vt is the total trunk volume, V0 is the segment volume of the initial seedling trunk, V1 is the segment volume of the extended trunk, Dec is the diameter at the midpoint of the extended trunk, De0.5 is the diameter of the extended trunk at 0.5 m height, De1.5 is the diameter of the extended trunk at 1.5 m height, β1 is the taper factor of the initial seedling trunk, and β2 is the taper factor of the extended trunk.
2.3. Estimates of Genetic Parameters
The variance components of individual sites and joint analyses were estimated using the linear mixed effects model described in Equations (8) and (9) [32]:
where y is the observed value; μ is the global mean; s, b, and b(s) are the fixed effects of site, block, and block within the site, respectively; g, gb, gs, and gsb(s) are the random effects associated with genotypes, the interaction between genotype and block, the interaction between genotype and site, and the interaction between genotype and block within site; e is the residual error; and X and Z are the known correlation matrices relating observed values in y with their respective fixed and random effects.
Genotypic variance among clones (σg2), variance of genotype by site (σgs2), variance of genotype by block (σgb2), and the residual variance (σe2) were estimated from Equations (8) and (9). Genetic parameters were estimated using Equations (10)–(16):
where is the mean value of the measured trait, n is the reconciled mean number of individuals per clone in each block [33], b is the number of blocks, s is the number of sites, and h2 is the clonal heritability.
Phenotypic and genotypic correlations between traits were estimated using Equations (17) and (18):
where Covp is the phenotypic covariance between traits x and y, Covg is the genetic covariance between traits x and y, σp12 and σp22 are the respective phenotypic variances of trait x and trait y, and σg12 and σg22 are the genotypic variances of trait x and trait y.
The analysis was performed using the ASReml-R package from International Limited (VSNi) in the R statistical software environment (version 4.1.0.90).
2.4. Genotype Main Effect Plus Genotype by Environment Interaction Effects
The BLUP values of the 20 genotypes were estimated using a linear-mixed-effects model (Equation (19)) using the lme4 package in R. These BLUPs were then used in a GGE biplot analysis of genotype main effect plus genotype by environment interaction effects [32,34]. The GGEBiplotGUI package was used to conduct the GGE biplot analysis [35]. Biplots of relationships among sites, including Which Won Where/What, discriminative vs. representative, and mean vs. stability were established using the following parameters: Scaling = 0, Centered = G + GE, and SVP = Symmetrical.
where yij are the individual observations of genotype j in environment i, u is the overall mean, Si is the fixed effect of environment, SGij is the random interaction between the jth genotype and the ith environment, and eij is the residual error.
2.5. Productivity, Stability, and Adaptability
We used the following parameters to analyze productivity, adaptability, and stability: the harmonic mean of genotypic values (MHVG), the relative performance of genotypic values (PRVG), and the relative performance of harmonic means on genotypic values (MHPRVG). These parameters were calculated with Equations (20)–(22) [36,37].
where e is the number of sites where genotype i was evaluated, VGij is the genotypic value of genotype i in site j, and μj is the j-site average.
2.6. Expected Gain
We assumed that the selection proportions could be as high as 20% (4 clones out of 20) and that the selection intensity would be 1.4 [38]. The estimates of genetic gain (ΔG) and actual gain (G) were calculated using Equations (23) and (24) [32]:
where i is the intensity of selection, h2 is the clonal heritability, δp is the standard deviation, and xi is the average trait value of the selected clones.
3. Results
3.1. Variance Analysis and Growth Performance
The respective means of DBH, Ht, and individual volume varied from 17.70 cm, 5.76 m, and 0.1319 m3 at the least productive site (E1) to 18.87 cm, 7.73 m, and 0.1465 m3 at the most productive site (E2). The means and variabilities of DBH, Ht, and individual volume at each site are shown in Figure 2. Analyses of variance were performed on clones within each site for DBH, Ht, and individual volume (Table 3). There were highly significant differences between clones for all three growth traits in each site (p < 0.001). An exception was Ht at E2, which was still significant at p < 0.05. This result indicates that artificial selection based on genetic evaluation has the potential to improve the growth traits of Paulownia spp. at the clonal level.
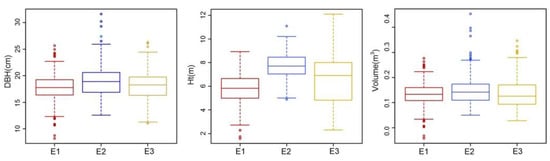
Figure 2.
Box plots of DBH, Ht, and volume for clones within each site. Data points are extreme values outside the range of 1.5 times the box length.
Table 3.
Analysis of variance of the growth traits of the clones within each site.
The joint ANOVA returned significant main effect for clones, sites, and blocks within sites for all three growth traits (p < 0.01). Significant clone–site interactions on DBH and individual volume (p < 0.05) and on Ht (p < 0.01) were observed (Table 4).
Table 4.
Multisite ANOVA for the growth traits of the clones.
3.2. Estimation of Genetic Parameters
The coefficients of genetic variation (CVg) and the coefficients of environmental variation (CVe) were higher for individual volume than for the other two traits at all sites. This trend was observable in single-site analyses and in the joint analysis of all three sites (Table 5). The values of CVg ranged from 4.44% to 11.34%, and those for CVe ranged from 11.81% to 30.30%. The clonal heritabilities for single sites (hf) ranged from 0.35 to 0.64, indicating that the three traits tested were under moderate genetic control, while individual heritabilities for single sites (hs) ranged from 0.07 to 0.30. The clonal heritabilities in the joint analysis (hj) ranged from 0.64 to 0.84, while the individual heritabilities returned by the joint analysis (hi) were lower, ranging from 0.14 to 0.23. The genetic accuracy of growth traits for single sites was 0.55–0.80, while the genetic accuracy returned by the joint analysis was 0.80–0.92.
Table 5.
Estimates of genetic parameters for DBH, Ht, and the individual volume of the clones at the three sites.
There were significant, positive genetic and phenotypic correlations with all three growth traits (Table 6). These correlations allow for indirect clonal selection on these variables, especially for individual volume. Pearson correlation coefficients between DBH and individual volume for genotype and phenotype were all > 0.93. DBH is easy to measure and is less affected by measurement errors than Ht or stem volume; thus, DBH can be used for direct clonal selection. We therefore used DBH as our reference trait in subsequent analyses for this paper.
Table 6.
Correlation coefficients among the traits of the Paulownia clones.
3.3. Relationships between BLUPs for DBH and Original DBH Values
Figure 3 shows the strong linear relationships between BLUPs for DBH and the original DBH values at each site (R2 ≥ 0.98). As a result, BLUPs were used in subsequent GGE biplot analyses and optimal genotype screening, which not only had high reliability but also resulted in greater genetic gain [22].
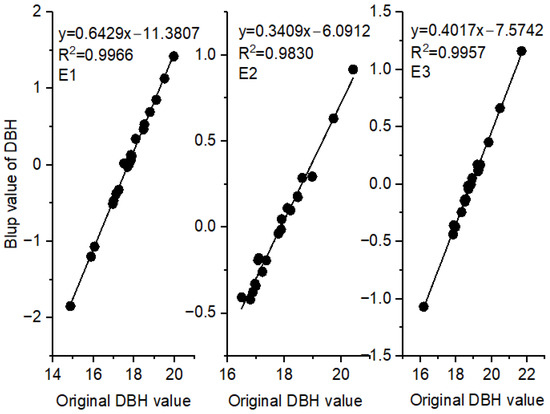
Figure 3.
Linear regressions between the original DBH values and the BLUPs of clones at the three sites.
3.4. GGE Biplot Analyses
The GGE biplots illustrated inter-site relationships in the multi-environment trial (Figure 4A). The biplot of DBH captured 94.59% of the total variation in G + G × E, indicating that the relationships were accurately displayed. The first principal component, which was related to the effects of G, explained 89.22% of the total variation. The second principal component, which represented the G × E interaction, explained 6.37% of the variation. The vector angles between the pairs of sites were all acute, indicating that the site values were positively correlated (Figure 4A). The correlation coefficient for sites E2 and E3 was close to 1.
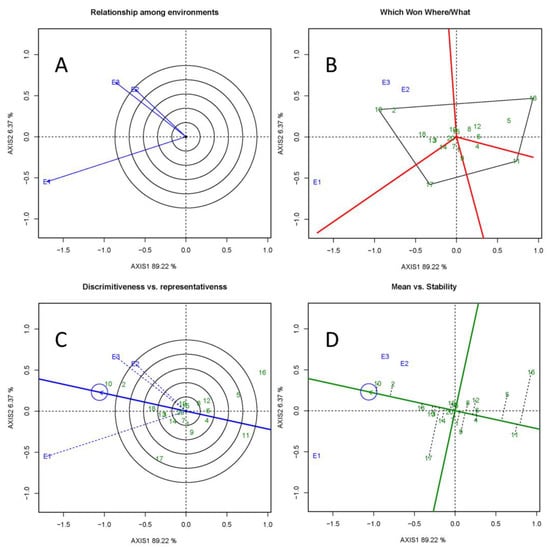
Figure 4.
The GGE biplot based on the BLUP values of DBH at three sites. (A) Site relationships with the environmental view of the GGE biplot. The genetic correlation coefficient between sites is estimated based on the cosine value of the angle between two site vectors. When the angle is less than 90°, the smaller the angle, the greater the correlation coefficient. (B) The Which Won Where/What view of the GGE biplot. Optimal genotypes into an irregular polygon were connected and perpendicular lines through each edge of the polygon to the origin were drawn. Tested sites were grouped. Red solid lines intersecting at the sides of the polygon represent mega-environments. (C) The discrimination and representative view of the GGE biplot. The blue solid line with an arrow passing through the origin represents the average environment axis. Dashed blue vectors represent the discrimination of the site. The longer the vector, the greater the discriminatory power. The angle between the dashed vector and the average environmental axis illustrates the degree to which a given site represents the average environment. (D) The mean and stability view of the GGE biplot. The vertical black dashed line segment represents the productivity and stability of each clone. Shorter dashed lines represent better adapted clones. The green solid line perpendicular to the average environment axis represents the mean population DBH. The farther away to the left of the average environment axis, the greater the values of DBH.
As shown in Figure 4B, the four clones (16, 17, 11, and 10) that were farthest from the origin were connected, and the polygon was divided into four sectors. The 20 clones tested were distributed within these sectors. The three sites occupied a single sector and were therefore grouped together. The clones located close to the top corner of the polygon were the highest-yielding clones in each environmental group [37]; thus, the optimal clone in this group (or among the three sites) was clone 10. As shown in Figure 4C, E1, E2, and E3 were all suitable for the tested clones. E3 is representative of the average environment at all sites, while E1 had the greatest discriminatory power. Clones 10, 2, 18, and 13 were optimal performers with both high productivity and stability according to Figure 4D.
3.5. Stability, Adaptability, and Productivity
Although the rank order of test genotypes varied among sites, the two top-ranked clones were the same at all three sites (see Table 7). Furthermore, clonal rankings based on the values of MHVG, PRVG, and MHPRGV were identical across these variables, and the two top-ranked clones were once again 10 and 2. Clones 10 and 2 therefore displayed stable performance, adaptability, and high yields at all three sites. Clones 18 and 13 were also of note for their ability to be cultivated in a wide range of environments, based on the criteria of 20% selection proportion and a selection intensity of 1.4.
Table 7.
Ranking of the 20 clones for each site and selection of the optimal genotypes based on DBH; genotypic stability (MHVG); genotypic adaptability (PRVG); and productivity, adaptability, and stability (MHPRVG).
3.6. Actual Gain and Genetic Gain
The actual gain (G) was greater than the genetic gain (ΔG) for all growth traits in the four top-ranked clones (Figure 5). Volume displayed the highest G and ΔG among the growth variables, with values of 23.74% and 14.46%, respectively.
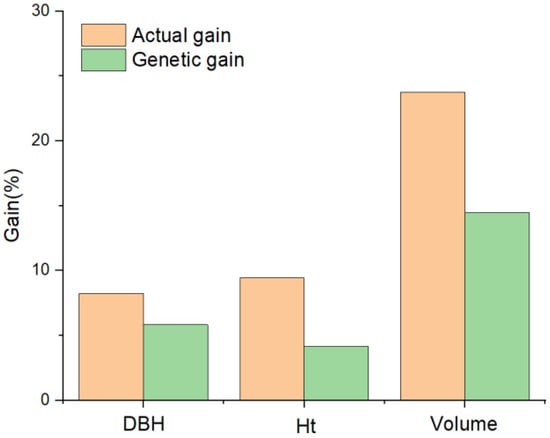
Figure 5.
Actual and genetic gains of growth traits under a selection intensity of 1.4.
4. Discussion
4.1. Variance among Sites and Clones
Site characteristics affect the performance of different genotypes through the combined effects of the soil and local climate [39]. Analysis of variance is an effective technique to evaluate the magnitude of differences among clones, and variation among populations is the basis for clonal breeding [40]. The coefficient of variation reflects the variability in each population and determines the selection space that is used to decide which clones to choose for breeding purposes [41]. In this study, we found significant differences in sources of variance (clone, site, and clone–site; p < 0.05) for all three growth traits measured in 7-year-old Paulownia clones. These results indicate that the measured variables are feasible criteria for clone selection.
In this study, sites E2 and E3 had warmer climates, higher rainfall, and longer frost-free periods than E1. The clones at site E1 were smaller for all three growth traits than those at E2 and E3, in accordance with the results of Houspanossian et al. [42] and Goldblum et al. [43]. Environmental differences among sites underpinned the differential performance of the clones in our study, indicating that the conditions at sites E2 and E3 were more suitable for the growth of the tested clones.
4.2. Genetic Parameters
The coefficient of environmental variation (CVe) for DBH and Ht obtained from the joint analysis ranged from 11.81% to 30.30%, demonstrating reasonable experimental precision. These results indicate that the model captured the majority of the variation in the study and that the estimates can be trusted [8]. These values are similar to those found by Zhao et al. [10]. However, the genotypic variation coefficient in this study seems to have been low compared to that reported by Shi et al. [44]. Restricted genetic variability among our 20 clones may have arisen because they were selected from 45 germplasm resources, which were collected and preserved at an early stage based on superior growth traits.
As one of the most important genetic parameters, heritability indicates significant genetic control and can reflect the reliability of selected genotypes [45]. A review of heritabilities in growth trait tests showed that the average heritabilities of DBH and height in forestry species were low, with values of 0.16 and 0.21, respectively [46]. We obtained comparable results for individual heritabilities at single sites (hs) (0.07–0.30). Higher values of heritability were observed for clonal heritability at single sites (hf) (0.30–0.64), indicating that superior clones could be identified from the 20 test clones. Some studies of natural populations reported higher heritabilities [47,48], suggesting that increasing the diversity of the breeding population may increase heritability and, consequently, increase the performance reliability of selected genotypes.
4.3. GGE Biplot and Selection of Optimal Clones
Because it is one of the major traits reflecting site quality, tree height has been selected as a representative variable for evaluating the adaptability and stability of forest growth [49]. DBH has also been selected as a representative trait under the same stand densities at the experimental sites when the production of large-diameter timber is a breeding objective [28,37]. In the present study, we used similar planting densities with 4 m × 5 m spacing between individual trees. Furthermore, there were significant positive genetic and phenotypic correlations between DBH and Ht and DBH and volume. Therefore, DBH was used as the target trait in GGE biplot analysis to select clones for fast growth, high yield, and stability. To reduce the influence of heterogeneous environmental errors or unbalanced data, and to improve selection accuracy [50,51], BLUPs were used to conduct GGE biplot analysis in this study. The BLUP values of DBH for the three sites showed good linear relationships with the original DBH values, making it possible to use BLUPs to replace original values in the GGE biplot analysis.
The biplot of DBH captured nearly 95% of the total variation in G + G × E, indicating that our results are reliable. The Which Won Where/What biplot grouped the three sites together in one sector, and clone 10 was located at the vertex of the sector, indicating that clone 10 had the largest DBH at the three sites. Clones located in the other biplot sectors were considered inadvisable for deployment at our experiment sites. However, some of these clones, especially 16, 11, and 17, which occupied the vertices of their respective sectors, might be well adapted to environments not represented in this study [21].
The discrimination vs. representativeness biplot showed positive correlations among the three sites, especially between E2 and E3. E1 had the greatest discriminatory power and representativeness, followed by E3 and E2. The mean vs. stability biplot is used to exhibit the productivity and stability of test clones in a visual comparison of their performance in different environments. An optimal clone should display both high yield and stability within the tested environments [52]. The DBH of clones 10, 2, 18, and 13 were the top four clones on the average environment axis, consistent with the ranking based on MHVG, PRVG, and MHPRVG. These four clones can therefore be selected as optimal genotypes with high productivity and stability. It is noteworthy that, although clone 17 showed mediocre performance in our analysis, it also had a long vector directed toward E1, implying that it had high adaptability in this experiment.
5. Conclusions
The 20 clones used in this study included five Paulownia species obtained through different breeding methods, which established a genetically diverse test population. Genotype, environment, and GEI significantly affected the values of key growth traits among these clones. DBH was positively correlated with Ht and volume, and the BLUPs of DBH for the three sites had strong linear relationships with the original DBH values. Clones 10, 2, 18, and 13 were the best-performing, most stable clones at all three sites, as shown in GGE biplots and MHVG, PRVG, and MHPRVG analyses. Our study points to a robust breeding strategy for the genus Paulownia and should play a significant role in increasing productivity of Paulownia and enhancing the incomes of plantation workers.
Author Contributions
Y.Z. and F.L. conceived and designed the project. Y.Z. and Y.F. performed the experiment. Y.Z. and C.Y. analyzed the data. Y.Z. and B.W. conceived the paper, wrote the first draft, and edited the manuscript. J.Q. and H.Z. participated in part of the environment. All authors have read and agreed to the published version of the manuscript.
Funding
This research was funded by the Fundamental Research Funds for the Central Non-profit Research Institution of Chinese Academy of Forestry, grant number CAFBB2020MA002 and Science and Technology Revitalize Forestry Project of Henan Province, grant number YLK202213.
Institutional Review Board Statement
Not applicable.
Informed Consent Statement
Not applicable.
Data Availability Statement
Data are available on request from the corresponding author.
Acknowledgments
The authors are thankful to Z.Q. Sun and P.F. Liu for their helpful comments on the manuscript.
Conflicts of Interest
The authors declare no conflict of interest.
References
- Feng, Y.Z.; Cui, L.J.; Zhao, Y.; Qiao, J.; Wang, B.P.; Yang, C.W.; Zhou, H.J.; Chang, D.L. Comprehensive selection of the wood properties of Paulownia clones grown in the Hilly Region of Southern China. BioResources 2020, 15, 1098–1111. [Google Scholar] [CrossRef]
- Latib, H.A.; Liat, L.C.; Ratnasingam, J.; Law, E.L.; Azim, A.A.A.; Mariapan, M.; Natkuncaran, J. Suitability of Paulownia wood from malaysia for furniture application. BioResources 2020, 15, 4727–4737. [Google Scholar] [CrossRef]
- Rodríguez-Seoanea, P.; Díaz-Reinosob, B.; Andr´es, M.; Herminia, D. Potential of Paulownia sp. for biorefinery. Ind. Crop Prod. 2020, 155, 112739. [Google Scholar] [CrossRef]
- Dzugan, M.; Miłek, M.; Grabek-Lejko, D.; Hęclik, J.; Jacek, B.; Litwinczuk, W. Antioxidant activity, polyphenolic profiles and antibacterial properties of leaf extract of various Paulownia spp. clones. Agronomy 2021, 11, 2001. [Google Scholar] [CrossRef]
- Jakubpwski, M. Cultivation potential and uses of Paulownia wood: A review. Forests 2022, 13, 668. [Google Scholar] [CrossRef]
- Borjia, L.E.M.; Garcia, M.E.; Antonio, F.; Morote, G.; Ramon, F.; Serrano, L.; Abellan, A.M.; Perea, C.D.; Barja, C.A.; Brja, C.A. El cultivo de Paulonia (Pawlonia elongata × fortunei) para la obtención de madera y biomasa en Castilla-La Mancha: Primeros resultados. Foresta 2010, 47, 103–110. [Google Scholar]
- Zuazo, V.H.D.; Bocanegra, J.A.J.; Torres, F.P.; Pleguezuelo, C.R.R.; Martínez, J.R.F. Biomass yield potential of Paulownia trees in a semi-arid Mediterranean environment (S Spain). Int. J. Renew. Energy Res. 2013, 3, 789–793. [Google Scholar]
- Barga, R.C.; Paludeto, Z.G.J.; Souza, M.B.; Aguiar, V.A.; Pollnow, M.F.M.; Carvalho, M.G.A.; Tambarussi, V.E. Genetic parameters and genotype × environment interaction in Pinus taeda clonal tests. For. Ecol. Manag. 2020, 474, 118342. [Google Scholar] [CrossRef]
- Kang, X.Y. Thinking about clonal breeding strategy of forest trees. J. Beijing For. Univ. 2019, 41, 1–9. [Google Scholar] [CrossRef]
- Zhao, Y.; Qiao, J.; Wang, B.P.; Feng, Y.Z.; Zhou, H.J.; Cui, L.J.; Wang, W.W.; Yang, D.G. Comprehensive selection of growth and stem form of superior Paulownia clones in the hilly region of southern China. J. Beijing For. Univ. 2017, 39, 32–40. [Google Scholar] [CrossRef]
- Feng, Y.Z.; Qiao, J.; Wang, B.P.; Zhao, Y.; Zhou, H.J.; Duan, W.; Li, F.D. Comprehensive selection of main phenotypic characters of Paulownia clones in the Hilly Area of Southern China. For. Res. 2017, 30, 969–976. [Google Scholar] [CrossRef]
- Burdon, R. Genetic correlation as a concept for studying genotype-environment interaction in forest tree breeding. Silvae Genet. 1977, 26, 168–175. [Google Scholar]
- Diao, S.; Hou, Y.M.; Xie, Y.H.; Sun, X.M. Age trends of genetic parameters, early selection and family by site interactions for growth traits in Larix kaempferi open-pollinated families. BMC Genet. 2016, 17, 104. [Google Scholar] [CrossRef] [PubMed]
- Wang, M.X. Selcetiong and assessment. In Forest Genetics and Breeding, 1st ed.; China Forestry Publishing House: Beijing, China, 2001; pp. 156–179. [Google Scholar]
- Wahid, N.; Rainville, A.; Lamhamedi, M.S.; Margolos, H.A.; Beaulieu, J.; Deblois, J. Genetic parameters and performance stability of white spruce somatic seedlings in clonal tests. For. Ecol. Manag. 2012, 270, 45–53. [Google Scholar] [CrossRef]
- Cheng, L.; Zhang, X.F.; Zhang, X.X.; Zhang, W.H.; Lin, Y.Z. Forestry multi-environment trial analysis based on BLUP and GGE biplot. J. Northwest A F Univ. (Nat. Sci. Ed.) 2018, 46, 87–93. [Google Scholar]
- Finlay, K.; Wilkinson, G.N. The analysis of adaptation in plant-breeding program. Aust. J. Agric. Res. 1963, 14, 742–754. [Google Scholar] [CrossRef]
- Cullis, B.R.; Jefferson, P.; Thompson, R.; Smith, B.A. Factor analytic and reduced animal models for the investigation of additive genotype-by-environment interaction in outcrossing plant species with application to a Pinus radiata breeding programme. Theor. Appl. Genet. 2014, 127, 2193–2210. [Google Scholar] [CrossRef]
- Yan, W.K. GGEbiplot—A windows application for graphical analysis of multienvironment trial data and other types of two-way data. Agron. J. 2001, 93, 1111–1118. [Google Scholar] [CrossRef]
- Xiao, Y.; Ma, W.J.; Lu, N.; Wang, Z.; Wang, N.; Zhai, W.J.; Kong, L.S.; Qu, G.Z.; Wang, Q.X.; Wang, J.H. Genetic variation of growth traits and genotype-by-environment interactions in clones of Catalpa bungei and Catalpa fargesii f. duclouxii. Forests 2019, 10, 57. [Google Scholar] [CrossRef]
- Zhou, M.M.; Chen, P.; Shang, X.L.; Yang, W.X.; Fang, S.Z. Genotype–environment interactions for tree growth and leaf phytochemical content of Cyclocarya paliurus (Batal.) Iljinskaja. Forests 2021, 12, 735. [Google Scholar] [CrossRef]
- Ling, J.J.; Xiao, Y.; Hu, J.W.; Wang, F.D.; Ouyang, F.Q.; Wang, J.H.; Weng, Y.H.; Zhang, H.G. Genotype by environment interaction analysis of growth of Picea koraiensis families at different sites using BLUP-GGE. New For. 2021, 52, 113–127. [Google Scholar] [CrossRef]
- Li, J.H. Genotype by environment interaction for growth traits of clones of Populus section Aigeiros based on BLUP and GGE Biplot. Sci. Silvae Sin. 2021, 57, 64–73. [Google Scholar] [CrossRef]
- Yan, W.K.; Hunt, L.A.; Sheng, Q.L.; Szlavnics, Z. Cultivar evaluation and mega-environment investigation based on the GGE biplot. Crop Sci. 2000, 40, 597–605. [Google Scholar] [CrossRef]
- Sun, X.M.; Yang, X.Y. Applications and analysis of methods for breeding value prediction in forest trees. J. Beijing For. Univ. 2011, 33, 65–71. [Google Scholar]
- Henderson, C.R. General flexibility of linear model techniques for sire evaluation. J. Dairy Sci. 1974, 57, 963–972. [Google Scholar] [CrossRef]
- Ouyang, F.Q.; Qi, S.X.; Fan, G.X.; Cai, Q.S.; Chen, H.Q.; Gao, W.L.; Hu, C.S.; Wang, J.H. Genetic variation and improved parents selection of open pollination families of Picea crassifolia Kom. basing one BLUP method. J. Nanjing For. Univ. (Nat. Sci. Ed.) 2019, 43, 53–59. [Google Scholar] [CrossRef]
- Zheng, C.H.; Zhang, H.J.; Wang, Y.Z.; Dai, J.F.; Dang, L.; Du, Z.C.; Liu, J.T.; Gao, Y.R. An analysis of a regional trial of Larix principis-rupprechtii families based on BLUP and GGE Biplot. Sci. Silvae Sin. 2019, 55, 73–83. [Google Scholar] [CrossRef]
- Lin, Y.Z. Research methodologies for genotype by environment interactions in forest trees and their applications. Sci. Silvae Sin. 2019, 55, 142–151. [Google Scholar] [CrossRef]
- Zhao, Y.; Feng, Y.Z.; Sun, P.; Wang, B.P.; Qiao, J.; Duan, W.; Zhang, J.J.; Zhou, H.J.; Yang, C.W. Responses of phytohormones, carbon and nitrogen status to the trunk-extension pruning in three-year-old Paulownia plantation. J. Anim. Plant Sci. 2021, 31, 450–458. [Google Scholar] [CrossRef]
- Wu, L.C.; Wang, B.P.; Qiao, J.; Zhou, H.J.; Wen, R.J.; Xue, J.L.; Li, Z.R. Effects of trunk-extension pruning at different intensities on the growth and trunk form of Paulownia fortune. For. Ecol. Manag. 2014, 327, 128–135. [Google Scholar] [CrossRef]
- Yuan, C.Z.; Zhang, Z.; Jin, G.Q.; Zheng, Y.; Zhou, Z.C.; Sun, L.S.; Tong, H.B. Genetic parameters and genotype by environment interactions influencing growth and productivity in Masson pine in east and central China. For. Ecol. Manag. 2021, 487, 118991. [Google Scholar] [CrossRef]
- Lambeth, C.; Endo, M.; Wright, J. Genetic analysis of 16 clonal trials of Eucalyptus grandis and comparisons with seedling checks. For. Sci. 1994, 40, 397–411. [Google Scholar]
- Yin, M.Y.; Guo, J.J.; Wang, C.S.; Zhao, Z.G.; Zeng, J. Genetic parameter estimates and genotype × environment interactions of growth and quality traits for Betula alnoides Buch.-Ham. ex D. Don in four provenance-family trials in southern China. Forests 2019, 10, 1036. [Google Scholar] [CrossRef]
- Frutos, E.; Galindo, M.P.; Leiva, V. An interactive biplot implementation in R for modeling genotype-by-environment interaction. Stoch. Environ. Res. Risk Assess. 2014, 28, 1629–1641. [Google Scholar] [CrossRef]
- Goncalves, C.M.G.; Ferreira-Gomes, L.R.; Lopes, A.C.A.; Vieira, J.M.F.P. Adaptability and yield stability of soybean genotypes by REML/BLUP and GGE Biplot. Crop Breed. Appl. Biotechnol. 2020, 20, e282920217. [Google Scholar] [CrossRef]
- Souza, M.B.; Freitas, M.L.M.; Sebbenn, M.A.; Gezan, A.S.; Zanatto, B.; Zulian, F.D.; Lopes, G.T.M.; Longui, L.E.; Guerrini, A.I.; Aguiar, V.A. Genotype-by-environment interaction in Corymbia citriodora (Hook.) K.D. Hill, & L.A.S. Johnson progeny test in Luiz Antonio, Brazil. For. Ecol. Manag. 2020, 460, 117855. [Google Scholar] [CrossRef]
- Hutu, I.; Oldenbroek, K.; Waaij, D.V.L. Chapter 9. Predicting response of selection. In Animal Breeding and Husbandry, 2nd ed.; Agroprint: Timisoara, Romania, 2020; pp. 309–338. [Google Scholar]
- Pliura, A.; Zhang, S.Y.; Mackay, J.; Bousquet, J. Genotypic variation in wood density and growth traits of poplar hybrids at four clonal trials. For. Ecol. Manag. 2007, 238, 92–106. [Google Scholar] [CrossRef]
- Kombi, K.D.; Liu, H.Z.; Zhao, X.Y. Estimation of genetic parameters and wood yield selection index in a clonal trial of Korean Pine (Pinus koraiensis) in Northeastern China. Sustainability 2021, 13, 4167. [Google Scholar] [CrossRef]
- Luechanimitchit, P.; Luangviriyasaeng, V.; Laosakul, S.; Pinyopusarerk, K.; Bush, D. Genetic parameter estimates for growth, stem-form and branching traits of Casuarina junghuhniana clones grown in Thailand. For. Ecol. Manag. 2017, 404, 251–257. [Google Scholar] [CrossRef]
- Houspanossian, J.; Kuppel, S.; Nosetto, M.; Bella, D.C.; Oricchio, P.; Barrucand, M.; Rusticucci, M.; Jobbagy, E. Long-lasting floods buffer the thermal regime of the Pampas. Theor. Appl. Climatol. 2018, 131, 111–120. [Google Scholar] [CrossRef]
- Goldblum, D.; Rigg, L. Tree growth response to climate change at the deciduous boreal forest ecotone, Ontario, Canada. Can. J. For. Res. 2005, 35, 2709–2718. [Google Scholar] [CrossRef]
- Shi, S.Z.; Ni, S.Q.; Zhu, C.; Cong, P.F.; Chen, D.L.; Wang, C.Q.; Xu, H.Z.; Bao, X.M. Comprehensive selection in cultural traits of polywood timber of Paulownia. J. Nanjing For. Univ. (Nat. Sci. Ed.) 1996, 20, 27–31. [Google Scholar]
- Barros, J.; Velasco, L.A.; Winkler, F.M. Heritability, genetic correlations and genotype by environment interactions in productive traits of the Caribbean scallop, Argopecten nucleus (Mollusca: Bivalvia). Aquaculture 2018, 488, 39–48. [Google Scholar] [CrossRef]
- Cornelius, J. Heritabilities and additive genetic coefficients of variation in forest trees. Can. J. For. Res. 1994, 24, 372–379. [Google Scholar] [CrossRef]
- Hung, T.D.; Brawner, J.T.; Lee, D.J.; Meder, R.; Dieters, M.J. Genetic variation in growth and wood-quality traits of Corymbia citriodora subsp. variegata across three sites in south-east Queensland, Australia. South. For. A J. For. Sci. 2016, 78, 225–239. [Google Scholar] [CrossRef]
- Dillon, S.K.; Brawner, J.T.; Meder, R.; Lee, D.J.; Southerton, S.G. Association genetics in Corymbia citriodora subsp. variegata identifies single nucleotide polymorphisms affecting wood growth and cellulosic pulp yield. New Phytol. 2012, 195, 596–608. [Google Scholar] [CrossRef]
- Wang, J.H.; Gu, W.C.; Li, B.; Guo, W.Y.; Xia, L.F. Study on selection of Alnus cremastogyne provenance/family-analysis of growth adaptation and genetic stability. Sci. Silvae Sin. 2000, 36, 59–66. [Google Scholar] [CrossRef]
- Liu, N.; Ding, C.J.; Li, B.; Ding, M.; Su, X.H.; Huang, Q.J. Analysis of the genotype interaction of four-year-old Populus euramericana using the BLUP-GGE technique. Forests 2021, 12, 1759. [Google Scholar] [CrossRef]
- Woyann, L.G.; Meira, D.; Matei, G.; Zdziarski, A.D.; Dallacorate, V.L.; Madella, A.L.; Benin, G. Selection indexes based on linear-bilinear models applied to soybean breeding. Agron. J. 2020, 112, 175–182. [Google Scholar] [CrossRef]
- Zhang, H.; Zhou, X.Y.; Gu, W.; Wang, L.D.; Li, W.; Gao, Y.K.; Wu, L.G.; Guo, X.W.; Tigabu, M.; Xia, D.; et al. Genetic stability of Larix olgensis provenances planted in different sites in northeast China. For. Ecol. Manag. 2021, 485, 118988. [Google Scholar] [CrossRef]
Publisher’s Note: MDPI stays neutral with regard to jurisdictional claims in published maps and institutional affiliations. |
© 2022 by the authors. Licensee MDPI, Basel, Switzerland. This article is an open access article distributed under the terms and conditions of the Creative Commons Attribution (CC BY) license (https://creativecommons.org/licenses/by/4.0/).