Abstract
Malus sieversii is a precious wild fruit tree resource, and its sustainable reproduction is of great significance to the conservation of wild fruit tree germplasm resources and the stability of wild fruit forest ecosystems. In recent years, the natural population number and area of distribution of the Malus sieversii have been declining due to pests, water limitations, and human activities. Root sprouts are a primary means of rejuvenation of the Malus sieversii. A reasonable spatial distribution pattern is conducive to the growth of Malus sieversii plants and the ecological restoration of wild fruit forest populations. However, the spatial distribution pattern of root sprouts still needs to be discovered, which constrains our understanding of the mechanisms underlying the damage and management of Malus sieversii. Therefore, this paper examines the study area of the Gilgalang River Malus sieversii forest in Gongliu County, Ili Valley, Xinjiang. The topographic data and high-resolution images were first obtained using ultra-low-altitude photogrammetry and total station measurement techniques, then spatial pattern analysis and standard deviation ellipse analysis were used to investigate the spatial distribution pattern of root sprouts, and, finally, the factors affecting the spatial distribution pattern of root sprouts were investigated by principal component analysis and grey correlation analysis. The results show that: (1) Under-canopy Malus sieversii root sprouts are clustered and randomly distributed along the root system, with the degree of clustering decreasing with increasing distance; (2) Spatial orientation and distance from the maternal plant are the main factor affecting the sprouting of Malus sieversii roots, explaining 73.69% of the total variance; (3) Under sediment accumulation and water erosion, the root sprouts under the canopy are mainly distributed in the downslope direction. The shape is similar to the “clover type”. The results of this study can provide a theoretical basis for conserving Malus sieversii germplasm resources and a solid scientific basis for the ecological restoration of plants under anthropogenic disturbance.
1. Introduction
The Malus sieversii, also known as the Xinjiang wild apple (Malus sieversii (Ledeb.) Roem.), is the original ancestor of the modern cultivated apple and an important material in apple breeding [1,2], and is a nationally endangered plant with great genetic, ecological, and developmental value. The Malus sieversii is distributed in the Tien Shan region of Central Asia, and in China, mainly in the IIi Valley of the Western Tien Shan in Xinjiang [3]. Disturbances such as excessive deforestation, pest effect, and grazing in recent decades have severely damaged the ecological environment of the Malus sieversii [4] and made natural regeneration extremely difficult, leading to a sharp reduction in the distribution area of the Malus sieversii in Gongliu and Xinyuan counties to one-third of its original size [5], accelerating the reduction of the genetic diversity of the Malus sieversii and posing a severe threat to the safety of germplasm resources. Most rare and endangered plants in their original habitats asexually reproduce to efficiently regenerate [6]; among asexual reproduction modes, root sprouting is among the most important. Understanding the ability of plant root sprouting and the spatial distribution of root sprouts can provide a basis for population regeneration and prediction [7]. However, there is little knowledge about the spatial distribution of the root sprouts of plants, which limits our understanding of the mechanism underlying damaged Malus sieversi ecological restoration and forest management [8,9].
Root sprouting has great significance to in vivo conservation or in situ protection of the Malus sieversii on a global scale [10]. Based on previous research, Zhang, C has established a multi-level conservation and preservation system for the core germplasm of the Malus sieversii in its native habitat, ex situ nursery conservation and in vitro conservation [11]. Cornille used gene flow measurements to study the extent and impact of the hybridization of domesticated apples in wild apple populations [12]. Luo, Q used spectroscopy to build a model for detecting pest levels and getting an accurate picture of the damage to Malus sieversii stands [13]. In addition, root sprouting is an important means of regeneration in traumatized Malus sieversii; the existing studies have mainly focused on root sprouting cultivation techniques [14] and sprouting driving factors [15]. The study of spatial distribution patterns benefits our understanding of the ecological processes of root sprouting and the interrelationship between root sprouting and habitat [16], but no one has studied it yet.
In micro-geomorphology research, scholars mainly use RTK to measure geomorphology [17,18] or measure mound morphology through surface morphology’s height and horizontal components [19], which are laborious and time-consuming methods. Low-altitude photogrammetry, where the object of study is small in volume and area, and the accuracy of measurement is correspondingly demanding [20,21], has been primarily applied in previous studies of biomass estimation [22] and the acquisition of high-precision near-ground aerial imagery [23]. This study uses low-altitude photogrammetry to acquire DOM images and calibrate tree quadrangles against RTK to obtain accurate topographic data efficiently. In recent years, the research on the spatial distribution of species has adopted chiefly the sampling method [24,25] and the no-sample plot method [26]. However, these methods have some flaws, particularly when several blocks have a large spacing between them [27]. The point spatial distribution pattern analysis method can make maximum use of the information contained in the coordinates graph [28], has a strong testing capacity, and has been widely used in the past 20 years to study the spatial distribution and correlation of plant populations [29,30] and the spatial distribution pattern of root sprouts [31]. This information inspired us to restore the Malus sieversii population, which can be achieved by creating a suitable growth environment for root sprouts. However, as a first step, we need to determine the spatial distribution pattern of root sprouts and the leading factors that influence the spatial distribution pattern of root sprouts.
The coastwise segment of the Gilgalang River in Gongli County, Xinjiang, is a typical distribution area for the Malus sieversii in China [32]. However, the local economy is mainly based on animal husbandry, tourism, and farming [33]. Frequent human activity has affected the Malus sieversii forest ecosystem to some extent, and there is an urgent need for research on the ecological conservation of the Malus sieversii. Therefore, this paper investigates the spatial distribution pattern of root sprouting and the factors influencing it, using spatial point pattern analysis and relational grade analysis, respectively, for Malus sieversii along the Gilgalang River on four slopes: east, west, south and north. The objectives of this study were: (1) Explore the main factors affecting root sprouting; (2) Study the spatial distribution pattern of root sprouts under the canopy of the Malus sieversii tree; (3) Analyse the causes of the spatial distribution pattern of root sprouts under the canopy. The research provides a scientific basis for the ecological restoration of the Malus sieversii forest and is essential for conserving the Malus sieversii.
2. Methodology
2.1. Study Site
The study area is in the Gilgalang River Dazhuolesay Gorge, Mohe Township, Gongliu County, Ili, Xinjiang. Geographical coordinates: longitude 82°43′–82°52″ E, latitude 43°10′–43°14″ N. The ditch is 4.5 km north–south and 1.1 km east–west, covering an area of 18,000 ha (Figure 1), and is a typical region of the distribution of the Malus sieversii forest in China [34]. The study area is dominated by low hills and mountains of the geomorphic type, with the terrain being high in the south and low in the north, sloping from east to west, with an elevation of 1100–1600 m. Northern temperate continental arid climate with an average annual temperature of 7.4 °C, a frost-free period of 145 days, 280 mm of precipitation and inverse temperature phenomenon in winter [35]. The study area has the most robust inversion layer cover and more stable climatic characteristics [34]. The soil is dark brown with a deep loess mother material [14]. The distribution of vegetation is characterized by a mixture of typical mountain steppes, meadow steppes, and wild fruit forests. The wild fruit forests are mainly found on shady and semi-shady slopes [36], with the understory forming a multi-level community structure of trees, shrubs and grasses [37].
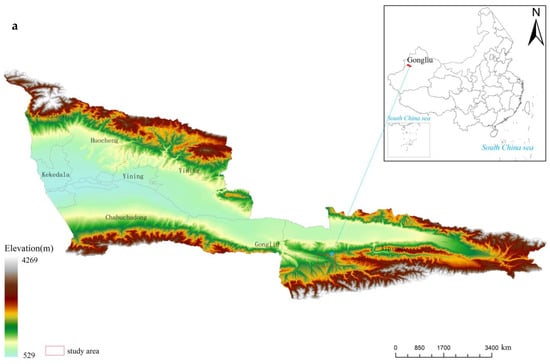
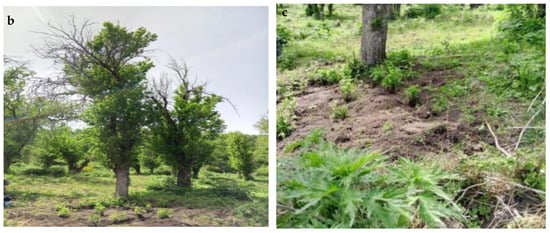
Figure 1.
The location of the study area and sampling points. (a) Locations of sampling sites; (b) General view of wild apple forests; (c) Distribution of Malus sieversii root sprouts under the tree canopy.
2.2. Investigation Method
2.2.1. Plot Setting
Four 10 × 10 m square samples, each with 1–5 trees, were selected using the random sample splitting tool in ArcGIS software, taking into account the habitat characteristics, distribution location and growth condition of the Malus sieversii in the study area (Figure 2). The four solstitial points were located and their precise positions were ascertained using a Leica TS06 prism-free total station. A DJI M600 Pro UAV was used to capture high-resolution CCD (Charge-Coupled Device) photos, and Agisoft PhotoScan software was used to create DOM (Digital Orthophoto Map) data, which was then validated against total station measurements.
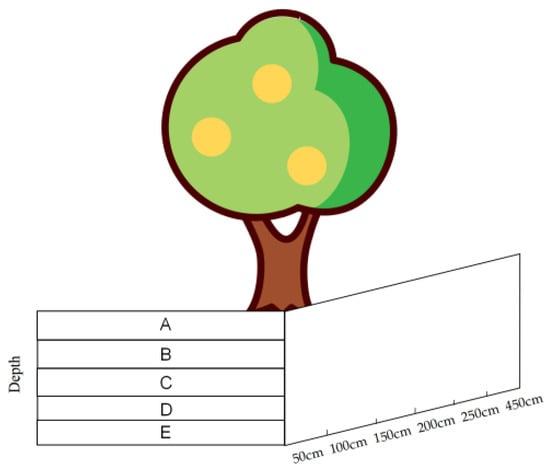
Figure 2.
Root survey sample. (A–E represent the depth of root burial in five profiles, respectively: <5 cm, 6–20 cm, 21–40 cm, 40–60 cm, and >60 cm.)
2.2.2. Root Survey
A systematic survey of the root distribution in four typical sample plots was carried out using the soil profile method. Dig one profile 0.5 m long and 1m deep in each of the four directions (east, west, south and north) at 0.5 m, 1 m, 1.5 m, 2.5 m and 4.5 m from the base of the trunk (20 profiles per tree in total). Each profile was divided into five layers and drew grid lines of 10 × 20 cm in size on the profiles. A statistic classification of the number of diameter of the root system within each profile was made based on size. A letter represents the depth of root burial in each of the five profiles (Figure 2): <5 cm, 6–20 cm, 21–40 cm, 40–60 cm and >60 cm, respectively. Counted the number of root sprouts in each profile.
2.2.3. Root Sprout Survey
Four typical sample plots were selected as standard plants for the survey, which was carried out using a variable diameter circular sample square, the sample square diameter of which depended on the crown. A custom polar coordinate system was established by the polar coordinate method, with the base of the tree as the origin and the direction of the plumb upslope line of the contour as the starting direction to record the location of the root sprouts. Remove the top layer of soil around the seedling (to a depth of 30 cm), expose the root system of the maternal plant, observe the attachment of the seedling to the root system, determine the origin of the seedling (root sprout, stump sprout, live) and measure the distance to the surface (depth of burial). Use a handheld thermometer to determine the land surface and subsurface temperatures at the root emergence site. Other Measurement data included the number of root emergences, root sprouts height, root sprouts thickness, root thickness at the emergence site (buried thickness), species of surrounding grasses, and grass height. Where: (1) The total number of root sprouts from the root system is the number of sprouts (pcs); (2) The height from the ground to the top shoot is recorded as the root sprout height (cm); (3) The thickness data at about 2 cm from the ground is counted as the sprout thickness (cm).
2.3. Research Methods
2.3.1. Spatial Clustering Pattern
The point pattern analysis function was used to analyze the spatial clustering patterns of traumatized Malus sieversii root sprouts in different slope orientations with the following mathematical model:
t denotes the spatial distance; A is the area of the flight domain; n is the number of points; is the distance from point i to j; is the indicator function; when ≤ t, = 1, > t, = 1; denotes the weight, which is the proportion of the circumference of the circle with point i as the center and radius in the area A [38,39].
The spatial correlation of the K function is used so that the k-value is L transformed and the distance is the expected value K. The result includes the expectancy value, the observed value, and the high confidence interval. The L function is calculated as follows:
L > 0, follow the aggregation distribution; L = 0, follow the random distribution; L < 0, follow the uniform distribution. Expected value > observed value indicates a high degree of dispersion; expected value < observed value indicates a high degree of aggregation.
2.3.2. Standard Deviation Ellipse
The standard deviation ellipse is an essential spatial econometric analysis tool used to measure elements’ spatial variation and distribution characteristics [40]. The main components are the center of gravity (center point), the angle of rotation θ, and the long semi-axis and the short semi-axis. The center of gravity represents the relative position of the spatial distribution of elements in the region. The size of the ellipse represents the degree of dispersion or aggregation of the spatial data, the long semi-axis of the ellipse represents the direction of the data distribution, and the short semi-axis represents the extent of the data distribution; the more significant the difference between the values of the long and short semi-axes, the more pronounced the directionality of the data [23,24].
Bringing Equation (4) into Equation (3) yields two standard deviation distances, where the maximum standard deviation distance is the length of the long axis of the ellipsoid, and the minimum distance is the length of the short axis of the ellipsoid, and is the angle of the direction of rotation of the coordinate system, representing the orientation of a point set.
2.3.3. Principal Component Analysis
The six indicators of root sprouting in Malus sieversii, direction, distance from the maternal plant, relative elevation, burial depth, root sprout diameter, and height, are expressed as Z1, Z2, Z3, Z4, Z5, and Z6, respectively. Principal component analysis was performed using SPSS 20.0 software. First, the original data is standardized. The eigenvalues, contribution rates, cumulative contribution rates, and eigenvectors are calculated, and the principal components with eigenvalues greater than one are extracted. Secondly, the principal component scores of each indicator were calculated based on the model formulae derived from the eigenvalues. Finally, the variance contribution ratio was used as the weights to derive the model formula for the composite score of each strain [41].
2.3.4. Grey Correlation Analysis
Grey correlation analysis is a systematic analysis method. It is used to measure the degree of association between factors based on the degree of similarity or dissimilarity of developments between them. The results of this method differ from ordinary quantitative statistical methods in that they require only a simple operation on a particular difference between the data. The correlation extent is only an external manifestation of the interaction between factors and their influence on each other. The calculation of the grey correlation includes the following data and steps: (1) Transforming the original data; (2) Calculating the correlation coefficient; (3) Finding the degree of association; (4) Calculating the spatial support degree; (5) Calculating the spatial trust degree [42].
3. Results and Analysis
3.1. The Spatial Distribution Characteristics of Root Sprouts
Functional analysis of the spatial distribution of Malus sieversii root sprouts revealed that aggregation and random distribution were characteristic of the spatial distribution of Malus sieversii root sprouts in typical sample plots of different slope orientations (Figure 3). Some of the observations in the four sample areas are greater than the high confidence interval, indicating that the distribution of root-sprouting seedlings of Malus sieversii is random and highly variable. When the observed value is smaller than expected, the spatial pattern type is discrete on the distance scale. The root sprouts in the range of 0–1.215 m in the eastward sample area, 0–0.85 m in the westward sample area, 0–0.612 m in the southward sample area, and 0–1.15 m in the northward sample area belong to a discrete distribution, while the root sprouts in other distance scales belong to an aggregated distribution (Figure 3). The distribution characteristics of the sample area result from long-term adaptation and selection of the biological characteristics of the Malus sieversii population by environmental conditions. As the Malus sieversii grows in mountainous slopes, the root sprouts are influenced by topographical conditions, resulting in an aggregated distribution over part of its range. If a maternal plant of the Malus sieversii and all the root sprouts under its canopy are considered a patch, the collection of all the small and large patches mosaic together constitutes the spatial distribution pattern of the Malus sieversii in the Gilgalang river basin. Aggregate patch distribution increases the chances of population survival by exerting a community effect against the invasion of alien species.
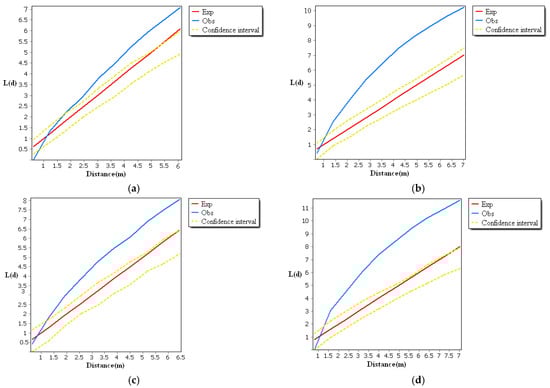
Figure 3.
Spatial point pattern of root sprouts of Malus sieversii, (a) Analysis of the spatial pattern of root sprouting points in a typical sample area of the eastern slope; (b) Analysis of the spatial pattern of root sprouting points in a typical sample area of the southern slope; (c) Analysis of the spatial pattern of root sprouting points in a typical sample area of the western slope; (d) Analysis of the spatial pattern of root sprouting points in a typical sample area of the northern slope.
In this study, the SDE (standard deviation ellipse) and mean-centrality parameters were calculated separately for the distribution of root-sprouting seedlings under the canopy of representative wild apple mother plants on different slopes of the mountain range using ArcGIS 10.3 (ESRI, Redlands, CA, USA), and the results are shown in Figure 4 and Table 1.
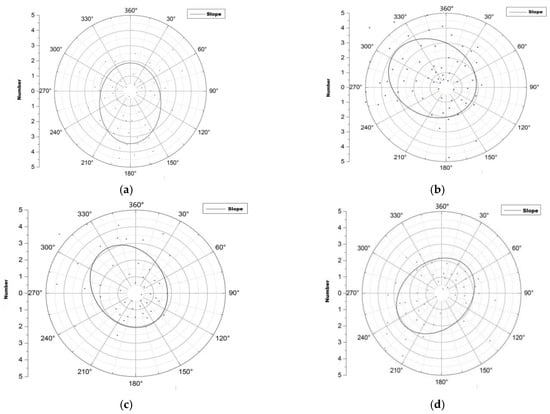
Figure 4.
Spatial distribution of root sprouts of Malus sieversii on different slopes. (a) Spatial distribution direction of eastern slope root sprouts; (b) Spatial distribution direction of western slope root sprouts; (c) Spatial distribution direction of western slope root sprouts; (d) Spatial distribution direction of northern slope root sprouts.

Table 1.
Spatial distribution patterns of root sprouts on samples with different slope orientations using standard deviation ellipses. CenterX and CenterY represent the center points of the ellipse. XstdDist and YStdDist represent the length of the X-axis and the length of the Y-axis. Rotation is the angle of the direction of the ellipse.
The distribution of the spatial pattern of root sprouts on the eastern slope of the Malus sieversii trees shows a North East–South West pattern with a rotation angle of 130.64° (Figure 4a). The spatial pattern of root sprouting on the western slope of the Malus sieversii plant shows a North West –South East pattern with a 1.21° angle of rotation (Figure 4b). On the south slope, the spatial distribution of the roots of Malus sieversii plants shows a North West–South East pattern, with a rotation angle of 152.86° (Figure 4c). On the north slope, the spatial distribution of the root sprouting pattern of Malus sieversii shows a North East–South West distribution pattern, with a rotation angle of 51.80° (Figure 4d). In the principal axis direction, the standard deviation of root distribution is 7.61 m on the eastern slope, 8.09 m on the western slope, 6.06 on the southern, slope and 7.86 on the northern slope, with a wide range of root distribution (Table 1). The standard distance difference between the long and short semi-axes indicates that the polarisation of root sprout distribution is more severe on the western and northern slopes than on the eastern and southern slopes (Table 1). The spatial distribution characteristics of sprouting root sprouts of Malus sieversii plants differ between slope directions but are mainly distributed in the downslope direction of the maternal plants (Figure 4).
3.2. Impact of Environmental Factors on Root Sprouts Distribution
The six factors affecting root sprouting (Spatial orientation, distance from the maternal plants, relative elevation, buried thickness, root sprout thickness, and root sprout height) were subjected to principal component analysis (PCA), and the correlation matrix among the parameters was calculated (Table 2). The statistical correlation coefficient matrix shows a strong positive correlation between the spatial orientation of root sprout distribution (hereafter referred to as ‘spatial orientation’) and root sprout depth and a strong negative correlation with distance. There is a negative correlation between distance and buried thickness. Relative elevation shows a strong positive correlation with root sprouting height and buried thickness, and root buried thickness and height have a strong positive correlation.
Table 2.
Root mutation parameter correlation coefficient matrix.
We calculated the eigenvalues, variance contribution, and cumulative variance contribution of each principal component and the loading matrix of each parameter (Table 3). As can be seen from Table 3, the first two principal components explain nearly 73.69% of the total variance, with an eigenvalue of 3.381 for the first principal component and 1.04 for the second principal component. According to the principle that the first m components with eigenvalues greater than one are selected as principal components, the first two principal components can be selected for analysis. The variance contribution of the 1st principal component was 56.35%, which had a strong positive correlation with direction, root sprouting depth, and root sprouting height (Table 4). This shows that the spatial orientation, buried thickness, and root sprout height are vital factors influencing root sprouting and may be related to relative elevations, because relative elevations determine the buried thickness of root sprouting. The Z1 negatively correlates with distance because the root sprouting rate decreases with increasing distance from the maternal plant. The Z2 contribution is lower than that of the Z1, which mainly reflects the growth condition of root sprouts. Thus the Z1 can genuinely reflect the sprouting conditions of root sprouts. The spatial orientation factor determines the germination conditions of root sprouts.
Table 3.
Eigenvalue and contribution rate.
Table 4.
Principal component load.
We conducted a spatial correlation analysis between the spatial distribution of root sprouts under the canopy of Malus sieversii and the sloping topography to explore the response mechanism of topographic elements to the cross-coupling of root sprout spatial distribution. Root sprouts are “clover-type” distribution on both sides of the parent plant and downhill due to the sub-canopy topography (Figure 5). The probability of root sprouting is lower in the upslope direction than in the downslope direction due to the deeper root burial and poorer root sprouting conditions. Root sprouts are mainly distributed in the downhill and flat slope directions of the canopy, (Table 5), 110°–150° and 210°–250° (custom polarized southern slope as an example). This area is the main direction of flow due to the influence of the Malus sieversii root platform. The platform slows down the muddy water flow so that the sediment carried by the water is mainly deposited here, forming two small alluvial fans in the shape of an “eight” on the microtopography. This microtopography increases the depth of root burial, increasing the difficulty of root sprouting and drastically reducing the number of root sprouts, causing the fragmentation of what should have been a fan-shaped distribution of root sprouts to become a “clover-type” distribution.
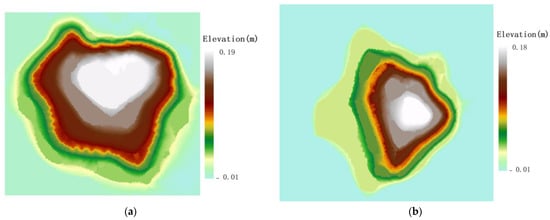
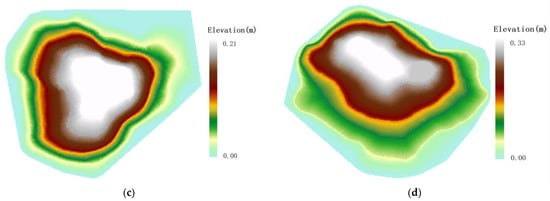
Figure 5.
Topographic distribution of Malus sieversii tree. (a) The Malus sieversii tree on the eastern slope; (b) The Malus sieversii tree on the western slope root sprouts; (c) The Malus sieversii tree on the southern slope; (d) The Malus sieversii tree on the northern slope.
Table 5.
Slope classification table of Malus sieversii on different hillsides under custom coordinate system.
Under the influence of the topography, the under-canopy root sprout of the Sevier apple tree is characterized by a “clover-type” distribution. According to (Figure 5), the downhill direction of Malus sieversii maternal plants has a significant height difference, the soil layer is thin, the soil erosion is relatively heavy, and the vegetation cover is relatively poor. Compared with other locations, root sprout is easier to germinate, and topography provides good environmental conditions for root sprout germination.
3.3. Spatial Correlation Analysis Study of Root Sprouting under the Tree Canopy
The root sprouts exhibited natural growth characteristics around the parent plant (Figure 1d). Spatial analysis algorithms at the global scale could not detect topographic correlations between root sprout distribution and topography. The application of association rule mining algorithms in a spatially heterogeneous environment can effectively obtain local distribution characteristics of spatial correlations [43]. Grey correlation analysis is widely used to quantify the degree of association between factors and has proven to be a feasible method [44]. Therefore, this paper uses grey correlation analysis to analyze the spatial distribution of root sprouts and topographic correlation characteristics.
The raster image of root sprouts under the tree canopy shows that there are more root sprouts in the downslope direction around the maternal plant, while the distribution of root sprouts in the rest of the area is scattered point (Figure 6a). A comparison of the (Figure 6b) shows that the greater the relative elevation value, the greater the degree of root exposure and the greater the number of root sprouts. Conversely, areas with negative relative elevations are less prone to root sprouting due to larger values of root burial depth (Figure 6b).
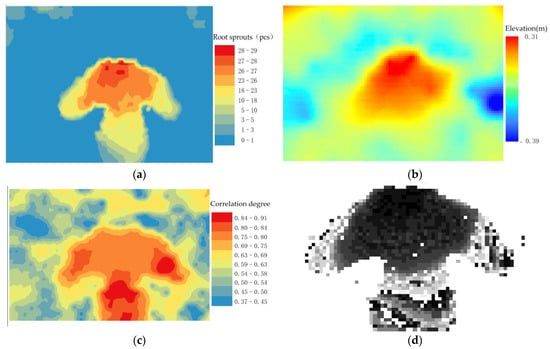
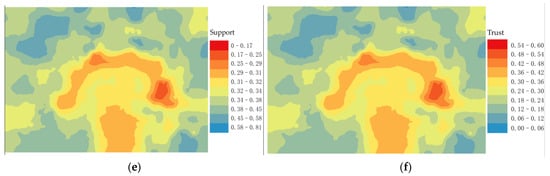
Figure 6.
Root sprout distribution, elevation and algorithm run processing results in the study area. (a) Distribution of root sprouts in the study area; (b) Elevation of the study area; (c) Event intensity distribution; (d) Positive case event distribution; (e) Spatial support; (f) Spatial trust.
The relative elevation within the sample area is the reference array, and the number of root sprouts within the sample area is used as the comparison array. The correlation coefficient between two series within each sample area is calculated separately. The spatial distribution of events of interest are extracted from (Figure 6a). For each spatial event, the strength of its spatial correlation with (Figure 6b) is calculated according to the formula, and the resulting correlation between the number of roots sprouting and the relative elevation (Figure 6c). For a pre-defined threshold event strength Q of 0.75, an association degree greater than 0.75 is said to be a positive example event.
On the contrary, it is called a counter-example event. We extracted the distribution location map of the positive example event (Figure 6d) from the association degree value (Figure 6c). According to the Equations, we have calculated the spatial support degree (Figure 6e) and spatial trust degree (Figure 6f).
Figure 6c shows that the sub-canopy root sprouts with a high degree of topographic association show a “clover-type” distribution around the maternal plant. The horizontal blades have a low relative elevation and more distribution of root sprouts, while the vertical blades are in depressions where roots sprout more easily under the influence of the topography. “Clover-type” shows two ribs on either side, with a few root sprouts distributed. Combined with the (Figure 6b), the ribs of the clover are thick, and the slow flow velocity when the water erodes the topographic profile makes the area form sedimentary geomorphology where root sprouts are not quickly sprouted. The distribution areas of spatial correlation between root sprouting and topography generally maintain a relatively stable “clover-type” distribution (Figure 6e,f). The correlation measurement index system is mainly composed of space support and space trust building, with both indicators calculated based on the spatial correlation intensity. However, (Figure 6e) can reflect the comprehensive characteristics of the space object set, and (Figure 6f) can reflect case characteristics and clearly expressed space relationship between the reference sequence and compare sequence.
4. Discussion
4.1. Spatial Distribution Characteristics of Root Sprouts in Malus sieversii
In stressful habitats, species such as Populus eubhratica, Quercus variabilis, and Emmenopterys henryi, known for their rootstock reproduction, can adjustment their morphology to adapt to their habitat [45,46,47]. As a result, species with a strong sprouting capacity can survive unfavorable situations of live regeneration [48,49]. Malus sieversii rootstock is significantly more vigorous than other apples, such as Northeastern Malus baccata (L.) Borkh, Malus prunifolia, and Malus robusta, and has a powerful ability to reproduce and renew [50]. The present study shows that the root sprouts under the crown of the Malus sieversii appear in clusters, mainly within 1.5 m from the trunk, with the furthest root sprouts occurring at 6.8 m from the trunk. The number of root sprouts decreases as the distance from the trunk increases. The reasons for this pattern of distribution may be: (1) Sufficient nutrients are available under the crown of the Malus sieversi, or (2) Root system development underground is limited by water and nutrients, resulting in root sprouts closer to the mother plant. The root sprouts of the Wild cherry plum have similar reproductive and distribution characteristics to those of the root sprouts of Malus sieversi, mainly within 0.2–1.6 m of the parent plant [51]. Numerous studies have shown that the natural and human environment influences the spatial distribution patterns of plant communities, and that the ecological characteristics reflected in different environments differ [52,53]. This study found that the root sprouts of Malus sieversii were usually centered at the base of the trunk of the parent tree and clustered radially along the root system, trending in the downslope direction of the parent plant. This result is consistent with Kong, X, who suggests that root emergence is closely related to its surroundings. It may be related to factors such as runoff erosion, soil thickness, and the buried depth of the root system.
4.2. Analysis of the Correlation between Root Sprouting Conditions and Topography in Malus sieversii
Topography is also essential in shaping species distribution [54,55]. Precipitation is the primary driver of slope runoff and sediment yield; the timing and intensity of rainfall play an essential role in the amount of runoff and soil loss [56]. Conditions such as land use type [57], soil erosion resistance [58], slope [59], and vegetation [60] all affect the timing and yield of runoff. Malus sieversii trees undulation of the surface formed by the iterative root system, through years of wind and rain function, a large amount of energy material accumulates on the side of the tree with a slight angle to the slope, forming a flatter terrace relative to the entire slope where the tree is located. This significant wind accumulation and rain combined landform type is called tree terrace [18]. The Malus sieversii tree platform’s spatial distribution pattern acting on root sprouts is influenced by water erosion and sediment accumulation. Locations with high vegetation coverage have a high erosion resistance and a significant interception effect on rainwater scour. Sediment continues to accumulate to the sides as it encounters the parent plant under the action of erosion by runoff. The lower the slope, the more stable the range of plant locations in the Malus sieversii.
In addition, the vegetation coverage is a combination of erosion and accumulation processes on the tree platform. The more substantial the erosion effect, the more difficult it is for species to take root and survive, and there is a consequent reduction in vegetation coverage. In the process of root sprouting, runoff in the downhill direction flows down the abrupt slope surface, the runoff scouring rate increases, the soil on the slope surface is continuously eroded, and the thickness of the soil layer decreases, which enhances favorable conditions for root sprouting. Zhao, W.Y. researched Populus euphratica and found that as the depth of burial increased, the root system continued to decrease, and the number of root sprouts subsequently decreased consistently with the findings of this study [61]. Thus, spatial orientation and relative elevation are essential factors influencing root sprouting in Malus sieversii.
4.3. Analysis of the Factors Influencing the Spatial Distribution of Root Sprouts in Malus sieversii
Different microtopographic units have different geomorphological and hydrological conditions, with marked differences in soil formation processes, moisture, and nutrients [62]. Different scales and disturbance frequencies could form different vegetation patterns and hydrological conditions [63]. Many studies have explored plants from a macroscopic perspective, believing that the higher the altitude, the lower the temperature, and the stronger the ultraviolet light, and the greater the environmental stress on plants. Hence, renewability is more potent at higher altitudes [64,65]. But for some species at lower altitudes, where anthropogenic disturbances are frequent, species rapidly choose root sprouting to occupy their original space and habitat resources, which is consistent with the study by Bellingham and Sparrow [66]. This suggests that altitude is not a decisive factor in root sprout germination. The researchers for this paper removed the weeds around the maternal plants during the sample-plot surveys, and it was clear that the higher, gentler ground had a thicker soil layer with fewer root sprouts. The lower topography and steeper positions with thinner soils have a higher number of root sprouts. It is presumed that areas of relatively low elevation, where the soil thickness is thin, are more prone to sprouting root sprouts. This paper collected basic data on the root sprouting of Malus sieversii in four sample areas, and a principal component analysis was carried out on six parameters affecting root sprouting. We found that the root sprouts were concentrated in the downslope direction, probably due to the thinner soil layer and more favorable soil temperatures on the downslope of the maternal plant [15]. A study by Shi, L.L in the Baishanzu Nature Reserve also concluded that light and water were important factors influencing the renewal of seedlings. Bare ridges on higher slopes are the most suitable for seedling survival, as they have relatively adequate light and a thin leaf litter layer [67]. In his investigation of the renewal of Robinia pseudoacacia on the Loess Plateau, Zhang C.Q. concluded that the mean soil water content on the downslope was higher, and that root sprouts spread the most extended distances and were most numerous in the lower direction of the shaded slopes [68]. In contrast, there was no significant correlation between root sprouting capacity and slope orientation in the study of Acer plants in the Changbai Mountain sample site [69]. This result may be related to the deeper soil thickness and less disturbance to the vegetation on the steeper slopes of the Changbai Mountains sample site.
4.4. Suggestions for Conservation and Management
The spatial distribution of root sprouts plays a vital role in recovering natural populations. The root sprouts of the Malus sieversii are mainly clustered around the maternal plant, providing an essential condition for population conservation. We should selectively adopt disturbance and carry out artificial thinning, which is conducive to the renewal and development of populations, and is of great significance to the conservation of wild fruit forest ecosystems and biodiversity in the Yii region. This study found that the spatial distribution pattern of root sprouts under the canopy of Malus sieversii in different slope directions resembled a “clover pattern”, but the scale of the study was limited. Based on the morphological characteristics of the spatial distribution of root sprouts in Malus sieversii, it is a future research direction to combine low-altitude photogrammetry and ground-penetrating radar technology to identify root sprouts under the tree canopy and analyze the spatial distribution pattern of root sprouts at a large scale. In addition, different environmental factors in different microhabitats will affect the community differently. The spatial distribution patterns of root sprouting and the influencing factors should be compared and analyzed in four habitats: below the tree crown, edge of the tree crown, forest gap, and open area at the forest edge. These can provide a solid theoretical basis for recovering Malus sieversii populations.
5. Conclusions
In this paper, we used close-range photogrammetry to obtain topographic data under the canopy of the Malus sieversii, explored the spatial distribution pattern of Malus sieversii root sprouts under the canopy, and analyzed the main factors affecting the spatial distribution pattern of root sprouts, to provide theoretical support for the ecological restoration of Malus sieversii forests. The results showed that:
- (1)
- Spatial orientation and distance from the maternal plant were decisive for root sprouting, explaining 73.686% of the total variance.
- (2)
- The spatial distribution of root sprouts under the canopy of the Malus sieversii is aggregated and random. It has a significant directional distribution (mainly on the downslope), with the most polarized distribution of root sprouts on the western and northern slopes.
- (3)
- The grey correlation was used to spatially correlate the sub-canopy root sprouting point data with relative elevation to verify the scientific validity of the “clover-type” and to illustrate the role of tree platform topography on the root sprouting distribution of Malus sieversii. This study is of great significance for the recovery of natural populations of the Malus sieversii and for predicting the future development of populations. This study fills a gap in vegetative propagation and ecological research on the root sprouting of Malus sieversii.
Author Contributions
Originated the idea, L.L. and X.Z.; participated in the design of the study, L.L., X.Z. and X.J.; performed the field work and data collection, L.L., X.J. and M.C.; analyzed the data, wrote the article, and edited the manuscript, L.L. and X.Z.; rechecked and revised the English version of the manuscript, M.C., L.L., X.Z. and X.J. All authors have read and agreed to the published version of the manuscript.
Funding
The research was support by [National Key Research and Development Program of China “Ecological method and health Regulations techniques of degraded Malus sieversii on the north slope of Tiansha Mountain”], grant no. [2016YFC0501500].
Data Availability Statement
The data are contained within the article, and all data sources are mentioned.
Conflicts of Interest
The authors declare no conflict of interest.
References
- Zhang, H.-X.; Li, X.-S.; Wang, J.-C.; Zhang, D.-Y. Insights into the aridification history of Central Asian Mountains and international conservation strategy from the endangered wild apple tree. J. Biogeogr. 2021, 48, 332–344. [Google Scholar] [CrossRef]
- Cornille, A.; Gladieux, P.; Smulders, M.J.M.; Roldán-Ruiz, I.; Laurens, F.; Le Cam, B.; Nersesyan, A.; Clavel, J.; Olonova, M.; Feugey, L.; et al. New Insight into the History of Domesticated Apple: Secondary Contribution of the European Wild Apple to the Genome of Cultivated Varieties. PLoS Genet. 2012, 8, e1002703. [Google Scholar] [CrossRef] [PubMed]
- Lin, P.J.; Liao, M.K. China’s precious Ili wild fruit forests in urgent need of conservation! Xinjiang For. 1986, 5, 30–31. [Google Scholar]
- Shan, Q.J.; Wang, Z.K.; Ling, H.B.; Zhang, G.P.; Yan, J.J.; Han, F.F. Unreasonable human disturbance shifts the positive effect of climate change on tree-ring growth of Malus sieversii in the origin area of world cultivated apples. J. Clean. Prod. 2021, 287, 125008. [Google Scholar] [CrossRef]
- Mierkamili, M.; Liu, Q.Z.; Ma, X.D.; Zhang, H.X.; Tian, Z.P. Suivival status, problems and conservation strategies of Malus sieversii. Guihaia 2021, 41, 2100–2109. [Google Scholar]
- Wang, L.; Sun, Q.W.; Hao, C.Y.; Tian, S.N.; Zhang, S.S.; Chen, Y.K.; Zhang, X.P. Point pattern analysis of different age–class Taxus chinensis var. mairei individuals in mountainous area of southern Anhui Province. Chin. J. Appl. Ecol. 2010, 21, 272–278. [Google Scholar]
- Zhang, Q.J.; Wang, Y.X. The study progress on natural regeneration strategies of Oplopanax elatus Nakai. Seed 2014, 33, 52–55. [Google Scholar]
- Xue, P.P.; Guo, L.J.; Wan, F.; Mao, X.T.; Xiao, Z.P.; Wu, Y.P.; Wang, B.Y.; Zeng, Y.; Fan, H.X. Comparison of the population characteristics of the root sprout and seedling of the endangered plant Emmenopterys henryi. J. Tianjin Norm. Univ. 2022, 42, 38–44. [Google Scholar]
- Zhang, T.; Song, L.N.; Zhu, J.J.; Wang, G.C.; Li, M.C.; Zheng, X.; Zhang, J.X. Spatial distribution of root systems of Pinus sylvestris var. mongolica trees with different ages in a semi-arid sandy region of Northeast China. For. Ecol. Manag. 2021, 483, 118776. [Google Scholar] [CrossRef]
- Hokanson, S.C.; Forsline, P.L.; McFerson, J.R.; Lamboy, W.F.; Aldwinckle, H.S.; Luby, J.J.; Djangaliev, A.D. Ex Situ and In Situ conservation strategies for wild Malus germplasm in Kazakhstan. Eucarpia Symp. Fruit Breed. Genet. 1998, 484, 85–91. [Google Scholar] [CrossRef]
- Zhang, C.Y.; Chen, X.S.; Zhang, Y.M.; Yuan, Z.H.; Liu, Z.C.; Wang, Y.L.; Lin, Q. A method for constructing core collection of Malus sieversii using molecular markers. Agric. Sci. China 2009, 8, 276–284. [Google Scholar] [CrossRef]
- Cornille, A.; Gladieux, P.; Giraud, T. Crop-to-wild gene flow and spatial genetic structure in the closest wild relatives of the cultivated apple. Evol. Appl. 2013, 6, 737–748. [Google Scholar] [CrossRef] [PubMed]
- Luo, Q.Q.; Huang, T.C.; Chen, S.J.; Chen, M.Y.; Jia, X.; Zhu, X.; Lai, F.B.; Wu, H.G.; Zhao, H.X.; Li, C.L.; et al. Quantitative evaluation on pest damage levels of Malus sieversii based on spectral reflectance. Jiangsu J. Agric. Sci. 2019, 35, 798–803. [Google Scholar] [CrossRef]
- Den, X. Study on Cultivation Techniques of Malus sievesii Suckers. Master’s Thesis, Xinjiang Agricultural University, Urumqi, China, 2020. [Google Scholar]
- Li, L.; Chen, S.J.; Chen, M.Y.; Zhu, X.; Lai, F.B. Environmental driving force of stool shoot quantitative features of Malus sieversii (Ldb.) Roem in Xiaomohe valley. Ecol. Sci. 2019, 38, 18–24. [Google Scholar]
- Wei, S.G.; Li, L.; Xu, R.; Huang, Z.L.; Cao, H.L. Spatial Pattern and Interspecific Relationship of Dominant Species in Plant Community in Jinggang Mountain. J. Trop. Subtrop. Bot. 2015, 23, 74–80. [Google Scholar]
- Zhang, Z.H.; Lai, F.B.; Chen, S.J.; Sun, H. Tree-Dimensional Shape Characteristics and Spatial Auto-Correlationship of Pop-ulus eu phratica Dune in the Sparse Forest Sandy Land on the West of Hotan River. Res. Soil Water Conserv. 2015, 22, 137–142+149. [Google Scholar]
- Xu, S.W.; Lai, F.B.; Chen, M.Y.; Zhu, X.; Li, H.J.; Chen, S.J.; Huang, T.C.; Jia, X. Morphological characteristics and its clinal variation of the tree platform of Malus sieversii. Arid. Land Geogr. 2019, 42, 305–313. [Google Scholar]
- Tengberg, A.; Chen, D. A comparative analysis of nebkhas in central Tunisia and northern Burkina Faso. Geomorphology 1998, 22, 181–192. [Google Scholar] [CrossRef]
- Fraser, C.S.; Cronk, S. A hybrid measurement approach for close-range photogrammetry. ISPRS J. Photogramm. Remote Sens. 2009, 64, 328–333. [Google Scholar] [CrossRef]
- Gonçalves, J.; Henriques, R.; Alves, P.; Sousa-Silva, R.; Monteiro, A.T.; Lomba, Â.; Marcos, B.; Honrado, J. Evaluating an unmanned aerial vehicle-based approach for assessing habitat extent and condition in fine-scale early successional mountain mosaics. Appl. Veg. Sci. 2016, 19, 132–146. [Google Scholar] [CrossRef]
- Bendig, J.; Yu, K.; Aasen, H.; Bolten, A.; Bennertz, S.; Broscheit, J.; Gnyp, M.L.; Bareth, G. Combining UAV-based plant height from crop surface models, visible, and near infrared vegetation indices for biomass monitoring in barley. Int. J. Appl. Earth Obs. Geoinf. 2015, 39, 79–87. [Google Scholar] [CrossRef]
- Wu, J.; Wang, P.; Wang, J.; Wu, X.H.; Su, X.H. Low Altitude Photogrammetry of Sea Islands and Reefs without Ground Con-trol Points: Research and Application. J. Yangtze River Sci. Res. Inst. 2022, 39, 133–137. [Google Scholar]
- Martens, S.N.; Breshears, D.D.; Meyer, C.W. Spatial distributions of understory light along the grassland/forest continuum: Effects of cover, height, and spatial pattern of tree canopies. Ecol. Model. 2000, 126, 79–93. [Google Scholar] [CrossRef]
- Greig-Smith, P. Quantitative Plant Ecology, 3rd ed.; Blackwell Science Publications: Oxford, UK, 1983. [Google Scholar]
- Pielou, E.C. An Introduction to Mathematical Ecology; Wiley-Interscience: New York, NY, USA; London, UK, 1969. [Google Scholar]
- Peng, S.L. South Asia Tropical Forest Communit Dynamics; Science Press: Beijing, China, 1996. [Google Scholar]
- Zhang, J.T. Analysis of spatial point patiern for plant species. J. Plant Ecol. 1998, 22, 344–349. [Google Scholar]
- Velázquez, E.; Martínez, I.; Getzin, S.; Moloney, K.A.; Wiegand, T. An evaluation of the state of spatial point pattern analysis in ecology. Ecography 2016, 39, 1042–1055. [Google Scholar] [CrossRef]
- Muvengwi, J.; Mbiba, M.; Chikumbindi, J.; Ndagurwa, H.G.; Mureva, A. Population structure and spatial point-pattern analysis of a mono stand of Acacia polyacantha along a catena in a savanna ecosystem. For. Ecol. Manag. 2018, 409, 499–508. [Google Scholar] [CrossRef]
- Kong, X. Study on Root Sprouting Characteristics and Driving Factors of Populus euphratica in the Birkum. Master’s Thesis, Xinjiang Normal University, Urumqi, China, 2021. [Google Scholar]
- Yang, X.P.; Wang, H.O.; Jiang, L.L.; Zhou, L.; Wang, J. Age Structure Analysis of Different Malus sieversii Population in Yili Areas. Mol. Plant Breed. 2021, 19, 4133–4141. [Google Scholar]
- Yu, S.S.; Zhao, W.X.; Yao, Y.X.; Tan, W.Q.; Yan, W.; Song, W.W. Investigation of habitat conditions of wild apples in Xinjiang. In Proceedings of the 2019 Annual Academic Conference and 90th Anniversary Conference of the Chinese Society of Horti-cultural Science, Zhengzhou, China, 21 October 2019. [Google Scholar]
- Huang, T.C. Withered Branches Grade Monitoring in Malus sieversii Forest Using Hyperspectral Data. Ph.D. Thesis, Beijing Forestry University, Beijing, China, 2021. [Google Scholar]
- Wang, P.J.; Zhang, H.F.; Tian, X.; Zhang, J.L.; Zhu, Y.L. Estimation of Forest Stem Volume of Natural Forests based on the Optimization of Active and Passive Remote Sensing Features. Remote Sens. Technol. Appl. 2022, 37, 672–680. [Google Scholar]
- She, D.Y. Formation Conditions, Process and Characteristics of Soil in Ili Wild Fruit Forest. Chin. J. Soil Sci. 1995, 26, 260–263. [Google Scholar]
- Liu, L.C.; Pai, Z.L.; Xu, J.H. The formation characteristics and taxonomic classification of the soil under the wild-frult forests in Yil valley, Xinjiang. Arid. Land Geogr. 1997, 20, 34–40. [Google Scholar]
- Salas, C.; LeMay, V.; Núñez, P.; Pacheco, P.; Espinosa, A. Spatial patterns in an old-growth Nothofagus obliqua forest in south-central Chile. For. Ecol. Manag. 2006, 231, 38–46. [Google Scholar] [CrossRef]
- Guo, K.; Yuan, Y. Research on Spatial and Temporal Evolution Trends and Driving Factors of Green Residences in China Based on Weighted Standard Deviational Ellipse and Panel Tobit Model. Appl. Sci. 2022, 12, 8788. [Google Scholar] [CrossRef]
- Zhang, C.; Luo, L.; Xu, W.; Ledwith, V. Use of local Moran’s I and GIS to identify pollution hotspots of Pb in urban soils of Galway, Ireland. Sci. Total Environ. 2008, 389, 212–221. [Google Scholar] [CrossRef] [PubMed]
- Min, Z.Q.; Wu, B.G.; Su, X.H.; Chen, Y.L.; Tian, Y.Z. Suitability Evaluation and Dominant Function Model for Multifunctional Forest Management. Forests 2020, 12, 1368. [Google Scholar] [CrossRef]
- Gao, R.; Ai, N.; Liu, G.; Liu, C.; Qiang, F.; Zhang, Z.; Xiang, T.; Zang, K. The Coupling Relationship between Herb Communities and Soil in a Coal Mine Reclamation Area after Different Years of Restoration. Forests 2022, 13, 1481. [Google Scholar] [CrossRef]
- Liu, Z.Y.; Wang, Y.S.; Luo, P.Z.; He, G.X. Coupling relationships between plant diversity and soil characteristics in rocky desertification areas of western Hunan. J. For. Environ. 2021, 41, 471–477. [Google Scholar]
- Yan, Y.; L, Y.G.; Sun, M.H.; Wu, Z.H. Primary Pollutants and Air Quality Analysis for Urban Air in China: Evidence from Shanghai. Sustainability 2019, 11, 2319. [Google Scholar] [CrossRef]
- Wang, Z.K.; Jiao, A.Y.; Ling, H.B.; Shan, Q.J.; Wang, W.Q. Characteristics of Populus euphratica root under various irrigation modes. Arid. Zone Res. 2022, 39, 1133–1142. [Google Scholar] [CrossRef]
- Valbuena-Carabaña, M.; Gil, L. Genetic resilience in a historically profited root sprouting oak (Quercus pyrenaica Willd.) at its southern boundary. Tree Genet. Genomes 2013, 9, 1129–1142. [Google Scholar] [CrossRef]
- Guo, L.J.; Shao, X.H.; Xue, P.P.; Tian, Y.Q.; Xiao, Z.P.; Wu, Y.P. Root sprouting ability and growth dynamics of the rootsuckers of Emmenopterys henryi, a rare and endangered plant endemic to China. For. Ecol. Manag. 2017, 389, 35–45. [Google Scholar] [CrossRef]
- Bartušková, A.; Filartiga, A.L.; Herben, T.; Qian, J.; Klimešová, J. Comparative analysis of root sprouting and its vigour in temperate herbs: Anatomical correlates and environmental predictors. Ann. Bot. 2021, 127, 931–941. [Google Scholar] [CrossRef] [PubMed]
- Shi, J.; Ye, X.H.; Chen, F.; Yang, Q.; Li, Z.Y.; Fang, K.; Yang, G.Y. Adaptation of bamboo to hetergenerous habital: Pheno-typic plasticity. Acta Ecol. Sin. 2014, 34, 5687–5695. [Google Scholar]
- CHEN, R.; WANG, H.N.; JIANG, Y.M.; WEI, S.H.; CHEN, Q.; GE, S.F. Rhizosphere Soil Microbial Quantity and Enzyme Ac-tivity of Different Apple Rootstocks. Chin. Agric. Sci. 2012, 45, 2099–2106. [Google Scholar]
- Li, H.B.; Liu, Y.; Taxmamat, M.; Zhao, Y.; Lv, D.K. Natural distribution characteristics of endangered wild cherry plum seed-lings in Xinjiang. Xinjiang Agric. Sci. 2013, 9, 1612–1619. [Google Scholar]
- Lin, Y.-C.; Chang, L.-W.; Yang, K.-C.; Wang, H.-H.; Sun, I.-F. Point patterns of tree distribution determined by habitat heterogeneity and dispersal limitation. Oecologia 2010, 165, 175–184. [Google Scholar] [CrossRef]
- Ta, F.; Liu, X.-D.; Liu, R.-H.; Zhao, W.-J.; Jing-Zhong, Z.; Wen-Mao, J.; Wu, X.-R.; Zhao, J.-Z.; Ma, X.-E. Spatial distribution patterns and association of Picea crassifolia population in Dayekou Basin of Qilian Mountains, northwestern China. Chin. J. Plant Ecol. 2020, 44, 1172–1183. [Google Scholar] [CrossRef]
- Wang, Q.G.; Punchi-Manage, R.; Lu, Z.J.; Franklin, S.; Wang, Z.H.; Li, Y.Q.; Chi, X.L.; Bao, D.C.; Guo, Y.L.; Lu, J.; et al. Effects of topography on structuring species assemblages in a subtropical forest. J. Plant Ecol. 2017, 10, 440–449. [Google Scholar] [CrossRef]
- Wang, Q.G.; Xu, Y.Z.; Lu, Z.J.; Bao, D.C.; Guo, Y.L.; Lu, J.M.; Zhang, K.H.; Liu, H.B.; Meng, H.J.; Qiao, X.J.; et al. Disentangling the effects of topography and space on the distributions of dominant species in a subtropical forest. Chin. Sci. Bull. 2014, 59, 5113–5122. [Google Scholar] [CrossRef]
- Sun, R.X.; Ma, L.; Zhang, S.H.; Yu, Y.; Shen, M.S.; Zhang, H.B.; Wang, D.D.; Yang, Y.B.; Zhang, J.N.; Zhang, Y.Z.; et al. Study on Landscape Patches Influencing Hillslope Erosion Processes and Flow Hydrodynamics in the Loess Plateau of Western Shanxi Province, China. Water 2020, 12, 3201. [Google Scholar] [CrossRef]
- Rafiee, F.; Ejtehadi, H.; Farzam, M.; Zare, H.; Bashirzadeh, M. Changes in plant biodiversity facets of rocky outcrops and their surrounding rangelands across precipitation and soil gradients. Sci. Rep. 2022, 12, 12518. [Google Scholar] [CrossRef]
- Palacios-Cabrera, T.; Valdes-Abellan, J.; Jodar-Abellan, A.; Rodrigo-Comino, J. Land-use changes and precipitation cycles to understand hydrodynamic responses in semiarid Mediterranean karstic watersheds. Sci. Total. Environ. 2022, 819, 153182. [Google Scholar] [CrossRef] [PubMed]
- Fu, X.T.; Zhang, L.P.; Wang, Y. Effect of Slope Length and Rainfall Intensity on Runoff and Erosion Conversion from Laboratory to Field. Water Resour. 2019, 46, 530–541. [Google Scholar] [CrossRef]
- Pan, D.; Gao, X.; Dyck, M.; Song, Y.; Wu, P.; Zhao, X. Dynamics of runoff and sediment trapping performance of vegetative filter strips: Run-on experiments and modeling. Sci. Total Environ. 2017, 593–594, 54–64. [Google Scholar] [CrossRef]
- Zhao, W.Y.; Chen, Y.N.; Zhou, H.H.; Zhou, X.M.; Wang, X.P. Reproductive ability and relative environment factors of de-graded Populus euphratica forest in ecological water delivery project ai tlwer reaches of Tarim River. J. Desert Res. 2009, 29, 108–113. [Google Scholar]
- Nagamatsu, D.; Miura, O. Soil disturbance regime in relation to micro-scale landforms and its effects on vegetation structure in a hilly area in Japan. Plant Ecol. 1997, 133, 191–200. [Google Scholar] [CrossRef]
- McEwan, R.W.; Lin, Y.-C.; Sun, I.-F.; Hsieh, C.-F.; Su, S.-H.; Chang, L.-W.; Song, G.-Z.M.; Wang, H.-H.; Hwong, J.-L.; Lin, K.-C.; et al. Topographic and biotic regulation of aboveground carbon storage in subtropical broad-leaved forests of Taiwan. For. Ecol. Manag. 2011, 262, 1817–1825. [Google Scholar] [CrossRef]
- Hu, X.H.; Ren, Y.L.; Zhang, Y.X. Morphological variation of lithocarpus glaber seeds in evergreen broadleaved forest at tis different succession stages in Gutian Mountain. Chin. J. Ecol. 2012, 31, 2449–2454. [Google Scholar]
- Hoyle, G.L.; Venn, S.; Steadman, K.; Good, R.B.; McAuliffe, E.J.; Williams, E.R.; Nicotra, A. Soil warming increases plant species richness but decreases germination from the alpine soil seed bank. Glob. Chang. Biol. 2013, 19, 1549–1561. [Google Scholar] [CrossRef]
- Bellingham, P.J.; Sparrow, A.D. Multi-stemmed trees in montane rain forests: Their frequency and demography in relation to elevation, soil nutrients and disturbance. J. Ecol. 2009, 97, 472–483. [Google Scholar] [CrossRef]
- Shi, L.L.; Luo, Z.R.; Xia, J.T.; Zhao, W.J.; Wu, G.Y.; Ding, B.Y. Woody seedling dynamics and the correlation between habitat and regeneration / mortality in a subtropical evergreen broad-leaved forest in China. Acta Ecol. Sin. 2014, 34, 6510–6518. [Google Scholar]
- Zhang, C.Q.; Zhang, W.H. A study on asexual reproduction and regeneration of Robinia pseudoacacia plantations in different habitats in Hilly Area of the Loess Plateau. J. Northwest A F Univ. 2009, 37, 135–144. [Google Scholar]
- Ye, J.; Hao, Z.Q.; Wang, X.G.; Bai, X.J.; Xing, D.L.; Yuan, Z.Q. Local-scale drivers of multi-stemmed tree formation in Acer, in a temperate forest of Northeast China. Chin. Sci. Bull. 2014, 59, 320–325. [Google Scholar] [CrossRef]


Publisher’s Note: MDPI stays neutral with regard to jurisdictional claims in published maps and institutional affiliations. |
© 2022 by the authors. Licensee MDPI, Basel, Switzerland. This article is an open access article distributed under the terms and conditions of the Creative Commons Attribution (CC BY) license (https://creativecommons.org/licenses/by/4.0/).