Abstract
Understanding the properties of wildfire-disrupted catchments is crucial for managing river floods and landslide risks. Using a hydrophone, we investigated the changes in sediment supply conditions in small mountainous catchments (30.8 ha) in southern Korea for 6 years (March 2014–December 2019). Bedload transport rates mostly increased in burned catchments 1–2 years post-wildfire (early post-fire sediment regime) but decreased 3 years post-wildfire owing to the coverage of burned slopes (late post-fire sediment regime). Landslides triggered 5 years post-wildfire increased the bedload transport rates by approximately one order of magnitude (post-landslide sediment regime). Although sediment activity decreased in wildfire-disturbed catchments after recovery of the ground-cover layer 1–3 years post-fire, thy increased during events such as landslides. Furthermore, even in undisturbed mountainous catchments (139.7 ha), bedload transport rates increased after intense rainstorm events (≥100.0 mm), with this change lasting for approximately 2 years. Our observations showed that the forest restoration after a wildfire should be planned and implemented from a min- to long-term perspective. In addition, during rainstorms, the relationship between flow and bedload transport showed large variability even in undisturbed catchments. Furthermore, surrogate monitoring using a hydrophone was useful in understanding the changes in bedload transport characteristics according to various supply conditions of the catchment.
1. Introduction
Wildfire-induced disturbances in vegetation, soil, and hydrological systems accelerate changes in geomorphic processes [1]. For example, the loss of ground-cover plants due to fire and the consecutive development of a water-repellent layer reduce soil infiltration and increase slope erosion through a surface flow [2,3,4,5]. Furthermore, decreased soil cohesion due to the withering of damaged trees and the accumulation of soil and fire debris on hillslopes and channels after a fire can trigger landslides and debris flow with the increasing magnitude of rainfall [6,7,8,9,10,11]. Therefore, abrupt changes in landforms caused by fires can increase river material transport by several orders of magnitude during subsequent rainstorm events, threatening the safety of downstream residential areas [4,12,13,14,15,16,17,18]. Therefore, observing these geomorphic changes after a wildfire and understanding their properties is crucial for the effective management of catchment floods and landslide risks [19].
In South Korea, wildfires have been increasing in number and size owing to the effects of climate change, such as abnormally high temperatures and biased precipitation [20]. Wildfires in South Korea occur frequently before the summer rainy season (June–September), which is dominated by floods and typhoons [21]. Consequently, during the rainy season, rainstorms on fire-affected slopes cause heavy erosion, resulting in the release of large amounts of soil and fire debris downstream [22]. Therefore, the government treats wildfires and the resulting soil discharges as natural disasters that must be managed at the national level. A representative response strategy is to delay and reduce the sediment pulse transmitted downstream in the event of a flood by applying structural measures, such as debris barriers and bed sills to burned mountains. However, appropriately addressing the sediment supply conditions in the fire-affected catchments is necessary to ensure that these engineering approaches are successful [13,19,23,24,25,26,27]. In this regard, sediment observation can reduce uncertainty in recovery strategies by providing quantitative information on the sediment transport process of the catchment [28,29,30,31,32].
Over the past five decades, many researchers have observed an increase in sediment transport rate in disturbed mountain areas after fires at various spatial (slope, channel, and catchment area units) and temporal (ranging from years to more than decades) scales [27]. However, recent studies have mainly explained soil dynamics after a fire through the production and delivery of fine-grained soil (i.e., suspended load) [18]. Few studies have observed the effect of wildfire on coarse-grained soil (i.e., bedload) [13,14,16,33]. This may be because of the larger quantitative proportion of suspended load compared with that of bedload in fluvial transport immediately after a fire [16,33]. Additionally, clear differences can be observed by comparing the altered proportion of suspended load in an area before the fire (or a noncomparative area) and the area after the fire [14,25]. Moreover, in the case of bedload monitoring using the direct method (e.g., bedload traps and samplers), the small share of bedload data in sediment observations after fires has been attributed to the limited evaluation of large floods or high-concentration transport [34,35]
Over the past several decades, attempts have been made to measure bedload transport in mountain gravel-bed rivers using acoustic surrogate monitoring technology (e.g., Japanese pipe hydrophone and Swiss impact plate geophone) [36]. Mizuyama et al. [37] examined the hydrophone pulse response according to the change in transport rate using bedload transport data at 5 min intervals obtained by installing multiple pipe hydrophones (length 0.5–8.0 m) in a mountainous river in the Japanese Alps. In the Erlenbach River in Switzerland, the flow depth-bedload transport relation during a flood was continuously observed through bedload observation using plate geophones [38]. Turowski et al. [39] and Uchida et al. [40] explained the effect of changes in sediment supply conditions, such as the destruction of armor layers or debris flow on bedload transport, by measuring the differences in transport rates at the rising and falling parts of the hydrograph through observation of the bedload using geophones and pipe hydrophones. Mao et al. [41] observed seasonal patterns in the bedload hysteresis relationship between snowmelt and glacier floods in a mountain river in the Italian Alps using a pipe hydrophone. Monitoring of bedload transport using pipe hydrophones or geophones has also been successful in field tests conducted in mountainous catchments in various environments [42,43,44,45,46]. These tests were performed to understand the process of bedload transport of mountain rivers that was affected by various factors, such as flow, supply conditions, and bed type. However, the application of acoustic techniques (i.e., hydrophone) for monitoring bedload transport in mountainous catchments after fires and their effectiveness remains unexplored.
This study examined the effect of changes in sediment supply conditions on bedload transport by monitoring sites in small mountainous catchments in the southern part of South Korea for 6 years after a fire. Furthermore, the relationship between flow depth and bedload transport in the fire-affected catchment was compared with that in the unburned catchment. To achieve our objective, we installed a hydrophone (Japanese pipe hydrophone) developed by Mizuyama et al. [34,47,48] together with a pressure water level gauge below the monitoring point of the catchment outlet. Moreover, changes in bedload transport rates corresponding to the flow conditions of the monitoring point were continuously measured during each rainfall-runoff event. Changes in supply conditions during the monitoring period were investigated through aerial photographs taken before and after the wildfire in the burned catchment (resolution 0.25 m) and by evaluating the particle size distribution of the bed materials.
Our observations showed that the Fire-induced changes in the supply conditions increased the rate of sediment transportation in the burned catchment 1–2 years post-wildfire (post-fire sediment regime). The improved sediment discharge progressively declined 3 years post-wildfire due to the vegetation recovery on the burned slope. However, a landslide event suddenly disrupted the relaxation time, and the rate of sediment production and transportation in the burned catchment was reactivated (post-landslide sediment regime) (Figure 1).
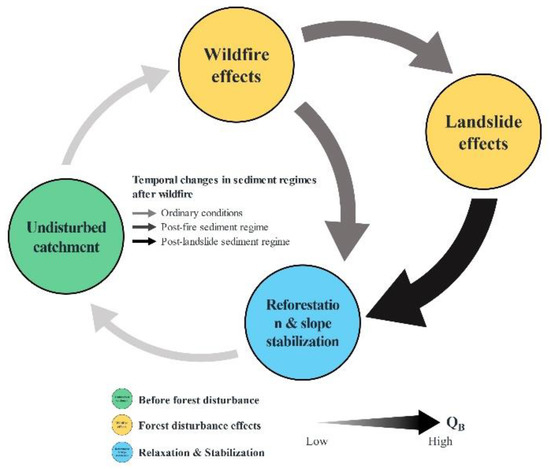
Figure 1.
Conceptual diagram of temporal changes in sediment transport regimes in the fire-disturbed catchment. The thickness of the arrows indicates the magnitude of the sediment discharges (QB).
2. Materials and Methods
2.1. Study Catchments
2.1.1. Burned Catchment
Post-fire monitoring of bedload transport was performed in the southern part of the Korean Peninsula (Table 1 and Figure 2). The burned catchment is located upstream of the Hwang River in Geochang-gun (latitude: 35°45′3′′ N, longitude: 127°52′1′′ E), where the humid continental climate (Köppen Dwa) prevails with a mean annual temperature of 12.4 °C. It is a small-scale mountainous catchment with an area of 30.8 ha (Figure 2a,b). The average annual precipitation in this area is 1460.2 mm, with 69.5% of the annual precipitation occurring during the rainy season from June to September (based on precipitation records from 1997 to 2021 at the Buksang Automatic Weather Station managed by the Korea Meteorological Administration). Geologically, the catchment consists mainly of granite, with biotite granite being the representative rock formation. The soil type is dominantly sandy loam. Until the early 2000s, soil and rocks were collected approximately 400.0 m upstream of the monitoring point. The damaged area was approximately 2.4 ha, but was restored in the mid-2000s. Topographically, the catchment is characterized by a steep slope with an average angle of 32.4°. In particular, the incision slope of the quarry area and the rocky slope of the catchment showed an angle of more than 60.0°.

Table 1.
Main characteristics of study sediments.
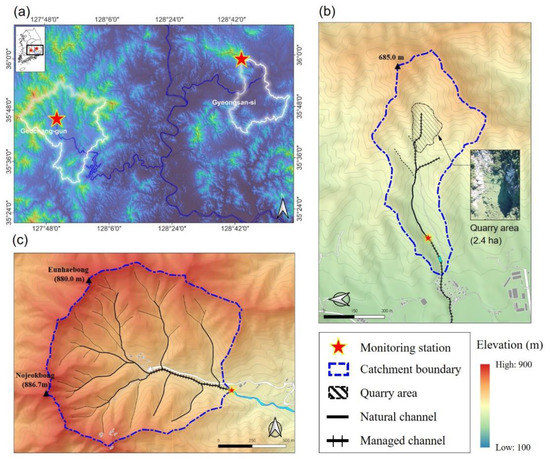
Figure 2.
(a) Geographical distribution of the two study catchments. Topographical characteristics and locations of monitoring points in the (b) burned and (c) unburned catchments.
The elevation of the monitoring point was 361.7 m, showing a difference in elevation of 323.3 m from the highest point of the catchment area (685.0 m above sea level) (Figure 3a). In the 0.86 km-long mainstream, the cascade and step-pool structures were irregularly repeated (Dmax = 960.3 mm), while the maintained section downstream of the monitoring point resembled a plane bed [49]. The average width and gradient of the streambed were 4.3 m and 20.9%, respectively, with lateral input occurring through streambank erosion. A section of approximately 200.0 m from the catchment outlet to the monitoring point was maintained by the debris barrier and mountain torrent conservation project, and the channel in the quarried area was restored using an artificial waterway. Particle sizes corresponding to pass percentages of 25.0% (D25), 50.0% (D50), and 75.0% (D75) in the particle size distribution curve were 3.0 mm, 5.3 mm, and 8.1 mm, respectively. The degree of sorting by Trask [50] showed a value of 1.6 (well sorted) (Figure 4). Streambed materials were investigated using the areal sampling method (100 samples) with a 0.5 m grid at the location of the hydrophone installation [51,52].
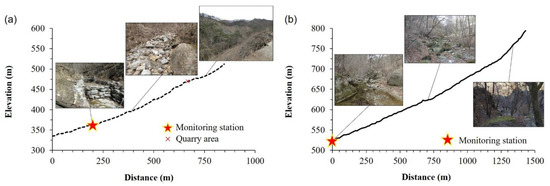
Figure 3.
Longitudinal profile and morphological characteristics of the main streams in the (a) burned and (b) unburned catchments.
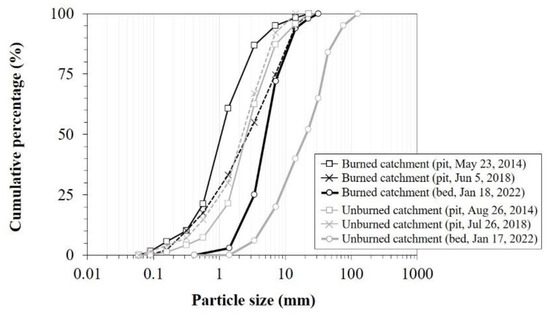
Figure 4.
Particle size distribution curves obtained from the pit sampler deposits and bed surface of the burned (black line) and unburned (gray line) catchments. The particle size of the surface material was investigated in the sandy-gravel point bar of the hydrophone installation site. Pit samples were taken at a depth of 0.1 m from the surface.
The wildfire occurred on 10 March 2013. After the fire, most ground-cover plants and trees were burned down on all slopes except for those in the valley (see Figure S1 in Supplementary Materials). The catchment, before the wildfire, was covered with coniferous forests composed primarily of pine and larch trees, with partial oak stands. The affected areas were reforested after the wildfire, but some of the upstream slopes and quarry areas still remain as non-stocked forestland or bareland (approximately 0.89 ha). The aerial view (based on data from the Korean National Geographic Information Institute) taken on 9 May 2014 revealed that approximately 45.1% of the catchment area (13.9 ha) was affected by the fire, with all damaged trees being cut down (Figure 5). The aerial view taken on 8 May 2016 confirmed that the surface of the bareland was covered by ground-cover plants. Bedload monitoring started in March 2014, one year after the wildfire. The measuring system was installed in the bedsill’s spillway approximately 200.0 m upstream of the catchment outlet. The width and slope of the streambed in this section were 4.5 m and 2.0%, respectively (see Figures S2a and S3a in Supplementary Materials).
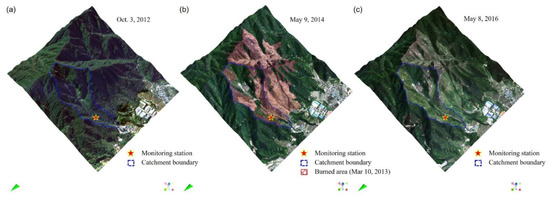
Figure 5.
Comparison of aerial views before and after the wildfire in the burned catchment (10 March 2013). (a) The aerial view taken on 3 October 2012 shows that most forests in the catchment area were logged after the wildfire. (b) This is observed in the aerial view taken on 9 May 2014. (c) In the aerial view taken on 8 May 2016, most bare slopes were covered with ground cover, but the surface of the steep upstream slopes and quarry areas was still exposed.
2.1.2. Unburned Catchment
The unburned catchment with an area of 139.7 ha is located upstream of the Geumho River (latitude: 35°59′10′′ N, longitude: 128°44′38′′ E), a tributary of the Nakdong River that runs through the southern part of the Korean Peninsula (Figure 2a,c). Geologically, the catchment consists of granite, with the representative rock formations being biotite granite and amphibole biotite granite. The soil type in the study catchment is dominantly sandy loam. The ridges of Nojeokbong (886.9 m above sea level) and Eunhaebong (897.6 m above sea level) to the east of Mount Palgong (1192.9 m above sea level) formed a catchment, and granite outcrops were revealed at the ridges at 800.0 m or higher above sea level. The unburned catchment has a humid continental climate (Köppen Dwa), with a mean annual temperature of 13.2 °C. The average annual precipitation in this area is 1231.3 mm, with 69.2% of the annual precipitation falling during the rainy season from June to September (based on precipitation records from 1997 to 2021 at the Sinnyeong Automatic Weather Station).
The 1.43 km mainstream was composed of cascades and step-pools [49]. The mean width and gradient of the streambed were 7.9 m and 24.0%, respectively, and were covered with boulders (Dmax = 1380.9 mm) and gravel (Figure 3b). The unburned catchment monitoring system was established at the catchment outlet in March 2014, and the width and gradient of this streambed section were 9.1 m and 1.0%, respectively (see Figures S2b and S3b in Supplementary Materials). The elevation of the monitoring point was 520.3 m, showing a difference of 373.7 m from the highest point of the catchment area (897.6 m above sea level). In the particle size distribution curve of streambed materials, the sizes of D25, D50, and D75 were 11.5 mm, 27.1 mm, and 41.1 mm, respectively, and the degree of sorting was 1.9 (well sorted) (Figure 4). More than 90.0% of the catchment area was covered by mixed forests, with the forest being composed of pines, oaks, and cypress trees.
2.2. Data Collections and Analysis
2.2.1. Rainfall
This study used the ground rain gauge data from the automatic weather station of the Korean Meteorological Administration close to the monitoring point for continuous monitoring of catchment hydrology and acquisition of reliable rainfall data. In the case of the burned catchment, the Geochang Automatic Weather Station (AWS) was located 10.8 km north of the burned catchment, and ground rain gauge data from the observation point and the Buksan AWS at a distance of 4.8 km were used. The Sinnyeong, Palgong (11.9 km), and Hayang (10.1 km) weather stations were located around the unburned catchment, and rainfall data from the Sinnyeong AWS 7.7 km away from the monitoring point were used. A conduction-type rain gauge with a resolution of 0.5 mm was applied to the ground rain gauge of each weather station, and the accumulated rainfall was measured at 1 min intervals.
The collected rainfall data were separated by individual events and assigned to the rainfall event of each study catchment. Precipitation events from December to February were excluded from the analysis of this study because they included snow cover. A rainfall event was defined as an independent event having a period of no rainfall of at least 24 h after the preceding rainfall ended in a continuous rainfall record. During the monitoring period from 2014 to 2019, 280 and 242 rainfall events occurred in the burned and unburned catchments, respectively (see Table S1 in Supplementary Materials). The flow depth was measured in 97 and 140 events that occurred in burned and unburned catchments, respectively; whereas the rest occurred during the missing period. Among the 237 rainfall events, bedload transport was detected by the hydrophone in 26 cases in the burned catchment and 28 cases in the unburned catchment. In the burned catchment, bedload transport from rainfall events was measured in 8 cases in 2014, 2 cases in 2015, 8 cases in 2016, 6 cases in 2018, and 2 cases in 2019. In the unburned catchment, bedload transport of monitoring points from rainfall events was measured in 5 cases in 2014, 6 cases in 2015, 5 cases in 2016, 7 cases in 2018, and 5 cases in 2019. Most cases of bedload transport were triggered by a rainfall event with a total rainfall of 30.0 mm or more. Among them, rainstorm events of ≥100.0 mm rainfall occurred 8 times in the burned catchment and 9 times in the unburned catchment. In the case of the unburned catchment, bedload transport was measured using a pit sampler instead of a hydrophone pulse in one rainstorm event on 2 October 2019.
2.2.2. Bedload Monitoring
The bedload transport of the streambed was measured with a “pipe hydrophone” developed by Mizuyama et al. [34,37,47]. In previous studies, different names were used for pipe hydrophones, such as “Japanese pipe geophone” [48], “Japanese acoustic pipe” [41], and “Japanese pipe microphone” [36]. Strictly speaking, “hydrophone” means a microphone designed for use in water that measures sonar signals. However, it has already been used in a number of studies as a term that refers to an acoustic sensor installed on the bed for the purpose of bedload measurement [40]. In this study, “pipe hydrophone”, which is distinguished from “plate hydrophone” owing to differences in the installation method and hydrophone structure, was termed “hydrophone”.
The hydrophone used here was a device that estimated the bedload discharge of a river by installing a metal pipe with a built-in microphone on the bed that detected the sound generated when flowing sediment particles collided with the pipe [53]. The diameter and length of the metal pipe were 48.0 and 2.0 m, respectively, and were buried in the streambed at the monitoring point in the vertical direction of the thalweg. The pipe was constructed so that a part of it protruded from the mortar surface to a height of 12.0 mm (see Figure S2 in Supplementary Materials). As the inside of the pipe was filled with air, the built-in microphone sensor detected the vibration of the air generated when particles collided. These detected collision signals were amplified by a preamplifier inside the pipe and then transmitted to an external converter. The signal sent to the converter was sampled at intervals of 100 kHz. Furthermore, the signals were converted into digital signals from which noise was removed through a band-path filter. The preprocessed signals were output at 6 different amplification factors of 1× (Ch.6), 4× (Ch.5), 16× (Ch.4), 64× (Ch.3), 256× (Ch.2), and 1024× (Ch.1). When the output of each channel exceeded the threshold (2.0 V), square waves of a constant voltage (5.0 V) were generated. The pulse value corresponding to the number of collisions of sediment particles was recorded in the data logger (Campbell CR1000) at 1 min intervals.
The hydrophone pulse has been reported to show an insensitive response under conditions of low flow and collision of small particles at the channel with a low amplification rate [37,44,54,55]. This was also observed in the monitoring results of study catchments. Therefore, this study used the Ch.1 pulse value with the largest amplification rate in consideration of the resolution for data interpretation (i.e., the number of pulses per unit time). A detailed description of the bedload measurement principle and signal processing procedure using hydrophone pulses can be found in Mizuyama et al. [34,37], Tsutsumi et al. [46], and Tsutsumi [53].
A pit sampler was installed downstream of the hydrophone to directly measure bedload discharges passing through a cross-section in the monitoring point (see Figure S2 in Supplemental Materials). The applied sampler had an inlet width of 0.2 m and an internal volume of approximately 0.5 m3. It continuously measured changes in the bedload mass through a load cell built into the floor [56]. We tested the relationship between the magnitude of Ch.1 pulses and the bedload discharges measured by pit sampler in the burned and unburned catchments (Table 2). The sampled bedload mass data were obtained from the rainstorm events in which sampler sediment was pre-removed to test the pulse sensitivity. The bedload discharge was calculated by differentiating the change in the bedload mass flowing into the sampler at 10 min intervals [57,58].
Table 2.
Summary of the statistics for the linear relationships between pulse magnitude and bedload discharges in the burned and unburned catchments.
In the observations of the burned and unburned catchments, a significant linear relationship was found between pulse magnitude and bedload discharges (R2 > 0.815). This suggested that the pulse value per unit time corresponded to the amount of bedload transport per unit time, that is, the bedload transport rate. Moreover, the slope coefficients of regression equations were in the burned catchment and unburned catchment close to unity. That is, the magnitude of pulse responses according to the bedload discharge fluctuation in the burned and unburned catchments did not vary considerably. Based on these monitoring results, we measured the changes in bedload discharge corresponding to the flow conditions of the monitoring point. Flow depth was measured in meters (to three decimal places) every min at the spillway section at each monitoring point. The pressure-type water level meter (OTT PLS) manufactured by OTT HydroMet was applied for the water level meter, and all devices including the hydrophone were checked and calibrated through on-site inspections four times a year. In the case of depth and hydrophone data, the measured values recorded at 1 min intervals were reproduced as 10 min average (flow depth) and sum (Ch.1 pulse).
2.2.3. Hysteresis Analysis
Assuming the equilibrium state between supply condition and transport capacity, the temporal graph of sediment in relation to streamflow and sediment transport rate may remain constant in either the rising limb or falling limb of the flood hydrograph, and the streamflow predominantly controls its amount. However, because of the absence of available sediment, most of the steep mountain streams exhibit that channels are limited in supply conditions rather than transport capacity. Thus, the delivered rate of sediment observed in the rising and falling limbs of the hydrograph has commonly fluctuated in a given flow rate. This difference in sediment flux generates a temporal relationship between streamflow and sediment transport rate, which has contrasting hysteric loops, i.e., clockwise and counterclockwise hysteresis patterns (Figure 6).
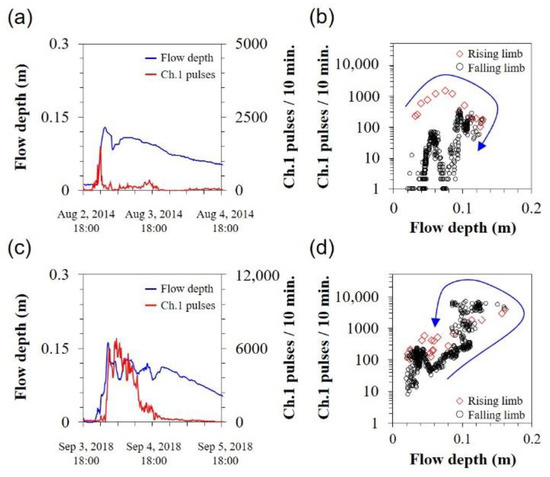
Figure 6.
Flow depth and pulse values measured by the hydrophone’s Ch.1 registered on (a) 2 August 2014 and (c) 4 September 2018 rainstorms in the burned catchment. In the former event, the (b) bedload peak occurred before the peak flow depth, creating a clockwise hysteresis, whereas, in the (d) latter event, the peak of bedload transport occurred after the peak flow depth, producing a counterclockwise hysteresis.
For example, at a given rainfall event, if the available sediment is exhausted during the rising limb, the sediment transport rate peak earlier than streamflow, and its amount is likely higher in the rising limb than in the falling limb at the same discharge. This process induces the “clockwise hysteresis pattern” in a relationship between streamflow and sediment transport rate (Figure 6a,b). On the contrary, the “counterclockwise hysteresis pattern” can result from the process that the sediment transport rate peaks later than the streamflow. Thus, sediment transport is usually higher in the falling limb than in the rising limb (Figure 6c,d).
A number of studies have reported a hysterical relationship between flow depth and bedload transport rate in mountain streams [39,40,41,59,60,61]. They observed hysteric patterns of periodic [41] or aperiodic changes [39,40] on site. In addition, they identified interactions between bedload transport and parameters, such as catchment supply conditions, bed morphologies, and flood magnitude on the direction of the hysteresis loop. However, monitoring the relationship between flow depth and bedload transport in fire-affected mountainous catchments was insufficient compared with that of suspended load in the same areas. We investigated the relationship between flow depth and bedload transport rate in small-scale mountainous catchments affected by fires using high-resolution field data obtained from surrogate monitoring by hydrophones.
To monitor bedload transport using a hydrophone, the response characteristics (e.g., the detection rate of each channel, number of pulses, response time) vary depending on conditions, such as the type of sensor [36,48,56,62], installation method [46,63], runoff (e.g., Iuchi et al. [64]; Wyss et al. [45]), bedload transport rate [37,65], and streambed materials [41,66]. Hence, in our study, the flow depth and pulse data were normalized to compare bedload behaviors for consecutive rainstorm events in multiple catchments.
For instance, Lloyd et al. [67,68] normalized the flow and material concentrations measured in individual floods to the ratios of their respective maximum fluctuation range to investigate hysteresis changes in nutrient concentrations in successive rainstorm events. Considering this, we expressed the flow depth Hi measured at the measurement time i of each rainfall event as a ratio to the maximum fluctuation range of the flow depth. Here, the pulse value Pi was expressed as a ratio to the maximum fluctuation width of the pulse. Therefore, the normalized flow depth (normalized Hi) and pulse value (normalized Pi) at the measurement time i of each rainfall event was expressed according to Equations (1) and (2):
where Hmax and Pmax are the maximum values of flow depth and Ch.1 pulses observed in one hydrologic curve.
One hydrologic curve was defined as the section from the time when the raising water level after the onset of rainfall passes the peak until it returns to the state before rainfall. The hydrograph of each rainstorm event can have single or multiple modes. For an event in which 2 or more peak flows were observed, the maximum value of the observed flow depth was determined as the peak flow depth. Hmin and Pmin represent the minimum values of the observed flow depth and Ch.1 pulses at each hydrological event.
2.2.4. Landslide Field Survey
From 01:00 on 26 August 2018 to 04:00 on 28 August 2018, the burned catchment received 245.0 mm of rain due to a stationary front. This rainstorm was preceded by rainfall with a total precipitation of 110.0 mm from 04:00 on 23 August 2018 to 11:00 on 24 August 2018. The 1 h maximum rainfall intensity and 24 h maximum rainfall of the rainstorm event on 26 August 2018 were 33.0 mm/h and 188.0 mm (RI = 9.8 y), respectively. Furthermore, a hillslope approximately 50.0 m upstream of the monitoring point collapsed during the site inspection conducted on 4 September 2018 (see Figure S4 in Supplementary Materials). This landslide was not detected during a site visit for data collection on 24 July 2018. From 24 July 2018 to 22 August 2018, the accumulated precipitation was only 39.0 mm. Therefore, we estimated that the landslide occurred during the rainstorm on 23 August 2018 or 26 August 2018. Given the magnitude and frequency of the rainstorms, we assumed that it was triggered by a subsequent event.
On 4 September 2018, a field survey was adopted to measure the collapsed area using 2 m ranging poles and 100 m tape measures. The collapse area and maximum collapse depth calculated by the field survey were approximately 508.9 m2 and 3.7 m, respectively (Figure S4a). Moreover, we estimated that approximately 1106.7 m3 of sediment was introduced into the adjacent channel immediately after the landslide (Figure S4b,c). The collapsed slope was restored before the rainy season in 2019. However, the field survey on 18 January 2022 confirmed that some of the landslide deposits still remained in the streambed (Figure S4d,e).
Unfortunately, the hydrology and bedload monitoring of the fire-disturbed catchment was suspended from 30 April 2018 to 29 August 2018 due to mechanical problems in the measuring system, and resumed on 30 August 2018, shortly after the landslide. Therefore, observation data during the rainstorm on 23 August 2018 and 26 August 2018 could not be obtained. However, we observed interesting changes in pulse values during monitoring after the landslide.
3. Results
3.1. Hydrology and Bedload Transport Monitoring Results
In this study, we monitored the temporal changes in the precipitation (mm), flow depth (m), hydrophone pulse (Ch.1 pulse), and pit sampler load (kg) (Figure 7). We expressed all data in the graph as the average (flow depth and sampler load) or sum (precipitation and Ch.1 pulse) of 1 min interval measurements recorded for 1 h. Monitoring results also included intermittent and long-term missing data due to electrical and mechanical problems. For example, monitoring was simultaneously stopped in 2017 in both catchments for repair and replacement of damaged devices.
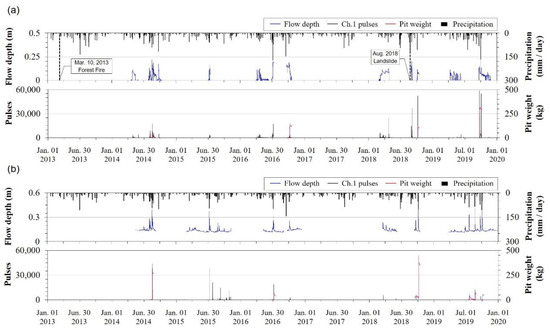
Figure 7.
Six-year time series data of precipitation, flow depth, hydrophone pulses, and pit sampling for the (a) burned and (b) unburned catchments.
We observed that the annual precipitation during the monitoring period ranged from 889.0 mm to 1668.0 mm and from 713.0 mm to 1337.5 mm for the burned and unburned catchments, respectively. Excluding the records for 2015 and 2017, we noticed that our data were similar to or greater than those recorded in an average year (burned catchment: 1460.2 mm, unburned catchment: 1231.3 mm). In the burned catchment, the total rainfall during the rainy season (June–September 2013) immediately after the wildfire was 757.5 mm, which was similar to the average rainfall recorded during the entire monitoring period. The hydrology of the study catchments was strongly influenced by the seasonal distribution of precipitation. In the burned and unburned catchments, the average cumulative precipitation during the dry season (spring and winter) from November to April was 363.2 and 295.9 mm, respectively. In contrast, during the rainy season from June to September (summer), the average cumulative precipitation in the burned and unburned catchments was 778.6 and 614.9 mm, respectively, more than 2.0 times higher than those recorded during the dry season. The weather during the rainy season was unstable due to the influence of the stagnant front (rainy season) that moved northward to the inland of the Korean Peninsula from June to July, and from August to early October, mainly due to the influence of tropical cyclones (typhoons) accompanied by intensive rainstorms of 100.0 mm or more per day. The maximum flow depth at the monitoring point during this period was the highest in the year (0.11–0.30 m at the burned catchment and 0.19–0.56 m at the unburned catchment). Therefore, we noticed that the main bedload transport events during monitoring were concentrated in the flood events in the rainy season.
We observed that the hydrophone pulse (solid black line) reacted sensitively to the increase in precipitation and flow in the catchment. In particular, the change in the sampler load (solid red line) and the pulse response showed that the hydrophone sensor of the streambed at the monitoring point adequately detected the bedload transport during flooding. However, the flow depth-pulse relationship observed in each rainfall event of study catchments was not constant.
3.2. Rainstorm Event
During the monitoring period, we recorded the occurrence of 18 and 17 rainstorm events with a total rainfall of 100.0 mm or more in the burned and unburned catchments, respectively (Table S1). Among them, 19 rainstorm events (9 and 10 in the burned and unburned catchments, respectively) that showed good response to flow depth and hydrophone pulses are summarized below (Table 3). These included 2 rainfall events with less than 100.0 mm in total precipitation, for which bedload measurement using the pit sampler (one each from the burned and unburned catchments) was successful.
Table 3.
Summary of heavy rainfall events observed in the study catchments during the 6-year monitoring period a.
In the burned catchment, we detected bedload transport during 3 rainstorm events in 2014, 1 in 2015, 2 in 2016, 1 in 2018, and 2 in 2019. Excluding the typhoon event on 1 August 2014 (case 1), 3 rainstorm events that occurred in July and August were triggered by the stationary front (SF). We found that the total rainfall (Rtot, mm) and 1 h maximum rainfall intensity (I60max, mm/h) ranged from 117.0–286.5 and 18.5–48.5 mm/h, respectively (cases 2, 4, and 5). The remaining 5 rainstorms in September and October were attributed to tropical cyclones (TC). We measured a total rainfall of 68.5–203.0 mm, and a 1 h maximum rainfall intensity of 8.5–22.5 mm/h (cases 3, 6, 7, 8, and 9). In the burned catchment rainstorm event, the maximum 24 h rainfall was (R24max, mm) 68.5–208.0 mm, with the recurrence interval being estimated to be (RI, year) 0.7–15.2 years. The largest flood during the monitoring period was caused by a rainstorm on 5 July 2016, where we recorded a peak flow depth of 0.30 m (Hpeak, m) (case 5). The measured Ch.1 pulse value at the maximum depth of this rainstorm (P1024peak) was 2093, which was the maximum during the monitoring prior to the landslide in August 2018.
In the case of the unburned catchment, we detected bedload transport in 1 case in 2014, 1 case in 2015, 1 case in 2016, 2 cases in 2018, and 5 cases in 2019. Half of these were frontal rain events (cases 10, 11, 12, 13, and 17), whereas the remainder were typhoon events (cases 14, 15, 16, 18, and 19). We measured a total rainfall and 1 h maximum rainfall intensity in the range of 53.0–215.0 and 6.0–29.0 mm/h, respectively. The 24 h maximum rainfall for each event was 37.0–155.5 mm, with the recurrence interval being calculated to be 0.3–6.7 years. The largest flood in the unburned catchment was caused by a rainstorm on 5 October 2018, with the measured pulse value at a peak flow depth of 0.56 m being 8236, the highest during the monitoring period.
The sampler measurement (M, kg) of the burned catchment was successful 4 times on 17 August 2014; 5 October 2016; 5 October 2018; and 21 September 2019 (cases 2, 6, 7, and 8). The amount captured ranged from 18.6 kg to 277.7 kg. Sampler data from the unburned catchment were successfully collected 7 times on 17 August 2014; 1 July 2016; 20 September 2018; 5 October 2018; 19 July 2019; 21 August 2019; and 2 October 2019 (cases 10, 12, 13, 14, 16, 17, and 19), with the captured amount ranging from 16.2 kg to 425.1 kg. We calculated the bedload discharge of the sampler as the difference between the maximum and minimum values of sediment volume measured in each flood. However, this estimation included measurement errors that might have occurred when the inside of the sampler was full at the beginning of a flood and before its peak flow [53,69].
3.3. Bedload Transport Rate
In the burned catchment observations, we found interesting changes in the flow depth-pulse relationship obtained from the rainstorm events on 17 August 2014 and 5 July 2016 (cases 2 and 5). The two rainstorm events occurred 1 and 3 years after the wildfire, respectively. The rainstorm on 5 July 2016 produced the largest recorded flooding in the burned catchment; the rainstorm on 17 August 2014 was smaller in terms of rain intensity and flood size than the rainstorm on 5 July 2016 (see Table 3). Therefore, the erosion response of the slope and the transport capacity of the stream would have been relatively large in the latter event [8,28,49]. However, we could not detect significant increases in the hydrophone pulse’s peak (P1024peak) and fluctuation (P1024 < 3600) according to the increase in bedload discharges during the rainstorm event on 5 July 2016.
We also observed temporal changes in the bedload transport rate after a fire in the burned catchment in the falling limb of the hydrograph (Figure 8). During the 2014 rainstorm events (cases 1, 2, and 3) of the burned catchment, the Ch.1 pulse continued to respond after the peak flow depth (Hpeak) (Figure 8a–c). This finding contrasts with the unburned catchment data, where the pulse responses of most rainstorm events ended immediately after the peak flow (Figure 9). Particularly in the rainstorm on 17 August 2014 in the burned catchment (case 2), we found that the pulse was increased several times again during the falling limb (Figure 8b). On the contrary, in the rainstorm on 5 July 2016 (case 5), the pulse response immediately decreased after the peak flow, even though the flow depth in the falling limb was much higher than that of the rainstorm event on 17 August 2014 (Figure 8e). This change in the bedload transport rate for a given flow depth is likely attributed to the depletion of the movable sediment in the burned catchment [70].
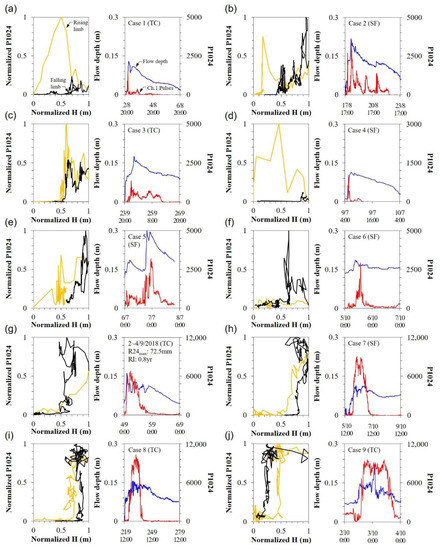
Figure 8.
Depth-pulse relationship in rainstorm events in the burned catchment. The bedload hysteresis relationship was divided into clockwise patterns in (a,c,d) and counterclockwise patterns in (b,e–j). A rainfall event on 2 September 2018, which occurred immediately after the landslide in August 2018, was added to the data.
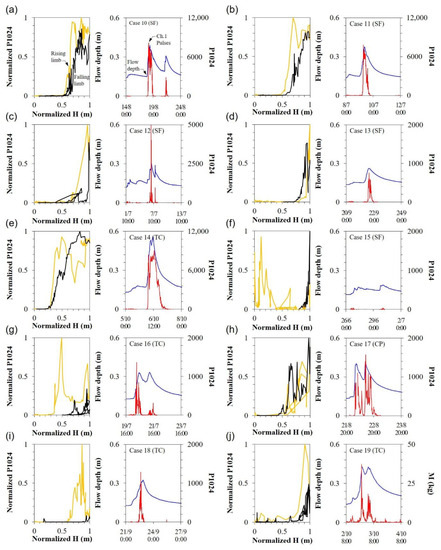
Figure 9.
Depth-pulse relationship in rainstorm events in the unburned catchment. The bedload hysteresis relationships were divided into clockwise patterns in (a–c,g–i), and (j) and counterclockwise patterns in (d–f), and (h).
In this study, differences in sediment availability between burned and unburned catchments were examined by interpreting the rainstorm event on 17 August 2014, which occurred at approximately the same time in both catchments. In cases 2 and 10, rainstorms occurred at approximately 18:00 on 17 August 2014 and 20:00 on 17 August 2014, respectively, with similar intensities and magnitudes in the two catchments (see Table 3). The peak flow depths were 0.22 and 0.39 m in the burned and unburned catchments, respectively, which were approximately 1/5 of the bankfull stage (See Figure S3 in Supplementary Materials). During the rainstorm on 17 August 2014, the Ch.1 pulse of the burned catchment reacted simultaneously with the increase in flow depth (approximately 0.02 m) at approximately 17:00 on August 17, and immediately after the observed peak flow (normalized H = 1.0), on August 18, which reached its maximum (normalized P1024 = 1.0) at approximately 09:00 (Figure 8b). In contrast, the Ch.1 pulse of the unburned catchment reacted at nearly half of the peak flow depth (normalized H = 0.5, approximately 0.20 m) and was decreased at approximately 10:00 on August 18, before the flow depth reached its maximum (Figure 9a). This pulse response revealed differences in the critical discharge that initiated bedload transport at each monitoring point [61]. The differences in the initiation conditions of bedload movement were not limited to the rainstorm event on 17 August 2014. In the last rainstorm events in 2014 and 2015, 1–2 years after the wildfire (cases 1, 2, 3, and 4), the Ch.1 pulses in the burned catchment were rapidly increased at the beginning of the flood (approximately 0.02–0.04 m) (Figure 8a–d). In contrast, the pulse response of the unburned catchment tended to increase at 1/2–4/5 of the peak depth (normalized H = 0.5–0.8), that is, near the peak of the flood (0.23–0.28 m) in most cases.
Even assuming that the improved bedload transport of the burned catchment declined over time, it still tended to be higher than that of the unburned catchment. The relationship of the peak flow depth-peak bedload discharge (i.e., pit load and Ch.1 pulse) observed in the rainfall event of the burned and unburned catchments is shown in the semi-logarithmic graph (Figure 10). We observed that the peak pulse value of the burned catchment, that is, the bedload transport rate, was shown to be 1–2 orders of magnitude higher than that of the unburned catch at a given peak flow depth, except for the rainfall events that occurred from 18 March 2015 and 19 September 2018 in the unburned catchment. Considering the differences in the catchment area between the two study catchments, this finding indicated that the sediment availability of the burned catchments as a whole was higher than that of the unburned catchments [26].
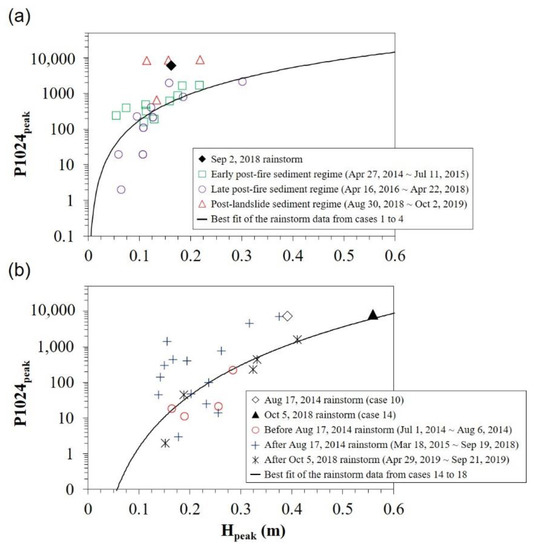
Figure 10.
Changes in the relationship of peak flow depth–peak pulse for each rainfall event oc-curring during the entire monitoring period in the (a) burned and (b) unburned catchments. Re-gression curves were derived from the power law relationships presented in Table 4.
The bedload transport rates of burned catchments were further improved after the August 2018 landslide. As a whole, the peak bedload discharge (Mpeak) and peak pulse values in the rainfall events after the landslide were found to be 1–2 orders of magnitude higher than those in the data before the landslide at a similar peak flow depth (Figure 10a). This was consistent with the reports of Schuerch et al. [71], and Kanbara [72], who observed a transient increase in the transport rate after episodic supply events (e.g., large floods, landslides, and debris flow) in sediment observation studies of mountain streams.
A similar pulse response was also observed in the monitoring of the unburned catchment. In the data group after the rainstorm on 17 August 2014, the peak pulse was found to fluctuate by more than 3 orders of magnitude. At the given peak flow depth, it was about one order of magnitude higher than that before the rainstorm on 17 August 2014. This changed peak flow depth-peak pulse relation returned to the data range observed before the rainstorm on 17 August 2014 after the end of the rainstorm on 5 October 2018.
3.4. Sediment Supply Condition
In an aerial photograph of the burned catchment on 9 May 2014, 45.1% of the catchment area was logged (Figure 5b,c). Most of the sediment volume delivered to the monitoring point at this time must have come from such disturbed areas [6,7,13,26]. However, in the aerial photograph taken on 8 May 2016, most areas of the felled slope were covered by ground-cover plants (Figure 5c). In fact, the normalized difference vegetation index (NDVI) of the burned catchment calculated using the LandTrendr algorithm of Google Earth Engine [73] was 0.59 ± 0.11 on 5 June 2013, 0.53 ± 0.11 on 7 May 2014, 0.70 ± 0.06 on 26 May 2015, and 0.69 ± 0.05 on 12 May 2016. This suggested that the fire-disturbed forest system had entered the recovery stage starting in 2015 [4,21,24,74]. Therefore, at each rainstorm event in 2016, the amount of hillslope material introduced into the stream would have decreased compared with that in 2014, when the impact of the presumably larger fires was stronger [16,25,75]. Accordingly, we assumed that this might have affected the quantity and quality of the transported bedload.
The effect of changes in supply conditions on the bedload transport characteristics of the burned catchment was also confirmed by the particle size of the pit deposits (Figure 4). Samples were taken on 23 May 2014 and 5 June 2018 at a depth of 0.1 m from the surface. In addition, sediment was removed from inside the pit for system maintenance in early March of each year. Therefore, it is likely that the acquired sample was transported during the rainfall event of the dry season and was accumulated in the upstream tributary and streambed after the rainy season of the previous year ended. The sediment particle size was investigated through sieve analysis after transferring the samples to the laboratory and drying them in an oven. The sand and fine gravel content in the sample obtained on 23 May 2014 was higher than that in the sample on 5 June 2018. The D50 values of each sample were 1.07 and 4.85 mm, respectively. Thus, the former was 4.5 times finer than the latter. The high proportion of fine fractions in the 2014 sample was attributed to the fire-accelerated catchment erosion process [13,23,24,25].
Similarly, in a study by Florsheim et al. [23] comparing the particle size of streambed materials before and after a wildfire at Matilija Creek in southern California, USA, the critical tractive force (D50) of the surface material was shown to be decreased from 7.1 N/m2 before the fire to 2.7 N/m2 due to the influx of hillslope material after the fire. Conversely, the shift in sample particle size to the coarse fraction detected in the 2018 survey was presumed to be due to the reduction in the amount of fine particles flowing into the stream resulting from the covering of burned slopes, as reported by Martin and Moody [75]. In their field measurements on burned slopes of Spring Creek, CO, USA, the D50 of the produced soil was increased to 2.0, 3.4 and 4.1 mm at the first, second, and third year after the fire, respectively. In conclusion, the improvements in particle mobility and bedload transport rate observed in the 2014 rainstorm event of the burned catchment were considered to be the effect of the introduction of fine particles into the stream [76,77]. In contrast, the D50 values of the pit deposits obtained on 26 August 2014 and 26 July 2018 from the unburned catchment were almost unchanged at 2.56 and 1.95 mm, respectively.
3.5. Bedload Hysteresis
We examined the bedload hysteresis relationship using 54 rainfall events with good hydrophone responses (Figure 11). In the burned catchment, we identified hysteric patterns in the flow depth-pulse relationship in the clockwise direction in 14 cases, whereas in the counterclockwise direction in 12 cases (Figure 11a). However, we could not determine the dominant hysteresis pattern of the monitoring period because of missing data. In 2014, 1 year after the fire, we observed a dominant clockwise hysteresis pattern with decreasing pulse response before the peak flow depth at 87.5%. In 2016, however, we identified both a clockwise and counterclockwise pattern, with the counterclockwise pattern increasing to 67.7% in 2018. In contrast, in the unburned catchment, we identified 24 and 5 cases of hysteric patterns in the clockwise and counterclockwise directions, respectively, with the occurrence of clockwise hysteresis patterns accounting for 82.8% (Figure 11b). When the burned catchment monitoring during the year 2013, right after the wildfire, was excluded, the fire impact was estimated to be strongest during the 2014 rainy season [9,14,16,17]. However, the hysteric loop of the flow depth-pulse relationship was not discriminated between the burned and unburned catchments.
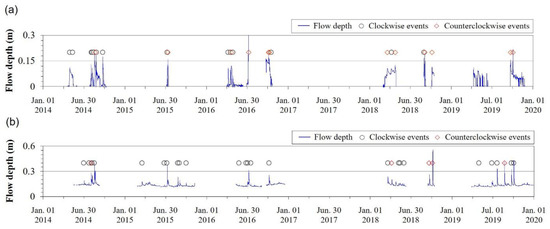
Figure 11.
Clockwise and counterclockwise hysteric patterns observed in the (a) burned and (b) unburned catchments during the 6-year monitoring period.
4. Discussion
4.1. Temporal Changes in Sediment Regime after Wildfire
We calculated the best-fit relationship between peak flow depth and peak pulse for the burned catchment’s rainstorm events from August 2014 to October 2016 (Table 4). A simple power law relationship derived from the burned catchment dataset was found (n = 6, R2 = 0.849), which corresponds to the post-fire sediment transport regime that the fire-accelerated geomorphic processes in the burned catchment enhance the bedload discharges in a given flow depth.
Table 4.
Coefficients, exponents, and statistical properties of the power law relationships between peak flow depth and peak pulses in the burned and unburned catchments.
Table 4.
Coefficients, exponents, and statistical properties of the power law relationships between peak flow depth and peak pulses in the burned and unburned catchments.
| n | Coefficient | Exponent | R2 | Standard Error | p-Value | |
|---|---|---|---|---|---|---|
| Burned catchment | 6 | 50.05 × 10³ | 2.453 | 0.849 | 0.217 | <0.01 |
| Unburned catchment | 5 | 101.67 × 10³ | 4.826 | 0.957 | 0.468 | <0.005 |
Despite the small dataset, the data of the rainfall events from 27 April 2014 to 11 July 2015 (1–2 years post-fire) were displayed higher than the regression curve for the rainfall events from 16 April 2016 to 22 April 2018 (3–4 years post-fire). Thus, the peak flow depth-peak pulse relation of each rainfall event in the burned catchment was classified into (1) “early post-fire sediment transport regime” in which sediment discharges increase due to unstable slopes and the supply of fine materials, and (2) “late post-fire sediment transport regime” in which high sediment discharges gradually decrease due to reforestation and slope stabilization (Figure 10a). Furthermore, in the late post-fire sediment regime, the peak flow depth-peak pulse relation was subdivided into two subgroups: before and after the August 2018 landslide. Data for post-landslide rainfall events in 2018 and 2019 were displayed at approximately one order of magnitude higher under the similar hydraulic conditions compared with those of the peak flow depth-peak pulse relation observed in the post-fire sediment regime (excluding events with pulse values less than 1000). Conclusively, wildfire-disrupted forest systems were restored and stream transport, which was somewhat weakened, was strengthened again after the landslide in August 2018 [1,9,18,78].
Similarly, in the unburned catchment, we found a power law relationship between flow depth and peak pulses for the rainstorm data since 5 October 2018 (n = 5, R2 = 0.957). Based on the regression curve derived from the unburned catchment observations, the rainfall events of the unburned catchment during the monitoring period were classified into 3 groups: (1) before the rainstorm on 17 August 2014, (2) after the rainstorm on 17 August 2014, and (3) after the rainstorm on 5 October 2018 (Figure 10b). Assuming that the relationship between flow depth and bedload transport after the rainstorm on 5 October 2018 (i.e., regression curve in Figure 10b) was the ordinary state of the unburned catchment during the monitoring period, the rainstorm on 17 August 2014 was considered to have caused floods exceeding the previous stream threshold [28]. Moreover, the frictional resistance of the streambed after the flood was estimated to be lower than that before the flood. The temporary increase in the bedload transport rate in the unburned catchment after the rainstorm on 17 August 2014 was presumed to have been caused by this sequence [76]. However, in the case of the rainstorm on 5 October 2018, the largest flood that occurred in the unburned catchment did not seem to exceed the limit condition created by the flood after the rainstorm on 17 August 2014. In this case, it is likely that the rainstorm event contributed to the exhaustion of the channel storage and the strengthening of the bed structure [79,80]. In the subsequent rainfall event, the bedload transport rate of mountain streams was decreased because the sediment regime was controlled by “supply-limited” rather than “transport-limited”.
4.2. Clockwise and Counterclockwise Hysteresis
The aerial photograph of the burned catchment taken in May 2014 shows that most burned trees were logged (Figure 5a,b). The soil erosion response is enhanced on bareland slopes where forest layers and surface cover have disappeared. Therefore, the rainfall-induced surface erosion (e.g., sheet erosion, rill erosion, gully erosion) was presumably significantly strengthened in the burned catchment during the rainy season in 2014 compared with the undamaged area [6]. When the fine particles generated during the erosion process are introduced into the stream through the surface flow, both the particle size and roughness of the streambed decrease (Figure 4) [31,69,79,81]. Therefore, it is highly probable that the mobility of streambed materials was increased after the fire. The clockwise pattern observed in the 2014 hysteresis analysis of the burned catchment can be interpreted as an increase in the number of mobile particles (i.e., sediment availability) in the streambed due to changes in upstream sediment supply conditions [41,59,82,83]. In contrast, in the unburned catchment, there was no significant change in the supply conditions related to the lateral input during the monitoring period. In this case, sediment availability depends on the storage in the channel [32]. However, even during the rainstorm event on 5 October 2018 (R24max = 119.5 mm, Hpeak = 0.56 m), which caused the largest flood in the unburned catchment, no notable morphological changes were identified in the main stream. Hence, the hysteresis characteristics of the unburned catchments were considered to reflect the limited supply conditions of such catchments (i.e., relatively low sediment availability) [60,84,85].
Using bedload monitoring in fire-disturbed and undisturbed catchments we demonstrated that despite the temporarily similar hysteric patterns in the relationship between flow depth and bedload transport between the two distinct catchments, the underlying mechanisms could differ. The hysteric loop direction in sediment transport monitoring at different sites has been explained by contradictory evidence. O’Louhlin et al. [59], Kuhnle [60], Iida, et al. [84] interpreted the emergence of a clockwise pattern as a result of “supply-limited conditions” [31,49], such as static and stable bed structures, sediment sources disconnected from rivers, and storage depletion in the preceding flood. In contrast, according to Ryan and Dixon [26], McDonald and Lamoureux [85], Yu et al. [86], and Mao et al. [41], the clockwise pattern was attributed to river “ready-available sediments” (Mao et al. [41]), such as sediment supply by bank erosion or hillslope processes, and loose materials from preceding floods.
In the hysteresis analysis of the burned catchment, the counterclockwise pattern was frequently observed in the rainfall events after 2016. In this study, the appearance of the counterclockwise pattern was examined based on the following circumstantial evidence. First, we considered the location of the main sediment source and the distance between the monitoring points as possible causes [84]. Deforestation in 2014 changed the downstream slopes of the burned catchment to bareland (Figure 5b). As the downstream felled slopes became covered with ground-cover plants over time, the primary source of the catchment was expected to divert to the upstream slopes with relatively low coverage (Figure 5c). Therefore, the lag time of sediment pulses was increased with the increasing distance of the monitoring point from the source. This change in the supply condition might have been a counterclockwise pattern in the burned catchment [85]. The effect of the August 2018 landslide on the supply conditions was examined as another cause of the counterclockwise hysteresis. The slope disturbed by the landslide in August 2018 must have been unstable during the 2018 wet season. Therefore, it is very likely that the increase in flow depth in the subsequent flood would have caused the further collapse of the destabilized slope [26]. The apparent counterclockwise hysteric pattern observed during the rainstorm event on 2 September 2018 was presumed to be the result of this sediment production process (Figure 8g).
In the case of the undisturbed catchment, the bedload hysteresis relationship could be explained by various geomorphic processes, such as stream bank erosion, supply from tributaries, destruction of bed structures, and creation of new resistance structures. In the rainstorm events of 5 October 2018 and 21 August 2019, where counterclockwise hysteresis patterns were observed (cases 14 and 17), the hydrograph had two modes, with the flow depth at the subsequent peak being higher than that at the preceding peak (Figure 8e,h). Therefore, the expansion of the extent of transversal erosion or the creation of an additional sediment supply during the event cannot be excluded [26,80]. However, the resistance structure formed in the preceding flood and its destruction in the subsequent flood, resulting in the release of the filling below the bed surface should also be considered [79]. These assumptions were compared with hysterical analyses of other rainstorm events that had the same two modes but lower or similar peak flows of subsequent floods (Figure 9a,c,g,j).
4.3. Implications and Limitations of Study
In the literature, the suspended load transport rate in a catchment was improved the most during the first year immediately after a fire and then gradually declined. Likewise, the bedload transport rate of the burned catchment (i.e., Ch.1 pulse value) was lower in the rainfall event of 2016 (3 years after the fire) than that in the rainfall event of 2014 (one year after the fire) (Figure 10a). However, the change was not as dramatic as the suspended load transport after the fire, and was consistent with field observations by Ryan and Dixon [26] and Ryan et al. [16] conducted in Boulder Creek, WY, USA (catchment area: 1970 ha). Regarding this, Ryan and Dixon [26] cited the lack of large-scale landslide or debris flow as the reason for the supply of coarse-grained sediment. Even if coarse-grained sediment was actually introduced upstream of a catchment, it would take a long time for it to reach the downstream measurement point. Changes in the bedload transport rate in post-fire monitoring of the burned catchment (catchment area: 30.8 ha) might have been observed due to the short travel distance of the pulses generated from the source area. In fact, in post-fire bedload observations in small test catchments of less than 117 ha, sediment production decreased with time as the slope coverage increased [27].
Meanwhile, the bedload transport rate was temporarily increased after the rainstorm on 17 August 2014 (RI = 3.4 y) in the unburned catchment, which did not cause much disturbance unlike that in the wildfire-affected catchment (Figure 10b). Regarding the bedload behavior of the unburned catchment, bed fluctuations during a rainstorm event were presumed to be the cause for the increase in sediment availability; however, field evidence to confirm this hypothesis is lacking. Taking into account the sediment regime changes before and after large-scale bed destruction (one and several orders of magnitude) reported by Lenzi et al. [76], Hicks and Basher [86], and Turowski et al. [39] the bedload behavior of unburned catchments was relatively small (one orders of magnitude). Moreover, no subsequent events were observed, such as landslides and debris flow, which often appear after the disturbance of riverbed structures [71,87,88]. Therefore, even if the change in the flow depth-bedload transport relation triggered by the rainstorm on 17 August 2014 was assumed to be a phenomenon caused by the destruction of the bed, it was presumably not large enough to cause the rearrangement of the bed morphology.
Although temporal changes in the flow depth-bedload transport relation were observed in the burned catchment, sediment regime changes before and after the wildfire could not be inferred without pre-fire data. Furthermore, owing to the missing data for 2015 and 2017, it was impossible to present the hydrologic and bedload behaviors of the entire monitoring period in a time series. Moreover, our understanding of the effect of logging on the sediment regime of the burned catchment was limited. Therefore, it is necessary to investigate the effect of wildfires through long-term time series data by continuing bedload monitoring of the burned catchment. During the process, additional studies should be conducted on the calibration for quantitative evaluation [42,43,45], signal attenuation [41,44,48], and protection measures of the monitoring system from external forces [89].
5. Conclusions and Recommendations
This study investigated the effect of changes in sediment supply conditions on bedload transport for 6 years after a fire through continuous hydrophone monitoring in small mountainous catchments in southern South Korea. In addition, the relationship between flow depth and bedload transport in the fire-disturbed catchment was compared with that in the unburned catchment. Monitoring revealed that despite the similar hysteric patterns in the relationship between flow depth and bedload transport between the two different mountainous catchments (fire-disturbed and undisrupted), the underlying mechanisms differed owing to differences in sediment supply conditions (ready-available sediments and supply-limited conditions) according to the catchment environment.
The bedload transport rates of burned catchments were improved mostly 1–2 years after the wildfire (early post-fire sediment regime). Three years after the occurrence of the wildfire, the bedload transport rate at the monitoring sites was somewhat decreased as the burned slopes were covered (late post-fire sediment regime). However, the change was not as dramatic as the suspended load transport after the fire reported in the literature. Following the occurrence of landslides, triggered 5 years after the wildfire, the bedload transport rates of burned catchments were increased by approximately one order of magnitude (post-landslide sediment regime). Sediment activity in wildfire-disturbed mountainous catchments was primarily decreased with the recovery of the ground-cover layer 1–3 years post-wildfire. However, it appeared to be reactivated through additional supply events, such as landslides. Therefore, forest restoration after a fire should be planned and implemented from a mid- to long-term perspective.
In addition, an increase in bedload transport rate was observed in the rainfall event after the rainstorm (RI = 3.4 y) on 17 August 2014 (May 2015–September 2018) even in undisturbed mountainous catchments (after the 17 August 2014 rainstorm event). This temporary change lasted for approximately 2 years until the rainstorm on 5 October 2018 (RI = 2.6 y). During this period, the bedload transport rate of the unburned catchment was increased by an order of magnitude compared with the previous one at a given flow depth. Between April 2019 through the rainfall events in September 2019 (after the October 5 rainstorm event), it returned to the state before the rainstorm on 17 August 2014 (July 2014–August 2014) (before the Aug 17 rainstorm event). In conclusion, the relationship between flow and bedload transport during the monitoring period showed large variability even in undisturbed mountainous catchments. Furthermore, surrogate monitoring using a hydrophone was useful in understanding the changes in bedload transport characteristics according to various supply conditions of the catchment by providing high-resolution field information on bedload transport in mountain rivers.
Supplementary Materials
The following supporting information can be downloaded at: https://www.mdpi.com/article/10.3390/f13111774/s1, Figure S1: View of slopes and valleys in the burned catchment burnt owing to a wildfire (10 March 2013); Figure S2: Hydrophone (L = 2.0 m), water level sensor, and pit sampler of the bedload monitoring system in the burned and unburned catchments; Figure S3: Cross-section of a transverse structure with a hydrophone system installed in the burned and unburned catchments; Figure S4: The setting upstream and downstream of the monitoring point after the August 2018 landslide in the burned catchment; Table S1: Summary of rainfall events occurring on study sediments during the monitoring period.
Author Contributions
Conceptualization, K.-H.L. and T.U.; methodology, K.-H.L. and T.U.; validation, K.-H.L., J.-P.S. and T.U.; formal analysis, K.-H.L.; investigation, K.-H.L. and J.-P.S.; writing—original draft preparation, K.-H.L. and T.U.; writing—review and editing, K.-H.L., T.U. and J.-P.S. All authors have read and agreed to the published version of the manuscript.
Funding
This research was funded by “Development of integrated technology for forecasting sediment-related disaster hazard”, grant number FE0400-2018-02.
Institutional Review Board Statement
Not applicable.
Informed Consent Statement
Not applicable.
Data Availability Statement
Data used in this study will be available upon request to corresponding author.
Acknowledgments
The authors thank for the support and field sampling performed by Cheong-Woon Ahn, Chul-Won Park, Yu-Geyong Jung, and Jeong-Geun Park.
Conflicts of Interest
The authors declare no conflict of interest.
References
- Swanson, F.J. Fire and Geomorphic Processes. In Proceedings of the Fire Regimes and Ecosystem Properties, Honolulu, HI, USA, 11–15 December 1979; pp. 401–420. [Google Scholar]
- Huffman, E.L.; Macdonald, L.H.; Stednick, J.D. Strength and Persistence of Fire-Induced Soil Hydrophobicity under Ponderosa and Lodgepole Pine, Colorado Front Range. Hydrol. Process. 2001, 15, 2877–2892. [Google Scholar] [CrossRef]
- MacDonald, L.H.; Huffman, E.L. Post-fire Soil Water Repellency: Persistence and Soil Moisture Thresholds. Soil Sci. Soc. Am. J. 2004, 68, 1729–1734. [Google Scholar] [CrossRef]
- Mayor, A.G.; Bautista, S.; Llovet, J.; Bellot, J. Post-fire Hydrological and Erosional Responses of a Mediterranean Landscape: Seven Years of Catchment-Scale Dynamics. Catena 2007, 71, 68–75. [Google Scholar] [CrossRef]
- Hubbert, K.R.; Wohlgemuth, P.M.; Beyers, J.L.; Narog, M.G.; Gerrard, R. Post-fire Soil Water Repellency, Hydrologic Response, and Sediment Yield Compared Between Grass-Converted and Chaparral Watersheds. Fire Ecol. 2012, 8, 143–162. [Google Scholar] [CrossRef]
- Rice, R.M. Sedimentation in the Chaparral: How Do You Handle Unusual Events? In Proceedings of the Sediment Budgets and Routing in Forested Basins, Corvallis, ON, USA, 31 May–1 June 1982; pp. 39–49. [Google Scholar]
- Benda, L.; Dunne, T. Stochastic Forcing of Sediment Supply to Channel Networks From Landsliding and Debris Flow. Water Resour. Res. 1997, 33, 2849–2863. [Google Scholar] [CrossRef]
- Cannon, S.H. Debris-Flow Generation from Recently Burned Watersheds. Environ. Eng. Geosci. 2001, 7, 321–341. [Google Scholar] [CrossRef]
- Meyer, G.A.; Pierce, J.L.; Wood, S.H.; Jull, A.J.T. Fire, Storms, and Erosional Events in the Idaho Batholith. Hydrol. Process. 2001, 15, 3025–3038. [Google Scholar] [CrossRef]
- May, C.L.; Gresswell, R.E. Processes and Rates of Sediment and Wood Accumulation in Headwater Streams of the Oregon Coast Range, USA. Earth Surf. Process. Landf. 2003, 28, 409–424. [Google Scholar] [CrossRef]
- Carabella, C.; Miccadei, E.; Paglia, G.; Sciarra, N. Post-wildfire Landslide Hazard Assessment: The Case of the 2017 Montagna Del Morrone Fire (Central Apennines, Italy). Geosciences 2019, 9, 175. [Google Scholar] [CrossRef]
- Moody, J.A.; Martin, D.A. Post-fire, Rainfall Intensity-Peak Discharge Relations for Three Mountainous Watersheds in the Western USA. Hydrol. Process. 2001, 15, 2981–2993. [Google Scholar] [CrossRef]
- Moody, J.A.; Martin, D.A. Initial Hydrologic and Geomorphic Response Following a Wildfire in the Colorado Front Range. Earth Surf. Process. Landf. 2001, 26, 1049–1070. [Google Scholar] [CrossRef]
- Reneau, S.L.; Katzman, D.; Kuyumjian, G.A.; Lavine, A.; Malmon, D.V. Sediment Delivery after a Wildfire. Geology 2007, 35, 151–154. [Google Scholar] [CrossRef]
- Cannon, S.H.; Gartner, J.E.; Wilson, R.C.; Bowers, J.C.; Laber, J.L. Storm Rainfall Conditions for Floods and Debris Flows from Recently Burned Areas in Southwestern Colorado and Southern California. Geomorphology 2008, 96, 250–269. [Google Scholar] [CrossRef]
- Ryan, S.E.; Dwire, K.A.; Dixon, M.K. Impacts of Wildfire on Runoff and Sediment Loads at Little Granite Creek, Western Wyoming. Geomorphology 2011, 129, 113–130. [Google Scholar] [CrossRef]
- Sheridan, G.J.; Lane, P.N.J.; Sherwin, C.B.; Noske, P.J. Post-fire Changes in Sediment Rating Curves in a Wet Eucalyptus Forest in SE Australia. J. Hydrol. 2011, 409, 183–195. [Google Scholar] [CrossRef]
- Rengers, F.K.; McGuire, L.A.; Oakley, N.S.; Kean, J.W.; Staley, D.M.; Tang, H. Landslides after Wildfire: Initiation, Magnitude, and Mobility. Landslides 2020, 17, 2631–2641. [Google Scholar] [CrossRef]
- Rathburn, S.L.; Shahverdian, S.M.; Ryan, S.E. Post-disturbance Sediment Recovery: Implications for Watershed Resilience. Geomorphology 2018, 305, 61–75. [Google Scholar] [CrossRef]
- Korean National Institute of Forest Science (NIFoS). Annual Report of Forest Disaster Prevention and Management; Korea National Institute of Forest Science: Seoul, Korea, 2021; p. 166. [Google Scholar]
- Lee, C.W.; Lee, C.Y.; Kim, J.H.; Youn, H.J.; Choi, K. Characteristics of Soil Erosion in Forest Fire Area at Kosung, Kangwondo. J. Korean For. Soc. 2004, 93, 198–204. (In Korean) [Google Scholar]
- Seo, J.I.; Chun, K.W.; Kim, S.W.; Kim, M.S. Rainfall Pattern Regulating Surface Erosion and Its Effect on Variation in Sediment Yield in Post-wildfire Area. J. Korean For. Sci. 2010, 99, 534–545. [Google Scholar]
- Florsheim, J.L.; Keller, E.A.; Best, D.W. Fluvial Sediment Transport Following Chaparral Wildfire; Ventura County: CA. Geol. Soc. Am. Bull. 1991, 103, 504–511. [Google Scholar] [CrossRef]
- Meyer, G.A.; Wells, S.G. Fire-Related Sedimentation Events on Alluvial Fans, Yellowstone National Park, U.S.A. J. Sediment. Res. 1997, 67, 776–791. [Google Scholar] [CrossRef]
- Malmon, D.V.; Reneau, S.L.; Katzman, D.; Lavine, A.; Lyman, J. Suspended Sediment Transport in an Ephemeral Stream Following Wildfire. J. Geophys. Res. 2007, 112, F02006. [Google Scholar] [CrossRef]
- Ryan, S.E.; Dixon, M.K. Spatial and Temporal Variability in Stream Sediment Loads Using Examples from the Gros Ventre Range, Wyoming, USA. In Gravel Bed Rivers VI: From Process Understanding to River Restoration; Habersack, H., Piegay, H., Rinaldi, M., Eds.; Elsevier: Amsterdam, The Netherlands, 2008; pp. 387–407. [Google Scholar]
- Wagenbrenner, J.W.; Robichaud, P.R. Post-fire Bedload Sediment Delivery across Spatial Scales in the Interior Western United States. Earth Surf. Process. Landf. 2014, 39, 865–876. [Google Scholar] [CrossRef]
- Warburton, J. Observations of Bed Load Transport and Channel Bed Changes in a Proglacial Mountain Stream. Arct. Alp. Res. 1992, 24, 195–203. [Google Scholar] [CrossRef]
- D’Agostino, V.; Lenzi, M.A. Bedload Transport in the Instrumented Catchment of the Rio Cordon: Part II. Catena 1999, 36, 191–204. [Google Scholar] [CrossRef]
- Lenzi, M.A.; D’Agostino, V.; Billi, P. Bedload Transport in the Instrumented Catchment of the Rio Cordon: Part I. Catena 1999, 36, 171–190. [Google Scholar] [CrossRef]
- Recking, A. Influence of Sediment Supply on Mountain Streams Bedload Transport. Geomorphology 2012, 175–176, 139–150. [Google Scholar] [CrossRef]
- Piton, G.; Recking, A. The Concept of Travelling Bedload and Its Consequences for Bedload Computation in Mountain Streams. Earth Surf. Process. Landf. 2017, 42, 1505–1519. [Google Scholar] [CrossRef]
- Moody, J.A. Sediment Transport Regimes after a Wildfire in Steep Mountainous Terrain. In Proceedings of the Seventh Federal Interagency Sedimentation Conference, Reno, NV, USA, 25–29 March 2001; pp. X-41–X-48. [Google Scholar]
- Mizuyama, T.; Fujita, M.; Nonaka, M. Measurement of Bed Load with the Use of Hydrophones in Mountain Torrents. In Erosion and Sediment Transport Measurement in Rivers: Technological and Methodological Advances; Bogen, J., Fergus, T., Walling, D.E., Eds.; IAHS Press: Wallingford, UK, 2003; Volume 283, pp. 222–227. [Google Scholar]
- Rickenmann, D. Bedload Transport Measurements with Geophones, Hydrophones, and Underwater Microphones (Passive Acoustic Methods). In Gravel-Bed Rivers: Processes and Disasters; Tsutsumi, D., Laronne, J.B., Eds.; John Wiley & Sons: Chichester, UK, 2017; pp. 185–208. [Google Scholar]
- Rickenmann, D. Bed-Load Transport Measurements with Geophones and other Passive Acoustic Methods. J. Hydraul. Eng. 2017, 143, 03117004. [Google Scholar] [CrossRef]
- Mizuyama, T.; Laronne, J.B.; Nonaka, M.; Sawada, T.; Satofuka, Y.; Matsuoka, M.; Yamashita, S.; Sako, Y.; Tamaki, S.; Watari, M.; et al. Calibration of a Passive Acoustic Bedload Monitoring System in Japanese Mountain Rivers. US Geol. Surv. Sci. Investig. Rep. 2010, 5091, 296–318. [Google Scholar]
- Rickenmann, D. Sediment Transport in Swiss Torrents. Earth Surf. Process. Landf. 1997, 22, 937–951. [Google Scholar] [CrossRef]
- Turowski, J.M.; Yager, E.M.; Badoux, A.; Rickenmann, D.; Molnar, P. The Impact of Exceptional Events on Erosion, Bedload Transport and Channel Stability in a Step-Pool Channel. Earth Surf. Process. Landf. 2009, 34, 1661–1673. [Google Scholar] [CrossRef]
- Uchida, T.; Sakurai, W.; Iuchi, T.; Izumiyama, H.; Borgatti, L.; Marcato, G.; Pasuto, A. Effects of Episodic Sediment Supply on Bedload Transport Rate in Mountain Rivers. Detecting Debris Flow Activity Using Continuous Monitoring. Geomorphology 2018, 306, 198–209. [Google Scholar] [CrossRef]
- Mao, L.; Dell’Agnese, A.; Huincache, C.; Penna, D.; Engel, M.; Niedrist, G.; Comiti, F. Bedload Hysteresis in a Glacier-Fed Mountain River. Earth Surf. Process. Landf. 2014, 39, 964–976. [Google Scholar] [CrossRef]
- Uchida, T.; Okamoto, A.; Hayashi, S.; Suzuki, T.; Fukumoto, A.; Yamashita, A.; Tagata, S. Hydrophone Observations of Bedload Transport in Mountainous Rivers of Japan. In Advances in River; Fukuoka, S., Nakagawa, H., Sumi, T., Zhang, H., Eds.; Sediment Research, Taylor & Francis Group: London, UK, 2013; pp. 1749–1796. [Google Scholar]
- Rickenmann, D.; Turowski, J.M.; Fritschi, B.; Wyss, C.; Laronne, J.B.; Barzilai, R.; Reid, I.; Kreisler, A.; Aigner, J.; Seitz, H.; et al. Bedload Transport Measurements with Impact Plate Geophones: Comparison of Sensor Calibration in Different Gravel-Bed Streams. Earth Surf. Process. Landf. 2014, 39, 928–942. [Google Scholar] [CrossRef]
- Dell’Agnese, A.; Mao, L.; Comiti, F. Calibration of an Acoustic Pipe Sensor through Bedload Traps in a Glacierized Basin. Catena 2014, 121, 222–231. [Google Scholar] [CrossRef]
- Wyss, C.R.; Rickenmann, D.; Fritschi, B.; Turowski, J.M.; Weitbrecht, V.; Boes, R.M. Laboratory Flume Experiments with the Swiss Plate Geophone Bed Load Monitoring System: 1. Impulse Counts and Particle Size Identification. Water Resour. Res. 2016, 52, 7744–7759. [Google Scholar] [CrossRef]
- Tsutsumi, D.; Fujita, M.; Nonaka, M. Transport Measurement with a Horizontal and a Vertical Pipe Microphone in a Mountain Stream: Taking Account of Particle Saltation. Earth Surf. Process. Landf. 2018, 43, 1118–1132. [Google Scholar] [CrossRef]
- Mizuyama, T.; Nonaka, M.; Nonaka, N. Observation of Sediment Discharge Rate Using a Hydrophone. J. Jpn. Soc. Eros. Control Eng. 1996, 49, 34–37. [Google Scholar] [CrossRef]
- Mizuyama, T.; Oda, A.; Laronne, J.B.; Nonaka, M.; Matsuoka, M. Laboratory Tests of a Japanese Pipe Geophone for Continuous Acoustic Monitoring of Coarse Bedload. US Geol. Surv. Sci. Investig. Rep. 2010, 5091, 319–335. [Google Scholar]
- Montgomery, D.R.; Buffington, J.M. Channel-Reach Morphology in Mountain Drainage Basins. Geol. Soc. Am. Bull. 1997, 109, 596–611. [Google Scholar] [CrossRef]
- Trask, P.D. Origin and Environmental of Source Sediments in Petroleum; Gulf Publishing Company: Houston, TX, USA, 1932; 324p. [Google Scholar]
- Wohl, E.E.; Anthony, D.J.; Madsen, S.W.; Thompson, D.M. A Comparison of Surface Sampling Methods for Coarse Fluvial Sediments. Water Resour. Res. 1996, 32, 3219–3226. [Google Scholar] [CrossRef]
- Bunte, K.; Abt, S.R. Sampling Surface and Subsurface Particle-Size Distributions in Wadable Gravel- and Cobble-Bed Streams for Analyses in Sediment Transport Hydraulics, and Streambed Monitoring; United States Department of Agriculture, Forest Service, Rocky Mountain Research Station: Fort Collins, CO, USA, 2001; p. 428. [Google Scholar] [CrossRef]
- Tsutsumi, D. Bedload Measurement Using Pipe Hydrophone. J. Jpn. Soc. Eros. Control Eng. 2019, 72, 36–39. (In Japanese) [Google Scholar] [CrossRef]
- Mizuyama, T.; Nonaka, M.; Fujita, M. Sediment Measurement with a Hydrophone at Tsunoura Karyu Sabo Dam in the Joganji River. J. Jpn. Soc. Eros. Control Eng. 2002, 55, 56–59. (In Japanese) [Google Scholar] [CrossRef]
- Mao, L.; Carrillo, R.; Escauriaza, C.; Iroume, A. Flume and Field-Based Calibration of Surrogate Sensors for Monitoring Bedload Transport. Geomorphology 2016, 253, 10–21. [Google Scholar] [CrossRef]
- Tsutsumi, D.; Nonaka, M.; Mizuyama, T.; Fujita, M.; Miyata, S.; Ichida, K. Comparison of responses from plate geophone and pipe hydrophone sensors for bed-load monitoring. Annu. Rep. Disaster Prev. Res. Inst. Kyoto Univ. 2014, 57, 385–390. (In Japanese) [Google Scholar]
- Laronne, J.B.; Reid, I.; Yitshak, Y.; Frostick, L.E. Recording Bedload Discharge in a Semiarid Channel, Nahal Yatir, Israel. In Erosion and Sediment Transport Monitoring Programmes in River Basins; International Association of Hydrological Sciences Publication: Wallingford, UK, 1992; Volume 210, pp. 79–96. [Google Scholar]
- Tsutsumi, D.; Nonaka, M.; Mizuyama, T.; Shida, M.; Ichida, K.; Miyata, S.; Fujita, M. Quantitative Observation of Bed-Load in Mountainous Streams by Hydrophone. Annu. Rep. Disaster Prev. Res. Inst. Kyoto Univ. 2013, 56, 465–471. (In Japanese) [Google Scholar]
- O’Louhlin, C.L.; Rowe, L.K.; Pearce, A.J. Sediment Yields from Small Forested Catchments North Westland–Nelson, New Zealand. J. Hydrol. 1978, 17, 1–15. [Google Scholar]
- Kuhnle, R.A. Bed Load Transport during Rising and Falling Stages on Two Small Streams. Earth Surf. Process. Landf. 1992, 17, 191–197. [Google Scholar] [CrossRef]
- Rickenmann, D. Bedload Transport and Discharge in the Erlenbach Stream. In Dynamics and Geomorphology of Mountain River. Lecture Note in Erath Sciences; Ergenzinger, P., Schmidt, K.H., Eds.; Springer: Berlin/Heidelberg, Germany, 1994; Volume 52, pp. 53–56. [Google Scholar] [CrossRef]
- Oda, A.; Hasegawa, Y.; Mizuyama, T.; Miyamoto, K.; Nonaka, M. The Application of Bed Load Measurements to Hydraulic Model Experiments Using the Hydrophone. J. Jpn. Soc. Eros. Control Eng. 2005, 58, 15–25. (In Japanese) [Google Scholar] [CrossRef]
- Goto, K.; Itoh, T.; Nagayama, T.; Kasai, M.; Marutani, T. Influences of Boundary Condition of Pipe on Acoustic Wave Deformation. J. Jpn. Soc. Eros. Control Eng. 2015, 68, 3–11. (In Japanese) [Google Scholar] [CrossRef]
- Iuchi, T.; Uchida, T.; Yoshimura, N.; Tsuruta, K.; Tanaka, Y.; Kanbara, J.; Sakurai, W. Flume Experiment Into the Influence of the Noise Due to Water Flow and Non-collision against the Pipe on Measurement of Sediment Discharge Using Hydrophone Data. J. Jpn. Soc. Eros. Control Eng. 2016, 69, 4–14. (In Japanese) [Google Scholar] [CrossRef]
- Suzuki, T.; Uchida, T.; Okamoto, A.; Takahashi, K.; Yamashita, S.; Kosuge, Y.; Fukumoto, A. Applicability of Bedload Observation Method Using Sound Pressure Data Obtained by a Hydrophone. J. Jpn. Soc. Eros. Control Eng. 2013, 66, 4–14. (In Japanese) [Google Scholar] [CrossRef]
- Oda, A.; Mizuyama, T.; Laronne, J.B.; Nonaka, M.; Matsuoka, M. Flume Experiments to Examine Hydrophone Characteristics. J. Jpn. Soc. Eros. Control Eng. 2008, 60, 66–71. (In Japanese) [Google Scholar] [CrossRef]
- Lloyd, C.E.M.; Freer, J.E.; Collins, A.L. Testing an improved index for analysing storm nutrient hysteresis. Hydrol. Earth Syst. Sci. Discuss. 2015, 12, 7875–7892. [Google Scholar] [CrossRef]
- Lloyd, C.E.M.; Freer, J.E.; Johnes, P.J.; Collins, A.L. Using Hysteresis Analysis of High-Resolution Water Quality Monitoring Data, Including Uncertainty, to Infer Controls on Nutrient and Sediment Transfer in Catchments. Sci. Total Environ. 2016, 543, 388–404. [Google Scholar] [CrossRef] [PubMed]
- Reid, I.; Frostick, L.E.; Layman, J.T. The Incidence and Nature of Bedload Transport during Flood Flows in Coarse-Grained Alluvial Channels. Earth Surf. Process. Landf. 1985, 10, 33–44. [Google Scholar] [CrossRef]
- Lenzi, M.A.; Marchi, L. Suspended Sediment Load during Floods in a Small Stream of the Dolomites (Northeastern Italy). Catena 2000, 39, 267–282. [Google Scholar] [CrossRef]
- Schuerch, P.; Densmore, A.L.; McArdell, B.W.; Molnar, P. The Influence of Landsliding on Sediment Supply and Channel Change in a Steep Mountain Catchment. Geomorphology 2006, 78, 222–235. [Google Scholar] [CrossRef]
- Kanbara, J. Sediment Dynamics in Tenryu River Upper Reaches and Its Future Theme. Int. J. Eros. Control Eng. 2013, 6, 23–29. [Google Scholar] [CrossRef][Green Version]
- Kennedy, R.; Yang, Z.; Gorelick, N.; Braaten, J.; Cavalcante, L.; Cohen, W.; Healey, S. Implementation of the LandTrendr Algorithm on Google Earth Engine. Remote Sens. 2018, 10, 691. [Google Scholar] [CrossRef]
- Shin, S.S.; Park, S.D.; Lee, K.S. Sediment and Hydrological Response to Vegetation Recovery following Wildfire on Hillslopes and the Hollow of a Small Watershed. J. Hydrol. 2013, 499, 154–166. [Google Scholar] [CrossRef]
- Martin, D.A.; Moody, J.A. The Flux and Particle Size Distribution of Sediment Collected in Hillslope Traps after a Colorado Wildfire. In Proceedings of the 7th Federal Interagency Sediment Conference, Reno, NV, USA, 25–29 March 2001. [Google Scholar]
- Lenzi, M.A.; Mao, L.; Comiti, F. Magnitude-Frequency Analysis of Bed Load Data in an Alpine Boulder Bed Stream. Water Resour. Res. 2004, 40, 1–12. [Google Scholar] [CrossRef]
- Rainato, R.; Mao, L.; García-Rama, A.; Picco, L.; Cesca, M.; Vianello, A.; Preciso, E.; Scussel, G.R.; Lenzi, M.A. Three Decades of Monitoring in the Rio Cordon Instrumented Basin: Sediment Budget and Temporal Trend of Sediment Yield. Geomorphology 2017, 291, 45–56. [Google Scholar] [CrossRef]
- Cannon, S.H.; Gartner, J.E. Wildfire-Related Debris Flow from a Hazards Perspective. In Debris-Flow Hazards and Related Phenomena; Springer: Berlin/Heidelberg, Germany, 2005; pp. 363–385. [Google Scholar] [CrossRef]
- Bunte, K. Experiences and Results from Using a Big-Frame Bed Load Sampler for Coarse Material Bed Load. In Hydrology in Mountainous Regions I. Hydrological Measurements; the water cycle; Lang, H., Musy, A., Eds.; IAHS Publication: Wallingford, UK, 1990; pp. 223–230. [Google Scholar]
- Bogen, J. Sediment Transport and Deposition in Mountain Rivers. In Sediment and Water Quality in River Catchments; Foster, I., Gurnell, A., Webb, B., Eds.; John Wiley & Sons: Chichester, UK, 1995; pp. 437–451. [Google Scholar]
- Gintz, D.; Hassan, M.A.; Schmidt, K.R. Frequency and Magnitude of Bedload Transport in a Mountain River. Earth Surf. Process. Landf. 1996, 21, 433–445. [Google Scholar] [CrossRef]
- Hassan, M.A.; Church, M.; Lisle, T.E.; Brardinoni, F.; Benda, L.; Grant, G.E. Sediment Transport and Channel Morphology of Small, Forested Streams. J. Am. Water Resour. Assoc. 2005, 41, 853–876. [Google Scholar] [CrossRef]
- Bogen, J. The Hysteresis Effect of Sediment Transport Systems. Nor. Geogr Geogr. Tidsskr. 1980, 31, 45–54. [Google Scholar] [CrossRef]
- Williams, G.P. Sediment Concentration versus Water Discharge during Single Hydrologic Events in Rivers. J. Hydrol. 1989, 111, 89–106. [Google Scholar] [CrossRef]
- Wohl, E.E. Mountain Rivers. Water Resources Monograph 14; American Geophysical Union: Washington, DC, USA, 2000; p. 320. [Google Scholar]
- Hicks, D.M.; Basher, L.R. The Signature of an Extreme Erosion Event on Suspended Sediment Loads: Motueka River Catchment, South Island, New Zealand. Sediment Dynamics in Changing Environments. IAHS Publ. 2008, 325, 184–191. [Google Scholar]
- Kasai, M.; Marutani, T.; Brierley, G.J. Patterns of Sediment Slug Translation and Dispersion following Typhoon-Induced Disturbance, Oyabu Creek, Kyushu, Japan. Earth Surf. Process. Landf. 2004, 29, 59–76. [Google Scholar] [CrossRef]
- Molnar, P.; Densmore, A.L.; McArdell, B.W.; Turowski, J.M.; Burlando, P. Analysis of Changes in the Step-Pool Morphology and Channel Profile of a Steep Mountain Stream following a Large Flood. Geomorphology 2010, 124, 85–94. [Google Scholar] [CrossRef]
- Izumiyama, H.; Uchida, T.; Iuchi, T.; Yoshimura, N.; Yamakoshi, T. A Calibration Method for Monitoring Bedload Transport Rate Using Japanese Pipe-Type Hydrophone Considering Installation Condition and Aging. In Proceedings of the 22nd EGU General Assembly, EGU2020, Online, 4–8 May 2020; Volume 12205. [Google Scholar] [CrossRef]


Publisher’s Note: MDPI stays neutral with regard to jurisdictional claims in published maps and institutional affiliations. |
© 2022 by the authors. Licensee MDPI, Basel, Switzerland. This article is an open access article distributed under the terms and conditions of the Creative Commons Attribution (CC BY) license (https://creativecommons.org/licenses/by/4.0/).