Abstract
This article presents a method, based on orbital remote sensing, to map the extent of forest plantations in São Paulo State (Southeast Brazil). The proposed method uses the random forest machine learning algorithm available on the Google Earth Engine (GEE) cloud computing platform. We used 30 m annual mosaics derived from Landsat-5 Thematic Mapper (TM) images and from Landsat-8 Operational Land Imager (OLI) images for the 1985 to 1995 and 2013 to 2021 time periods, respectively. These time periods were selected based on the planted areas’ rotation, especially the eucalypt’s short rotation. To classify the forest plantations, green, red, NIR, and MIR spectral bands, NDVI, GNDVI, NDWI, and NBR spectral indices, and vegetation, shade, and soil fractions were used for both sensors. These indices and the fraction images have the advantage of reducing the volume of data to be analyzed and highlighting the forest plantations’ characteristics. In addition, we also generated one mosaic for each fraction image for the TM and OLI datasets by computing the maximum value through the period analyzed, facilitating the classification of areas occupied by forest plantations in the study area. The proposed method allowed us to classify the areas occupied by two forest plantation classes: eucalypt and pine. The results of the proposed method compared with the forest plantation areas extracted from the land use and land cover maps, provided by the MapBiomas product, presented the Kappa values of 0.54 and 0.69 for 1995 and 2020, respectively. In addition, two pilot areas were used to evaluate the classification maps and to monitor the phenological stages of eucalypt and pine plantations, showing the rotation cycle of these plantations. The results are very useful for planning and managing planted forests by commercial companies and can contribute to developing an automatic method to map forest plantations on regional and global scales.
1. Introduction
Remote sensing techniques are useful tools for identifying and characterizing land use and land cover (LULC) classes and changes due to the synoptic view of large geographical regions associated with lower monetary costs when compared to other acquisition methods such as field campaigns. Traditionally, less attention has been given to time and, in particular, to the high-frequency dynamics of several LULC types such as forest plantations. The increasing availability of time series of orbital remote-sensing-derived images and the potential contribution of them to environmental management and conservation emphasizes the need for the development of specific approaches to properly deal with the unique nature and volume of these data [1].
Time-series analyses of orbital remote sensing data address the identification of LULC change patterns in time and space and the incorporation of vegetation seasonality and phenological cycle information in the analyses [2,3]. The maximum fraction images (vegetation, soil, and shade) have been successfully used for mapping LULC, especially in agricultural areas [4,5]. Many of these investigations have focused on local and regional scales, incorporating products derived from one or more orbital remote sensors. Such approaches can be adapted to monitor forest plantations, especially of eucalypt, which presents a short growth cycle varying from 6 to 8 years. Therefore, this cycle can be assessed when using time series derived from orbital remote sensing datasets.
The distribution of fast-growing eucalypt plantations across a large part of Brazil, based on the Moderate Resolution Imaging Spectroradiometer (MODIS) 250 m NDVI variations, was presented by Le Maire et al. [6]. They found that mapping short-rotation species such as eucalypt demands multiple images across the time and quality of spatial resolution to identify the patterns of forest stands and reduce mixed-pixel issues. For this, using linear spectral mixing models improves classification results using remote sensing data [7,8,9].
Qiao et al. [10] observed that although the spatial resolution of Landsat sensors has been improved compared to the MODIS NDVI product, it remained impractical to map eucalyptus plantations efficiently based on spectral or textural features at a higher spatial resolution. The reason is that, as an artificial forest, eucalypt has a unique growth cycle: the wood is harvested, and trees are regenerated or replanted for another growth cycle after several years. Thus, a method to identify short-rotation eucalypt plantations by exploring the changing pattern of vegetation indices due to tree crop rotation and spectral characteristics of eucalypt plantations at the specific wavelengths was presented by Deng et al. [11].
In 2020, 78% of the Brazilian planted area consisted of Eucalyptus species, and 18% consisted of pine [12]. São Paulo State, the one that contributes the most to the Brazilian economy, planted almost 18.1% of the eucalypt area in Brazil [12]. The planted forests of São Paulo State are considered not only an important source of income, but also an alternative for composing permanent preservation areas, legal reserves, and private natural heritage reserves. Therefore, the accurate identification of the planted forests in São Paulo State is necessary for their proper management and for developing special policies that contribute to environmental regulations in the existing areas.
In this context, the primary objective of this work is to present a method to assess the extent of eucalypt and pine plantation areas located in São Paulo State, Southeast Brazil, using annual Landsat Thematic Mapper (TM, 1985–1995) and Operational Land Imager (OLI, 2013–2021) sensors’ time-series images. In addition to multiannual mosaics of TM and OLI spectral bands, the proposed method also used spectral indices and fraction images derived from the linear spectral mixing model (LSMM) as input data.
2. Materials and Methods
2.1. Study Area
We have defined the state of São Paulo, located in Southeast Brazil, as the study area. São Paulo State has 248,209 km2 of extensions and is located between the parallels 19°5′ and 25° south and meridians 44° and 53°5′ west (Figure 1). The state has undergone several periods of intense land use and land cover changes (LULCC) marked by agriculture cycles. About 22.9% of the state territory was covered by native vegetation in 2020, whereas, during the last ten years, the net growth of vegetation was around 2140 km2 (4.9%) [13].
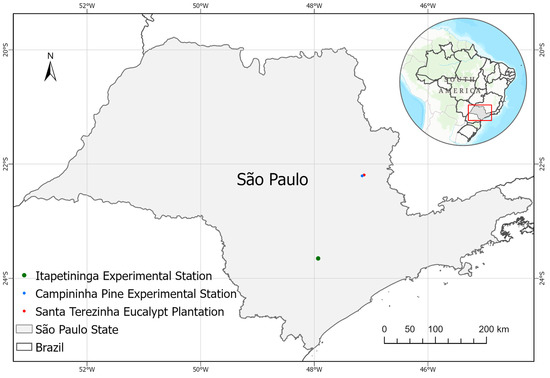
Figure 1.
Location of the study area, São Paulo State, within Brazil. The pilot areas are highlighted in the figure.
2.2. Pilot Areas
Two pilot areas were selected for phenological analysis of forest plantations, specifically, areas of Eucalyptus and Pinus species. The first one, inserted within the municipality of Mogi Guaçu, is located at 22°15′ S and 47°10′ W and is representative of pine and eucalypt plantations common in this region (Figure 2). This area includes the Campininha Pine Experimental Station of the Forestry Institute of São Paulo State (IFSP), the Santa Terezinha Eucalypt Plantation of the Sylvamo Company, and surrounding areas (Figure 1). The major Pinus species in Campininha are P. elliottii and P. taeda [14]. Other species such as P. caribaea, P. bahamensis, P. oocarpa, and P. palustris are also planted in small areas [8]. During the first study period (1985–1995), the eucalypt plantation, due to its commercial purpose, presented different phenological stages according to the rotation cycle with 8.5 years of average harvesting. The second study period (2013–2021) presented eucalypt plantations following several rotation cycles, whereas pine plantations were the same as in the previous study [9]. Therefore, pine plantations are older plantations.
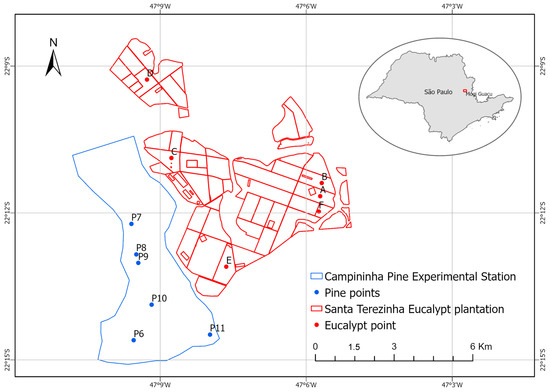
Figure 2.
Location of the pilot area within the municipality of Mogi Guaçu, in São Paulo State. The sample points are highlighted in the figure.
The second pilot area, the Itapetininga Experimental Station, is within the municipality of Itapetininga, located at 23°42′ S and 47°57′ W (Figure 3). This area is managed by the Fundação Florestal, a section of the São Paulo government. The area is composed of Pinus elliottii experimental stands and other species.
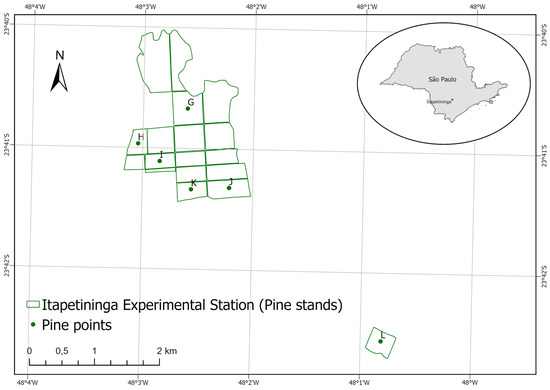
Figure 3.
Location of the pilot area within the municipality of Itapetininga, in São Paulo State. The sample points are highlighted in the figure.
2.3. Landsat TM and OLI Images
For this study, we used Landsat-5 Thematic Mapper (TM) and Landsat-8 Operational Land Imager (OLI) datasets. The characteristics of both sensors are widely available in the literature. We selected TM and OLI surface reflectance images and processed them in annual mosaics. The two time periods were defined to classify the forest plantations: 1985 to 1995 (TM) and 2013 to 2021 (OLI). In our classification, we used green (G), red (R), near-infrared (NIR), and middle infrared (MIR) bands for both time periods. We also performed the classification using the Normalized Difference Vegetation Index (NDVI, [15], Enhanced Vegetation Index (EVI, [16]), Green Normalized Difference Vegetation Index (GNDVI, [17]), Normalized Difference Water Index (NDWI, [18]) and Normalized Burn Ratio (NBR, [19]), as well as vegetation, soil, and shade fraction images derived from the linear spectral mixing model (LSMM, [9]).
2.4. Methodological Approach
Figure 4 shows the flowchart of the methodological approach developed in this work.
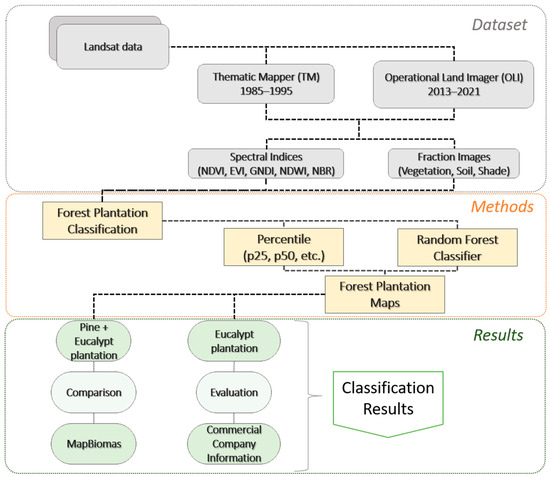
Figure 4.
Flowchart of the methodological approach.
2.4.1. Spectral Indices
The spectral indices used in this work are calculated using the equations presented in Table 1.

Table 1.
Spectral Index Equations.
2.4.2. Fraction Images
To obtain fraction images, we applied the LSMM [9], which assumes that pixel values are linear combinations of reflectance from many components inside the pixel, called endmembers:
where represents the spectral reflectance in the ith spectral band; is the spectral reflectance of the jth component in spectral band ith (endmember); is the proportion of the jth component within the pixel; and is the residual for the ith spectral band.
Fraction images can be used for mapping forest plantation areas due to the following characteristics: (a) vegetation fraction images highlight the forest cover conditions that are similar to vegetation indices such as the NDVI [12] and the EVI [17]; (b) shade fraction images highlight areas with low reflectance values such as water, shadow, and burned areas; and (c) soil fraction images highlight areas with high reflectance values such as bare soil. For forest cover, the shade fraction images are related to forest structure, i.e., the higher the shade fraction value, the more heterogeneous the forest cover. First, we applied the LSMM to the Landsat TM and OLI images for generating the fraction images of vegetation, soil, and shade endmembers for the 1985 to 1995 and 2013 to 2021 time periods. Following that, we built one image mosaic for each endmember composed of the maximum proportion values in the entire period analyzed.
The endmembers were collected following the visual interpretation of a water body, eucalypt plantation, and bare soil. The same endmembers were used for the entire study period, adjusting the values according to the sensors (TM and OLI). In that manner, maximum vegetation fraction mosaics were used to map the extent of forest plantations focusing on eucalypt plantations. Maximum soil fraction images were used to map the extent of forest and non-forest areas each year, and maximum shade fraction images were used to map the eucalypt and pine areas each year.
2.4.3. Classification of Forest Plantations
The classification of forest plantations in the state of São Paulo follows the eucalypt rotation [6]. To perform the classification, we used green (G), near-infrared (NIR), and middle-infrared (MIR) spectral bands; the NDVI, Green Normalized Difference Vegetation Index (GNDVI), Normalized Difference Water Index (NDWI), and Normalized Burn Ratio (NBR) indices; and soil, shade, and vegetation fractions for both time periods (TM for 1985–1995 and OLI for 2013–2021). To calculate the spectral indices, the bands of green, red, near-infrared, short-wave infrared 1, and short-wave infrared 2 were used according to the equations described in Table 1.
The time-series image compositions used as inputs in the classification were reduced using the algorithm “ee. Ghg reducer.percentile”, in which every time series is converted into percentile images. An example of this reduction is a single image of the entire time series composed for a given band, e.g., to calculate the 0 percentile (p0). The resulting image would be composed of the minimum values of the entire series for the 50th percentile (p50) and the resulting image would be composed of the median values of the entire series. The percentiles of each band used in the classification are presented in Table 2.
Table 2.
Percentiles of each band used in the classification.
The classifications were obtained by running a script developed using the random forest machine learning algorithm [20] on the Google Earth Engine (GEE) cloud computing platform.
2.5. Validation of the Classification
We performed a confusion matrix using the forest plantation class extracted from the MapBiomas annual LULC map collection 6.0 [21] for the years 1995 and 2020 as the reference product. We reclassified MapBiomas classes into only two classes: forest plantation and all the other LULC classes together (non-forest plantation). We created 20,000 stratified random points within each class based on the pixel classification. The stratified random points strategy is based on the proportional distribution to each relative area of the classes. Then, we generated a confusion matrix using MapBiomas LULC classes as the reference to estimate the accuracy of the classification results of the proposed method. MapBiomas classifications are also based on annual Landsat mosaics.
3. Results
3.1. Study Area
Figure 5 shows the classification of forest plantations for the first period (1985–1995) in the study area.
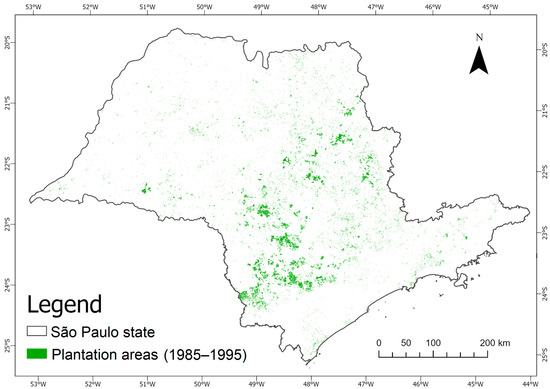
Figure 5.
Classification of plantation areas in the study area during the study period (1985–1995), based on the Landsat TM annual mosaics.
Figure 6 shows the classification of forest plantations for the second period (2013–2021) in the study area. The classification for the first period (1985–1995) presented an area of 5868.89 km2 of forest plantations, whereas the second period (2013–2021) presented 9874.85 km2, that is, an increase of 68.26% in forest plantation area between the two time periods. During both periods, 5554.00 km2 of forest plantation areas persisted.
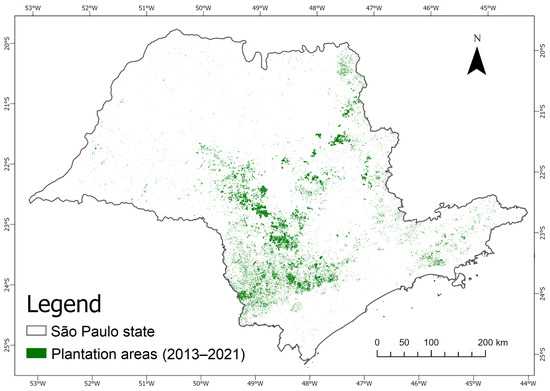
Figure 6.
Classification of plantation areas in the study area during the study period (2013–2021), based on the Landsat OLI annual mosaics.
For both periods of forest plantation classifications, we compared the results of the proposed method with the forest plantation class derived from the MapBiomas annual LULC map collection 6.0 [19] for the years of 1995 (Figure 7, Table 3) and 2020 (Figure 8, Table 4).
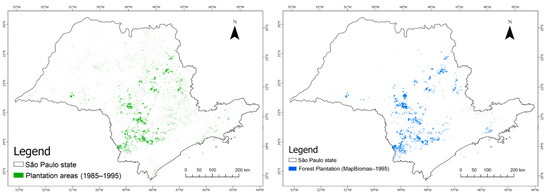
Figure 7.
Forest plantation areas obtained by the proposed method (left side) and forest plantation areas extracted from the MapBiomas product (right side) for 1995.
Table 3.
Confusion matrix for the forest plantation classification in 1995.
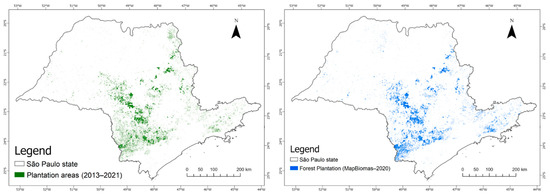
Figure 8.
Forest plantation areas obtained by the proposed method (left side) and forest plantation areas extracted from the MapBiomas product (right side) for 2020.
Table 4.
Confusion matrix for the forest plantation classification in 2020.
In Figure 7 and Figure 8, the visual similarity between the classifications obtained by the proposed method and the classification from MapBiomas products can be observed. The estimated areas for the proposed method are 5868.89 km2 and 9874.85 km2 in 1995 and 2020, respectively, and 4595.36 km2 and 10,025.26 km2 in 1995 and 2020 for MapBiomas. The overall accuracy and kappa value are 98.2% and 0.54 for 1995 and 97.7% and 0.69 for 2020. MapBiomas is a multidisciplinary network that reconstructs annual land use and land cover information from 1985 to the present for Brazil, based on a random forest algorithm applied to the Landsat archive using Google Earth Engine. MapBiomas maps five major classes: forest, non-forest natural formation, farming, non-vegetated areas, and water. These classes were broken into two sub-classification levels, leading to the most comprehensive and detailed mapping for the country at a 30 m pixel resolution. The average overall accuracy of the land use and land cover time series, based on a stratified random sample of 75,000 pixel locations, was 89%, ranging from 73 to 95% in the biomes [21].
- Eucalypt and Pine phenological assessment
We used Landsat TM and OLI mosaics to perform the LSMM for phenological assessment of eucalypt and pine plantations over the 1985–2021 time period. For eucalypt plantations, we selected six sample areas from the classification map. In Figure 9, we can observe the rotation cycle for the selected samples that is characteristic of eucalypt plantations, i.e., the soil fraction (high value) shows the beginning of the cycle, and vegetation (high values) shows the eucalypt cover during the growing phase. The eucalypt trees have fast-growing behavior if the roots are well developed, with a rapid increase in leaf area [11]. In this region, the rotation length for this species is around 6 years, but it may range from 4 to 8 years. After the species are harvested using clear-cut methods, the vegetation fraction drops. Therefore, the length rotation and the spectral responses were the main information used to identify the eucalypt plantation in the study area. Since we used only TM and OLI, there is a lack of data in 2012 (none of these sensor images were available). These phenological curves refer to the field data of the pilot area described in Table 5.
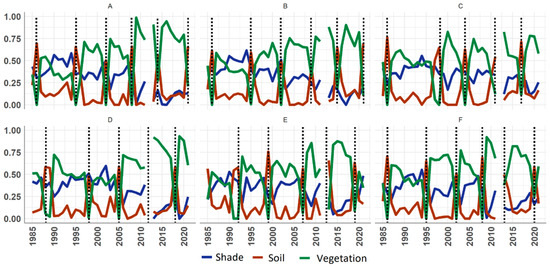
Figure 9.
Phenological assessment of eucalypt plantation samples (A–F) for 1985–2021 period based on the vegetation, soil, and shade fraction-image time series.
Table 5.
Eucalyptus rotation cycles according to field data for each selected point in the pilot area.
For pine plantations, one area was selected in the Itapetininga Experimental Station (Forestry Institute of São Paulo State—IFSP). In Figure 10, which comprises a long time series of 35 years, for the points J, K, and L, in 1985 the proportion of soil fraction was higher, suggesting the beginning of the cycle, followed by vegetation and shade fractions, increased. The same pattern was observed in the higher proportion of shade fraction due to Pinus sp. canopy cover. Then, in 2017 the soil fraction was higher again, marked by the harvesting. This was validated by the official document of forest harvesting (Process FF 296/2019—NIS 2132618).
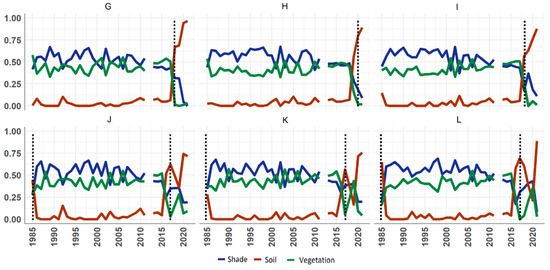
Figure 10.
Phenological assessment of Pinus elliottii plantations samples (G–L) in the Itapetininga Experimental Station area during the 1985—2021 period based on the fraction-image time series.
Analyzing these results, it is possible to identify eucalypt and pine plantation areas through the areas classified. For eucalypt, it is also possible to detect the planted dates of the stands according to the fraction-image time series.
3.2. Pilot Area
- Eucalypt and Pine plantation classifications
Figure 11A shows the classification of eucalypt plantation areas using 30 m Landsat TM mosaics composed of the maximum vegetation fraction values during the 1985–1995 period. The Santa Terezinha Eucalypt Plantation is an older site with historical eucalypt growth cycles. As observed from Figure 11, the classification for the first period performed well in this pilot area, accurately detecting the forest plantation. Figure 11B shows the median image composition of fraction images where it is possible to observe the high proportion of vegetation fraction (green) in the eucalypt area. Additionally, the Campininha Pine Experimental Station was highlighted with a higher proportion of shade fraction (blueish), representing the spectral response of pine to the fraction images due to its canopy cover, and also low standard deviation for all fractions throughout the study period because of the weak seasonality compared with the eucalypt plantation.
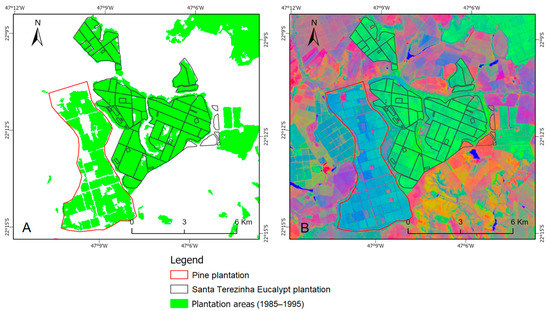
Figure 11.
(A) Classification of forest plantation areas in the pilot area during the first study period (1985–1995), based on the TM mosaic of maximum vegetation fraction values. (B) Median image RGB composition of soil (R), vegetation (G), and shade (B) fraction images for 1985–1995 time period.
In opposition, Figure 12 shows the classification of eucalypt plantation areas from 2013 to 2021 using the 30 m Landsat OLI mosaics composed of the maximum vegetation fraction values. Since this classification uses multiple images for a time series, the Campininha Pine Experimental Station had been harvested and was in a transition stage. Therefore, the classification did not map these areas as forest plantations as expected. On the other hand, the Santa Terezinha site still presents the rotation cycles of eucalypt plantations in the same location.
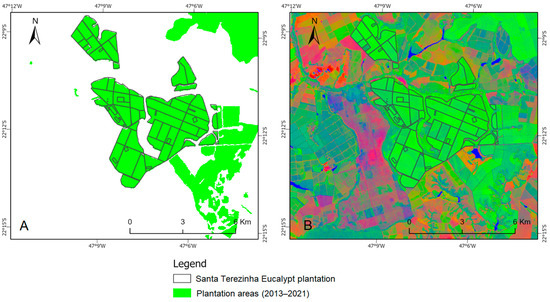
Figure 12.
(A) Classification of forest plantation areas in the pilot area during the second study period (2013–2021), based on the OLI mosaics. (B) Median image RGB composition of soil (R), vegetation (G), and shade (B) fraction images for 2013–2021 time period.
- Eucalypt and Pine phenological assessment
Figure 13 shows the phenological assessment of different points of eucalypt plantations based on the fraction-image time series. The eucalypt rotation is well defined by harvested times and characterized by a high soil-fraction proportion (Figure 13A,B,F). In Figure 13C, the fraction images show that the area was harvested in 1986 (high soil fraction), followed by regrowth (starting the vegetation fraction in the following years). In the first two years after planting, the vegetative vigor has a high increase, which is a characteristic of eucalypt. This result corroborates with the literature findings that mapped short-rotation eucalypt plantations in Brazil and presented a high vegetative response only a few years after planting [6].
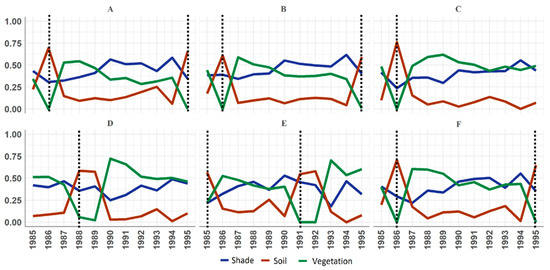
Figure 13.
Phenological assessment of eucalypt plantation during the 1985–1995 period based on the fraction-image time series and forest plantation rotation for six samples (A–F), as shown in Figure 2.
For pine, the time series shows that the vegetation-, shade-, and soil-fraction proportions were constant while the plantation was established (Figure 14). Therefore, this area represents the pine plantations which have longer rotation cycles when compared with the eucalypt plantations. Therefore, at the Campininha Pine Experimental Station, we could not detect the Pinus rotation cycle, since the plantation rotation of pine is longer than 10 years (time series of images used in this work). The pine rotation of 18–20 years and the eucalypt rotation of 5–6 years [11] supports our findings.
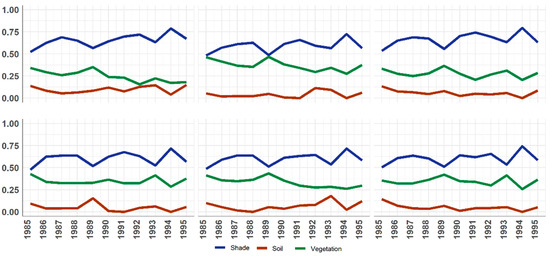
Figure 14.
Phenological assessment of pine plantation in the pilot area during the 1985–1995 period based on the median fraction-image time series for six samples, as shown in Figure 2.
Figure 15 shows the phenological assessment of point A in the Santa Terezinha Eucalypt Plantation based on the median fraction-image time series from OLI mosaics. For this plot (A), the area was harvested in 2014 (high soil fraction), followed by regrowth (starting to increase the vegetation fraction in the following years) with a peak vegetation fraction two years later, and then harvested again in 2021. The full rotation cycle occurred over 6 years and 4 months according to the field data, which were accurately detected by the fraction-image time series.
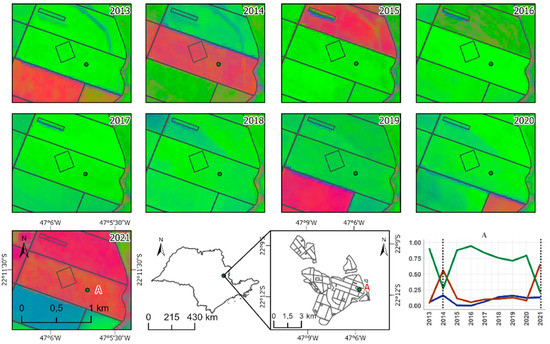
Figure 15.
RGB image composition of soil (R), vegetation (G), and shade (B) for the 2013–2021 time period, based on the fraction-image time series.
For the selected points, we presented the phenological assessment demonstrating the years of harvesting and planting, detected by the annual median fraction images derived from OLI mosaics (Figure 16). The median fraction images used to detect the eucalypt rotations were validated by field data provided by a commercial company (Table 5). When a plot was harvested, the soil fraction presents a higher proportion than the vegetation fraction. At this time, all the phenological assessments were validated with field data.
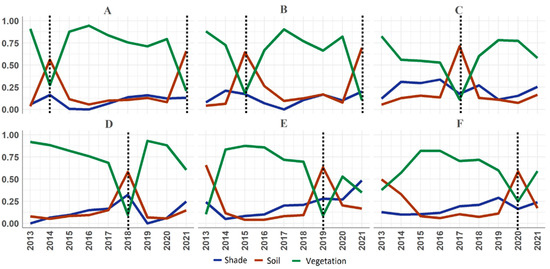
Figure 16.
Phenological assessment of eucalypt plantation in the pilot area during the 2013–2021 time period, based on the fraction-image time series. We can observe the eucalypt rotation cycle for the six analyzed sample plots (A–F), as shown in Figure 3.
For pine, the time series of the 2013–2021 period shows that these areas are in a land cover transition with a predominance of soil (probably due to replanting the pine stands). Therefore, this area does not represent the pine plantations for the 2013–2021 time period.
4. Discussion
This work proposed a new method to classify the extension of forest plantations in the São Paulo State. It is based on the eucalypt and pine plantations’ rotation cycles that require multiannual sensor images, as provided by the Landsat time series. The results showed that an eucalypt plantation has a rotation cycle of around 6 years for commercial application. For pine, it was not possible to define the growth cycle since the area analyzed was in the experimental area of the Forestry Institute of São Paulo State. These results were validated in the pilot areas, where the ground-truth data was made available by the commercial company. The study of rotation cycles was performed by analyzing the time series of the vegetation, soil, and shade fraction images, as described earlier. These profiles allow us to identify the eucalypt and pine plantations through the study area based on their rotation characteristics.
According to le Maire et al. [6], a classification using only one annual time series may classify the eucalypt plantations as “evergreen broadleaf forest”, “bare ground/low vegetation cover”, or “deciduous forest” because of clear-cuts. Our work showed that the eucalypt plantation areas during the study period were represented by eucalypt cover, bare soil due to clear-cuts, or new plantations in the initial stage. Therefore, our proposed method was able to map the areas occupied by eucalypt and pine plantations.
The resulting maps showed the forest plantation areas for the study periods (1985–1995 and 2013–2021), i.e., the mapped areas were occupied by forest plantations during the whole period. It can be observed that the methodology allowed us to detect the different phenological stages of these forest plantations, especially eucalypt plantations during the study period (Figure 17). In addition, it can be seen that the maximum vegetation, shade, and soil fraction images (Figure 18) highlighted the whole area occupied by forest plantations, helping to classify these areas.
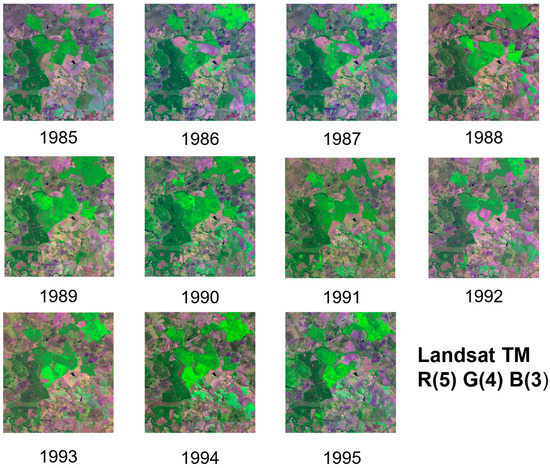
Figure 17.
Landsat TM dataset (1985–1995) over the pilot area.
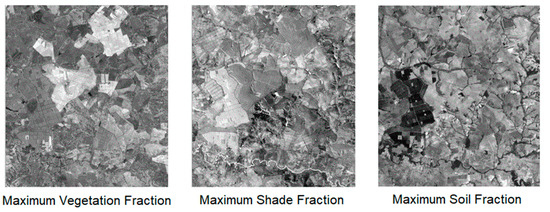
Figure 18.
Maximum (vegetation, shade, soil) fraction images derived from TM time series (1985–1995).
When compared with the MapBiomas forest plantation class, there is a visual agreement, but a kappa of 0.54 and 0.69 for the 1985–1995 and 2013–2021 time periods, respectively. The importance of a time-series analysis for eucalypt plantations is shown by Le Maire et al. [6] and Deng et al. [11] via MODIS NDVI images, and by Qiao et al. [10] via Landsat NDVI images. In our study, the vegetation, soil, and shade fraction images were able to highlight the eucalypt and pine plantations during the study periods, helping to classify these areas.
5. Conclusions
The Landsat TM and OLI mosaics composed of the maximum vegetation fraction values accurately highlighted the areas occupied by forest plantations during the two study periods (1985–1995 and 2013–2021) in São Paulo State. In addition, the annual and the maximum TM shade fraction images highlighted the areas that were occupied by pine plantations. These areas showed a higher shade proportion (due to the canopy structure) than eucalypt plantations in the pilot area during the 1985–1995 time period. The phenological stages of eucalypt plantations were observed in the annual time series of the three fraction images (vegetation, shade, and soil). For pine plantations, the phenological stages were not observed because these areas presented old-growth trees. On the other hand, for eucalypt plantations, the TM time series analyzed in this work was adequate to cover the rotation cycles, whereas for pine, a longer time series is required for analyzing its rotation cycles.
Considering the difficulty of mapping forest plantations according to the tree species using remote sensing, this paper aims to contribute different methods for the classification and identification of rotation cycles. For this reason, these results are very useful for planning and management, especially for private and government organizations, and for helping to develop an automatic method to map forest plantation areas on regional and global scales.
Author Contributions
Conceptualization, Y.E.S., E.A., G.M.d.S. and G.M.; methodology, Y.E.S., E.A., G.M.d.S., G.M., A.C.D. and H.L.G.C.; writing—original draft preparation, Y.E.S., E.A., G.M.d.S., G.M. and H.L.G.C.; writing—review and editing, Y.E.S., E.A., G.M.d.S., H.L.G.C., A.C.D., V.D., P.R.M., D.S.F. and L.R.J. All authors have read and agreed to the published version of the manuscript.
Funding
This work was supported and founded by the São Paulo Research Foundation (FAPESP, grant 2019/19371-5), the Brazilian National Council for Scientific and Technological Development (CNPq, grant 303299/2018-5), and the Improvement of Higher Education Personnel (CAPES, financing code 001). H.L.G.C. and G.M. also thank FAPESP (grants 18/14423-4 and 2019/25701-8, respectively).
Institutional Review Board Statement
Not applicable.
Informed Consent Statement
Not applicable.
Data Availability Statement
All data and code used in the current study are available from the corresponding author on reasonable request.
Acknowledgments
The authors are grateful to the Sylvamo Company for providing the field data and Instituto Nacional de Pesquisas Espaciais (INPE) for research support.
Conflicts of Interest
The authors declare no conflict of interest.
References
- McCloy, K.R. Development and Evaluation of Phenological Change Indices Derived from Time Series of Image Data. Remote Sens. 2010, 2, 2442–2473. [Google Scholar] [CrossRef]
- Lunetta, R.S.; Knight, J.F.; Ediriwickrema, J.; Lyon, J.G.; Worthy, L.D. Land-cover change detection using multi-temporal MODIS NDVI data. Remote Sens. Environ. 2006, 105, 142–154. [Google Scholar] [CrossRef]
- Wardlow, B.D.; Kastens, J.H.; Egbert, S.L. Using USDA crop progress data for the evaluation of greenup onset date calculated from MODIS 250-meter data. Photogramm. Eng. Remote Sens. 2006, 72, 1225–1234. [Google Scholar] [CrossRef]
- Arai, E.; Sano, E.E.; Dutra, A.C.; Cassol, H.L.G.; Hoffmann, T.B.; Shimabukuro, Y.E. Vegetation fraction images derived from PROBA-V data for rapid assessment of annual croplands in Brazil. Remote Sens. 2020, 12, 1152. [Google Scholar] [CrossRef]
- Cassol, H.L.G.; Arai, E.; Eyji Sano, E.; Dutra, A.C.; Hoffmann, T.B.; Shimabukuro, Y.E. Maximum Fraction Images Derived from Year-Based Project for On-Board Autonomy-Vegetation (PROBA-V) Data for the Rapid Assessment of Land Use and Land Cover Areas in Mato Grosso State, Brazil. Land 2020, 9, 139. [Google Scholar] [CrossRef]
- le Maire, G.; Dupuy, S.; Nouvellon, Y.; Loos, R.A.; Hakamada, R. Mapping short-rotation plantations at regional scale using MODIS time series: Case of eucalypt plantations in Brazil. Remote Sens. Environ. 2014, 152, 136–149. [Google Scholar] [CrossRef]
- le Maire, G.; Marsden, C.; Nouvellon, Y.; Grinand, C.; Hakamada, R.; Stape, J.-L.; Laclau, J.-P. MODIS NDVI time-series allow the monitoring of Eucalyptus plantation biomass. Remote Sens. Environ. 2011, 115, 2613–2625. [Google Scholar] [CrossRef]
- Busetto, L.; Meroni, M.; Colombo, R. Combining medium and coarse spatial resolution satellite data to improve the estimation of sub-pixel NDVI time series. Remote Sens. Environ. 2008, 112, 118–131. [Google Scholar] [CrossRef]
- Shimabukuro, Y.E.; Smith, J.A. The Least-Squares Mixing Models to Generate Fraction Images Derived From Remote Sensing Multispectral Data. IEEE Trans. Geosci. Remote Sens. 1991, 29, 16–20. [Google Scholar] [CrossRef]
- Qiao, H.; Wu, M.; Shakir, M.; Wang, L.; Kang, J.; Niu, Z. Classification of Small-Scale Eucalyptus Plantations Based on NDVI Time Series Obtained from Multiple High-Resolution Datasets. Remote Sens. 2016, 8, 117. [Google Scholar] [CrossRef]
- Indústria Brasileira de Árvores. Relatório Anual IBÁ 2021. In Relatório Anual IBÁ. Available online: https://www.iba.org/datafiles/publicacoes/relatorios/relatorioiba2021-compactado.pdf (accessed on 3 August 2022).
- Deng, X.; Guo, S.; Sun, L.; Chen, J. Identification of Short-Rotation Eucalyptus Plantation at Large Scale Using Multi-Satellite Imageries and Cloud Computing Platform. Remote Sens. 2020, 12, 2153. [Google Scholar] [CrossRef]
- Instituto Florestal. Inventário Florestal da Vegetação Natural do Estado de São Paulo—Mapeamento da Cobertura Nativa. 2020. Available online: https://smastr16.blob.core.windows.net/home/2020/07/inventarioflorestal2020.pdf (accessed on 4 August 2022).
- Shimabukuro, Y.E.; Hernandez Filho, P.; Koffler, N.F.; Chen, S.C. Automatic Classification of Reforested Pine and Eucalyptus Using Landsat Data. Photogramm. Eng. Remote Sens. 1980, 46, 209–2016. [Google Scholar]
- Rouse, J.W.; Haas, R.H.; Schell, J.A.; Deering, D.W. Monitoring vegetation systems in the great plains with Earth Resources Technology (ERTS) Satellite. In Proceedings of 3rd Earth Resources Technology Satellite Symposium, Greenbelt, MD, USA, 10–14 December 1974. [Google Scholar]
- Liu, H.Q.; Huete, A. A feedback based modification of the NDVI to minimize canopy background and atmospheric noise. IEEE Trans. Geosci. Remote Sens. 1995, 33, 457–465. [Google Scholar] [CrossRef]
- Gitelson, A.A.; Kaufman, Y.J. MODIS NDVI Optimization To Fit the AVHRR Data Series—Spectral Considerations. Remote Sens. Environ. 1998, 66, 343–350. [Google Scholar] [CrossRef]
- Gao, B. NDWI—A normalized difference water index for remote sensing of vegetation liquid water from space. Remote Sens. Environ. 1996, 58, 257–266. [Google Scholar] [CrossRef]
- Key, C.; Benson, N. Landscape Assessment: Remote Sensing of Severity, the Normalized Burn Ratio; and Ground Measure of Severity, the Composite Burn Index. In FIREMON: Fire Effects Monitoring and Inventory System; RMRS-GTR; USDA Forest Service, Rocky Mountain Research Station: Ogden, UT, USA, 2005. [Google Scholar]
- Teluguntla, P.; Thenkabail, P.S.; Oliphant, A.; Xiong, J.; Gumma, M.K.; Congalton, R.G.; Huete, A. A 30-m landsat-derived cropland extent product of Australia and China using random forest machine learning algorithm on Google Earth Engine cloud computing platform. ISPRS J. Photogramm. Remote Sens. 2018, 144, 325–340. [Google Scholar] [CrossRef]
- Souza, C.M., Jr.; Z. Shimbo, J.; Rosa, M.R.; Parente, L.L.; A. Alencar, A.; Rudorff, B.F.T.; Hasenack, H.; Matsumoto, M.; G. Ferreira, L.; Souza-Filho, P.W.M.; et al. Reconstructing Three Decades of Land Use and Land Cover Changes in Brazilian Biomes with Landsat Archive and Earth Engine. Remote Sens. 2020, 12, 2735. [Google Scholar] [CrossRef]
Publisher’s Note: MDPI stays neutral with regard to jurisdictional claims in published maps and institutional affiliations. |
© 2022 by the authors. Licensee MDPI, Basel, Switzerland. This article is an open access article distributed under the terms and conditions of the Creative Commons Attribution (CC BY) license (https://creativecommons.org/licenses/by/4.0/).