Abstract
Stand tending using glyphosate to promote coniferous overstory trees has been a common practice in the boreal forests of Alberta. However, there are concerns about the impact of this practice on biodiversity of understory species. This study examined the impact of broadcast glyphosate application during the active reforestation phase, two to several years post-harvest, on forest plant diversity 25 to 40 years post-harvest. Herbicide treatments had the desired effect of shifting tree layer dominance from deciduous to coniferous species, driven by a 25-fold reduction in the density of trembling aspen (3927 vs. 154 stems·ha−1, untreated and treated, respectively). However, understory plant diversity was not significantly different between treated and untreated sites as examined by the Shannon–Wiener (H) and evenness (E) indices. Shared plant species (beta) across sites was high. Of the seven site-indicator species examined, three had significantly lower cover on treated sites: Wild sarsaparilla, low bush-cranberry and oak fern. Total understory plant cover was significantly greater in the treated portion (98.0%) versus untreated (71.4%); however, this difference was not significant when bryophytes were excluded in the analysis. The establishment, maintenance and monitoring of larger long-term trials is strongly recommended.
1. Introduction
The application of glyphosate herbicide in stand tending treatments serves to shift overstory species composition and substantially increases the growth of desired tree species [1,2,3]. In 2018, glyphosate was used on 99.25% of all areas treated with herbicide for reforestation in Canada and 89.6% in Alberta [4]. The use of herbicides for reforestation is a contentious issue with plant biodiversity of particular concern [5,6,7]. There is evidence that glyphosate use affects regenerating northern forests by reducing non-conifer vegetation in the short term (two to five years), followed by longer-term changes to conifer stocking and site quality [8]. While there is an abundance of information in the literature on the short-term herbicide effects on biodiversity and wood fibre production early in the reforestation cycle [9,10,11,12], there is substantially less information on the longer-term effects.
The most extensive examination of longer-term effects of forest herbicide use on wood fibre production and biodiversity is the Austin Pond study in Maine, USA. Initiated in 1977, this study was the first operational-scale trial of glyphosate for stand tending purposes in the world. Forty years following aerial application of glyphosate, triclopyr or phenoxyacetic acid herbicides there was no evidence of a lasting effect on ground vegetation cover, richness or diversity [13]. In Alberta, Comeau and Fraser (2018) found that glyphosate did not affect vascular plant species richness 11 years post-treatment [14], and that a single application of glyphosate in the first growing season yielded higher Simpson and Shannon diversity index values than the control or a similar application following the first growing season. In northeastern British Columbia, Boateng and others (2000) reported reduced shrub cover 10 years following broadcast glyphosate application [15], which resulted in increased structural diversity and species richness of non-woody vascular plants compared to the non-treated control. Spot treatment with glyphosate did not significantly affect structural diversity or species richness. In an assessment 15 years following treatment, Hauessler and others (2004) found that vegetation in areas spot-treated with glyphosate tended to converge with vegetation in areas that received similar silvicultural treatments without glyphosate (i.e., brushsaw) [16].
The aim of the current investigation is to examine the impact of glyphosate used for vegetation management in Alberta during the active reforestation phase, two to several years post-harvest, on the diversity of understory plants at mid-rotation. We make use of a herbicide monitoring program that was established in Alberta in the 1990′s that was established to assess the impact of herbicide treatments on plant diversity and aspen as a crop species. From a total of the initial 55 herbicide monitoring sites, 12 were selected for assessment in 2002 for the impact of herbicide treatment on tree composition and volume [17]. Revisiting the plots established in 2002 offers an opportunity to investigate the impact of glyphosate treatments on understory plants 25 to 40 years post-harvest.
Our study objectives were to: (1) compare the understory plant diversity within untreated and treated portions of these units, and (2) compare the stem density and overall structure of trees within untreated and treated portions. Outcomes from these objectives, particularly the former, will provide information to fill an important knowledge gap in our understanding of the long-term effects of forest herbicides used in the western boreal forest.
2. Materials and Methods
2.1. Study Sites
In 2019, we revisited the twelve units assessed in the 2002 investigation (Table 1). The study sites were in the Lower Foothills Natural Subregion of west-central Alberta [18], near the communities of Whitecourt, Drayton Valley, and Manning. Plots are in cutblocks treated with herbicides that included a minimum one-hectare untreated area. The dominant overstory tree species prior to harvest were aspen, white spruce (Picea glauca (Moench) Voss) and lodgepole pine (Pinus contorta Dougl. ex Loud. var. latifolia Engelm.). The study sites were primarily located on “e” ecosites, characterized by a mesic moisture regime and medium nutrient regimes, or on “f” ecosites, characterized by mesic to subhygric moisture regimes and rich nutrient regimes [19].

Table 1.
Study sites included in the 2019 and 2002 assessments. Sites in which a significant portion of the untreated area was disturbed were excluded from the 2019 assessment (“NA”). Sw = white spruce (Picea glauca (Moench) Voss) and Pl = lodgepole pine (Pinus contorta Dougl. ex Loud. var. latifolia Engelm.).
Four sites in which a significant portion of the untreated area was disturbed since 2002 were excluded from the 2019 assessment. All eight study sites were actively reforested, including introduction of coniferous tree propagules, and frequently supplemented by mechanical site preparation and competition management using glyphosate herbicide. In some cases, follow up or remedial silvicultural treatment was required. Follow-up treatments included aerial broadcast glyphosate application, aerial patch (or “highlight”) glyphosate application, and basal bark application of triclopyr.
2.2. Experimental Design
With the exception of site 2, the eight study sites were selected from those in the Alberta herbicide monitoring program established in the 1990s. Alberta Herbicide Monitoring installations were established using the following criteria:
- Installations were placed in cutblocks that were uniform, including
- Uniformity in the site across treated and untreated areas;
- Uniformity in harvesting and silvicultural treatment across treated and untreated areas, with the exception of herbicide application;
- The untreated portion was at least 1 ha in size;
- The untreated portion was buffered from herbicide treatment with buffer width dependent on the method of herbicide application;
- Buffer areas were not included in the measurement portion of the untreated reference area.
2.3. Field Sampling
Within study sites, plots were established in 2002 in clusters of five per treatment (Figure 1a). A random selection of three plots from each cluster were measured in August and September of 2019. We separately assessed the composition and abundance of the overstory tree layer at all plots. Shrubs and herbaceous plants were identified to the species level, identifying unknown willow species by genus (Salix spp.) and unknown grass species as “grass.” We broadly identified bryophytes according to the substrate they occupied (rock, wood, forest floor or peat), and broadly identified lichens according to their morphological form (crust, scale, leaf, club, shrub or hair).
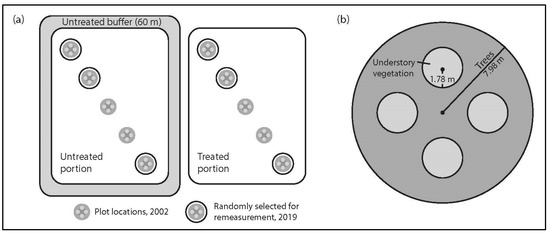
Figure 1.
Plot design: (a) random selection of three plots from the five established in 2002; (b) subplot layout within each plot for non-tree vegetation, tree, sapling and tree regeneration data collection.
Tree level data including species, diameter at breast height (DBH) and condition was collected on trees > 5.0 cm DBH from within a main circular plot of 7.98 m radius (0.02 ha) (Figure 1a). We measured understory vascular plants, bryophytes and lichen in four 1.78 m radius subplots located within each main plot. Each subplot was centred 3.99 m from the main plot centre in each of four cardinal directions (Figure 1b). Cover was estimated to the nearest 1% for each subplot.
2.4. Statistical Analysis
2.4.1. Overstory Vascular Plant Diversity and Dominance
All live trees ≥ 1.3 m in height and >5.0 cm DBH within each plot were summarized by species and major species group. We calculated average tree density (stems·ha−1) by species and major groups (i.e., coniferous or deciduous) for both treated and untreated sites. Tree density was calculated as the sum of tree factors (the number of stems represented by each sampled tree) by species and species group for each plot. Overstory species diversity was assessed using Shannon–Wiener and evenness indices based on the basal area composition of all trees ≥ 1.3 m in height. Structural diversity of the overstory was evaluated based on the proportion of basal area by DBH class (horizontal diversity) and height class (vertical diversity) using Shannon’s index [20]. We also evaluated the overstory structural differences in tree size using Quadratic Mean Diameter (QMD), a commonly used measure that combines tree density and basal area distribution as per Equation (1):
where B is the stand basal area (m2·ha−1), N represents stems·ha−1, and k is a constant that equals 0.0000785 based on the measurement units.
2.4.2. Understory Plant Diversity
We compared the understory plant cover in the treated and non-treated areas using Shannon-Wiener and evenness indices, beta diversity, indicator species cover and total percent cover. Direct comparisons between treated and untreated sites were also made using Student’s t-test with SAS statistical software, version 9.4 [21]. Unless otherwise indicated, statistical differences in understory vegetation were tested using permutation (nperm = 256) using the R Statistical language R 4.0.4 and the ‘broman’ package [22,23]. Differences were considered to be statistically significant at p < 0.05.
The Shannon–Wiener diversity index (H) was calculated using Equation (2):
where s represents the number of species found and pi represents the proportion of total cover attributable to the ith species, and higher values indicate greater diversity.
Evenness is another index of diversity that quantifies the degree of similarity in the number of individuals by species, between systems or treatments [24]. An evenness value of “1” indicates that all species found in a system are equally abundant, while values approaching zero indicate increasing inequality in species abundances (e.g., a few species dominate while most are present in low numbers). Evenness was calculated using Equation (3):
where Hmax is calculated as the natural logarithm of the total number of species.
E = H/Hmax,
Beta diversity was calculated for understory vegetation to assess the number of shared species between treatments. The use of beta in diversity studies is comprehensive and it may be calculated using a variety of methods. For this study, we calculated beta using a “multiplicative partitioning” method per Equation (4) [25,26]:
where α𝑖 is alpha diversity equal to the number of unique species across all three plots in each treatment (i) and γj is gamma diversity, equal to the total number of unique species across all six plots at each site (j) [27].
We tested for significant differences using permutation at the study level (i.e., by comparing site-level averages for the untreated and treated portions). Characteristic species cover was compared for the treated and untreated portions of each location. Since the treatments within each location occupy the same ecosite (see Study Sites), we hypothesized that plant species characteristic to the ecosite would be present in both the treated and untreated plots. Characteristic species for these ecosites include low bush-cranberry (Viburnum edule (Michx.) Raf.), dewberry (Rubus pubescens Raf.), wild sarsaparilla (Aralia nudicaulis L.), bracted honeysuckle (Lonicera aniculate (Richardson) Banks ex Spreng.), wild red raspberry (Rubus idaeus L.), oak fern (Gymnocarpium aniculate (L.) Newman) and tall lungwort (Mertensia aniculate (Aiton) G.Don) [19]. We compared mean plot-level percent cover of each characteristic species (or species group) above, between each treatment for each site, using a paired Student’s t-test.
Total understory plant percent cover was compared by calculating total percent cover of all understory plant species observed in each subplot, then averaging these values for each treatment within each site (“mean percent cover”) (Table A1). Understory plant cover was compared at the species level between treated and untreated sites. First, a stepwise discriminant analysis (SDA) was run to determine which individual plant species had discriminatory power across treatments. Species were considered significant based on a F test having α < 0.05. Second, a two-dimensional, non-metric multidimensional scaling (NMDS) was carried out based on the SDS results. All analyses were completed using SAS (v9.4) software [21].
3. Results
3.1. Overstory Plant Diversity and Dominance
Overall tree density was significantly lower in the treated portions (p = 0.047; Figure 2a), driven by large differences in deciduous tree density, which was also significantly lower in the treated portions (p = 0.008; Figure 2b). Coniferous tree density was higher in the treated portion, but not significantly so (p = 0.234; Figure 2c). Trembling aspen demonstrated a dramatic response to herbicide treatments, showing a 25-fold reduction in the treated portions compared to the untreated areas (Figure 2d). Lodgepole pine had a significant positive response in the treated portions (p = 0.008; Figure 2e), but the density response of white spruce was not significant (p = 0.805; Figure 2f).
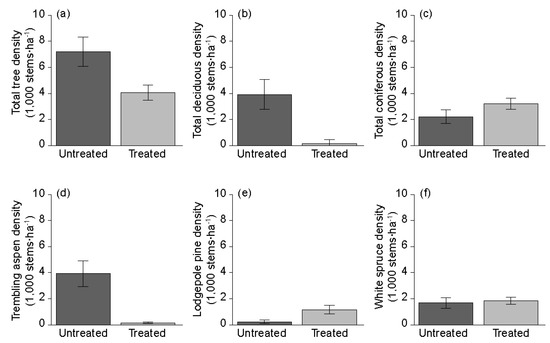
Figure 2.
Average tree density comparisons in stems·ha−1 contrasting untreated versus treated for: (a) all tree species; (b) deciduous trees; (c) coniferous trees; (d) trembling aspen (Populus tremuloides Michx.); (e) lodgepole pine (Pinus contorta Dougl. ex Loud. var. latifolia Engelm.) and (f) white spruce (Picea glauca (Moench) Voss).
Average stem densities (stems·ha−1) and standard errors are provided in Table 2. These differences in terms of species composition of the overstory document the more deciduous-dominant condition found in untreated portions and more conifer-dominant condition found in treated portions. These findings were also reflected in overstory species diversity as represented by the Shannon-Wiener (H) and evenness (E). Both indices were significantly different between the treated and untreated areas (H: p = 0.016; E: p = 0.023). Vertical diversity of the overstory by 2 m height class showed significant differences between treated and untreated areas (p = 0.008). Horizontal diversity by 2.0 cm DBH class showed no significant differences due to the herbicide treatment (p = 0.500), indicating that diameter is evenly distributed across treated and untreated areas. These structural indices are insensitive to tree size and species, as they are weighted only on the proportion of basal area occurring in a particular class [20]. Significant differences between treated and untreated areas were found in deciduous and coniferous tree size as measured by quadratic mean diameter (p = 0.007) between treated and untreated areas. Herbicide treatment clearly shifted dominance in the tree layer from deciduous species to coniferous; however, there was considerable variability between sites in overall dominance by coniferous tree species.
Table 2.
Average treatment stem density (stems·ha−1) of major species groups and dominant tree species (trembling aspen (Populus tremuloides Michx.), lodgepole pine (Pinus contorta Dougl. ex Loud. var. latifolia Engelm.) and white spruce (Picea glauca (Moench) Voss), with standard errors in parentheses; N = 8 (number of sites) within each row.
3.2. Understory Plant Diversity
Understory plant diversity, as examined by the Shannon-Wiener (H) and evenness (E) indices, was not significantly different at the study level between the treated and untreated portions (Figure 3). Average Shannon-Wiener diversity was slightly lower in the treated ( = 1.64, SE = 0.06) than the untreated portions ( = 1.80, SE = 0.14); this result was not statistically significant (p = 0.547). Likewise, average evenness was slightly lower in the treated ( = 0.70, SE = 0.03) than the untreated ( = 0.75, SE = 0.03) portions; this result was also not statistically significant (p = 0.570). p-Values in bold are significant at alpha = 0.05.
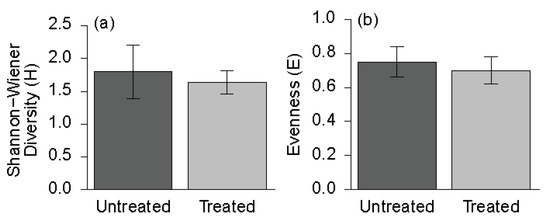
Figure 3.
Understory plant diversity indices at the study level between untreated and treated areas: (a) Shannon-Wiener Diversity (H); (b) Evenness (E).
Beta diversity was relatively high in both the untreated (= 0.788, SE = 0.026) and treated (= 0.785, SE = 0.041) portions of each site, indicating that each plot contained a high proportion of the species found within each site. Beta diversity did not differ significantly between the untreated and treated portions at the study level (p = 0.945). These two findings suggest understory plant communities between untreated and treated sites were more similar than not.
The site characteristic species analysis found significant differences in cover (Figure 4) of three out of the seven species analysed. Wild sarsaparilla, low bush-cranberry and oak fern had significantly lower cover in the treated portions (p = 0.0003, 0.019 and 0.042, respectively). The remaining site characteristic species did not show significant differences in cover.
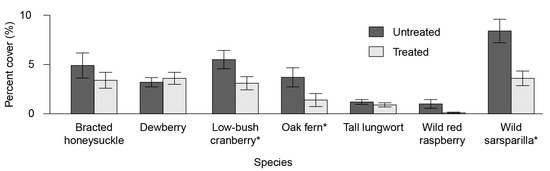
Figure 4.
Understory plant diversity by species for untreated and treated areas. * Note: wild sarsaparilla (Aralia nudicaulis L.), low bush-cranberry (Viburnum edule (Michx.) Raf.) and oak fern (Gymnocarpium aniculate (L.) Newman) had significantly lower cover in the treated portions (p = 0.0003, 0.019 and 0.042, respectively).
The SDA analysis indicates that of 73 understory plants observed, three vascular species and one bryophyte-group had discriminating power across the two treatments (Table 3). The three vascular plant species were dewberry (Rubus pubescens Raf.), blue columbine (Aquilegia brevistyla Hooker) and shrubby cinquefoil (Dasiphora fruticosa (Linnaeus) Rydberg). The latter two species (blue columbine and shrubby cinquefoil) were observed in only one subplot indicating a higher probability of rejecting a true null hypothesis than the accepted alpha of 0.05.
Table 3.
Results of a stepwise discriminate analysis (SDA) on all plant species cover observed in this study.
Of the four, forest floor mosses have the most discriminating power, having a partial R-squared greater than 0.5. A direct comparison of bryophyte cover between treatments showed treated sites have on average 23.7% more bryophyte cover then untreated sites (p-value < 0.001, Student’s t-test). The NMDS of the four significant flora species clearly show a dissimilarity trend (Figure 5a), particularly on the second dimension, or y-axis. However, when the remaining flora species are included (Figure 5b), sites are more similar than dissimilar. When all species except the four significant are considered, sites become even more similar (Figure 5c).
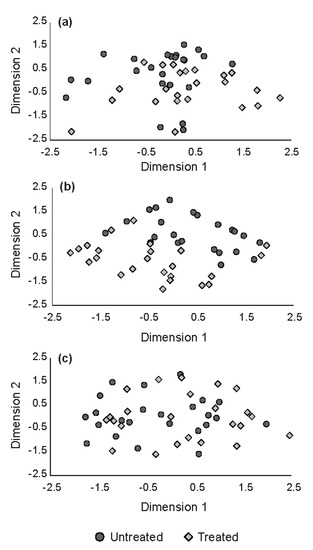
Figure 5.
Plots from two-dimensional, non-metric multidimensional scaling (NMDS) analyses. Individual species with discriminatory power across treatments was determined using stepwise discriminant analysis (SDS). Species were considered significant based on a F test having α < 0.05: (a) all species; (b) four species identified as significant—dewberry (Rubus pubescens Raf.), blue columbine (Aquilegia brevistyla Hooker), shrubby cinquefoil (Dasiphora fruticosa (Linnaeus) Rydberg) and bryophytes; (c) all species except four identified as significant.
Total understory plant cover was significantly greater in the treated portion on average (ranging from 71.4% to 98.0%, p = 0.016). However, this difference was not significant when bryophytes were excluded (p = 0.883) (Figure 6). These differences suggest that, barring increased bryophyte cover, the total cover of understory vegetation was not affected by herbicide treatments on these sites.
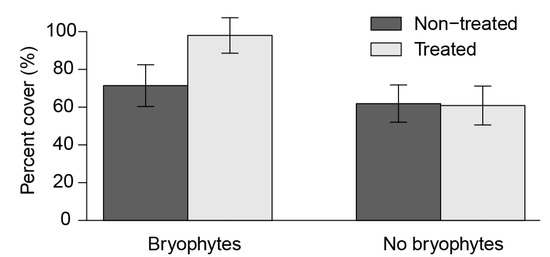
Figure 6.
Effect of bryophytes (forest floor mosses only) on total understory plant cover between untreated and treated areas.
4. Discussion
4.1. Overstory Vascular Plants
The greatest difference between treated and untreated areas was a shift from a deciduous dominated condition to a conifer dominated condition. This change was driven by a 25-fold reduction in deciduous tree density, largely in trembling aspen (Figure 2b,d). This result is consistent with the goals of broad-scale herbicide application in reforestation: (a) reducing competition by shade-intolerant deciduous species and (b) shifting stand composition to a conifer dominant condition. The high stem densities of deciduous species within the untreated portions are “typical” of post-disturbance successional pathways in the boreal mixedwood forest. As the large standard errors demonstrate deciduous density following harvest is highly variable following harvest of conifer-dominated stands. Over time the deciduous overstory is replaced by mid-tolerant or tolerant coniferous species. Thus, the shift to conifer dominance in treated portions of the openings might be seen as a hastening of succession. Likewise, differences in coniferous basal area are likely attributable to differences in reforestation strategy (presence, extent and type of site preparation; use of planting vs. seeding; promptness of reforestation implementation) between openings. Differences in reforestation regime appear to be the primary contributor to the substantial differences in coniferous overstory structure (abundance, composition, height and diameter) the Alberta Herbicide Monitoring plots do not provide sufficient resolution to examine this.
Overall coniferous stem density was higher in the treated than in the untreated portions, this difference was reflected most clearly in the shade-intolerant lodgepole pine than the shade-tolerant white spruce (Table 2). It is likely that most of these differences arose from substantial recruitment of lodgepole pine natural regeneration into the herbicide treated areas over the first several years following treatment [28]. These stands successfully met the stand replacement reforestation policy that mandated stocking (80% with a minimum of 70% conifer), size (2.00 m or greater in height), composition (conifer dominant or conifer only) and a competition free cylinder 2.00 m in radius around “crop trees” in place when they were harvested [29]. A scientific examination of the reforestation standard by the Alberta Regeneration Survey Science Task Force prompted removal of the mechanistic performance phase survey eliminating the stocking requirement and competition assessment cylinder [29]. However, these were replaced with a requirement to demonstrate that young forests were meeting forest management planning growth expectations—which many silviculturists typically interpret as driving a requirement for competition management. Thus, herbicide treatment continues to be a component of conifer reforestation practice on most sites prone to vegetation competition.
4.2. Understory Vegetation
Despite the overall differences in overstory tree composition, there were few differences in the biodiversity of understory flora. This finding is consistent with the only other long-term assessment of plant biodiversity following broadcast forest herbicide use in North America, which found no lasting effect of herbicide treatment on ground cover diversity, cover or richness, 23 to 33 years following treatment [30]. Similarly, Haeussler and others (2004) found understory vegetation conditions on herbicide treated sites and untreated sites tended to converge by 14 to 15 years after treatment [16]. The primary difference we observed between treated and untreated areas was the almost five-fold increase in forest floor moss (predominantly feathermosses) cover in the treated portions (Figure 6). Given that many bryophyte species are associated with the typically shady and cool conditions of conifer-dominated stands [19], this result likely reflects the reduction in light availability at the forest floor due to conifer dominance of treated areas. However, this increase was not accompanied by a concomitant decrease in the cover of other understory flora (e.g., through competition for growing microsites). In terms of total cover, there were no significant differences between the untreated and treated portions when bryophytes were excluded from the analysis (Figure 6).
The remaining diversity indices we calculated did not have detectable differences between the untreated and treated portions. Shannon-Wiener diversity, evenness, and beta diversity had minimal differences, none of which were statistically significant. The standard errors, particularly for Shannon-Wiener diversity and evenness, reflect wide variation among sites: these indices were greater in the treated portions of some sites, lower in others, and essentially not different in others (unpublished data). This variability suggests factors other than herbicide treatment were likely contributing more to variability in the understory vegetation condition than was the herbicide treatment.
Forest floor bryophytes notwithstanding, the multivariate analysis (Figure 5) did not distinguish differences in overall, individual species cover between the treated areas versus treated and untreated areas pooled to form a single population. This, again, suggests that there were minimal differences in non-tree understory plant populations 25 to 40 years post-treatment due to herbicides during the reforestation phase. Our results suggest that while concerns with current reforestation practice—especially herbicide use—hastening conifer dominance or reducing deciduous dominance of young mixedwood forests may have merit [31,32], this change in dominance has only a modest impact on diversity of other understory plant species.
4.3. Study Limitations
The primary limitations of our study were (1) the dearth of long-term herbicide monitoring installations and (2) measurements of understory plant diversity limited to a single point in time. Of the twelve sites investigated in 2002 [17], only eight were included in our study since the untreated portions of four had been disturbed since the study was initiated and were thereby unreliable for reference data. While we have addressed the potential limitations of parametric statistics through the use of permutation to assess statistical significance for all datasets with n = 8, we are nevertheless limited in our ability to form strong conclusions. Small sample sizes also prevented us from comparing results for locations that were treated once with herbicides against those that had received a subsequent remedial herbicide treatment: this was a question of keen interest, yet only two sites receiving second treatments could be included in our final analysis.
5. Conclusions
Numerous challenges have been posed to the silvicultural approach that underlies this study, largely taking issue with the stand replacement forest management paradigm that underpins the reforestation standard of Alberta. Our results demonstrate that “stand replacement forestry” as currently practiced does not, in fact, result in replication of pre-harvest forest structure and composition. Rather it results in a broad array of conifer dominated stand conditions that most frequently include substantially more deciduous trees (and species) than the harvested stand. The great deal of variability in overstory composition and structure suggests this result is likely inadvertent. How well this new forest replicates forest plant community development after “natural” disturbances is a matter of considerable discussion. Likewise, our assessment of understory plant species suggests that current reforestation practice does not compromise either site quality or presence of native plant species fulfilling other ecological functions or services.
If an intensive silviculture approach becomes more common in Alberta, it is almost certain that some level of competition and composition management will be necessary for implementation. Not only is treatment with glyphosate the least costly treatment option, it is the most effective single treatment option for managing competition and composition of developing stands, thereby supporting silvicultural objectives and protecting investments in reforestation. Furthermore, the forest industry as a whole faces a shortage of labour needed to implement current management practices and operations, suggesting a change to some form of manual tending is unlikely to be sustainable at operational scales. Therefore, we suggest that the inclusion of some form of herbicide treatment in the implementation of this strategy of forest management and renewal would be prudent. However, glyphosate has come under increasing pressure surrounding its potential carcinogenicity and its increasingly abrasive nature in the face of Indigenous engagement with forest management practices. Thus, we conclude by offering a number of recommendations:
- Establish a series of glyphosate demonstration sites that contrast untreated with treated areas and establish and measure ongoing monitoring plots;
- Identify both chemical herbicide and other non-herbicide alternatives to glyphosate and establish trials to compare these options to glyphosate;
- Engage with key stakeholders, especially Indigenous stakeholders and/or collaborators, when selecting treatments and designing the installations suggested in items 1 and 2. In particular, seek Indigenous engagement (and potentially study partners) when assessing herbicide impact on shrub and herbaceous plants as many of these species are culturally important. Understory plant presence/abundance data collected in this evaluation might form the basis of an assessment of impact on species of Indigenous importance.
The lack of long-term monitoring and publicly available data, at even these intact monitoring installations, precluded our ability to analyse differences beyond the snapshot provided by a single year of data collection. However, this snapshot is beneficial as it fills a critical knowledge gap in our understanding of the long-term effects of herbicides in the boreal mixed wood forest. Finally, the knowledge that would be gained from pre-treatment and time-series data cannot be understated, and the establishment, maintenance and monitoring of larger long-term trials is strongly recommended.
Author Contributions
Conceptualization, M.M., and J.C.N.; methodology, M.M., J.C.N. and S.O.; software, J.C.N.; formal analysis, M.M. and J.C.N.; writing—original draft preparation, M.M., J.C.N. and S.O.; writing—review and editing, all authors; project administration, B.E.R.; funding acquisition, B.E.R. All authors have read and agreed to the published version of the manuscript.
Funding
This research was funded by the Forest Growth Organization of Western Canada (FGrOW), grant number 234.9 and the Forest Resource Improvement Association of Alberta (FRIAA), grant number FOOMOD-01-020. FGrOW received financial support for this purpose from the following organizations: ANC Timber; Canadian Forest Products (Grande Prairie and Whitecourt Divisions); Forest Resource Improvement Association of Alberta (FRIAA); Vanderwell Contractors (1971) Ltd.; West Fraser (Blue Ridge Lumber, Edson Forest Products, Hinton Wood Products, North Central Woodlands); and Weyerhaeuser Company Limited (Grande Prairie and Pembina Timberlands). The APC (article processing charge) was also funded by FGrOW.
Data Availability Statement
Data from this study may be made available via application to the Forest Growth Organization of Western Canada (FGrOW). Any request for data should include a detailed explanation of the purpose of the request and plans for use of the data.
Acknowledgments
It is with respect and gratitude that the authors thank the diverse Indigenous peoples on whose ancestral and traditional territories we conducted this research, including the people of Treaty 6, Treaty 8, and those not recognized by Treaty. The authors are thankful for the direction and support of the FGrOW PPPT Herbicide Subcommittee and in particular, Tim McCready, Shane Sadoway, Christine Quinn and Sharon Meredith. We acknowledge the support of Fuse Consulting Ltd. in reviewing the literature and producing figures for this manuscript as well as Doug Pitt for guidance on analysis.
Conflicts of Interest
The authors declare no conflict of interest. Funding agencies participated in the design of the study but did not participate in analyses or interpretation of data or writing of the manuscript.
Appendix A
Table A1.
Species observed in the study and includes forest floor moss, wood moss, grasses and lichens.
Table A1.
Species observed in the study and includes forest floor moss, wood moss, grasses and lichens.
| Latin Name | English Name |
|---|---|
| Achillea millefolium | Common yarrow |
| Actaea rubra | Red and white baneberry |
| Alnus crispa | Green alder |
| Alnus tenuifolia | River alder |
| Aquilegia brevistyla | Blue columbine |
| Aralia nudicaulis | Wild sarsaparilla |
| Aster conspicuus | Showy aster |
| Astragalus americanus | American milk-vetch |
| Athyrium filix-femina | Lady fern |
| Calamagrostis canadensis | Marsh reed grass |
| Circaea alpina | Small enchanters-nightshade |
| Cornus canadensis | Bunchberry |
| Disporum trachycarpum | Fairybells |
| Dryopteris austriaca | Shield fern |
| Elymus innovatus | Hairy wild rye |
| Epilobium angustitolium | Fireweed |
| Equisetum arvense | Common horsetail |
| Equisetum sylvaticum | Woodland horsetail |
| Fragaria vesca | Woodland strawberry |
| Fragaria virginiana | Wild strawberry |
| Galium boreale | Northern bedstraw |
| Galium triflorum | Sweet-scented bedstraw |
| Geum aleppicum | Yellow avens |
| Geum rivale | Purple avens |
| Gymnocarpium dryopteris | Oak fern |
| Heracleum lanatum | Cow-parsnip |
| Lathyrus ochroleucus | Creamy peavine |
| Ledum groenlandicum | Common labrador tea |
| Linnaea borealis | Twinflower |
| Lonicera dioica | Twining honeysuckle |
| Lonicera involucrata | Bracted honeysuckle |
| Lycopodium annotinum | Stiff club-moss |
| Maianthemum canadense | Wild lily-of-the-valley |
| Mertensia paniculata | Tall lungwort |
| Mitella nuda | Common mitrewort |
| Oryszopsis asperifolia | Rough-leaved rice grass |
| Petasites palmatus | Palmate-leaved coltsfoot |
| Petasites sagittatus | Arrow-leaved coltsfoot |
| Potentilla fruticosa | Shrubby cinquefoil |
| Pyrola asarifolia | Common pink wintergreen |
| Pyrola chlorantha | Green wintergreen |
| Pyrola secunda | One-sided wintergreen |
| Ribes glandulosum | Skunk currant |
| Ribes hudsonianum | Northern black currant |
| Ribes lacustre | Black gooseberry |
| Ribes oxyacanthoides | Northern gooseberry |
| Ribes triste | Wild red currant |
| Rosa acicularis | Prickly rose |
| Rubus idaeus | Wild red raspberry |
| Rubus parviflorus | Thimbleberry |
| Rubus pedatus | Dwarf bramble |
| Rubus pubescens | Dewberry |
| Salix bebbiana | Beaked willow |
| Salix spp. | Unknown willow species |
| Shepherdia canadensis | Canada buffaloberry |
| Smilacina stellata | Star-flowered false Solomons-seal |
| Sorbus scopulina | Western mountain ash |
| Spiraea betulifolia | White meadowsweet |
| Streptopus amplexifolius | Twisted-stalk |
| Symphoricarpos albus | Common snowberry |
| Taraxacum officinale | Common dandelion |
| Trifolium pratense | Red clover |
| Vaccinium myrtilloides | Common blueberry |
| Vaccinium vitis-idaea | Bog cranberry |
| Viburnum edule | Low bush-cranberry |
| Viburnum opulus | High bush-cranberry |
| Vicia americana | Wild vetch |
| Viola canadensis | Western Canada violet |
| Viola renifolia | Kidney-leaved violet |
| Feather moss | Feather moss |
| Wood moss | Wood moss |
| Leaf lichen | Leaf lichen |
| Unknown grass species | Unknown grass species |
References
- Wagner, R.G.; Little, K.M.; Richardson, B.; McNabb, K. The role of vegetation management in enhancing productivity of the world’s forests. Forestry 2006, 79, 57–79. [Google Scholar] [CrossRef]
- Boateng, J.O.; Heineman, J.L.; McLarnon, J.; Bedford, L. Twenty year response of white spruce to mechanical site preparation and early chemical release in the boreal region of northeastern British Columbia. Can. J. For. Res. 2006, 36, 2386–2399. [Google Scholar] [CrossRef]
- Cole, E.C.; Newton, M.; Youngblood, A. Regenerating white spruce, paper birch and willow in central Alaska. Can. J. For. Res. 1999, 29, 993–1001. [Google Scholar] [CrossRef]
- CCFM: National Forest Database. Canadian Council of Forest Ministers. 2022. Available online: http://nfdp.ccfm.org/en/data/harvest.php (accessed on 13 July 2022).
- Wagner, R.G.; Flynn, J.; Gregory, R. Public perceptions of risk and acceptability of forest vegetation management alternatives in Ontario. For. Chron. 1998, 74, 720–727. [Google Scholar] [CrossRef]
- Buse, L.J.; Wagner, R.G.; Perrin, B. Public attitudes to forest herbicide use and the implications for public involvement. For. Chron. 1995, 71, 596–600. [Google Scholar] [CrossRef]
- Mihajlovich, M.; Odsen, S.; Chicoine, D. Review of herbicide use for forest management in Alberta, 1995–2009. For. Chron. 2012, 88, 328–339. [Google Scholar] [CrossRef][Green Version]
- Lautenschlager, R.A.; Sullivan, T.P. Effects of herbicide treatments on biotic components in regenerating northern forests. For. Chron. 2002, 78, 695–731. [Google Scholar] [CrossRef]
- Comeau, P.G.; Filipescu, C.N.; Kabzems, R.; DeLong, C. Early growth of white spruce underplanted beneath spaced and unspaced aspen stands in northeastern British Columbia. Can. J. For. Res. 2004, 34, 2277–2283. [Google Scholar] [CrossRef]
- Kabzems, R.D.; Harper, G.; Fielder, P. Growing space management in boreal mixedwood forests. West. J. Appl. For. 2011, 26, 82–90. [Google Scholar] [CrossRef]
- Kayahara, G.J.; Chen, H.Y.H.; Klinka, K.; Coates, K.D. Relations of Terminal Growth and Specific Leaf Area to Available Light in Naturally Regenerated Seedlings of Lodgepole Pine and Interior Spruce in Central British Columbia; Research Report No. 9; Research Branch, B.C. Ministry of Forests, 31 Bastion Square: Victoria, BC, Canada. 1995. Available online: https://www.for.gov.bc.ca/hfd/pubs/docs/rr/rr09.pdf (accessed on 13 July 2022).
- Bell, F.W.; Ter-Mikaelian, M.T.; Wagner, R.G. Relative competitiveness of nine early-successional boreal forest species associated with planted jack pine and black spruce seedlings. Can. J. For. Res. 2000, 30, 790–800. [Google Scholar] [CrossRef]
- Olson, M.G.; Wagner, R.G.; Brissette, J.C. Forty years of spruce-fir stand development following herbicide application and precommercial thinning in central Maine, USA. Can. J. For. Res. 2012, 41, 1–11. [Google Scholar] [CrossRef]
- Comeau, P.G.; Fraser, E.C. Plant community diversity and tree growth following single and repeated glyphosate herbicide applications to a white spruce plantation. Forests 2018, 9, 107. [Google Scholar] [CrossRef]
- Boateng, J.O.; Haeussler, S.; Bedford, L. Boreal plant community diversity 10 years after glyphosate treatment. West. J. Appl. For. 2000, 15, 15–26. [Google Scholar] [CrossRef]
- Haeussler, S.; Bartemucci, P.; Bedford, L. Succession and resilience in boreal mixedwood plant communities 15–16 years after silvicultural site preparation. For. Ecol. Mgmt. 2004, 199, 349–370. [Google Scholar] [CrossRef]
- Pitt, D.G.; Mihajlovich, M.; Proudfoot, L.M. Juvenile stand responses and potential outcomes of conifer release efforts on Alberta’s spruce–aspen mixedwood sites. For. Chron. 2004, 80, 583–597. [Google Scholar] [CrossRef]
- Natural Regions Committee. Natural Regions and Subregions of Alberta; Downing, D.J., Pettapiece, W.W., Eds.; Government of Alberta: Edmonton, AB, Canada, 2006; Available online: https://www.albertaparks.ca/media/2942026/nrsrcomplete_may_06.pdf (accessed on 13 July 2022).
- Beckingham, J.D.; Corns, I.G.W.; Archibald, J.H. Field Guide to the Ecosites of West-Central Alberta; Special Report 9; Natural Resources Canada, Canadian Forest Service; Northern Forestry Centre: Edmonton, AB, Canada, 1996; 540p. [Google Scholar]
- Staudhammer, C.L.; LeMay, V.M. Introduction and evaluation of possible indices of stand structural diversity. Can. J. For. Res. 2001, 31, 1105–1115. [Google Scholar] [CrossRef]
- SAS. Statistical Analysis Software. Users’ Guide Statistics, version 9.4; SAS Institute Inc.: Cary, NC, USA, 2013. [Google Scholar]
- R Core Team. R: A Language and Environment for Statistical Computing; R Foundation for Statistical Computing: Vienna, Austria, 2021; Available online: https://www.R-project.org/ (accessed on 13 July 2022).
- Broman, K.W. Broman: Karl Broman’s R Code. R Package Version 0.72-4. 2021. Available online: https://CRAN.R-project.org/package=broman (accessed on 13 July 2022).
- Heip, C.H.R.; Herman, P.M.J.; Soetaert, K. Indices of diversity and evenness. Océanis 1998, 24, 61–87. [Google Scholar]
- Whittaker, R.H. Vegetation of the Siskiyou mountains, Oregon and California. Ecol. Monogr. 1960, 30, 280–338. [Google Scholar] [CrossRef]
- Jurasinski, G.; Retzer, V.; Beierkuhnlein, C. Inventory, differentiation, and proportional diversity: A consistent terminology for quantifying species diversity. Oecologia 2009, 159, 15–26. [Google Scholar] [CrossRef]
- Hunter, M., Jr. Fundamentals of Conservation Biology, 2nd ed.; Blackwell Science: Malden, MA, USA, 2002. [Google Scholar]
- Dempster, W.R.; Meredith, S. A discussion of best management practices for reforestation following harvesting of lodgepole pine in the Alberta Foothills. For. Chron. 2014, 90, 763–770. [Google Scholar] [CrossRef]
- Reforestation Standard of Alberta. Government of Alberta. 2021. Available online: https://open.alberta.ca/publications/7010852 (accessed on 13 July 2022).
- Bataineh, M.M.; Wagner, R.G.; Olson, M.G.; Olson, E.K. Mid-rotation response of ground vegetation to herbicide and precommercial thinning in the Acadian Forest of Maine, USA. For. Ecol. Mgmt. 2014, 313, 132–143. [Google Scholar] [CrossRef]
- Lieffers, V.J.; Armstrong, G.W.; Stadt, K.J.; Marenholtz, E.H. Forest regeneration standards: Are they limiting management options for Alberta’s boreal mixedwoods? For Chron. 2008, 84, 76–82. [Google Scholar] [CrossRef]
- Lieffers, V.J.; Pinno, B.D.; Beverly, J.L.; Thomas, B.R.; Nock, C. Reforestation policy has constrained options for managing risks on public forests. Can. J. For. Res. 2020, 50, 855–861. [Google Scholar] [CrossRef]
Publisher’s Note: MDPI stays neutral with regard to jurisdictional claims in published maps and institutional affiliations. |
© 2022 by the authors. Licensee MDPI, Basel, Switzerland. This article is an open access article distributed under the terms and conditions of the Creative Commons Attribution (CC BY) license (https://creativecommons.org/licenses/by/4.0/).