Abstract
Schima superba is a precious broadleaf tree species that produces excellent timber. Analyzing the radial variation of wood anatomical properties within stems and determining the boundary between the juvenile and mature wood can provide a theoretical basis for the breeding and cultivation of S. superba. Herein, 30 54-year-old trees were used to analyze the radial variation of wood anatomical properties qualitatively. The correlation among wood properties was analyzed. On this basis, four types of model were used to predict the wood properties quantitatively, and the optimal segmentation model was used to determine the boundary between juvenile and mature wood. The results showed that the variation of the early stage (before the 20th year) was larger than that of the later stage (after the 20th year); moreover, the variation of the vessel features (9.56%) was greater than that of the fiber features (7.42%), the vessel lumen diameter (11.94%) and the fiber length (8.00%) had the most variation. There were three radial variation patterns in the wood properties. In the early stage, there was a significant positive correlation between the ring width and wood air-dry density (0.78) and wood basic density (0.89), and a significant negative correlation between the ring width and the fiber characters (−0.79~−0.93) and vessel characters (−0.64~−0.90). The growth models of Logistic and Richards were more suitable (R2 = 84.2%~95.2%) for the radial variation of wood anatomical properties than the nonlinear least square model (R2 = 67.7%~90.9%). The transition wood between juvenile and mature wood of S. superba was from the 11th to the 16th year based on aggregative indicators from the pith to bark at breast height. Finally, when taken together, the wood anatomical properties of S. superba had regular radial variation. Breeding programs need to consider both growth and wood anatomical properties in the early stage, but they can be neglected in the mature stage. The formation of mature wood of S. superba occurred after the 16th year.
Keywords:
wood anatomy; broadleaf tree; radial variation; fiber; vessel; mature wood; Schima superba 1. Instruction
One main function of a forest is to produce wood. The wood properties directly determine wood utilization. Wood density is an important property due to its correlation with other wood properties, such as stiffness and ability to resist deformation [,]. It is a composite trait affected by the annual ring width, latewood percentage, cell wall thickness and lumen diameter of the fibers and vessels, etc. []. Fibers and vessels are the main components of the wood anatomical structure in broadleaf trees [], and their size, quantity and shape are important indicators affecting wood properties []. Wood properties are affected not only by genes [] and the environment [,], but also by cambial age []. The radial variation of wood properties within plants caused by the xylem formed at different cambium ages is the main source of wood property variation. This variation shows a certain pattern with cambial age increasing in different tree species. Studying this variation pattern is beneficial for the wood breeding programs and utilization of this tree species.
The radial variation of wood anatomical properties can be not only qualitatively analyzed but also quantified. The theoretical growth equation is used as a model to describe the change in wood properties with age and evaluate wood quality [,]. Models to predict wood properties variation are important not only to better understand quantitatively the radial variation that occurs in wood properties, but also to provide an opportunity to include wood quality models in growth and yield systems. There are models for wood basic density and ring width [,,] but fewer models for wood anatomical properties among previous studies.
Wood is formed from the cambium, and juvenile wood is formed when the cambium age is younger. At a certain age, it gradually transits to the mature stage to form mature wood. Juvenile wood has large variations and poor wood properties, and it is restricted in certain aspects of wood utilization, while mature wood has stable wood properties and good quality and is widely used []. The change in wood properties between juvenile wood and mature wood is not obvious in some tree species, and it is a gradual process during tree growth. However, through the radial variation pattern of wood properties, the boundary of juvenile and mature wood could be determined with a statistics model. Mvolo et al. [] used the linear mixed model, maximum-quadratic-linear model and piecewise model to estimate transition age in Picea glauca based on tracheid length radial variation and found that transition age ranged from the 11th to the 27th year and juvenile wood proportion ranged from 15.3% to 47.5%. Palermo et al. [] studied the juvenile, transition and mature wood zones of 23-year-old Eucalyptus grandis by fiber length measurement from the pith to the bark and found that the transition zone occurs between the 8th and the 13th year. In a word, determining the boundary between juvenile wood and mature wood accurately is conducive to the efficient utilization of wood.
Wood anatomical properties determine the wood application. Previous studies on wood anatomical properties focused on coniferous tree species, such as Picea abies [], Pinus taeda [], Pinus radiata [] and so on, but less so on broadleaf tree species. However, there are many differences between coniferous trees and broadleaf trees in wood anatomical properties. S. superba is an evergreen broadleaf tree in Theaceae and is the main construction timber species in subtropical China. It is also a precious and high-quality broadleaf timber species and widely planted in southern China. Because of its solid and dense wood, uniform structure and good mechanical properties, it has important uses in construction, equipment, furniture and wooden crafts [,]. Previous studies have found that the wood basic density of S. superba has abundant variation among provenances [] and families []. To date, the wood anatomical properties of S. superba and its variation with increasing age and the demarcation of juvenile-mature wood are still unclear. This restricts its wood processing and utilization and the formulation of an improvement strategy. Our study, however, could provide a reference for other broadleaf tree species. The hypothesis for this study was that the wood anatomical properties of S. superba have regular radial variation. In this case, 30 54-year-old plants were studied to provide a systematic description of wood anatomical properties. The primary goals of the current study were as follows: (1) determine the wood anatomical features showing the highest variability; (2) reveal the radial variation pattern of wood properties with increasing cambial age; (3) quantify wood properties such as wood air-dry density and wood basic density; (4) evaluate the relationship between wood properties and growth; (5) determine the boundary between juvenile and mature wood.
2. Materials and Methods
2.1. Study Site
The sampling site is located in Jian’ou, Fujian province, China (117°58′–118°57′ E, 26°38′–27°20′ N). The altitude is 140~180 m. The climate is characterized by distinct mid-subtropical maritime monsoon influence. The mean annual temperature is 18.9 °C with average temperatures of 8 °C in January and of 28.6 °C in July. The annual precipitation is 1627.3~1662.9 mm, the relative humidity is 81% and the frost-free period is 286 days.
2.2. Plant Material
Five pure S. superba plantations at different ages were selected (Table 1). The afforestation land was all low hills, and the soil was mountainous red soil with above medium fertility. The soil physical and chemical properties in each sample plot were tested (Table 2) so that the growth conditions of the study samples were as similar as possible.

Table 1.
Basic information of differently aged samples of S. superba.
Table 2.
Soil physical and chemical properties of differently aged samples of S. superba.
In each plantation of a different age, survey plots of 20 × 20 m were set up. The diameter at breast height (DBH) of all trees was measured. Here, 30 sample trees were randomly selected. The sample trees were selected based on the mean DBH and the straightness of stems showing no apparent defects, and the height and DBH were measured (Table 1). At the same time, 150 intact wood cores from pith to bark for wood anatomical properties analyses were taken from the upper slope side of each trunk, and the wood cores were subsequently taken back to the laboratory for disposal. The wood cores were polished and processed into wood strips with a width of 5 mm and a thickness of 2.5 mm.
2.3. Measurements of Wood Anatomical Properties
The observation of the annual ring width (RW) and latewood percentage (LP) was made under a microscope (Zeiss Imager. A2, Germany) (Figure 1). Every 2 annual rings of the wood strips were divided into 1 pith-to-bark oriented sample. Wood air-dry density (WADD) was measured by a soft X-ray microdensitometer (type 2405). The wood basic density (WBD) was measured by the maximum moisture content method (wet weight and dry weight of the samples were measured, respectively) []. The fiber and vessel morphology were determined using the mixture segregation of 30% hydrogen peroxide and glacial acetic acid (1:1) at 90 °C for 4 h. The macerated tissue was washed in running water until the tissue was free of all acid traces, so that the lengths of the fiber and vessel elements could be determined. The macerated tissue was then crushed in water to make a temporary section by safranine (1%) staining, and 50 intact fibers and vessels were randomly measured, respectively, under a biological projection microscope (Zeiss Imager. A2, Germany). Software ImageJ (v1.52) was used to analyze all images.
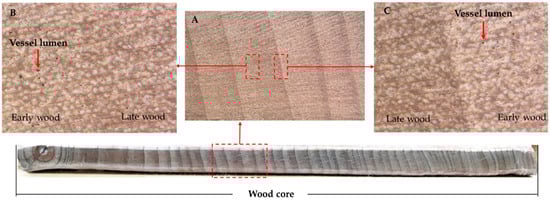
Figure 1.
The cross section of wood core of S. superba in 54-year-old. (A) Locally enlarged part of wood core, the pale band was early wood and the dark band was late wood. (B) The transition between early wood and late wood on a left-to-right time axis. The early wood had larger vessel lumen and more vessel elements, while the late wood had smaller vessel lumen and less vessel elements. (C) The annual ring border between late wood and early wood.
Wood anatomical properties including fiber length (FL), fiber width (FW), fiber lumen diameter (FLD), fiber cell wall thickness (FCWT), vessel length (VL), vessel width (VW), vessel lumen diameter (VLD) and vessel cell wall thickness (VCWT) were measured. Fiber and vessel wall-lumen ratio was calculated using the double cell wall thickness divided by the lumen diameter. Fiber and vessel lumen-width ratio was calculated as lumen diameter divided by width. Fiber and vessel length-width ratio was calculated as length divided by width. In this study, wood properties included wood air-dry density, wood basic density and wood anatomical properties.
2.4. Data Analyses
Wood basic density was calculated according to the following formula:
where M is the weight (g) of the sample at saturated moisture content, M0 is the weight (g) of the oven-dry sample and Dw is the specific gravity of the wood material forming the cell wall with an average value of 1.53.
Coefficient of variation:
where σ is the standard deviation of the wood property, and is the mean of the wood property.
Correlation coefficient:
where Cov(x, y) is the covariance of the wood properties x and y, and and are the variance of the wood properties x and y, respectively.
The wood properties of 54-year-old plants were used to model according to the following equations:
Binomial regression []:
Logistic []:
Richards []:
Multiple linear regression:
where , and are the cambial age, fiber wall thickness, and vessel lumen diameter of the jth annual ring from the ith tree, respectively. , , and are the model parameters.
The determination coefficient (R2), root mean square error (RMSE), and mean absolute deviation (MAD) were used to evaluate and test the model []. The larger the coefficient of determination was, the smaller the root mean square error and mean absolute error was, which indicates that the accuracy of the model simulation is higher.
where yi is the observed value, and is the predicted value, and is the mean value of the sample.
Optimal segmentation model:
Assume that G includes sample ,
where n is the number of the sample, and k is the category of sample. The smaller the value of L is, the more reasonable the classification is.
The descriptive statistical analysis of wood properties was calculated using the MEAS procedure in SAS (v9.4). The model parameters were estimated using PROC NLIN and PROC NLMIXED in SAS (v9.4).
3. Results
3.1. Radial Variation among Different Tree Ages in Wood Anatomical Properties
The radial variation patterns of different tree ages in wood anatomical properties were similar (Figure 2, Figure 3, Figure 4, Figure 5, Figure 6, Figure 7, Figure 8). Only the values of wood air-dry density and wood basic density with different ages were quite different. The wood air-dry density and basic density of 54-year-old specimens were larger than those of other ages near the pith. The wood anatomical properties in 4-year-old, 6-year-old, 10-year-old and 20-year-old specimens had not yet reached a steady state. Therefore, 54-year-old S. superba specimens were selected for analysis.
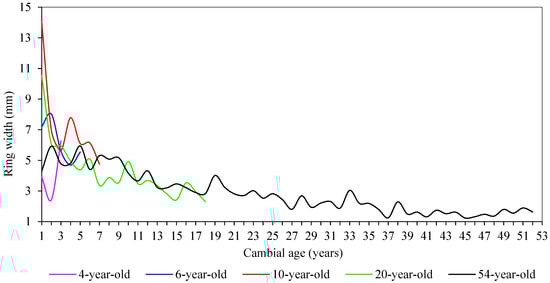
Figure 2.
The radial variation of annual ring width versus cambial age of S. superba.
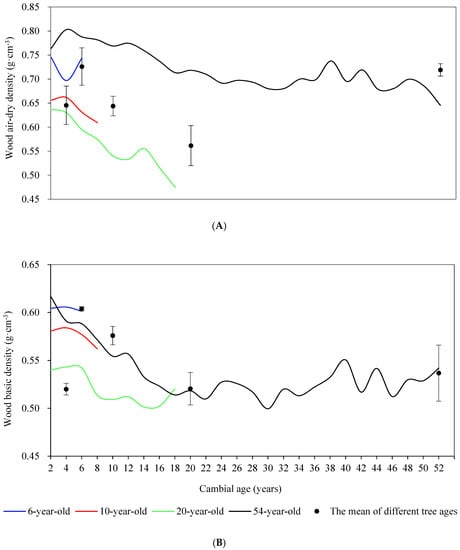
Figure 3.
The radial variation in both wood air-dry density (A) and wood basic density (B) versus cambial age and the mean of different tree ages in S. superba.
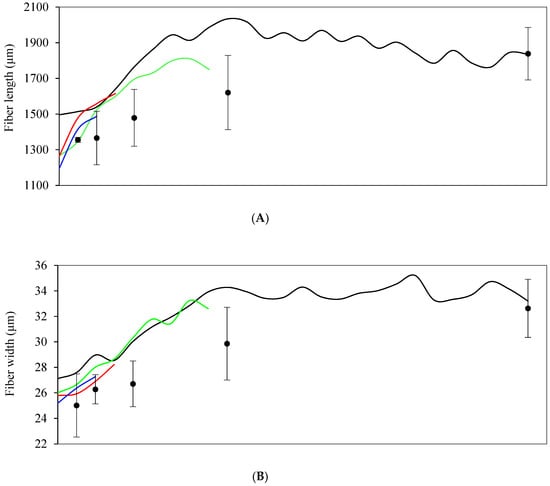
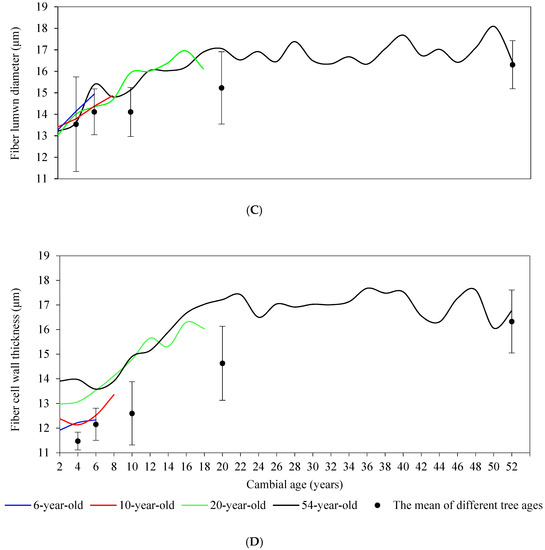
Figure 4.
The radial variation in fiber characters versus cambial age and the mean of different tree ages in S. superba, including fiber length (A), fiber width (B), fiber lumen diameter (C) and fiber cell wall thickness (D).
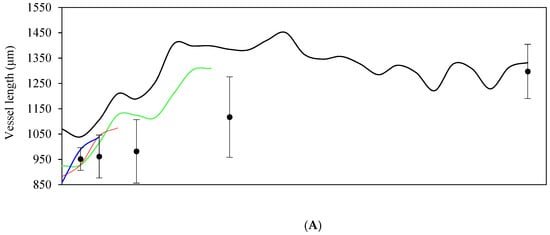
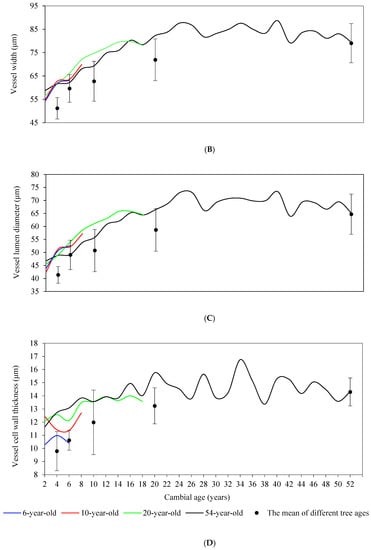
Figure 5.
The radial variation in vessel characters versus cambial age and the mean of differently aged S. superba, including vessel length (A), vessel width (B), vessel lumen diameter (C) and vessel cell wall thickness (D).
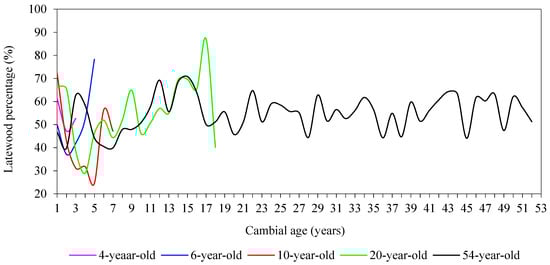
Figure 6.
The radial variation of annual latewood percentage versus cambial age in S. superba.
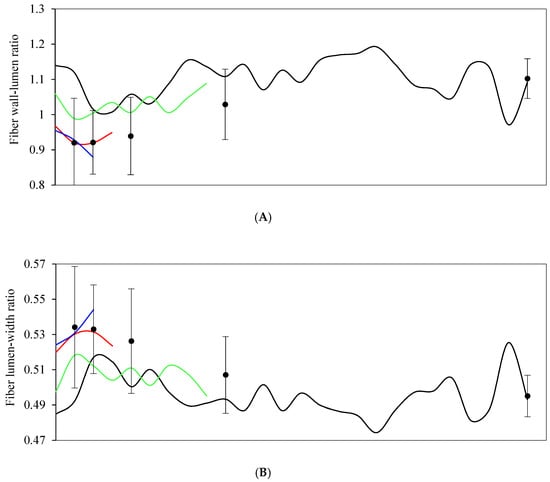
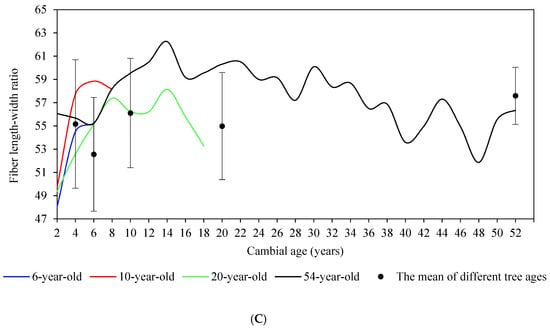
Figure 7.
The radial variation in fiber wall-lumen ratio (A), fiber lumen-width ratio (B) and fiber length-width ratio (C) versus cambial age and the mean of differently aged S. superba.
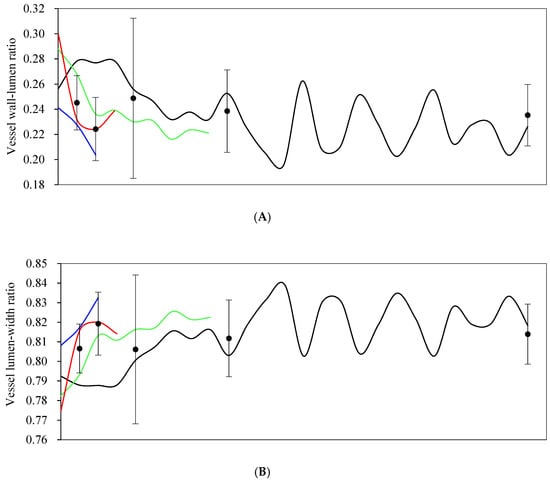
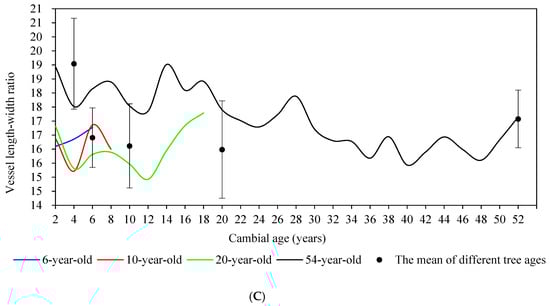
Figure 8.
The radial variation of vessel wall-lumen ratio (A), vessel lumen-width ratio (B) and vessel length-width ratio (C) versus cambial age and the mean of differently aged S. superba.
3.2. Description of the Wood Anatomical Properties
The annual ring width of 54-year-old S. superba fluctuated greatly (Table 3). The maximum ring (5.94 mm yr−1) width was 3.83 times higher than the minimum ring width (1.23 mm yr−1). The latewood (54.71% ± 6.71%) accounted for a larger proportion than earlywood. The maxima of wood air-dry density and wood basic density were 23.08% and 24.00% greater than their minima, respectively. The wood anatomical properties showed longer fibers (1838.58 ± 147.07 μm) and a smaller fiber width (32.63 ± 2.28 μm), compared to vessel length (1297.34 ± 107.16 μm) and vessel width (79.02 ± 8.38 μm). The fibers had a thicker cell wall thickness (16.33 ± 1.28 μm). This value was close to the fiber lumen diameter (16.31 ± 1.12 μm).
Table 3.
Statistics analysis of wood properties in 54-year-old S. superba specimens.
3.3. Radial Variation in Wood Anatomical Properties
According to the wood property variation trends, we first chose the 20th year as the boundary of early and later stages for analysis (Figure 9). The results showed that the annual ring width had the greatest total variation (46.29%) than all wood properties (8.52%). The mean value of the radial variation of the wood properties in the early stage (10.18%) was greater than that in the later stage (4.19%). The total variation of the wood air-dry density (5.74%) was similar to that of the wood basic density (5.29%) with minor variation. The total variation of the fiber properties (7.42%) was smaller than that (9.56%) of the vessel properties. For the fiber properties, the largest variation was in the fiber length (8.00%), and the smallest variation was in the fiber lumen diameter (6.84%). For the vessel properties, the largest variation was in the vessel lumen diameter (11.94%), and the smallest variation was in the vessel cell wall thickness (7.43%).
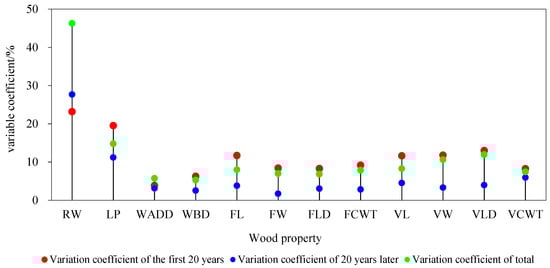
Figure 9.
The variation coefficient of wood properties of S. superba in the first 20 years, 20 years later and in all years. RW: ring width, LP: latewood percentage, WADD: wood air-dry density, WBD: wood basic density, FL: fiber length, FW: fiber width, FLD: fiber lumen diameter, FCWT: fiber cell wall thickness, VL: vessel length, VW: vessel width, VLD: vessel lumen diameter, VCWT: vessel cell wall thickness.
Overall, the annual ring width rapidly decreased from the pith and slightly decreased close to the bark (Figure 2). This reflected that S. superba grew faster and had a larger diameter increment in the early stage. The wood density decreased rapidly in the first 20 years with subsequent stabilization (Figure 3A,B). In the first 20 years, the mean wood air-dry density and basic density were 0.75 g·cm−3 and 0.56 g·cm−3, respectively. After 20 years, they decreased to a mean of 0.70 g·cm−3 and 0.52 g·cm−3, respectively.
The value of the fiber and vessel length increased gradually from the pith and then decreased after reaching the maximum value (Figure 4A and Figure 5A). The mean value of fiber length was 1769.55 ± 207.22 μm from the 2nd year to the 20th year, reaching the maximum at the 20th year (2034.11 ± 107.86μm) with a growth increase of 35.97%, and the variation was 11.71%. After the 20th year, the value of the fiber length fluctuated with a downward trend with cambial age, and the variation decreased to 3.80%. The vessel length increased rapidly from the 2nd year to the 14th year with growth increasing to 31.35%. The variation was 10.64% and remained stable from the 14th year to the 26th year with variation decreasing to 1.69%, and vessel length then decreased slightly with variation increasing to 3.33%.
The radial variation patterns of the fiber and vessel width, fiber lumen diameter and fiber cell wall thickness were slightly different from those of the fiber and vessel length. They increased rapidly with cambial age from the pith and remained stable with minor fluctuation. The fiber width varied between 27.11 and 34.28 μm, with growth increasing to 26.45% in the first 20 years and varying around a mean value of 33.87 μm in the later stage (Figure 4B). The value of vessel width increased from 58.72 to 87.66 μm gradually from the 2nd year to 24th year, with growth increasing to 49.28% and then approached an asymptotic value (83.68 μm) after the 24th year (Figure 5B). The fiber lumen diameter increased to 29.18%, and its variation was 8.29% from the 2nd year to the 20th year and then remained at a stable value (16.85 μm), with variation decreasing to 3.05% (Figure 4C). The fiber cell wall thickness reached the maximum (17.42 μm) in the 22nd year, with growth increasing to 25.26% and then fluctuated above and below 16.99 μm after the 22nd year (Figure 4D).
Vessel lumen diameter and vessel cell wall thickness increased from the pith and approached an asymptotic value near the outer wood, but there was a larger fluctuation in the later stage. The vessel lumen diameter reached the maximum (73.13 μm) in the 24th year, with growth increasing to 56.58%, and the variation was 14.47%. It then fluctuated above and below 69.05 μm after the 24th year, and the variation decreased to 3.98% (Figure 5C). The vessel cell wall thickness increased from 11.63 to 15.75 μm, with growth increasing to 35.48%, from the 2nd year to the 20th year, and the variation was 8.27%. It remained at a stable value of 14.65 μm, with variation decreasing to 5.95% (Figure 5D).
3.4. Correlation of Wood Anatomical Properties
According to the analysis of the radial variation trend of wood properties, the correlation analysis was divided into two sections (Table 4). In the first 20 years, there was an extremely significant positive correlation between cambial age and fiber (0.95~0.99) and vessel (0.90~0.98) morphology. The correlation between cambial age and fiber width was the greatest (R = 0.99). The ring width had a significant positive correlation with wood air-dry density (0.78) and wood basic density (0.89). There was an extremely significant positive correlation between fiber and vessel. The fiber indicators were positively correlated with each other, as were the vessel indicators. There was an extremely significant negative correlation between cambial age and ring width (−0.88), wood air-dry density (−0.84) and wood basic density (−0.98). The wood air-dry density and basic density had a significant negative correlation with fiber and vessel, especially the correlations between wood air-dry density, wood basic density, fiber cell wall thickness and vessel lumen diameter were the greatest. There was an extremely significant negative correlation between ring width and fiber (−0.79~−0.93) and vessel (−0.64~−0.90).
Table 4.
Correlation analysis among different wood properties in the first 20 years and after 20 years.
After 20 years, only the ring width (−0.86), fiber length (−0.85) and vessel length (−0.70) were significantly negatively correlated with cambial age (Table 4). This showed that ring width, fiber length and vessel length continued to decrease with age, while other indicators such as wood air-dry density, wood basic density and width, lumen diameter, cell wall thickness of fiber and vessel were in a stable state.
3.5. Models for Predicting Wood Anatomical Properties
The wood air-dry density and basic density are complex wood characteristics determining wood quality. Based on the above correlation results, the fiber width, fiber cell wall thickness and vessel lumen diameter had the greatest correlation with cambial age, wood air-dry density, wood basic density, respectively. Therefore, wood air-dry density, wood basic density, fiber width, fiber cell wall thickness and vessel lumen diameter were selected for model fitting, using fiber width, fiber cell wall thickness and vessel lumen diameter as variables and using multiple linear regression for wood basic density and wood air-dry density (Table 5). Using the Richards model to simulate negative growth was difficult, so this model of wood basic density and air-dry density is not represented in the table. The fitting accuracy of growth model was higher than that of the nonlinear least square model. The wood basic density, wood air-dry density and fiber cell wall thickness had a higher fitting accuracy in the Logistic model, which improved the R2 to 82.4%, 83.2% and 90.2% and reduced the RESE to 0.012, 0.017 and 0.400, respectively. The Richards model in the fiber width and vessel lumen diameter had a higher fitting accuracy, which accounted for 95.2% and 91.2% of the variation. This shows that the Logistic and Richards model had good predictability and practicality for wood basic density, wood air-dry density, fiber cell wall thickness, fiber width and vessel lumen diameter. In the multiple linear regression of wood basic density and wood air-dry density, the parameter accounting for a larger proportion was fiber cell wall thickness (40.76%) and vessel lumen diameter (62.46%).
Table 5.
Fitting parameters and evaluation of models of different wood properties.
3.6. Demarcation of Juvenile and Mature Wood
According to the variation trend of each wood property, since the latewood percentage had no obvious variation pattern with cambial age, it was not used to analyze for demarcation. The variation was divided into three sections using the optimal segmentation model, namely juvenile wood, transition wood and mature wood (Figure 10). The fiber width (R2 = 0.92), ring width (R2 = 0.91) and fiber cell wall thickness (R2 = 0.90) had larger accuracy, while vessel cell wall thickness (R2 = 0.50) had smaller accuracy. The model accuracy of the aggregative indicator was 0.76 (Figure 11). The juvenile period of each wood property was different and the calculation of aggregative indicators showed that the juvenile period was before the 10th year. Among all wood properties, the juvenile period of the fiber lumen diameter and vessel cell wall thickness was shorter (before the 4th year) and the juvenile period of wood air-dry density was longest (before the 14th year). Overall, the juvenile period of fiber properties was relatively shorter (before the 8th year), while the vessel properties gradually completed the juvenile period before the 12th year and entered the transition period.
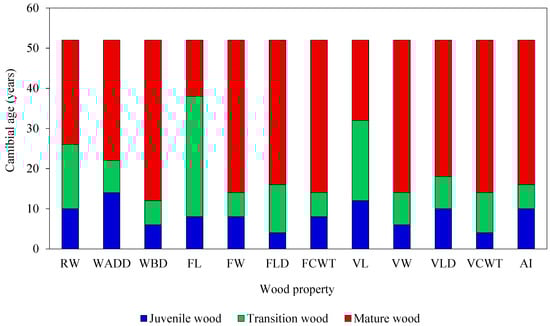
Figure 10.
Demarcation of juvenile wood, transition wood and mature wood in S. superba. RW: ring width, WADD: wood air-dry density, WBD: wood basic density, FL: fiber length, FW: fiber width, FLD: fiber lumen diameter, FCWT: fiber cell wall thickness, VL: vessel length, VW: vessel width, VLD: vessel lumen diameter, VCWT: vessel cell wall thickness, AI: aggregative indicator.
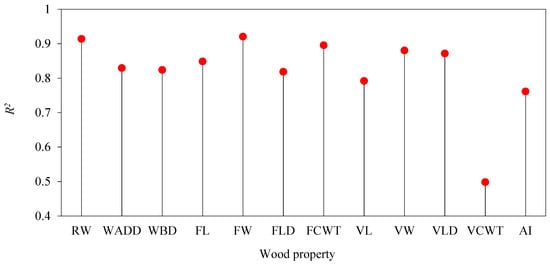
Figure 11.
The determination coefficient (R2) of demarcation of juvenile wood, transition wood and mature wood in S. superba according to the optimal segmentation model. RW: ring width, WADD: wood air-dry density, WBD: wood basic density, FL: fiber length, FW: fiber width, FLD: fiber lumen diameter, FCWT: fiber cell wall thickness, VL: vessel length, VW: vessel width, VLD: vessel lumen diameter, VCWT: vessel cell wall thickness, AI: aggregative indicator.
Most properties took 4–14 years to complete the transition period, except for the annual ring width (14 years), vessel length (18 years) and fiber length (28 years). This showed that the continuous change in growth rate, vessel length and fiber length took longer and, as a result, reached maturity relatively late. Overall, the transitional period was from the 11th to the 16th year, and the mature period was after the 16th year through calculation of the aggregative indicators.
There were significant differences among juvenile wood, transitional wood and mature wood for each wood property, showing that the above division was effective. The 12 wood properties showed three main patterns (Table 6). The first is where the values of juvenile wood were relatively larger, and those of the transitional wood and mature wood gradually became smaller, e.g., annual ring width, wood air-dry density and wood basic density. The second was where the values of juvenile wood were smaller, and the transition wood gradually increased towards mature wood, e.g., the width, lumen diameter and cell wall thickness of the fiber and vessel. The third was where the juvenile wood was smaller, the transition wood increased and the mature wood decreased, e.g., the length of fiber and vessel.
Table 6.
Descriptive statistics for the juvenile wood, transition wood and mature wood of S. superba.
4. Discussion
4.1. Description of the Wood Anatomical Properties
S. superba is a precious and high-quality broadleaf tree species. Understanding its wood anatomical properties is essential for wood utilization and genetic improvement. The wood air-dry density and basic density were, respectively, 0.73 g·cm−3 and 0.54 g·cm−3, which is moderately dense, similar to loblolly pine [,]. There was little variation in wood air-dry density and wood basic density among rings, indicating that the wood properties of S. superba were uniform and are convenient for processing and utilization. According to the regulations of the International Wood Anatomy Society, a wood fiber larger than 1600 μm is long, so the fiber of S. superba is long [].
4.2. Radial Variation of Wood Anatomical Properties
Variation is the basis of genetic improvement. Effective variation determines the potential for improvement []. The annual ring width is the primary indicator representing the radial growth rate of trees and one of the main factors causing radial variation. The results showed that the annual ring width had a larger variation than wood properties. This meant that the growth had greater potential for improvement than wood properties []. It may be that ring width is easily affected by environmental factors, and the general wood anatomical features are mainly controlled by genetics. In general, the variation of the vessels was greater than that of the fibers, and vessel lumen diameter and fiber length had the largest variation, which had greater potential for improvement by selective breeding. The radial variation of wood properties in the early stage was greater than that in the later stage, which revealed that cultivating a short juvenile period for wood properties is a strategy for wood property breeding. This may be due to the vigorous division of cambium cells in the juvenile stage and the subsequent decline in the mature stage.
Researching the radial variation pattern of wood anatomical properties is the basic way to understand wood formation and utilization []. Previous research had found that wood density increased in the early stage and then remained stable [,]. Other research found that wood density was largest in the pith and then decreased and stabilized to a constant value [,,]. In our study, the radial variation of wood density of S. superba belonged to the latter pattern; a decrease followed by stabilization. Wang et al. [] also found that 20-year-old and 42-year-old S. superba had the same variation pattern within plants. It is worth noting that the wood air-dry density and basic density of 54-year-old specimens were larger than at other ages near the pith. This may be because more extractives were deposited in the wood cell walls of heartwood. Cell death in the heartwood increases with age, and the extractives gradually increase [].
The fibers and vessels were the main components of broadleaf wood, and their changes are affected by many factors, especially the age of the tree. They showed a certain radial variation pattern with cambial age. A previous study found that the fiber length, fiber cell wall thickness and fiber cell wall to lumen ratio of earlywood and latewood of 13-year-old Catalpa bungei increased significantly with cambial age []. Similarly, fiber length and fiber width of 12-year-old poplar were found to gradually increase from the pith to the bark []. In another study, the fiber length of 40-year-old Betula pendula increased from the pith to the bark in all discs []. Similarly, according to our results, there were two radial variation patterns of fiber and vessel. One pattern showed an increase and a decrease, e.g., fiber and vessel length. These wood properties therefore needed continuous observation until they stabilized. The other pattern showed an increase and then stabilization, e.g., the width, lumen diameter and the cell wall thickness of the fiber and vessel. The variation pattern of the fiber and vessel among plants of different ages was similar to that within plants. This verifies the radial variation of the fiber and vessel. Furthermore, the fiber and vessel varied regularly, and this meant that it was feasible to distinguish the demarcation of juvenile and mature wood according to their radial variation pattern.
4.3. Correlation of Wood Anatomical Properties
Wood traits are controlled by multiple factors, causing one effect or one causing multiple effects []. Therefore, the correlation among wood properties was analyzed to provide a theoretical basis for comprehensive improvement of wood properties. Concurrently, rapid growth and excellent wood properties are an important goal for genetic improvement in wood []. According to our results, there was a significant negative correlation between annual ring width and fiber vessel in the early stage. This indicated that excessive growth would lose the qualities of the fiber and vessel in the early stage. Therefore, both growth and wood anatomical properties should be taken into account in the early improvement, but these correlations can be neglected in the mature stage. This result was also confirmed by Pacheco et al. [], who found that, in Pinus halepensis, the lower the radial growth rate was, the thicker the cell wall became. In addition, Lasserre et al. [] also found that a narrower ring width had a longer fiber length and a thicker cell wall in Pinus radiata. Furthermore, cambial age had a persistent and extremely significant negative affect on fiber length and vessel length. This also indicated that the fiber length and vessel length of S. superba were greatly affected by cambial age for a long time. Therefore, continuous observation of fiber length and vessel length was needed to determine their stable period.
4.4. Models for Predicting Wood Anatomical Properties
The tree theoretical growth equation can reflect the pattern of tree growth. Logistic and Richards are the most widely used models and have a good biological theoretical basis. Dahlen et al. [,] used a four-parameter logistic function to model the variation of specific gravity, tracheid length and width for Pinus taeda, and found that their initial model of cambial age explained 45%, 55% and 46% of the variation, respectively. The effect of disk height and ring width was then incorporated into the fixed model, improving the model fit to 56%, 71% and 57%. Auty et al. [] used an exponential function of cambial age, with the additional inclusion of ring width and sample height as explanatory variables, to model the wood’s basic specific gravity of Pinus sylvestris, and found that the fixed model could explain 57% of the variation, with an RESE of 0.043. There was also a non-linear least square method to simulate wood density. It also achieved the effect of quantifying the extent and pattern of radial variation in wood density [,]. Our results showed that the growth model was more suitable for the variation of wood anatomical properties than the nonlinear least square model, which laterally indicated that the wood anatomical properties accord with the “S” curve of the growth pattern. The simulation accuracy of the growth model reached more than 82.4%, showing that the model had relatively high precision.
4.5. Demarcation of Juvenile and Mature Wood
The demarcation of juvenile wood and mature wood is of great significance for understanding wood properties and for evaluating wood quality and use value. Different tree species have different boundaries between juvenile and mature wood. The fiber length of Betula pendula of 40-year-old specimens tended to be stable at the 15th growth ring from the pith to the bark, so the 15th ring was assumed to be the demarcation point of juvenile-mature wood []. The demarcation of juvenile and mature wood of loblolly pine is based on ring specific gravity, for a juvenile period averaging 4.3 years, followed by an 8.6-year transition period, with mature wood produced by the 13th year []. The juvenile wood of Hevea brasiliensis occurred between 40 and 55 mm from the pith []. From previous research, it was feasible to distinguish the demarcation using different wood properties from the pith to the bark. In our study, ring width, each wood property and aggregative indicators were used to distinguish between juvenile wood and mature wood. According to the different indicators, the results were different; overall, the juvenile wood was before the 10th year, transition age was between the 11th and the 16th years and the mature age was after the 16th year. Therefore, the wood of S. superba had better workability after the 16th year. Jordan et al. [] found that the demarcation between juvenile and mature wood of Pinus taeda based on specific gravity was not significantly different among different regions. This indicates that the demarcation between juvenile and mature wood in S. superba is representative.
5. Conclusions
The wood properties had smaller variation than the growth rate. The vessel lumen diameter and fiber length had greater potential for improvement. The juvenile stage was the best period for improvement. There were three radial variation patterns in the wood properties. One pattern showed a decrease and then a stabilization, e.g., wood air-dry density and wood basic density. Another pattern showed an increase and then a decrease, e.g., fiber length and vessel length. The third pattern showed an increase and then a stabilization, e.g., the width, lumen diameter and the cell wall thickness of the fiber and vessel. Both growth and wood anatomical properties should be taken into account in early improvement (before the 20th year), and they could be improved independently in the mature stage. The growth models of Logistic and Richards were more suitable for the radial variation of wood anatomical properties than the nonlinear least square model. Vessel lumen diameter and fiber cell wall thickness were the key factors affecting wood air-dry density and wood basic density. The transition wood between juvenile wood and mature wood was from the 11th to the 16th year based on aggregative indicators from the pith to the bark at breast height. Therefore, the wood of S. superba had better workability after the 16th year.
Author Contributions
Y.W.; Investigation, Data curation, Formal analysis, Writing—Original Draft; R.Z.; Investigation, Conceptualization, Methodology, Writing—review & editing. Z.Z.; Investigation, Supervision, Project administration, Writing—review & editing. All authors have read and agreed to the published version of the manuscript.
Funding
This study was supported by Zhejiang Provincial Natural Science Foundation of China (grant No. LQ19C160002), the Special Fund for Breeding New Varieties of Forest Species in Zhejiang Province (grant No. 2016C02056-3), the Science and Technology Innovation Project in Jiangxi Province (grant No. 201919) and the Sixth Stages of Planting and Seedling Science and Technology of Fujian Province (grant No. 201906).
Data Availability Statement
Available upon reasonable request.
Acknowledgments
The authors thank Lizhen Ma and Shaohua Huang (Forestry Technology Extension Center of Jian’ou, Fujian) and Huihua Fan (Fujian Academy of Forestry Sciences) for their assistance in the investigation of the experimental forests.
Conflicts of Interest
The authors declare no conflict of interest.
References
- Kimberley, M.O.; Cown, D.J.; Mckinley, R.B.; Moore, J.R.; Dowling, L.J. Modelling Variation in Wood Density Within and among Trees in Stands of New Zealand-grown Radiata Pine. N. Z. J. For. Sci. 2015, 45, 22. [Google Scholar] [CrossRef]
- Schimleck, L.; Antony, F.; Dahlen, J.; Moore, J. Wood and Fiber Quality of Plantation-grown Conifers: A Summary of Research with an Emphasis on Loblolly and Radiata Pine. Forests 2018, 9, 298. [Google Scholar] [CrossRef]
- Pacheco, A.; Camarero, J.J.; Carrer, M. Linking Wood Anatomy and Xylogenesis Allows Pinpointing of Climate and Drought Influences on Growth of Coexisting Conifers in Continental Mediterranean Climate. Tree Physiol. 2016, 36, 502–512. [Google Scholar] [CrossRef] [PubMed]
- De Mil, T.; Tarelkin, Y.; Hahn, S.; Hubau, W.; Deklerck, V.; Debeir, O.; Van Acker, J.; Cannière, C.; Beeckman, H.; Van den Bulcke, J. Wood Density Profiles and Their Corresponding Tissue Fractions in Tropical Angiosperm Trees. Forests 2018, 12, 763. [Google Scholar] [CrossRef]
- Liu, Y.; Zhou, L.; Zhu, Y.; Liu, S. Anatomical Features and Its Radial Variations among Different Catalpa bungei Clones. Forests 2020, 11, 824. [Google Scholar] [CrossRef]
- Antony, F.; Schimleck, L.R.; Jordan, L.; Hornsby, B.; Dahlen, J.; Daniels, R.F.; Clark, A., III; Apiolaza, L.A.; Huber, D. Growth and Wood Properties of Genetically Improved Loblolly Pine: Propagation Type Comparison and Genetic Parameters. Can. J. For. Res. 2014, 44, 263–272. [Google Scholar] [CrossRef]
- Mäkinen, H.; Saranpää, P.; Linder, S. Wood-density Variation of Norway Spruce in Relation to Nutrient Optimization and Fibre Dimensions. Can. J. For. Res. 2002, 32, 185–194. [Google Scholar] [CrossRef]
- Jordan, L.; Clark, A., III; Schimleck, L.R.; Hall, D.B.; Daniels, R.F. Regional Variation in Wood Specific Gravity of Planted Loblolly Pine in the United States. Can. J. For. Res. 2008, 38, 698–710. [Google Scholar] [CrossRef]
- Li, S.; Li, X.; Link, R.; Li, R.; Deng, L.; Schuldt, B.; Jiang, X.; Zhao, R.; Zheng, J.; Li, S.; et al. Influence of Cambial Age and Axial Height on the Spatial Patterns of Xylem Traits in Catalpa bungei, a Ring-porous Tree Species Native to China. Forests 2019, 10, 16. [Google Scholar] [CrossRef]
- Dahlen, J.; Auty, D.; Eberhardt, T.L. Models for Predicting Specific Gravity and Ring Width for Loblolly Pine from Intensively Managed Plantations, and Implications for Wood Utilization. Forests 2018, 9, 292. [Google Scholar] [CrossRef]
- Dahlen, J.; Nabavi, M.; Auty, D.; Schimleck, L.; Eberhardt, T.L. Models for Predicting the Within-tree and Regional Variation of Tracheid Length and Width for Plantation Loblolly Pine. Forestry 2020, 93, 1–14. [Google Scholar] [CrossRef]
- Nock, C.A.; Geihofer, D.; Grabner, M.; Baker, P.J.; Bunyavejchewin, S.; Hietz, P. Wood Density and Its Radial Variation in Six Canopy Tree Species Differing in Shade-tolerance in Western Thailand. Ann. Bot. 2009, 104, 297–306. [Google Scholar] [CrossRef]
- Peng, M.; Stewart, J.D. Development, Validation, and Application of a Model of Intra-and Inter-tree Variability of Wood Density for Lodgepole Pine in Western Canada. Can. J. For. Res. 2013, 43, 1172–1180. [Google Scholar] [CrossRef]
- Palermo, G.P.D.M.; Latorraca, J.V.D.F.; Carvalho, A.M.D.; Calonego, F.W.; Severo, E.T.D. Anatomical Properties of Eucalyptus grandis Wood and Transition Age between the Juvenile and Mature Woods. Eur. J. Wood Wood Prod. 2015, 73, 775–780. [Google Scholar] [CrossRef]
- Mvolo, C.; Koubaa, A.; Beaulieu, J.; Cloutier, A.; Mazerolle, M.J. Variation in Wood Quality in White Spruce (Picea Glauca (Moench) Voss). Part I. Defining the Juvenile-mature Wood Transition Based on Tracheid Length. Forests 2015, 6, 183–202. [Google Scholar] [CrossRef]
- Jyske, T.; Hölttä, T.; Mäkinen, H.; Nöjd, P.; Lumme, I.; Spiecker, H. The Effect of Artificially Induced Drought on Radial Increment and Wood Properties of Norway Spruce. Tree Physiol. 2010, 30, 103–115. [Google Scholar] [CrossRef] [PubMed]
- Nabavi, M.; Dahlen, J.; Schimleck, L.; Eberhardt, T.L.; Montes, C. Regional Calibration Models for Predicting Loblolly Pine Tracheid Properties Using Near-infrared Spectroscopy. Wood Sci. Technol. 2018, 52, 445–463. [Google Scholar] [CrossRef]
- Schimleck, L.; Antony, F.; Mora, C.; Dahlen, J. Comparison of Whole-tree Wood Property Maps for 13-year-old and 22-year-old Loblolly Pine. Forests 2018, 9, 287. [Google Scholar] [CrossRef]
- Yang, H.; Zhang, R.; Song, P.; Zhou, Z. The Floral Biology, Breeding System and Pollination Efficiency of Schima superba Gardn. et Champ. (Theaceae). Forests 2017, 8, 404. [Google Scholar] [CrossRef]
- Zhang, R.; Yang, H.; Zhou, Z.; Shen, B.; Xiao, J.; Wang, B. A High-density Genetic Map of Schima superba Based on Its Chromosomal Characteristics. BMC Plant Biol. 2019, 19, 41. [Google Scholar] [CrossRef]
- Wang, X.; Chen, L.; Ma, L.; Fan, H.; Ye, S.; Zhou, Z. Geographical Provenance Variation of Growth and Wood Basic Density of 7-year-old Schima superba and Its Provenance Selection. For. Res. 2011, 24, 307–313. [Google Scholar]
- Wang, Y.; Zhang, R.; Zhou, Z.; Hua, B.; Fan, H.; Ma, L. A Variation and Selection of Growth and Wood Traits for 10-year-old Schima superba. J. Nanjing For. Univ. 2020, 44, 85–92. [Google Scholar]
- Cheng, J. Wood Science; China Forestry Publishing House: Beijing, China, 1985; pp. 82–85. [Google Scholar]
- Kimberley, M.O.; Mckinley, R.B.; Cown, D.J.; Moore, J.R. Modelling the Variation in Wood Density of New Zealand-grown Douglas-fir. N. Z. J. For. Sci. 2017, 47, 15. [Google Scholar] [CrossRef]
- IAWA Committee. IAWA List of Microscopic Features for Hardwood Identification. IAWA Bull. 1989, 10, 219–332. [Google Scholar]
- Settle, D.J.; Page, T.; Bush, D.; Doran, J.; Sethy, M.; Viji, I. Basic Density, Diameter and Radial Variation of Vanuatu Whitewood (Endospermum medullosum): Potential for Breeding in a Low Density, Tropical Hardwood. Int. For. Rev. 2012, 14, 463–475. [Google Scholar] [CrossRef]
- Fang, S.; Yang, W.; Fu, X. Variation of Microfibril Angle and Its Correlation to Wood Properties in Poplars. J. For. Res. 2004, 15, 261–267. [Google Scholar]
- Fearnside, P.M. Wood Density for Estimating Forest Biomass in Brazilian Amazonia. For. Ecol. Manag. 1997, 90, 59–87. [Google Scholar] [CrossRef]
- Knapic, S.; Louzada, J.L.; Leal, S.; Pereira, H. Radial Variation of Wood Density Components and Ring Width in Cork Oak Trees. Ann. For. Sci. 2007, 64, 211–218. [Google Scholar] [CrossRef]
- Xiang, W.; Leitch, M.; Auty, D.; Duchateau, E.; Achim, A. Radial Trends in Black Spruce Wood Density Can Show an Age- and Growth-related Decline. Ann. For. Sci. 2014, 71, 603–615. [Google Scholar] [CrossRef]
- Wang, X.; Ma, L.; Ma, X.; Chen, L.; Zhou, Z. Growth and Wood Basic Density of Schima superba Plantation. Sci. Silvae Sin. 2011, 47, 138–144. [Google Scholar]
- Song, K.; Yin, Y.; Salmén, L.; Xiao, F.; Jiang, X. Changes in the Properties of Wood Cell Walls during the Transformation from Sapwood to Heartwood. J. Mater. Sci. 2014, 49, 1734–1742. [Google Scholar] [CrossRef]
- Bonham, V.A.; Barnett, J.R. Fiber Length and Microfibril Angle in Silver Birch (Betula pendula Roth). Holzforschung 2001, 55, 159–162. [Google Scholar] [CrossRef]
- Kimberley, M.O.; Moore, J.R.; Dungey, H.S. Modelling the Effects of Genetic Improvement on Radiata Pine Wood Density. N. Z. J. For. Sci. 2016, 46, 8. [Google Scholar] [CrossRef]
- Jiang, X.; Yin, Y.; Urakami, H. Variation within Tree of Wood Anatomical Properties and Basic Density of I-214 Poplar in Beijing Area and Their Relationship Modelling Equations. Sci. Silvae Sin. 2003, 39, 115–121. [Google Scholar]
- Lasserre, J.P.; Mason, E.G.; Watt, M.S.; Moore, J.R. Influence of Initial Planting Spacing and Genotype on Microfibril Angle, Wood Density, Fiber Properties and Modulus of Elasticity in Pinus radiata D. Don Corewood. For. Ecol. Manag. 2009, 258, 1924–1931. [Google Scholar] [CrossRef]
- Auty, D.; Achim, A.; Macdonald, E.; Cameron, A.D.; Gardiner, B.A. Models for Predicting Wood Density Variation in Scots Pine. Forestry 2014, 87, 449–458. [Google Scholar] [CrossRef]
- Ferreira, A.L.; Severe, E.T.D.; Calonego, F.W. Determination of Fiber Length and Juvenile and Mature Wood Zones from Hevea brasiliensis Trees Grown in Brazil. Eur. J. Wood Wood Prod. 2011, 69, 659–662. [Google Scholar] [CrossRef]
Publisher’s Note: MDPI stays neutral with regard to jurisdictional claims in published maps and institutional affiliations. |
© 2021 by the authors. Licensee MDPI, Basel, Switzerland. This article is an open access article distributed under the terms and conditions of the Creative Commons Attribution (CC BY) license (https://creativecommons.org/licenses/by/4.0/).