Abstract
Climate-smart forestry is a sustainable forest management approach for increasing positive climate impacts on society. As climate-smart forestry is focusing on more sustainable solutions that are resource-efficient and circular, digitalization plays an important role in its implementation. The article aimed to validate an automatic workflow of processing 3D pointclouds to produce digital twins for every tree on large 1-ha sample plots using a GeoSLAM mobile LiDAR scanner and VirtSilv AI platform. Specific objectives were to test the efficiency of segmentation technique developed in the platform for individual trees from an initial cloud of 3D points observed in the field and to quantify the efficiency of digital twinning by comparing the automatically generated results of (DBH, H, and Volume) with traditional measurements. A number of 1399 trees were scanned with LiDAR to create digital twins and, for validation, were measured with traditional tools such as forest tape and vertex. The segmentation algorithm developed in the platform to extract individual 3D trees recorded an accuracy varying between 95 and 98%. This result was higher in accuracy than reported by other solutions. When compared to traditional measurements the bias for diameter at breast height (DBH) and height was not significant. Digital twinning offers a blockchain solution for digitalization, and AI platforms are able to provide technological advantage in preserving and restoring biodiversity with sustainable forest management.
1. Introduction
Technology-based on digital twins extends well beyond the initial design to the merging of the world of IoT (Internet of Things), AI (artificial intelligence), and big data analytics [1]. Digitally replicating the real world, as more data becomes available, empowers data scientists and other IT specialists to optimize deployments for peak efficiency, as well as create other potential what-if scenarios [2]. Buildings, factories, and even entire cities are now digitally represented as digital twins [3]. Some have suggested even people, processes, and organizations have digital twins, expanding the concept of digital twins even further [4].
Known as the part of world who harbors the highest biodiversity, forests are one of the most complex systems from a structural and functional point of view. In addition to their role as recreational resources, wood products, and material and energy providers, forests and the forest sector are fundamental in reducing greenhouse gas emissions by capturing carbon dioxide in tree biomass. [5]. Climate-smart forestry is a sustainable forest management approach for increasing these positive climate impacts on society [6]. In response to climate change, the approach intends to reduce greenhouse gas emissions, adapt forest management to create resilient forests and focus on active forest management with the goal of sustainability by increasing productivity while simultaneously offering forest benefits [7,8]. With two big challenges ahead, a green and digital transition, digital twinning in forestry is the next development step [9]. Digitalization plays a key role in climate-smart forestry’s focus on sustainable, resource-efficiency, and circular solutions [10].
In forests, we observe extensive vertical stratification, making them among the world’s most complex ecosystems [11]. Forests containing conifers are the simplest as they consist of a tree layer reaching about 30 m in height, a shrub layer that often is spotty, and a soil layer covered with mosses and lichens [12]. Forests with deciduous foliage are more complex; a rainforest canopy consists of at least three different layers, while deciduous trees have a separate upper and lower layer [13]. Due to this complexity, accurate characterization of forests using precise inventory remains one of the most challenging activities in the digitalization of forestry [14,15].
Equipment and techniques have become more affordable and accessible in recent years. With the development of technology to generate 3D scenes from measurements, LIDAR has become more portable and more affordable [16]. This has enabled the building of virtual worlds that reflect natural landscapes using precision measurements. Particularly, terrestrial lidar systems collect large amounts of data varying from tens of thousands to billions of 3D points to determine the 3D space surrounding a given point in 3D [17].
In forest inventories, a TLS (terrestrial lidars scanner) can document forests rapidly, automatically, and provide inch-by-inch details in minutes. Early work related to forest inventory estimation via TLS started with the development of Cyra Technologies’ TLS system around 2000; and it was later acquired by Leica in 2001 [18,19,20,21]. Forest inventories used TLS as a way to improve harvest efficiency by replacing manual measurements with measurements derived from TLS data in the forest plots [22]. As a result, TLS has been used in collecting basic attributes such as DBH (diameter at breast height), tree height, and tree position in forest sample plots [23,24]. A scientifically confirmed fact is that the measuring diameter and height of a tree are affected by an error of at least 5.6% and the measurement bias of DBH and H affects estimation up to 26.4% [25,26,27]. Therefore, using classical methods for estimating volume and biomass are not suitable for modern needs in the context of a circular economy.
Virtual tree measurements are achieved today by using software applications and allometric approaches [28,29,30,31,32,33]. However, the quality of results and maturity of these algorithms are still low [34,35]. Furthermore, there is no digitalization workflow on the market that would be able to provide a complete set of solutions to the problem, from the measurements in the forest to creating digital twins of each tree [36]. There are several challenges in the field of measuring trees in the real world, and multiple scans are needed from a variety of angles to capture all trees in the area of interest in their full height if possible [37,38]. Another aspect is the problem of segmentation of individual trees and the delimitation of the soil surface [35,39]. These are crucial for the entire process of forest digital twinning, and current solutions often fail due to certain oblique orientations of the trunks, the presence of shrubs in the soil, and other obstructions present in various cases [40,41]. With regards to biometric data extraction, most known methods use overly simplified models that aspire to approximate trunk geometry through cylinders or cones and excessively complex models that try to model the observational data with as much precision as possible [36,40].
Among other software that provide partial or total solution to digital twinning (e.g., 3D Forest, OPALS, TreeQSM), VirtSilv is a newly developed platform that responds to the realities of the forest and provides industry-specific services in all segments [42]. VirtSilv is an online platform that uses AI customizable algorithms to produce unique shapes of trees as digital support for a fully automated traceability IT circuit between forest management, transport, and the wood industry.
In the current context of software development there is a need to validate an entire workflow starting with data collection and finishing with providing digital twins usable in forestry, easily accessible to decision makers. The article aims to validate an automatic workflow of processing 3D pointclouds to produce digital twins for every tree in a specific forest using GeoSLAM mobile LiDAR scanner and VirtSilv AI platform. The specific goals were: (1) to test the efficiency of segmentation technique developed in the platform for individual trees from an initial cloud of 3D points observed in the field; and (2) to quantify the efficiency of digital twinning by comparing the automatically generated results of (DBH, H and volume) with traditional measurements.
2. Materials and Methods
2.1. Study Area
Several measurement campaigns were carried out, using both a mobile LIDAR device and traditional forest inventory tools (forestry tape for DBH—diameter at breast height and vertex logger IV for tree height), focusing on three plots of 1 ha size in Carpathian Mountains, Ciucas Massif (Figure 1). For this part of the Carpathians, according to the WorldClim global database on weather and climate data [43], elevations range between 800 and 2400 m a.s.l. and the climate is temperate-continental, with wet summers and cold winters. The same source mentions for this area mean annual precipitation from 615.4 mm to 1095 mm (overall annual mean 793.4 mm; standard deviation 84.7) and mean annual temperature between 1.2 and 9.2 °C.
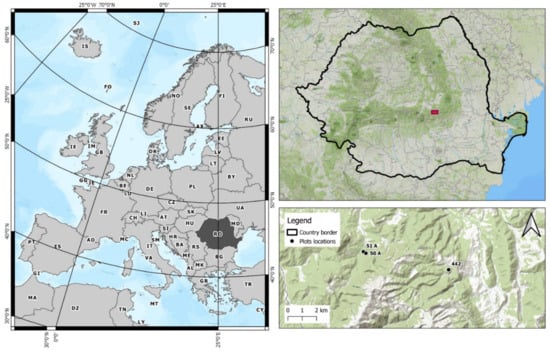
Figure 1.
Location of the study.
The 1-ha size plots were selected based on the tree density, geo-spatial distribution, focusing on the forests of economic interest planned for thinnings and selective logging.
2.2. Data
The plots were scanned using ZEB Horizon, a scanner based on LiDAR technology, and included in the category of terrestrial laser scanners (TLS). This is a 3D scanner of high-speed used for measurements that require recording of details. A ZEB Horizon Scanner uses laser technology, weighing 1.3 kg it is designed for outdoor applications that require scanning up to 100 m and at an accuracy of 1–3 cm. The scanner uses a rotating mirror to beam around the area that is scanned. The measurement characteristics consist of up to 300,000 repetitions per second. Data acquired using GEOSLAM Horizon technology is a point cloud in the form of three-dimensional data compiled using SLAM (simultaneous localization and mapping). The scanning time suitable to produce dense pointclouds was on an average of approximately 20 min/hectare for each plot.
Data collection was carried out in mixed forests, predominated by spruce and beech. This results in a point cloud made representing the scanner’s environment in a three-dimensional dataset (Figure 2). Later, the point cloud is mentioned as the laser scan (or simply scan).
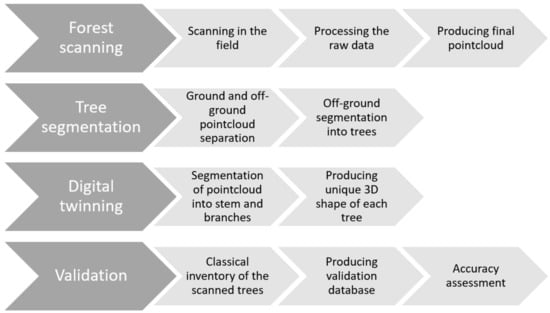
Figure 2.
Methodology workflow.
The traditional inventory was made by two teams consisting of two forest engineers. The average processing time per team was on average of 8 h/hectare.
2.3. Tree Segmentation
The raw data generated during the scanning process enables the visual identification of individual tree structures, but they are not yet quantitatively differentiated. To create individual raw material for digital twin, VirtSilv first separates the ground from the trees, and then it reconstructs each tree separately (Figure 2). The algorithm takes three steps to estimate each tree’s footprint simultaneously. The algorithm begins at a large nucleus of points with high density and then grows by accretion until it meets neighboring trees. As a result, the operator is given many options to customize the algorithm and is given the option to change data sets according to their needs. The average processing time of segmentation was 30 min for a 1-ha plot.
2.4. Digital Twinning Process
When all of the individual tree segments are identified, the remaining task is to recognize tree trunks and model their numerical dimensions on a simple and flexible basis, thereby giving the potential for the digital twinning process. To overcome the limitations of current techniques, VirtSilv algorithms are designed around the following principles:
- The trunk shape of segments of sufficiently small height can be approximated very well by inclined cone trunks;
- The vertical projection of the data obtained from segments of sufficiently small height can be approximated by a ring of points with relatively high density;
- Generally, the successive segments in the vertical array are very well aligned, in the sense that the angle and bending of each segment, concerning that vertical changes are low.
Thus, the VirtSilv algorithm is focused on extracting chains of cone trunks as a numerical model for trunks. The average time of producing the 3D model of a tree digital twin is less than one minute.
2.5. Validation, Accuracy Assessment, Robustness Check
For validation, a Bland–Altman test was used. These plots are extensively used to evaluate the agreement among two different instruments or two measurement techniques. Bland–Altman plots allow identification of any systematic difference between the measurements (i.e., fixed bias) or possible outliers. This can be carried out by Bland and Altman’s approximate method or by more precise methods [44,45].
For detecting heteroskedasticity the Breusch-Pagan test was used. It involved using a variance function and using a χ2-squared test: the test statistic is distributed nχ2 with k degrees of freedom. If the test statistic has a p-value below an appropriate threshold (e.g., p < 0.05) then the null hypothesis of homoskedasticity is rejected and heteroskedasticity assumed.
The boundaries of Bland and Altman’s agreement have traditionally been used to evaluate the agreement between different methods of measuring discrete variables. However, when the variances of the measurement errors of different methods are similar, Bland and Altman’s plot can be misleading. Therefore, it was used the R package “MethodCompare” to generate a bias plot and a precision plot based [46].
3. Results
After the traditional inventory was realized, a total number of 1369 trees were sampled in the three forest plots (Figure 3). Plot 442 had the highest tree density of 739 per hectare, average DBH of 32.54 cm, average height 29.8, average tree volume 1.25 m3, and a total volume of 923.06 m3/ha. Plot 051A had a tree density of 373 per hectare, average DBH of 52.14 cm, average height 36.4, average tree volume 3.65 m3, and a total volume of 1363.35 m3/ha. Plot 050A had the lowest tree density of 258 per hectare, average DBH of 56.13 cm, average height 38.9, average tree volume 4.32 m3, and a total volume of 1112.57 m3/ha.
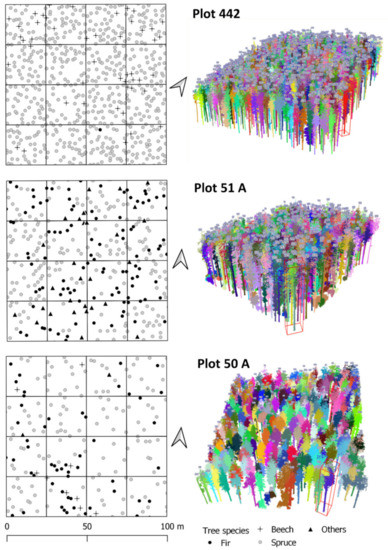
Figure 3.
Results of segmentation for three plots, maps produced based on traditional measurements (left column), and 3D maps with digital twins produced with VirtSilv AI platform (right column).
VirtSilv automatically segmented 1339 with an overall accuracy of segmentation of 97.8% (Figure 3). In plot 442 the accuracy of segmentation was 99.1%, in plot 051A was 95.2%, and 98.1% in plot 050A.
Out of 30 trees which were unsegmented/missed by the segmentation algorithm of VirtSilv, the distribution per species was represented by Spruce 37%, Beech 37%, Sycamore 17%, and Fir 10%. Overall, an approximate balance between coniferous and deciduous was maintained. In the case of beech trees, the average DBH was 16.6 lower than the average 27.6. For spruce, the DBH was 42.4, closer to the average 40.9 especially due to the sample size, as spruce is the most represented in all three plots.
As a result of the digital twinning process, VirtSilv reconstructed 1339 trees, a population of data described by average DBH and H almost similar to the ones recorded in traditional measurements (Table 1). Regarding the volume, the average values were slightly different mostly to the fact that the volume calculated with VirtSilv was based on the unique 3D shape of each tree, unlike the traditional volume which was calculated using the specific equation based on species, DBH, and height. In terms of all descriptive statistics, both traditional (DBH_t, H_t, Vol_t) and virtual measurements (DBH_v, H_v, Vol_v) presented similar results (Table 1).

Table 1.
Results for parameters extracted (DBH, height, volume).
Statistical populations differ in the way they are measured based on different techniques used when measuring either traditional or virtual. As for DBH and H characteristics, both the traditional and virtual measurements are applying the same mathematical approach. This similar approach is seen in the standard error, median, mode, standard deviation, and curve distribution characteristics, as they are close to each other on both traditional and virtual measurements (Table 1). In the case of volumes, the characteristics of the populations are slightly different as the mathematical approach is different between traditional and virtual measurements. The traditional approach did not involve measuring the volume of the trees, as the formula for calculating the volume derives from trees’ species, DBH, and height. These different approach changes are observed in the different range values, with a difference of 10%, or in a very high (75%) difference between the minimum values of volume populations (Table 1).
According to the Breusch-Pagan test used on all measurements (DBH, H, and volume), heteroskedasticity is not present. The variance function and the χ2-test were used to test the null hypothesis that heteroskedasticity is not present, and they show that the variability of the random disturbance is not different across elements of the vector (Table A1).
The Pearson correlation coefficient used to examine the strength and direction of the linear relationship between classical and virtual measurement continuous variables indicates values over 0.9 (very close to the absolute value of 1), which indicates a perfect linear relationship. The relationship with the highest correlation coefficient was identified at DBH measurements of 0.96 and the lowest was identified at height measurements of 0.9 (Figure 4).
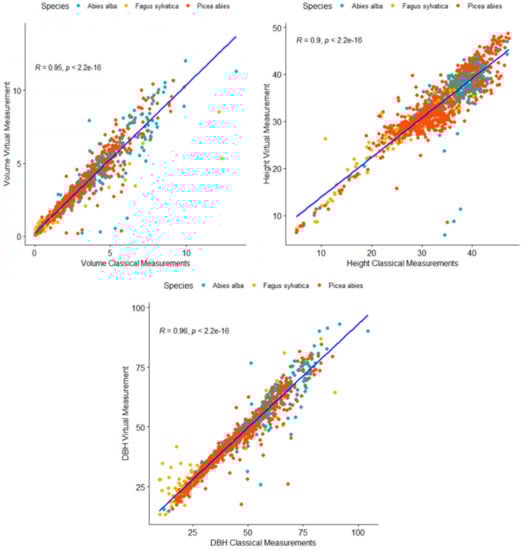
Figure 4.
Correlations between classical measurements and virtual measurements.
The lower R value in height measurements is given by an overestimation in the virtual environment at dominated trees, as in some cases additional branches from neighboring trees interfered with the measurement process. In case of DBH, it can be observed that a cluster of Fagus sylvatica trees with lower diameters than 25 were overestimated due to high density of branches at 1.3 m on the stem (Figure 3).
The p-values for the correlation between classical and virtual measurements are less than the significance level of 0.05, which indicates that the correlation coefficients are significant (Figure 4).
Bland and Altman’s limits of agreement plot (LoA) described how far apart measurements by two methods were more likely to be for most individuals. Inside LoA there were calculated the mean difference, the estimated bias, and the standard deviations of the differences to measure the random fluctuations around the mean. The mean value of the difference does not differ significantly from 0 on all observed characteristics. The differences within a mean of ± 1.96 SD appeared as not important, most of them remaining in the 95% limits of agreement for each comparison, concluding that the two methods may be used interchangeably and practically estimate the same results (Figure 5).
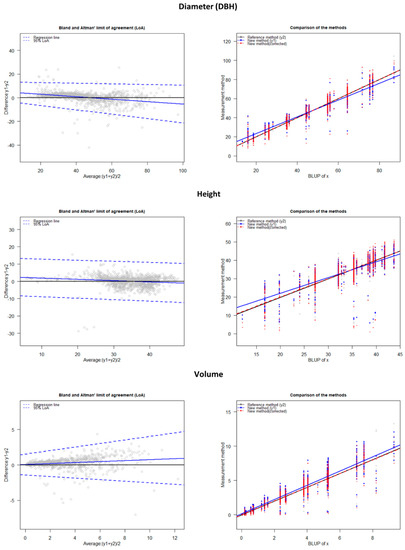
Figure 5.
Bland and Altman plot for DBH, height, and volume.
To visually appraise the performance of the new method in the spirit of Bland and Altman’s limits of the agreement, the bias plot and the precision plot were generated. These plots allow the visualization of the bias-corrected values (i.e., recalibrated values, variable y1_corr) of the new measurement method (Figure 5).
In the case of DBH, compared to the reference method, the new method has a differential bias of 6.098 and a proportional bias of 0.873. The variance of the new method is smaller than the one for the reference method. The scatter plot of the new method (virtual measurements) and reference method (traditional measurements) versus the best linear prediction (BLUP) with the two regression lines shows that the bias is decreasing with the increase of the DBH. The red bias line shows an inverse proportional trend as the bias of DBH is decreasing with the value from 4 cm in smaller diameters than 20 cm, to −4 cm in larger diameters over 80 cm. This shows a limitation of the virtual measurements as in younger trees the number of branches at 1.3 m is higher and affects the precision of measurement. The precision plot of the new measurement method shows that the standard deviation of measurement error is increasing with the increase of DBH (Figure 6).
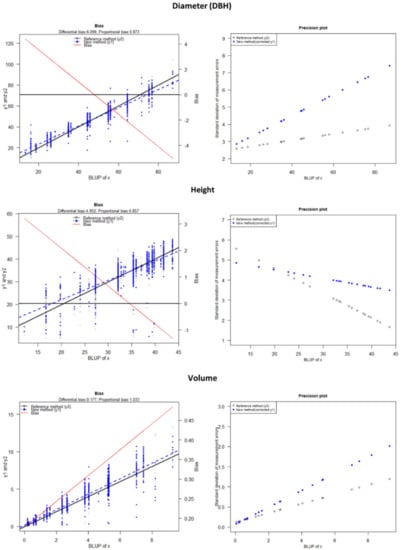
Figure 6.
Bias and precision plot.
For height, compared to the reference method (traditional measurements), the new method (virtual measurement) has a differential bias of 4.952 and a proportional bias of 0.857. The red bias line shows an inverse proportional trend as the bias of H is decreasing with the value from 3 m in smaller heights than 15 m, to −1 m in higher trees over 40 m. The standard deviation of measurement error trend shows that it is decreasing with the increase of DBH (Figure 6).
For tree volume, compared with the traditional method, the virtual measurement has a differential bias of 0.177 and a proportional bias of 1.033. The red line bias is showing that it is increasing with the increase of volume and the standard deviation of measurement error is increasing with the increase of tree volume. The increase of bias with volume is explained by the different approach in calculating the volume, as for traditional measurements the generalized formula is not taking into consideration local sites conditions and stand density and mixture which in many cases leads to an underestimation of volume.
4. Discussion
The forestry sector is well-positioned to play a strong role in reaching the objectives of the European Green Deal, including the EU Biodiversity Strategy 2030, the new EU Strategy on Adaptation to Climate Change, and the upcoming new Forest Strategy (H1 2021). Climate-smart forestry principles include maintaining and enhancing environmental benefits, biodiversity, and ecosystem services, as well as specific actions for maintaining and enhancing forest characteristics, biodiversity, and ecosystem services. Moreover, the EU’s Digital Strategy (launched in 2020) plans on transforming Europe into a digital single market by 2030. This strategy which covers the forestry sector should revolve around four key pillars: government, skills, infrastructure, and businesses. About 75% of EU businesses are expected to use cloud technology, artificial intelligence (AI), or big data by 2030, with more than 90% of SMEs expected to have at least a basic level of digital intensity by 2030 [47].
With two big challenges ahead (i.e., a green and digital transition) digital twinning and AI solutions in forestry are the next steps for more sustainable solutions that are resource-efficient and circular. At the same time, digital twinning will contribute to the European commitment to climate neutrality by 2050 [48]. Investing digital capabilities (including machine learning, artificial intelligence, and blockchain) may contribute to achieving EU Green Deals and digital transition objectives, including the forestry sector. Many global forestry operators and enterprises have already pioneered the progressive use of advanced technologies to enhance forest management results, particularly in plantation forestry, an approach that has become known as “precision forestry”. However, it has not yet become an established part of business-as-usual sustainable forest management practices, especially due to the lack of key components such as mobile scanners and complete solutions for analysis.
In this context, the present paper validates a workflow in supporting the digitalization process of the forestry sector to better inform and enhance the implementation of climate-smart forestry sustainable management practices. Currently, it has been demonstrated that digital twinning in forestry can be carried out on large areas using terrestrial perspective, producing accurate and complete digital twins for each tree [49]. Despite the capacity of ALS (airborne lidar scanning) to cover large areas, TLS remains the complete solution for complex forests with multiple stories [17,29]. The terrestrial perspective is giving the optimal results in producing the complete 3D pointclouds of trees since the understory eye-of-sight is increasing the visibility of the scanned objects such as trunks and lower branches.
In this paper it was demonstrated that for digital twinning in forestry the entire workflow needs to take into consideration both the field measurements as they are the most important part of digital twinning. The efficiency of the segmentation technique developed in the VirtSilv platform for individual trees from an initial cloud of 3D points observed in the field proved to be very high. The capacity of VirtSilv AI algorithms to be customized into a user-friendly interface improved the results of segmentation. Therefore, the AI algorithms integrated into the system successfully identified unique tree shapes from complex forest environments such as natural mixed beech, spruce, and fir forest. Moreover, the quality of the digital twins in terms of comparing the traditional tree inventory values (DBH, height, volume) was very high and accurate. VirtSilv AI platform proved to be a reliable solution in setting up an automatic workflow of processing 3D pointclouds to produce digital twins for every tree in a specific large area forest. When combined with a fast mobile LIDAR scanner such as Zeb Horizon, the digital twinning process was reduced to several hours. This method, compared with traditional inventory, reduced the processing and analysis time by approximately four-fold.
For the segmentation technique developed in the platform to extract individual trees using 3D points observed in the field, an accuracy varying between 95 and 98% was recorded. This result was higher in accuracy than reported by other solutions such as 3D Forest (85%–89.9%) [50].
The 1339 digital twins produced by the platform were similar in terms of DBH, H, and volume derived from traditional measurements. Even though it has had a non-significant influence on the results, the bias of DBH and H was decreasing with the increase of the values. It was found that both the scanning device and segmentation procedure had some limitations. It has been documented in other papers that the higher bias on lower values in DBH is mainly due to the noise in the pointcloud generated by the mobile scanner [41,49,51,52]. This bias is explained by noise effects especially on lower DBH. In the case of height, the bias is explained mostly by the segmentation technique which is influenced by the quality of the pointclouds. At lower heights, the digital twin can be contaminated with points from a neighboring taller tree, and this explains the descending trend of the bias with the increase of the tree height.
The upper canopy (branches and leaves) obscures some of the visible parts of the trunk, resulting in incomplete records. This is a common problem caused by the lack of vertical visibility. In terms of forest management, the upper part of the trunk does not usually have an industrial value, this being too thin in diameter. Still, this limitation remains an issue when managing other forest ecosystem services which rely on finer information. This study demonstrated that the visibility problem can be solved with a mobile laser and leaf-off scanning season, which is effective even in mixed coniferous-deciduous stands (as revealed in other studies as well) [49,53].
The European Union policy framework on forests aims to preserve and restore biodiversity with sustainable forest management. The sustainability principles will cover the entire forest cycle, seeking further knowledge on the optimum integration of all forest services. Digital twinning offers a strong informational background to achieve this principle, extending the knowledge on forests to decision makers and managers, and AI platforms will be the digital backbone for implementing this strategy.
5. Conclusions
The future of digitalization relies on the high capacity and adaptability of mobile scanners to produce complete and accurate pointclouds over large areas of forests and the speed and accuracy of A.I. platforms to translate the raw data into products for decision-makers. The workflow based on this technology is now validated using GeoSLAM scanner and VirtSilv platform to produce results comparable with methodologies which were previously only for research due to their difficulty and high production costs. This new approach brings the forest sector one step closer to the big data needed for climate-smart sustainable forest management.
Funding
This work was supported by a grant of the Romanian Ministry of Education and Research, CNCS–UEFISCDI, project number PN-III-P4-ID-PCE-2020-0401, within PNCDI III.
Acknowledgments
The author would like to thank for access to an educational account in VirtSilv platform and field support in the collection of traditional measurements to Forest Design, supported by Action No.: 2018-1-91, FPCUP project.
Conflicts of Interest
The author declares no conflict of interest.
Appendix A
Table A1.
Breusch-Pagan test.
Table A1.
Breusch-Pagan test.
| Variable | Breusch-Pagan Test |
|---|---|
| DBH | Residuals:
|
| Height | Residuals:
|
| Volume | Residuals:
|
*p < 0.1, *** p < 0.01.
References
- Zou, W.; Jing, W.; Chen, G.; Lu, Y.; Song, H. A Survey of Big Data Analytics for Smart Forestry. IEEE Access 2019, 7, 46621–46636. [Google Scholar] [CrossRef]
- Wagner, N.S.; Son, L.H.; Joo, M. Complex evolutionary artificial intelligence in cognitive digital twinning. J. Intell. Fuzzy Syst. 2021, 40, 2013–2016. [Google Scholar] [CrossRef]
- Dietz, M.; Pernul, G. Digital Twin: Empowering Enterprises Towards a System-of-Systems Approach. Bus. Inf. Syst. Eng. 2020, 62, 179–184. [Google Scholar] [CrossRef] [Green Version]
- Raj, P. Empowering digital twins with blockchain. Adv. Computers. 2021, 121, 267–283. [Google Scholar] [CrossRef]
- Pache, R.-G.; Abrudan, I.V.; Niță, M.-D. Economic Valuation of Carbon Storage and Sequestration in Retezat National Park, Romania. Forests 2021, 12, 43. [Google Scholar] [CrossRef]
- Verkerk, P.J.; Costanza, R.; Hetemäki, L.; Kubiszewski, I.; Leskinen, P.; Nabuurs, G.J.; Potočnik, J.; Palahí, M. Climate-Smart Forestry: The missing link. For. Policy Econ. 2020, 115, 102164. [Google Scholar] [CrossRef]
- Nabuurs, G.-J.; Delacote, P.; Ellison, D.; Hanewinkel, M.; Hetemäki, L.; Lindner, M. By 2050 the Mitigation Effects of EU Forests Could Nearly Double through Climate Smart Forestry. Forests 2017, 8, 484. [Google Scholar] [CrossRef] [Green Version]
- Bowditch, E.; Santopuoli, G.; Binder, F.; del Río, M.; La Porta, N.; Kluvankova, T.; Lesinski, J.; Motta, R.; Pach, M.; Panzacchi, P.; et al. What is Climate-Smart Forestry? A definition from a multinational collaborative process focused on mountain regions of Europe. Ecosyst. Serv. 2020, 43, 101113. [Google Scholar] [CrossRef]
- Scholz, R.W.; Bartelsman, E.J.; Diefenbach, S.; Franke, L.; Grunwald, A.; Helbing, D.; Hill, R.; Hilty, L.; Höjer, M.; Klauser, S.; et al. Unintended Side Effects of the Digital Transition: European Scientists’ Messages from a Proposition-Based Expert Round Table. Sustainability 2018, 10, 2001. [Google Scholar] [CrossRef] [Green Version]
- Müller, F.; Jaeger, D.; Hanewinkel, M. Digitization in wood supply—A review on how Industry 4.0 will change the forest value chain. Comput. Electron. Agric. 2019, 162, 206–218. [Google Scholar] [CrossRef]
- Manakos, I.; Tomaszewska, M.; Gkinis, I.; Brovkina, O.; Filchev, L.; Genc, L.; Gitas, I.Z.; Halabuk, A.; Inalpulat, M.; Irimescu, A.; et al. Comparison of Global and Continental Land Cover Products for Selected Study Areas in South Central and Eastern European Region. Remote Sens. 2018, 10, 1967. [Google Scholar] [CrossRef] [Green Version]
- Moreno, A.; Neumann, M.; Hasenauer, H. Forest structures across Europe. Geosci. Data J. 2017, 4, 17–28. [Google Scholar] [CrossRef]
- Drake, J.B.; Dubayah, R.O.; Knox, R.G.; Clark, D.B.; Blair, J.B. Sensitivity of large-footprint lidar to canopy structure and biomass in a neotropical rainforest. Remote Sens. Environ. 2002, 81, 378–392. [Google Scholar] [CrossRef]
- Akay, A.E.; Oǧuz, H.; Karas, I.R.; Aruga, K. Using LiDAR technology in forestry activities. Environ. Monit. Assess. 2009, 151, 117–125. [Google Scholar] [CrossRef] [PubMed]
- McRoberts, R.E.; Tomppo, E.O. Remote sensing support for national forest inventories. Remote Sens. Environ. 2007, 110, 412–419. [Google Scholar] [CrossRef]
- Tang, J.; Chen, Y.; Kukko, A.; Kaartinen, H.; Jaakkola, A.; Khoramshahi, E.; Hakala, T.; Hyyppä, J.; Holopainen, M.; Hyyppä, H. SLAM-Aided Stem Mapping for Forest Inventory with Small-Footprint Mobile LiDAR. Forests 2015, 6, 4588–4606. [Google Scholar] [CrossRef] [Green Version]
- Paris, C.; Kelbe, D.; van Aardt, J.; Bruzzone, L. A Novel Automatic Method for the Fusion of ALS and TLS LiDAR Data for Robust Assessment of Tree Crown Structure. IEEE Trans. Geosci. Remote Sens. 2017, 55, 3679–3693. [Google Scholar] [CrossRef]
- Lovell, J.L.; Jupp, D.L.B.; Culvenor, D.S.; Coops, N.C. Using airborne and ground-based ranging lidar to measure canopy structure in Australian forests. Can. J. Remote Sens. 2003, 29, 607–622. [Google Scholar] [CrossRef]
- Parker, G.G.; Harding, D.J.; Berger, M.L. A portable LIDAR system for rapid determination of forest canopy structure. J. Appl. Ecol. 2004, 41, 755–767. [Google Scholar] [CrossRef]
- Thies, M.; Pfeifer, N.; Winterhalder, D.; Gorte, B.G.H. Three-dimensional reconstruction of stems for assessment of taper, sweep and lean based on laser scanning of standing trees. Scand. J. For. Res. 2004, 19, 571–581. [Google Scholar] [CrossRef]
- Henning, J.G.; Radtke, P.J. Ground-based laser imaging for assessing three-dimensional forest canopy structure. In Proceedings of the Photogrammetric Engineering and Remote Sensing. Am. Soc. Photogramm. Remote Sens. 2006, 72, 1349–1358. [Google Scholar] [CrossRef]
- Hopkinson, C.; Chasmer, L.; Young-Pow, C.; Treitz, P. Assessing forest metrics with a ground-based scanning lidar. Can. J. For. Res. 2004, 34, 573–583. [Google Scholar] [CrossRef] [Green Version]
- Maas, H.G.; Bienert, A.; Scheller, S.; Keane, E. Automatic forest inventory parameter determination from terrestrial laser scanner data. Int. J. Remote. Sens. 2008, 29, 1579–1593. [Google Scholar] [CrossRef]
- Murphy, G.E.; Acuna, M.A.; Dumbrell, I. Tree value and log product yield determination in radiata pine (pinus radiata) plantations in australia: Comparisons of terrestrial laser scanning with a forest inventory system and manual measurements. Can. J. For. Res. 2010, 40, 2223–2233. [Google Scholar] [CrossRef]
- Islam, M.N.; Kurttila, M.; Mehtätalo, L.; Haara, A. Analyzing the effects of inventory errors on holding-level forest plans: The Case of measurement error in the basal area of the dominated tree species. Silva Fenn. 2009, 43, 71–85. [Google Scholar] [CrossRef] [Green Version]
- Li, R.; Weiskittel, A.R. Comparison of model forms for estimating stem taper and volume in the primary conifer species of the North American Acadian Region. Ann. For. Sci. 2010, 67, 302. [Google Scholar] [CrossRef] [Green Version]
- Berger, A.; Gschwantner, T.; McRoberts, R.E.; Schadauer, K. Effects of measurement errors on individual tree stem volume estimates for the Austrian national forest inventory. For. Sci. 2014, 60, 14–24. [Google Scholar] [CrossRef]
- Yu, X.; Liang, X.; Hyyppä, J.; Kankare, V.; Vastaranta, M.; Holopainen, M. Stem biomass estimation based on stem reconstruction from terrestrial laser scanning point clouds. Remote Sens. Lett. 2013, 4, 344–353. [Google Scholar] [CrossRef]
- Kankare, V.; Liang, X.; Vastaranta, M.; Yu, X.; Holopainen, M.; Hyyppä, J. Diameter distribution estimation with laser scanning based multisource single tree inventory. ISPRS J. Photogramm. Remote Sens. 2015, 108, 161–171. [Google Scholar] [CrossRef]
- Liang, X.; Kankare, V.; Yu, X.; Hyyppä, J.; Holopainen, M. Automated stem curve measurement using terrestrial laser scanning. IEEE Trans. Geosci. Remote Sens. 2014, 52, 1739–1748. [Google Scholar] [CrossRef]
- Astrup, R.; Ducey, M.J.; Granhus, A.; Ritter, T.; von Lüpke, N. Approaches for estimating stand-level volume using terrestrial laser scanning in a single-scan mode. Can. J. For. Res. 2014, 44, 666–676. [Google Scholar] [CrossRef]
- Newnham, G.J.; Armston, J.D.; Calders, K.; Disney, M.I.; Lovell, J.L.; Schaaf, C.B.; Strahler, A.H.; Mark Danson, F. Terrestrial laser scanning for plot-scale forest measurement. Curr. For. Rep. 2015, 1, 239–251. [Google Scholar] [CrossRef] [Green Version]
- Tomșa, V.R.; Curtu, A.L.; Niță, M.D. Tree Shape Variability in a Mixed Oak Forest Using Terrestrial Laser Technology: Implications for Mating System Analysis. Forests 2021, 12, 253. [Google Scholar] [CrossRef]
- Tansey, K.; Selmes, N.; Anstee, A.; Tate, N.J.; Denniss, A. Estimating tree and stand variables in a Corsican Pine woodland from terrestrial laser scanner data. Int. J. Remote Sens. 2009, 30, 5195–5209. [Google Scholar] [CrossRef]
- Li, W.; Guo, Q.; Jakubowski, M.K.; Kelly, M. A new method for segmenting individual trees from the lidar point cloud. Photogramm. Eng. Remote Sensing 2012, 78, 75–84. [Google Scholar] [CrossRef] [Green Version]
- Raumonen, P.; Kaasalainen, M.; Åkerblom, M.; Kaasalainen, S.; Kaartinen, H.; Vastaranta, M.; Holopainen, M.; Disney, M.; Lewis, P. Fast Automatic Precision Tree Models from Terrestrial Laser Scanner Data. Remote Sens. 2013, 5, 491–520. [Google Scholar] [CrossRef] [Green Version]
- Wilkes, P.; Lau, A.; Disney, M.; Calders, K.; Burt, A.; Gonzalez de Tanago, J.; Bartholomeus, H.; Brede, B.; Herold, M. Data acquisition considerations for Terrestrial Laser Scanning of forest plots. Remote Sens. Environ. 2017, 196, 140–153. [Google Scholar] [CrossRef]
- Disney, M.I.; Kalogirou, V.; Lewis, P.; Prieto-Blanco, A.; Hancock, S.; Pfeifer, M. Simulating the impact of discrete-return lidar system and survey characteristics over young conifer and broadleaf forests. Remote Sens. Environ. 2010, 114, 1546–1560. [Google Scholar] [CrossRef]
- Henning, J.G.; Radtke, P.J. Detailed stem measurements of standing trees from ground-based scanning lidar. For. Sci. 2006, 52, 67–80. [Google Scholar] [CrossRef]
- Disney, M.; Burt, A.; Calders, K.; Schaaf, C.; Stovall, A. Innovations in Ground and Airborne Technologies as Reference and for Training and Validation: Terrestrial Laser Scanning (TLS). Surv. Geophys. 2019, 40, 937–958. [Google Scholar] [CrossRef] [Green Version]
- Zhong, L.; Cheng, L.; Xu, H.; Wu, Y.; Chen, Y.; Li, M. Segmentation of Individual Trees from TLS and MLS Data. IEEE J. Sel. Top. Appl. Earth Obs. Remote Sens. 2017, 10, 774–787. [Google Scholar] [CrossRef]
- Forest Design VirtSilv. Available online: https://virtsilv.com/2020 (accessed on 14 November 2020).
- Fick, S.E.; Hijmans, R.J. WorldClim 2: New 1-km spatial resolution climate surfaces for global land areas. Int. J. Climatol. 2017, 37, 4302–4315. [Google Scholar] [CrossRef]
- Martin Bland, J.; Altman, D. Statistical methods for assessing agreement between two methods of clinical measurement. Lancet 1986, 327, 307–310. [Google Scholar] [CrossRef]
- Carkeet, A. Exact parametric confidence intervals for bland-altman limits of agreement. Optom. Vis. Sci. 2015, 92, e71–e80. [Google Scholar] [CrossRef] [PubMed] [Green Version]
- Taffé, P.; Peng, M.; Stagg, V.; Williamson, T. MethodCompare: An R package to assess bias and precision in method comparison studies. Stat. Methods Med. Res. 2019, 28, 2557–2565. [Google Scholar] [CrossRef]
- European Commission. The European Green Deal; COM(2019) 640 final; European Commission: Brussels, Belgium, 2019. [Google Scholar]
- European Union States. Declaration on Digital Day 2021. Available online: https://ec.europa.eu/newsroom/dae/items/705312 (accessed on 20 May 2021).
- Gollob, C.; Ritter, T.; Nothdurft, A. Forest Inventory with Long Range and High-Speed Personal Laser Scanning (PLS) and Simultaneous Localization and Mapping (SLAM) Technology. Remote Sens. 2020, 12, 1509. [Google Scholar] [CrossRef]
- Trochta, J.; Kruček, M.; Vrška, T.; Kraâl, K. 3D Forest: An application for descriptions of three-dimensional forest structures using terrestrial LiDAR. PLoS ONE 2017, 12, e0176871. [Google Scholar] [CrossRef] [Green Version]
- Koreň, M.; Hunčaga, M.; Chudá, J.; Mokroš, M.; Surový, P. The Influence of Cross-Section Thickness on Diameter at Breast Height Estimation from Point Cloud. ISPRS Int. J. Geo-Inf. 2020, 9, 495. [Google Scholar] [CrossRef]
- Mokroš, M.; Mikita, T.; Singh, A.; Tomaštík, J.; Chudá, J.; Wężyk, P.; Kuželka, K.; Surový, P.; Klimánek, M.; Zięba-Kulawik, K.; et al. Novel low-cost mobile mapping systems for forest inventories as terrestrial laser scanning alternatives. Int. J. Appl. Earth Obs. Geoinf. 2021, 104, 102512. [Google Scholar] [CrossRef]
- Gollob, C.; Ritter, T.; Nothdurft, A. Comparison of 3D Point Clouds Obtained by Terrestrial Laser Scanning and Personal Laser Scanning on Forest Inventory Sample Plots. Data 2020, 5, 103. [Google Scholar] [CrossRef]
Publisher’s Note: MDPI stays neutral with regard to jurisdictional claims in published maps and institutional affiliations. |
© 2021 by the author. Licensee MDPI, Basel, Switzerland. This article is an open access article distributed under the terms and conditions of the Creative Commons Attribution (CC BY) license (https://creativecommons.org/licenses/by/4.0/).