Abstract
Ganoderma P. Karst. is a genus of wood decaying fungi with complicated taxonomy due to morphological variability of their basidiomata. Although a wide range of host plants is assumed for the genus as a whole, there is a need for revision of the host specificity of individual species. Based on revision of mycological collections across the Czech Republic we analyzed the ecological trends of six European species, including host preferences and propensity to parasitism. Individual Ganoderma species were sampled differentially along vegetation categories, with G. adspersum (Schulzer) Donk prevailing in habitats with high anthropogenic factors and G. applanatum (Pers.) Pat. in natural vegetation with limited anthropogenic influence, differing also in average altitude of sampling. The number of host species of individual Ganoderma spp. did not reach an asymptote, suggesting an open host plasticity and great potential for finding new host associations in future. Very distinct host compositions were found for individual Ganoderma species, at the genus level, with G. applanatum being the least host specific. Individual Ganoderma species differ also in their tendency to parasitic life strategy. The proportion of parasites increases with decreasing vegetation category and it is therefore higher in urban than natural environment, especially on hardwood trees.
1. Introduction
The genus Ganoderma P. Karst. includes wood-rotting basidiomycetes with laccate and non-laccate pilei. Historically, laccate taxa were referred to as the G. lucidum (Curtis) P. Karst. complex (Ganoderma lucidum s.l.), and non-laccate species as the G. applanatum (Pers.) Pat. complex. With expansion of molecular methods, the phylogenetic analyses became beneficial for assessing taxonomic complexity of this genus [1,2,3,4,5,6,7,8]. Authors use multilocus phylogeny which generated robust species identification and differentiation in the last decade. Additionally, basidiospore shape and size, geographic location, and host preference were found to aid in species identification [9].
From six species present in the Czech Republic (G. applanatum s.str., G. adspersum, G. lucidum s.str., G. resinaceum, G. carnosum, G. pfeifferi), the above-mentioned applies especially to two of them, G. adspersum (Schulzer) Donk and G. applanatum (Pers.) Pat. which are clearly distinguishable based on spore size only [10,11,12]. Ganoderma adspersum might be also mistaken for G. pfeifferi Bres. but the latter species has resinous layer on pileus surface. Ganoderma resinaceum Boud. possesses also a resinous layer on pileus surface but in contrast to G. pfeifferi the color of the context is significantly lighter [13]. Ganoderma lucidum (Curtis) P. Karst. is a part of Gamoderma lucidum complex. It has a laccate pileus and vivid colors, often with stipes. Ganoderma carnosum Pat. can be identified based on the host substrate which should be a coniferous tree in majority of cases [14,15]. However, as aforementioned, the knowledge of host specificity of Ganoderma species may be distorted by the difficult taxonomy of the group and common misidentifications [16]. Additionally, genus Ganoderma is famous for its many uses in traditional Chinese medicine and for its beneficial properties for human health [17,18], especially G. lucidum but due to the phenotypic plasticity, molecular methods play a vital role in characterizing the species within the G. lucidum-complex [19]. DNA sequences also proved to be an accurate and rapid way for identification of the causal agents of wood rot in trees [20] including Ganoderma spp. which can cause danger in urban environments by falling and disrupting city infrastructure.
Kotlaba [21] and Gáper [22] recorded occurrence of some Ganoderma species in habitats highly influenced by humans and Gáperová [23] described (non)synanthropic characters in Ganoderma spp. with exception of G. carnosum due to lack of data for significant conclusions. The last extensive revisions of mycological collections with focus on Ganoderma species in the Czech Republic were conducted mainly by prestigious Czech mycologist František Kotlaba from 1971 to 1980. Therefore, the aim of the present study was to extend revisions to a new material in collections and to: (i) evaluate ecological trends of the species particularly focusing on their occurrence in different vegetation category (to detect synanthropization processes), (ii) determine the host specificity of studied species and their propensity to parasitism.
2. Materials and Methods
We conducted a revision of mycological collections in the Czech Republic during 2014 and 2015, in museums in Prague (PRM), Brno (BRNM), Ostrava (OSM), České Budějovice (CB), Frýdek-Místek (FMM), Hradec Králové (HR), Olomouc (OLM), Pardubice (MP), Valašské Meziříčí (VM), Znojmo (MZ), Jihlava (MJ), Bruntál (OVMB), Rokycany (MBH) and Zlín (GM). Firstly, based on modern literature [10,11,13,24,25,26,27,28], we created an identification key for Ganoderma spp. which we used for revision of less ambiguous samples where spore measurement was not needed. For identification of more unclear specimen we measured spore size with maximum magnification (with immerse objective 100×) using light microscopes available at the site or MOTIC light microscope (Motic Company, Wetzlar, Germany).
Specimen’s information collected from museums included species name, date of collection, location, substrate, altitude, coordinates, map quadrat (used in Europe and the most common in the Czech Republic is the KFME method—Kartierung der Flora Mitteleuropas—the map field measures 10 min longitude and 6 min latitude). This field is identified by a four-digit numeric code, e.g., 6365. As a result, “63” in this case means a row, numbered from north to south, and “65” means a column, from west to east. This basic map field can be further divided into quarters, marked with letters a, b, c, d [29], assumed life strategy (parasitic or saprotrophic), collector and determiner names. Missing altitude data were completed according to location description on specimen tag with help of Google Earth using radius of proximal area and counting average altitude. Similarly, for map quadrat we used a tool for conversion of coordinates freely accessible on BioLib [30]. Herbarium-based study shows that habitats of Ganoderma species in the Czech Republic range from heavily managed town and city centers, to the natural reserves in strictly protected areas. For evaluation of preference of the type of vegetation we created eight categories as follows (modified after Jeffrey [31]): 1. Central areas (areas with high anthropogenic influence): town or city center. Paved spaces with woody plants, such as tree-lined alleys, promenades and squares are often found in these centers; 2. Suburban areas (areas with medium to high anthropogenic influence): areas surrounding towns or city centers, including residential sites, suburban public parks and gardens, mixed used sites, as well as industrial and commercial sites. Suburban areas are heavily managed for particular amenity-based uses. High application rates of agrochemicals, especially herbicides and fertilizers is common; 3. Peri-urban areas (areas with lower anthropogenic influence): urban periphery areas characterized by combination of fragmented urban and rural features rich in ruderal sites and agricultural management, but sometimes abandoned; 4. Rural areas (areas with medium to high anthropogenic influence): villages and agricultural areas that are located outside towns and cities. These areas have a low population density and small settlements; 5. Quasi-natural habitats associated with engineered features (areas with low anthropogenic influence): mainly linear features along roads or railways with maintenance of adjacent greenery for transport safety; 6. Nearly natural habitats (areas with limited anthropogenic influence): secluded housing surrounded by forests without engineered features. People management achieve balance between forest protection and their amenity; 7. Green areas (areas with limited anthropogenic influence): forests, mainly wood industry forests, according to FAO (Food and Agriculture Organization of the United Nations) defined as a land area spanning more than 0.5 hectares with trees higher than 5 m and a canopy cover of more than 10%, or trees able to reach these thresholds in situ. The management must be carried out according to forest management plans; 8. Natural reserves and protected areas (areas with minimal or no anthropogenic influence): national parks and landscape areas according to Act no. 114/1992 Coll. on Nature and Landscape Protection defined as large areas with a harmoniously shaped landscape, characteristic relief, a significant proportion of natural forest ecosystems and permanent grasslands. The management must be carried out according to the zones of graded protection, so as to preserve and improve the natural conditions preserve and create the optimum ecological functions of these territories. Recreational use shall be admissible, provided that it does not damage the natural values of the protected landscape area. The protection regime in these areas is therefore looser than in the case of national parks. All studied specimens were of herbarium origin and division into vegetation categories was according to location of each specimen.
2.1. Temporal and Spatial Sampling Trends of Ganoderma Species
We analyzed data in R 3.4.3 using packages “MASS” [32], “MuMIn” [33], “car” [34], “sciplot” [35], “sm” [36], “vegan” [37] and “rareNMtests” [38], in Canoco 5.01 [39]. To analyze which explanatory variables are associated with differences in individual Ganoderma species presence patterns, we assumed each sample as the presence of a given species and the absence of other species (in a given space and time). Then, we used binomial generalized linear mixed models with multivariate normal random effects, using Penalized Quasi-Likelihood, with presence/absence data as dependent variable and Ganoderma species, year, altitude, vegetation category, type of environment, host type, and type of trophism as explanatory variables. The random effects were ID of sample and rank of sampling quadrates in longitudinal and latitudinal direction. For the full model, we tested the possible collinearity between variables calculating variance–inflation factor function (VIF), with the aim to sequentially remove the variables with highest VIF, till all VIFs were less than five [40]. The full model was simplified to a final one by backward selection. To compare temporal trends in sampling of individual species in more detail, we used the comparison of individual species univariate density estimates during years [41]. For differences among Ganoderma species in sampling years, latitude (N), longitude (E) and altitude, we used only presence data, applying Generalized linear models with Poisson, Gamma and negative binomial distributions, respectively.
2.2. Host Specificity Differences among Ganoderma Species
To depict trends in revealing new host tree species during years, we used species accumulation curves with method “collector” adding years in the order they happen, with pooling the few samples before 1920 together. To find the best taxonomical simplification of Ganoderma species specificity, we created set of binomial generalized linear models with the previously introduced dependent variable, (i.e., each sample as the presence of a given species and the absence of other species) with different taxonomic levels of host trees (species, genera, families, orders or phyla) as explanatory variables, and we compared those models by model selection function using Akaike information criterion (AICc). To test the differences in the host-range among Ganoderma species (on the host genus level), we used biogeographical null model tests for comparing rarefaction curves [38] tested on 1000 permutations, and we depicted those differences by genera accumulation curves of individual samples with the “Coleman” method [42]. To test, if there are differences among the Ganoderma species in host specificity at genus level, we used Canonical correspondence analysis (CCA) with species of Ganoderma as explanatory variable and testing the analysis with Monte-Carlo permutational test using 1000 permutations. The host genera with less than five observations were pooled to “rare deciduous trees” and “rare coniferous trees” categories.
2.3. Propensity of Ganoderma Species to Parasitism
For identifying trophism patterns for Ganoderma species and other trends, we used only presence data. For propensity to parasitism we used binomial generalized linear model with Ganoderma species, year, altitude, vegetation category, type of environment and host type as possible explanatory variables and we used also their interactions. On full model we tested the possible collinearity between variables calculating variance-inflation factor function (VIF), with the aim to sequentially remove the variables with highest VIF, till all VIFs were less than five [40]. The model was simplified to the final version by backward selection. Similar approach was applied in Figure S3 for revealing trends in distribution of samples from different vegetation categories using GLMs with binomial distribution.
3. Results
3.1. Temporal and Spatial Sampling Trends of Ganoderma Species
Overall, we collected herbarium data on 784 specimens from six species. The six Ganoderma species were sampled in differential proportions (χ2 = 357.96, p < 0.001) with G. applanatum being the most, and G. pfeifferi the least sampled species. Although the samples were quite uniformly distributed across the vegetation category gradient (χ2 = 2.13, p = 0.145), separate species were sampled distinctly along this gradient (χ2 = 85.08, p < 0.001). Whereas G. adspersum strongly declined with increasing vegetation category, G. applanatum increased (Figure 1).
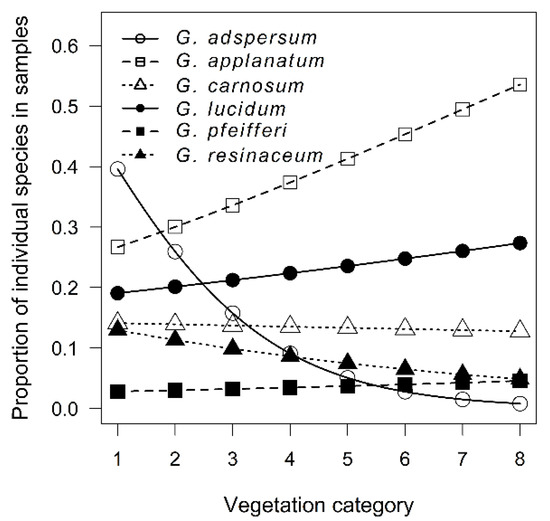
Figure 1.
Proportion of individual Ganoderma species along the vegetation category gradient. The positions of points are predicted from the binomial generalized linear mixed model.
The Ganoderma species also differed in the period, when they were mostly sampled (F = 9.54, p < 0.001), with median of G. applanatum being 1970, whereas G. resinaceum median being 1990. The sampling pattern of individual Ganoderma species during the years was distinct (p < 0.001) with G. adspersum, G. applanatum, and G. lucidum sampling culminating between 1960–1970, G. carnosum sampling culminating around 1980, G. resinaceum sampling culminating shortly before 2000, and G. pfeifferi with most sampling events in 1960–1970 and in the new century (Supplementary Figure S1).
The species differed also in average latitude (F = 16.48, p < 0.001) and longitude (df = 769, F = 3.33, p = 0.006) of sampling with G. lucidum samples being the most south shifted, G. adspersum most north and west shifted and G. applanatum most east shifted species. There were significant differences among average altitude of samples of individual Ganoderma species (χ2 = 102.97, p < 0.001), partially caused by the fact that Ganoderma samples from coniferous trees had higher average altitude than samples from broadleaf trees (χ2 = 17.84, p < 0.001), but on coniferous trees, only three species of Ganoderma were present. There were also differences in this pattern among individual Ganoderma species (χ2 = 14.64, p < 0.001), e.g., whereas G. lucidum samples on broadleaf trees had the second lowest average altitude, on coniferous trees they had the highest average altitude (Figure 2).
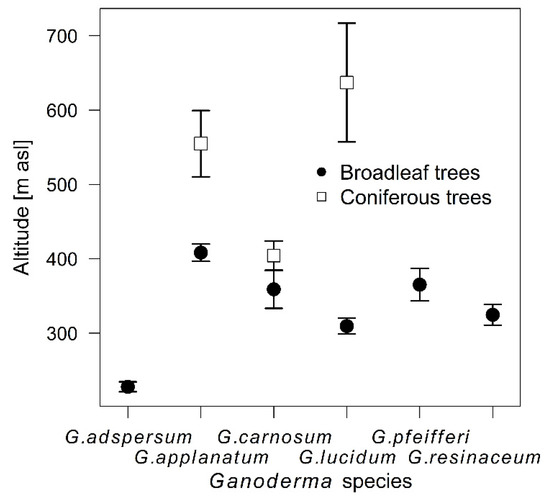
Figure 2.
Average altitude of samples of individual Ganoderma species on broadleaf and coniferous trees (mean ± SE).
3.2. Host Specificity Differences among Ganoderma Species
Regarding host specificity, during years the increase in number of tree species associated with individual Ganoderma species did not reach an asymptote, even for the G. pfeifferi and G. resinaceum with low host-range (Figure 3). The best simplification of pattern of Ganoderma species host specificity can be based on host genus level (Table 1), with significant differences between host tree genera (χ2 = 828.92, p < 0.001) (Supplementary Figure S2). CCA analysis confirmed great differences in host genus specificity among Ganoderma species (F = 7.8, p = 0.001) (Figure 4). Ganoderma lucidum and G. resinaceum were highy associated with Quercus followed by G. adspersum which also showed preference of Quercus. Ganoderma pfeifferi was found mostly on Fagus, G. carnosum on Picea and Abies (i.e., coniferous trees), whereas G. applanatum was least host specific, frequently associated with Quercus, Fagus, Tilia, Acer, Populus, and Picea, and less frequently associated with the other 24 tree genera. Biogeographical null model tests revealed that there were significant differences in level of host specificity among Ganoderma species (Zsim = 2681.25, p = 0.009), with difference among the group of less host specific G. adspersum, G. applanatum and G. carnosum and more specialized group of G. lucidum, G. pfeifferi and G. resinaceum (Figure 5). Host preferences for each Ganoderma species are shown in Table 2.
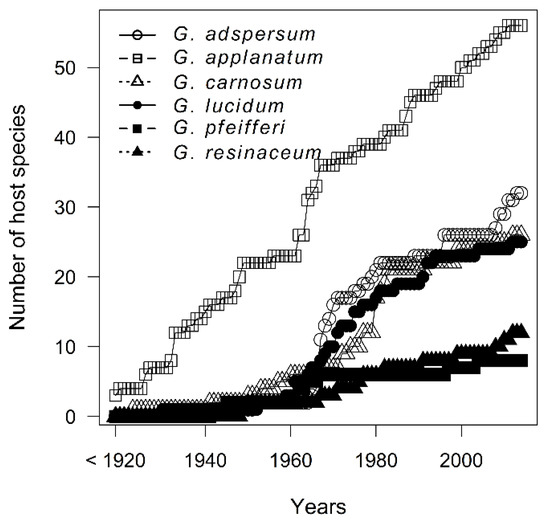
Figure 3.
Species accumulation curves of host tree species for individual Ganoderma species created with method “collector” adding the years in the order they happen to be in the data.

Table 1.
Comparison of GLM models with presence of given Ganoderma species as dependent variable and varying resolution of host identity as explanatory variable. Host level: taxonomic level of host used as explanatory variable; Df: degrees of freedom used in the model; LogLik: log-likelihood; AICc: the value of the Akaike information criterion; AICc Δ: difference in information criterion between the model and the best model with lowest AICc.
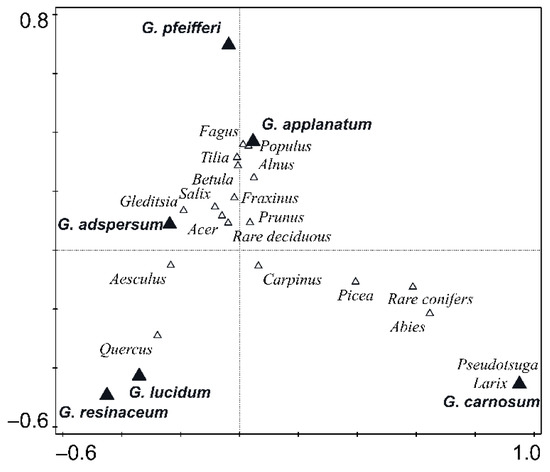
Figure 4.
CCA analysis plot showing the differences in host tree composition among Ganoderma species and affiliation of them to host genera.
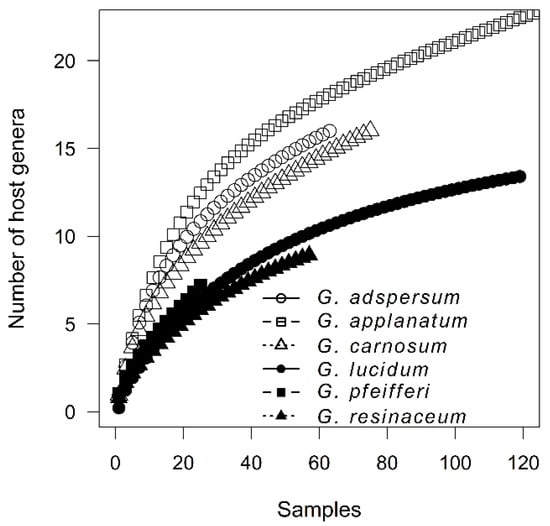
Figure 5.
Genera accumulation curves showing the level of host specificity of individual Ganoderma species. The axes shortened for clarity.

Table 2.
Number of records for individual Ganoderma species associated with different host genera (ranked by appearance).
3.3. Propensity of Ganoderma Species to Parasitism
The proportion of parasitic samples differed strongly among Ganoderma species (χ2 = 100.36, p < 0.001) (Figure 6), decreased with increasing vegetation category (χ2 = 9.88, p = 0.002) (Figure 7), was lower in natural than urban environment (χ2 = 6.90, p = 0.009), and was lower for coniferous than deciduous trees (χ2 = 7.32, p = 0.007) (Figure 8). Toward the north, Ganoderma samples were sampled in decreasing vegetation categories (χ2 = 11.70, p < 0.001) with much stronger trend for parasitic than saprotrophic strategy (χ2 = 10.13, p = 0.001) (Supplementary Figure S3). Parasitic Ganoderma samples were also shifted more to the west, than saprotrophic ones (F = 13.75, p < 0.001) (Supplementary Figure S4). The proportion of parasitic specimens of Ganoderma sampled on individual host genera is shown in Supplementary Figure S5.
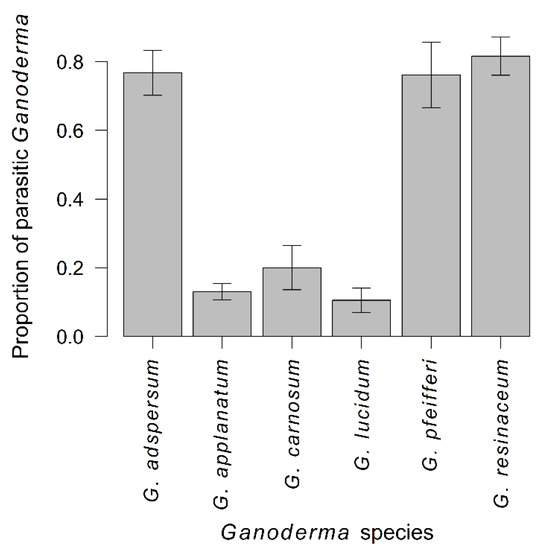
Figure 6.
Proportion of parasitic samples in individual Ganoderma species (mean ± SE).
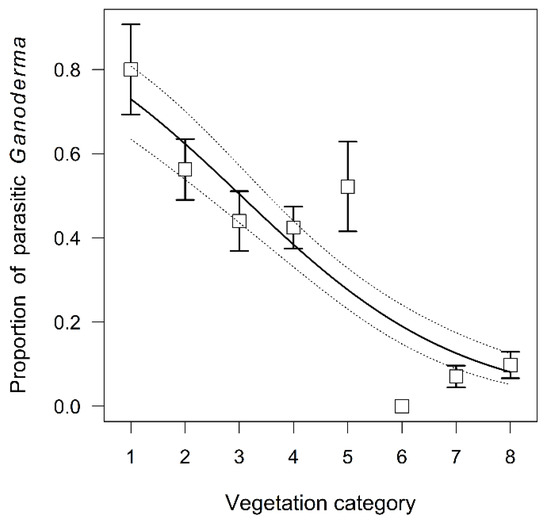
Figure 7.
Proportion of parasitic Ganoderma samples along the vegetation category gradient (mean ± SE), the trend is predicted from binomial generalized linear model.
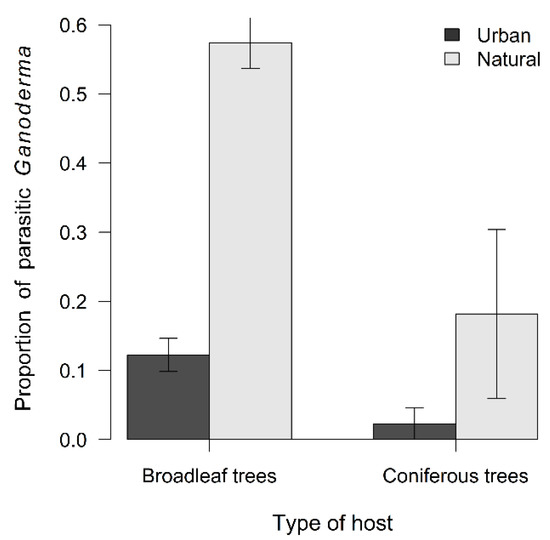
Figure 8.
Proportion of parasitic Ganoderma samples in urban or natural environment and on broadleaf or coniferous trees (mean ± SE).
4. Discussion
4.1. Temporal and Spatial Sampling Trends of Ganoderma Species
Six studied species within Ganoderma genus were represented in herbaria collections differently, which might reflect their real abundances in nature but also sampling bias, as the specimens were not collected according to stratified random sampling protocol required in rigorous ecological study [43]. Sampling for museum natural collections is probably often carried out dependably on what is needed to enrich the collection or led by pure interest of the collector who is attracted by shape, color, size or overall appearance of the specimen [44,45]. Such non-representative collecting strategies play an important role in museum’s data recording and due to this fact, the records are limited by spatial and temporal biases which can lead to a limitation of tracking real abundance [46,47]. We need to keep in mind there are four major biases in records data which were identified by Isaac et al. [48]: (1) uneven recording intensity over time, (2) uneven spatial coverage, (3) uneven sampling effort per visit and (4) uneven detectability across space and time. That proves in most situations the sampling in nature is not perfect, moreover when some species are easier to spot than others [49] which may be strongly influenced by vegetation structure or successional change [50] or species location occurrence e.g., near roadsides [51]. Another bias during our study was presented by using presence-only data. For aforementioned reasons, in our research we focused on analyses of species proportion that are always in interaction to other environmental variables or on analyses of trends in those environmental variables and its interpretation to overcome this drawback. Despite the limitations, the interactions should not be dependable on collector sampling directly and thus we can consider them as authentic.
Synanthropization of some Ganoderma species is documented [11,21,23,52,53,54,55] but with no respect to different types of vegetation. All analyzed species are common with exception of G. pfeifferi which was found in the least number of samples, corresponding to the consideration of being rare in the Czech Republic [56,57]. None of the findings of G. pfeifferi were from the category level one, central areas or historic city center (areas with high anthropogenic influence) but according to Sokół [58], G. pfeifferi should be synanthropic species growing on old oaks in parks. Other authors recorded its growth in natural old beech forests in Europe [28,59]. The proportion of G. adspersum strongly increases toward lower-level of vegetation categories. Within the first and the second vegetation category level (with high and medium anthropogenic factors) were included 17.5% and 37.5% of all G. adspersum findings, respectively. In the categories with limited or almost no anthropogenic influence there were only 5% of all findings of this species. Ganoderma adspersum is considered to be synanthropic and a common species [21,27,54,58,60,61] but more detailed evaluation from different types of urbanized vegetation is lacking. The proportion of G. resinaceum also slightly increases toward lower vegetation categories, therefore we can consider it synanthropic. Most of the findings was from fourth vegetation category level, from rural areas. According to other authors, its occurrence was recorded in parks, gardens or along roadsides [21,22,23,58] but it can be also found in forests in southern Europe similarly as G. adspersum [62].
Relatively to other Ganoderma species, G. lucidum increases towards the higher vegetation categories, e.g., with decreasing human impact, in accordance with literature stating that this species occurs in Europe mainly in forests, but can be also found in parks and botanical gardens on old hardwoods [58,63]. We found that samples of G. carnosum were quite uniformly distributed across the vegetation category gradient, despite the fact that Kotlaba [21] recorded them mainly from synanthropic areas.
In our analyses each species had slightly different sampling peak throughout years. This might, except for aforementioned matters, reflect ecological trends e.g., environment quality. It is well known that environment and its global changes during the past century show human impacts which are reflected in natural collections [64,65,66,67].
4.2. Host Specificity Differences among Ganoderma Species
For the complex of studied species, we revealed a very broad host-range including at least 69 host species (belonging to 36 genera). Moreover, from species accumulation curves it can be expected, that in the next years, more host association could be observed. At species level we can observe a major change in the number of newly discovered associated tree species from the 1960s to 1980s which might have been caused by (i) a new law that entered in 1959 which led to a dynamic increase in enriching museum’s collections during those years or (ii) it might be connected to declining quality of environment when Ganoderma species had more opportunities to colonize new host trees. Host expansion tendency was previously observed for example in mistletoe [68] which may happen through introduction of new hosts to a new area or as a result of evolutionary pressures [69,70] originating from habitat and climate changes [71,72]. There are also several studies that focused on diversity of wood fungi under varying environmental factors and their influence on host plant [73,74,75]. Based on AICc of set of models, we found that the best simplification of host preference is at the genus level. According to the range of attacked tree genera we can split Ganoderma species into two groups, those with: (i) lower host plasticity including G. resinaceum, G. lucidum and G. pfeifferi and (ii) with higher host plasticity including G. applanatum, G. adspersum and G. carnosum, showed also by genera accumulation curves.
The occurrence of G. carnosum on hardwood trees should be rare [13,14]. Ryvarden and Melo [13] recorded G. carnosum on four hardwood genera only. In contrast, our analyses showed that G. carnosum preferably colonizes not only softwood trees, but frequently also hardwood trees of at least nine genera. Compared to literature [11,13,15,21,25,28,56,58,60,63,76,77] we recorded Cedrus as a new host genus for G. carnosum. G. lucidum and G. resinaceum should be specialized on Quercus spp. In former Czechoslovakia, 58% of the findings of G. resinaceum were from Quercus spp.-Q. robur, Q. palustris, Q. petraea, Q. rubra, and 71% records of G. lucidum were from Quercus spp. [21]. It corresponds to our findings that these species strongly prefer oaks. However, G. resinaceum was also found on eight other hardwood genera, and G. lucidum was found on other 11 hardwood and two softwood genera. Kotlaba and Pouzar [61] recorded G. adspersum mostly on oak trees (Quercus spp.), lime trees (Tilia spp.) and horse chestnut (Aesculus hippocastanum) but compared to other author’s findings [11,13,15,20,21,23,25,58,60,63,77,78,79] we discovered Corylus and Malus as two more new host genera. G. applanatum is the most common species and has a much wider range of host tree genera than G. adspersum [11,14,25,63], in former Czechoslovakia Kotlaba [21] documented 53 host species, occasionally including conifers such as Abies and Picea. Two new uncommon host genera were recorded during our analyses–Gleditsia and Ailanthus which were not previously mentioned [11,13,21,22,23,25,28,56,58,60,76,77,80]. G. pfeifferi was not previously recorded on Tilia sp. [13,17,21,28,56,58,60,63,76,77,81].
Ganoderma samples from softwoods had higher average altitude than samples from hardwoods. This could be obviously caused by the fact that softwood and hardwood trees vary in their abundances in relation to altitude and thus, uneven chance to sample coniferous and deciduous trees along the altitudinal gradient could be expected.
4.3. Propensity of Ganoderma Species to Parasitism
Parasitic life strategy was more common among samples towards lower vegetation category which means more common in urbanized environment and areas under anthropogenic influence. This could be caused by sampling bias. In urban areas, greater sampling effort would be expected and thus much earlier detection of Ganoderma fungi on the trees, at a time when they are still growing parasitically. In other words, in more distant non-urban areas, artificially higher proportion of saprotrophic specimens would be caused by later discovery of fungi. From an ecological point of view, there are more opportunities for parasitism in urban areas due to higher traffic and more intense human activities. We also observed higher rates of parasitism on hardwood trees which is consistent with that of Krah et al. [82] in which most white rot fungi are broadleaf trees specialists. Moreover, in urban environment conifers are less prone to be parasitized in contrast to broadleaf trees which are much more affected. This may be connected to different structure and content of lignin comparing conifers and broadleaf trees [83]. However, this was in contrast to our expectation to observe more parasitic species on conifers due to slower dying of needles and therefore identifying them as parasites while they are actually already saprotrophs. Authors should discuss the results and how they can be interpreted from the perspective of previous studies and of the working hypotheses. The findings and their implications should be discussed in the broadest context possible. Future research directions may also be highlighted.
5. Conclusions
We revealed that all studied Ganoderma species have broad host-range, which is increasing during many decades without apparent slowing. Some of the specimens show synanthropization processes in different vegetation categories with higher or lower anthropogenic factors, particularly G. adspersum, and great propensity to parasitism, which increases toward urban areas, and is more frequent on hardwood trees. As ornamental greenery is often formed by a large diversity of tree species in the cities, which are stressed by the pollution of the environment and gradually age, we can assume, based on our data, that there are great possibilities to discover newly associated host tree species for Ganoderma genus in the upcoming years. As Ganoderma species may act as serious tree pathogens, their still expanding host-range should be considered.
Supplementary Materials
The following are available online at www.mdpi.com/article/10.3390/f12111437/s1, Figure S1: Temporal trends in Ganoderma species sampling. The sampling pattern of individual Ganoderma species during the years was very distinct (p < 0.001), Figure S2: Whittaker rank-abundance plot for host tree genera of individual Ganoderma species, Figure S3: Average vegetation category along the latitudinal gradient for saprotrophic and parasitic Ganoderma samples. Ganoderma samples were sampled along latitudinal gradient in decreasing vegetation categories (df = 442, χ2 = 11.70, p < 0.001) and parasitic Ganoderma samples are from lower vegetation categories than saprotrophic ones (df = 442, χ2 = 93.29, p < 0.001). The slope of decrease of vegetation category along latitudinal gradient differs strongly between parasitic and saprotrophic Ganoderma samples (df = 442, χ2 = 10.13, p = 0.001), whereas there is a strong relationship for parasitic ones, the saprotrophic ones decrease gently, Figure S4: E coordinates for parasitic and saprotrophic trophic category (mean ± SE). Saprotrophic Ganoderma samples has in average higher east coordinates (they are shifted east), than parasitic Ganoderma samples (df = 444, F = 13.75, p < 0.001), Figure S5: Proportion of parasitic specimens of Ganoderma sampled on individual host genera. Suppl. 1: Key to Ganoderma species.
Author Contributions
Conceptualization, J.G., K.N., P.P., T.B. and S.G.; methodology, P.P. and K.N.; formal analysis, P.P.; investigation, K.N. and T.B.; resources, J.G. and S.G.; data curation, P.P. and K.N.; writing—original draft preparation, K.N.; writing—review and editing, P.P. and T.B.; visualization, K.N.; supervision, J.G.; project administration, K.N. and J.G.; funding acquisition, S.G. and K.N. All authors have read and agreed to the published version of the manuscript.
Funding
This research was funded by grants from the Grant Agencies of the Ministry of Education, Science, Research and Sport of the Slovak Republic (VEGA No. 1/0564/21 and KEGA No. 006UMB-4/2020) and by University of Ostrava, SGS no. 12/PřF/2020 and SGS no. 14/PřF/2021. The APC was funded by the Grant Agency of the Ministry of Education, Science, Research and Sport of the Slovak Republic (KEGA No. 006UMB-4/2020).
Institutional Review Board Statement
Not applicable.
Informed Consent Statement
Not applicable.
Data Availability Statement
Not applicable.
Conflicts of Interest
The authors declare no conflict of interest. The funders had no role in the design of the study; in the collection, analyses, or interpretation of data; in the writing of the manuscript, or in the decision to publish the results.
References
- Moncalvo, J.-M.; Buchanan, P.K. Molecular evidence for long distance dispersal across the Southern Hemisphere in the Ganoderma applanatum-australe species complex (Basidiomycota). Mycol. Res. 2008, 112, 425–436. [Google Scholar] [CrossRef]
- Park, Y.-J.; Kwon, O.C.; Son, E.S.; Yoon, D.E.; Han, W.; Nam, J.-Y.; Yoo, Y.; Lee, C.-S. Genetic diversity analysis of Ganoderma species and development of a specific marker for identification of medicinal mushroom Ganoderma lucidum. Afr. J. Microbiol. Res. 2012, 6, 5417–5425. [Google Scholar] [CrossRef]
- Wang, X.-C.; Xi, R.-J.; Li, Y.; Wang, N.-M.; Yao, Y.-J. The Species Identity of the Widely Cultivated Ganoderma, ‘G. lucidum’ (Ling-zhi), in China. PLoS ONE 2012, 7, e40857. [Google Scholar] [CrossRef] [Green Version]
- Cao, Y.; Wu, S.-H.; Dai, Y.-C. Species clarification of the prize medicinal Ganoderma mushroom “Lingzhi”. Fungal Divers. 2012, 56, 49–62. [Google Scholar] [CrossRef]
- Zhou, L.-W.; Cao, Y.; Wu, S.-H.; Vlasák, J.; Li, D.-W.; Li, M.-J.; Dai, Y.-C. Global diversity of the Ganoderma lucidum complex (Ganodermataceae, Polyporales) inferred from morphology and multilocus phylogeny. Phytochemistry 2015, 114, 7–15. [Google Scholar] [CrossRef]
- Tchoumi, J.M.T.; Coetzee, M.P.A.; Rajchenberg, M.; Roux, J. Taxonomy and species diversity of Ganoderma species in the Garden Route National Park of South Africa inferred from morphology and multilocus phylogenies. Mycologia 2019, 111, 730–747. [Google Scholar] [CrossRef]
- Costa-Rezende, D.; Robledo, G.; Góes-Neto, A.; Reck, M.; Crespo, E.; Drechsler-Santos, E.R. Morphological reassessment and molecular phylogenetic analyses of Amauroderma s.lat. raised new perspectives in the generic classification of the Ganodermataceae family. Persoonia Mol. Phylogeny Evol. Fungi 2017, 39, 254–269. [Google Scholar] [CrossRef]
- Hapuarachchi, K.; Karunarathna, S.C.; Phengsintham, P.; Yang, H.D.; Kakumyan, P.; Hyde, K.D.; Wen, T.C. Ganodermataceae (Polyporales): Diversity in Greater Mekong Subregion countries (China, Laos, Myanmar, Thailand and Vietnam). Mycosphere 2019, 10, 221–309. [Google Scholar] [CrossRef]
- Loyd, A.L.; Barnes, C.W.; Held, B.W.; Schink, M.J.; Smith, M.E.; Smith, J.A.; Blanchette, R.A. Elucidating “lucidum”: Distinguishing the diverse laccate Ganoderma species of the United States. PLoS ONE 2018, 13, e0199738. [Google Scholar] [CrossRef]
- Kotlaba, F.; Pouzar, Z. Ganoderma adspersum (S. Schulz.) Donk lesklokorka tmavá, dvojník lesklokorky ploské G. ap-planatum (Pers. ex S. F. Gray). Pat. Czech. Mycol. 1971, 25, 88–102. [Google Scholar]
- Breintenbach, J.; Kränzlin, F. Fungi of Switzerland; Aphyllophorales, Verlag Mykologia: Lucerne, Switzerland, 1986; Volume 2. [Google Scholar]
- Niemelä, T.; Miettinen, O. The identity of Ganoderma applanatum (Basidiomycota). Taxon 2008, 57, 963–966. [Google Scholar] [CrossRef]
- Ryvarden, L.; Melo, I. Poroid Fungi of Europe; Fungiflora: Oslo, Norway, 2014; 455p. [Google Scholar]
- Kotlaba, F.; Pouzar, Z. Distribution and ecology of Ganoderma atkinsonii in Czechoslovakia. Czech. Mycol. 1981, 35, 121–133. [Google Scholar]
- Kotlaba, F. Common polypores (Polyporales s.l.) collected on uncommon hosts. Czech. Mycol. 1997, 49, 169–188. [Google Scholar] [CrossRef]
- Gottlieb, A.M.; Ferrer, E.; Wright, J.E. rDNA analyses as an aid to the taxonomy of species of Ganoderma. Mycol. Res. 2000, 104, 1033–1045. [Google Scholar] [CrossRef]
- Al-Fatimi, M.; Wurster, M.; Lindequist, U. Chemical Composition, Antimicrobial and Antioxidant Activities of the Volatile Oil of Ganoderma pfeifferi Bres. Medicines 2016, 3, 10. [Google Scholar] [CrossRef] [PubMed] [Green Version]
- Rossi, P.; Buonocore, D.; Altobelli, E.; Brandalise, F.; Cesaroni, V.; Iozzi, D.; Savino, E.; Marzatico, F. Improving Training Condition Assessment in Endurance Cyclists: Effects of Ganoderma lucidum and Ophiocordyceps sinensis Dietary Supplementation. Evidence-Based Complement. Altern. Med. 2014, 2014, 1–11. [Google Scholar] [CrossRef]
- Yang, Z.L.; Feng, B. What is the Chinese “Lingzhi”? A taxonomic mini-review. Mycology 2013, 4, 1–4. [Google Scholar] [CrossRef]
- Schmidt, O.; Gaiser, O.; Dujesiefken, D. Molecular identification of decay fungi in the wood of urban trees. Eur. J. For. Res. 2011, 131, 885–891. [Google Scholar] [CrossRef]
- Kotlaba, F. Geographical Distribution and Ecology of Polypores /Polyporales s.l./ in Czechoslovakia; Academia: Praha, Czech Republic, 1984. [Google Scholar]
- Gáper, J. Trúdniky na Území Slovenska a ich Šírenie v Ekosystémoch Bazídiospórami [Polypores of Slovakia and Their Distribution by Basidiospores]; Vedecké štúdie; Technical University of Zvolen: Zvolen, Slovak Republic, 1998. [Google Scholar]
- Gáperová, S. Synantropic species in the genus Ganoderma. Acta Fac. Ecol. 2001, 8, 93–98. [Google Scholar]
- Petersen, J.E. Ganoderma in Northern Europe. Lakporesvampene (Ganoderma) i Danmark og Europa. Svampe 1983, 7, 1–11. [Google Scholar]
- Ryvarden, L.; Gilbertson, R.L. European polypores—Abortiporus-Lindtneria Vol. 1. Synop. Fungorum 1993, 13, 1–387. [Google Scholar]
- Schwarze, F.W.; Ferner, D. Ganodermaon Trees—differentiation of species and studies of invasiveness. Arboric. J. 2003, 27, 59–77. [Google Scholar] [CrossRef]
- Kout, J. Lesklokorka tmavá (Ganoderma adspersum) z Podorlické oblasti. Acta Musei Richnoviensis Sect. Natur. 2011, 18, 25–28. [Google Scholar]
- Papp, V.; Szabó, I. Distribution and Host Preference of Poroid Basidiomycetes in Hungary I. Ganoderma. Acta Silv. Lignaria Hung. 2013, 9, 71–83. [Google Scholar] [CrossRef] [Green Version]
- Zicha, O. BioLib: Biological Library. 2021. Available online: https://www.biolib.cz/cz/glossaryterm/id229/ (accessed on 15 January 2021).
- Novák, J.; Zicha, O. BioLib Nástroj Pro Výpočet Mapovacích čtverců Metodou KFME. Available online: https://www.biolib.cz/cz/toolKFME/ (accessed on 8 December 2020).
- Jeffrey, D. Biodiversity in the City. In Proceedings of the A One-Day International Conference, Dublin, Ireland, 12 September 2002. [Google Scholar]
- Venables, W.N.; Ripley, B.D. Modern Applied Statistics with S, 4th ed.; Springer: New York, NY, USA, 2002. [Google Scholar]
- Barton, K. MuMIn: Multi-Model Inference. R Package Version 1.9.13. 2013. Available online: http://CRAN.R-project.org/package=MuMIn (accessed on 5 December 2020).
- Fox, J.; Weisberg, S. An {R} Companion to Applied Regression, 3rd ed.; Sage: Thousand Oaks, CA, USA, 2019; Available online: https://socialsciences.mcmaster.ca/jfox/Books/Companion/ (accessed on 5 December 2020).
- Morales, M. Sciplot: Scientific Graphing Functions for Factorial Designs. R Package Version 1.2-0. Available online: https://CRAN.R-project.org/package=sciplot (accessed on 5 December 2020).
- Bowman, A.W.; Azzalini, A. R Package ‘sm’: Nonparametric Smoothing Methods (Version 2.2–5.6). Available online: http://www.stats.gla.ac.uk/~adrian/sm (accessed on 5 December 2020).
- Oksanen, J.; Blanchet, F.G.; Friendly, M.; Kindt, R.; Legendre, P.; McGlinn, D.; Minchin, P.R.; O’Hara, R.B.; Simspon, G.L.; Solymos, P.; et al. Vegan: Community Ecology Package. R Package Version 2.5–4. 2019. Available online: https://CRAN.R-project.org/package=vegan (accessed on 5 December 2020).
- Cayuela, L.; Gotelli, N.J. RareNMtests: Ecological and Biogeographical Null Model Tests for Comparing Rarefaction Curves. R Package Version 1.1. 2014. Available online: https://CRAN.R-project.org/package=rareNMtests (accessed on 5 December 2020).
- Ter Braak, C.J.F.; Šmiauler, P. CANOCO Reference Manual and CanoDraw for Windows User’s Guide: Software for Canonical Community Ordination (Version 4.5); CRAN: Ithaca, NY, USA, 2012; 500p, Available online: www.canoco.com (accessed on 5 December 2020).
- Fox, J.; Weisberg, S.; Adler, D.; Bates, D. Package ‘Car’; R Foundation for Statistical Computing: Vienna, Austria, 2012. [Google Scholar]
- Bowman, A.W.; Azzalini, A. Applied Smoothing Techniques for Data Analysis: The Kernel Approach with S-Plus Illustrations; Oxford University Press: Oxford, UK, 1997. [Google Scholar]
- Coleman, B.D.; Mares, M.A.; Willig, M.R.; Hsieh, Y.-H. Randomness, Area, and Species Richness. Ecology 1982, 63, 1121–1133. [Google Scholar] [CrossRef]
- Tulloch, A.I.T.; Szabo, J.K. A behavioural ecology approach to understand volunteer surveying for citizen science datasets. Emu Austral. Ornithol. 2012, 112, 313–325. [Google Scholar] [CrossRef] [Green Version]
- Gower, G.; Fenderson, L.; Salis, A.T.; Helgen, K.; van Loenen, A.L.; Heiniger, H.; Hofman-Kamińska, E.; Kowalczyk, R.; Mitchell, K.J.; Llamas, B.; et al. Widespread male sex bias in mammal fossil and museum collections. Proc. Natl. Acad. Sci. USA 2019, 116, 19019–19024. [Google Scholar] [CrossRef] [Green Version]
- Thompson, J.E.; Birkhead, T.R. Avian egg collections: Museum collection bias driven by shape and size. J. Avian Biol. 2020, 51. [Google Scholar] [CrossRef]
- Pyke, G.H.; Ehrlich, P.R. Biological collections and ecological/environmental research: A review, some observations and a look to the future. Biol. Rev. 2010, 85, 247–266. [Google Scholar] [CrossRef]
- Isaac, N.J.B.; Pocock, M. Bias and information in biological records. Biol. J. Linn. Soc. 2015, 115, 522–531. [Google Scholar] [CrossRef] [Green Version]
- Isaac, N.J.B.; Van Strien, A.J.; August, T.; De Zeeuw, M.P.; Roy, D.B. Statistics for citizen science: Extracting signals of change from noisy ecological data. Methods Ecol. Evol. 2014, 5, 1052–1060. [Google Scholar] [CrossRef] [Green Version]
- Tingley, M.W.; Beissinger, S.R. Detecting range shifts from historical species occurrences: New perspectives on old data. Trends Ecol. Evol. 2009, 24, 625–633. [Google Scholar] [CrossRef] [PubMed]
- Isaac, N.; Cruickshanks, K.L.; Weddle, A.M.; Rowcliffe, M.; Brereton, T.M.; Dennis, R.L.H.; Shuker, D.M.; Thomas, C. Distance sampling and the challenge of monitoring butterfly populations. Methods Ecol. Evol. 2011, 2, 585–594. [Google Scholar] [CrossRef] [Green Version]
- Kadmon, R.; Farber, O.; Danin, A. Effect of Roadside Bias on the accuracy of predictive maps produced by bioclimatic models. Ecol. Appl. 2004, 14, 401–413. [Google Scholar] [CrossRef]
- Schwarze, F.W.M.R.; Engels, J.; Maitheck, C. Holzzersetzende Pilze in Bäumen; Rombach Verlag: Freiburg, Germany, 1994; 245p. [Google Scholar]
- Jahn, H. Pilze an Bäumen; Patzer Verlag: Berlin-Hannover, Germany, 2005; 275p. [Google Scholar]
- Tello, M.L.; Tomalak, M.; Siwecki, R.; Gáper, J. Biotic urban growing conditions threats, pests and diseases. In Urban Forests and Trees; Konijnendijk, C.C., Nilsson, K., Randrup, T., Schipperijn, J., Eds.; Springer: Heidelberg, Germany, 2005; 520p. [Google Scholar]
- Kout, J.; Vlasák, J. Rare polypores of the Czech Republic, chiefly from South Bohemia. Czech. Mycol. 2009, 108, 22–33. [Google Scholar]
- Černý, A. Parazitické Dřevokazné Houby. (Parasitic Wood-Decaying Fungi); Státní zemědělské nakladatelství: Praha, Czech Republic, 1989. [Google Scholar]
- Kout, J.; Vlasák, J. New or rare polyporoid fungi from the Pilsen Region part 2. Erica 2013, 20, 55–66. [Google Scholar]
- Sokół, S. Ganodermataceae Polski: Taksonomia, Ekologia i Rozmieszczenie; Wydawnictwo Uniwersytetu Śląskiego: Katowice, Poland, 2000; 134p. [Google Scholar]
- Christensen, M.; Heilmann-Clausen, J.; Walleyn, R.; Adamčík, S. Wood-inhabiting fungi as indicators of conservation value in European beech forests. In Monitoring and Indicators of Forest Biodiversity in Europe from Ideas to Operationality; Marchetti, M., Ed.; European Forestry Institute: Saarijärvi, Finland, 2004; pp. 229–237. [Google Scholar]
- Tortić, M. Distribution of Polypores in Yugoslavia, II. Ganoderma. Acta Bot. Croat. 1985, 44, 59–71. [Google Scholar]
- Kotlaba, F.; Pouzar, Z. Ecology of the polypore Ganoderma adspersum in Bohemia. Czech. Mycol. 2009, 109, 11–15. [Google Scholar]
- Kotlaba, F.; Pouzar, Z. Ecology of Ganoderma resinaceum and its expansion in Bohemia. Czech. Mycol. 2009, 109, 14–19. [Google Scholar]
- Bernicchia, A. Polyporaceae s.l. Fungi Europaei; Massimo Candusso: Alassio, Italy, 2005; 808p. [Google Scholar]
- Suarez, A.V.; Tsutsui, N.D. The value of museum collections for research and society. Bioscience 2004, 54, 66–74. [Google Scholar] [CrossRef]
- Lavoie, C. Biological collections in an ever changing world: Herbaria as tools for biogeographical and environmental studies. Perspect. Plant. Ecol. Evol. Syst. 2013, 15, 68–76. [Google Scholar] [CrossRef]
- Heberling, J.M.; Isaac, B.L. Herbarium specimens as exaptations: New uses for old collections. Am. J. Bot. 2017, 104, 963–965. [Google Scholar] [CrossRef] [Green Version]
- Meineke, E.K.; Davis, C.C.; Davies, T.J. The unrealized potential of herbaria for global change biology. Ecol. Monogr. 2018, 88, 505–525. [Google Scholar] [CrossRef]
- Downey, P.O. A regional examination of the mistletoe host species inventory. Cunninghamia 2004, 8, 354–361. [Google Scholar]
- Norton, D.A.; Carpenter, M. Mistletoes as parasites: Host specificity and speciation. Trends Ecol. Evol. 1998, 13, 101–105. [Google Scholar] [CrossRef]
- Norton, D.A.; De Lange, P.J. Host specificity in parasitic mistletoes (Loranthaceae) in New Zealand. Funct. Ecol. 1999, 13, 552–559. [Google Scholar] [CrossRef]
- Jeffree, C.; Jeffree, E. Redistribution of the Potential Geographical Ranges of Mistletoe and Colorado Beetle in Europe in Response to the Temperature Component of Climate Change. Funct. Ecol. 1996, 10, 562–577. [Google Scholar] [CrossRef]
- Norton, D.A.; Smith, M.S. Why might roadside mulgas be better mistletoe hosts? Austral. Ecol. 1999, 24, 193–198. [Google Scholar] [CrossRef]
- Heilmann-Clausen, J.; Maruyama, P.K.; Bruun, H.H.; Dimitrov, D. Citizen science data reveal ecological, historical and evolutionary factors shaping interactions between woody hosts and wood-inhabiting fungi. New Phytol. 2016, 212, 1072–1082. [Google Scholar] [CrossRef]
- Seibold, S.; Bässler, C.; Brandl, R.; Gossner, M.M.; Thorn, S.; Ulyshen, M.D.; Müller, J. Experimental studies of dead-wood biodiversity A review identifying global gaps in knowledge. Biol. Conserv. 2015, 191, 139–149. [Google Scholar] [CrossRef]
- Seibold, S.; Bässler, C.; Brandl, R.; Büche, B.; Szallies, A.; Thorn, S.; Ulyshen, M.D.; Müller, J. Microclimate and habitat heterogeneity as the major drivers of beetle diversity in dead wood. J. Appl. Ecol. 2016, 53, 934–943. [Google Scholar] [CrossRef] [Green Version]
- Karadelev, M.; Rusevska, K.; Kajevska, I. Distribution and ecology of genus Ganoderma (Ganodermataceae) in the Republic of Macedonia. In Proceedings of the International Conference on Biological and Environmental Sciences, Hurghada, Egypt, 13–16 March 2008; Kule, D., Malollari, I., Haxhimihali, D., Çullaj, A., Miho, A., Babani, F., Dhora, D., Shumka, S., Mustafa, B., Abeshi, P., et al., Eds.; FNS Tirana University: Tirana, Albania, 2008; pp. 320–326. [Google Scholar]
- Vlasák, J. Polypores: Collection of Dr. Josef Vlasák, Hluboká nad Vltavou, Czech Republic, Edition 18. II. 2015. Available online: http://mykoweb.prf.jcu.cz/polypores/ (accessed on 20 May 2019).
- Kuthan, J.; Kotlaba, F. Makromyzeten der Bulgarischen Schwarzmeerküste und Einiger Orte im Landesinnern Bulgariens; Národní Muzeum: Praha, Czech Republic, 1988. [Google Scholar]
- De Simone, D.; Annesi, T. Occurrence of Ganoderma adspersum on Pinus pinea. Phytopathol. Mediterr. 2012, 51, 374–382. [Google Scholar]
- Niemelä, T.; Kotiranta, H. Polypore survey of Finland 4. Phaeolus, Fistulina, Ganoderma and Ischnoderma. Karstenia 1986, 26, 57–64. [Google Scholar] [CrossRef]
- Szczepkowski, A.; Piętka, J. New localities and new host of Ganoderma pfeifferi in Poland. Acta Mycol. 2014, 38, 59–63. [Google Scholar] [CrossRef]
- Krah, F.-S.; Bässler, C.; Heibl, C.; Soghigian, J.; Schaefer, H.; Hibbett, D.S. Evolutionary dynamics of host specialization in wood-decay fungi. BMC Evol. Biol. 2018, 18, 1–13. [Google Scholar] [CrossRef] [Green Version]
- Zhou, L.-W.; Dai, Y.-C. Recognizing ecological patterns of wood-decaying polypores on gymnosperm and angiosperm trees in northeast China. Fungal Ecol. 2011, 5, 230–235. [Google Scholar] [CrossRef]
Publisher’s Note: MDPI stays neutral with regard to jurisdictional claims in published maps and institutional affiliations. |
© 2021 by the authors. Licensee MDPI, Basel, Switzerland. This article is an open access article distributed under the terms and conditions of the Creative Commons Attribution (CC BY) license (https://creativecommons.org/licenses/by/4.0/).