Abstract
Year-round cultivation under light emitting diodes (LEDs) has gained interest in boreal forest regions like Fenno-Scandinavia. This concept offers forest nurseries an option to increase seedling production normally restricted by the short vegetation period and the climate conditions. In contrast to some horticultural crops which can be cultivated entirely under LEDs without sunlight, forest seedlings need to be transplanted outdoors in the nursery at a very young age before being outplanted in the field. Juvenile plants are less efficient using absorbed light and dissipating excess energy making them prone to photoinhibition at conditions that usually do not harm mature plants. The outdoor transfer can cause stress in the seedlings due to high sunlight intensity and exposure to ultraviolet (UV) radiation not typically present in the spectra of LED lamps. This study tested possible treatments for mitigating light shock stress in seedlings of Picea abies (L.) Karst. and Pinus sylvestris L. transplanted from indoor cultivation under LEDs to outdoor sunlight exposure. Three sowings were carried out in 2014 (May and June) and 2015 (May) cultivating the seedlings during five weeks under LED lights only. Afterwards, higher light intensity or UV radiation treatments were applied during one week in order to adapt the seedlings to natural outdoor conditions. After transplanting a transition phase was introduced using shading cloths for one or three weeks as outdoor treatments for light shock mitigation. Chlorophyll fluorescence (ChlF) levels and CO2 assimilation rates were measured before transplanting and followed outdoors during 5 weeks. The ChlF results revealed stress symptoms in the photoreceptors during the first days after transplanting. After five weeks outdoors the ChlF levels had recovered and the light saturation points had shifted, allowing higher CO2 assimilation rates. By the end of the vegetation period the morphological attributes showed no major differences between treatments.
1. Introduction
Cultivation of forest seedlings under light emitting diodes (LEDs) followed by transplanting to outdoor conditions is a technology receiving increasingly more attention [1,2,3,4,5,6]. Advantages compared to conventional artificial lighting such as lower thermal output, prolonged lamps life span and potential reduction in energy consumption [7,8,9] have been important factors for the growing interest in the technology. Moreover, LEDs allow for unprecedented levels of light intensity control and spectrum customization that can improve the quality of the plants [10].
In horticulture this technology has been used during many years for producing for example flowers and vegetables [11,12,13]. The concept is often based on the assumption that further growth after transplanting to a larger container is also conducted under artificial light without exposing the plants to intense direct sunlight. In contrast, the production of forest seedlings on a year-round basis requires a period of outdoor growth at the nursery before delivery and outplanting at the forest site. Moreover, only a part of the seedlings cultivated under artificial lights can be directly transferred outdoors when the weather conditions are favorable. The rest has to be cold stored, usually in carboard boxes, until the transplanting window opens again [14,15,16].
In Sweden for example, the transplanting window associated with the vegetation period is rather narrow, reaching from about May to August depending on the geographical location. For a cost efficient and environmentally friendly production, the initial cultivation can be done at a high container density. The seedlings can be transplanted afterwards into a larger container system and transferred for further growth outdoors [17,18]. This method reduces the cultivation area under artificial lights and the cold storage space. After storage, transplanting in the nursery or outplanting in the field can have additional challenges especially if a long transport period is added [19]. Field storage in carboard boxes can significantly reduce the frost hardening and increase the seedling mortality [20]. Recent studies in Finland showed that the safe duration depends on the weather conditions and recommended only three days in summer and about a week in spring and early autumn [21].
In any case, either directly after indoor cultivation or following a period of cold storage, transplanting seedlings grown indoors under LED lights to outdoor conditions introduces a potential risk for light shock stress upon sunlight exposure. Studies have mainly focused on adjusting the indoors conditions, such as light quality and intensity, for successful cultivation of forest seedlings under LEDs [22,23,24]. Hence, before adopting a new technology that allows production of forest seedlings on a year-round basis in the boreal region, light shock stress upon transplanting has to be investigated and cultivation protocols reducing the stress have to be developed.
Photosynthesis proceeds at an optimal rate in a narrow irradiance range compared to the range of solar radiation under natural conditions [25,26]. At low light intensity needles use most of the absorbed light for photosynthesis [27]. When seedlings are moved outdoors and exposed to full sunlight, the higher light intensity and the ultraviolet (UV) radiation can create a stress situation reducing the potential for photosynthesis. Additional factors such as drought, nutrient limitation or extremes temperature can increase the stress [28,29,30]. Failure to the adapt to excessive light may result in a sustained reduction in the efficiency of photosynthesis and a retardation in the CO2 uptake. This process of photoinhibition is one of the most important regulatory mechanisms in photosynthesis [31].
In general, plants are able to adapt to a wide range of light environments and have developed different protection mechanisms by which they can avoid or endure excessive energy and reduce photodamage as well as recover quicker from light-induced injuries [31]. However, the regulation of photosynthetic functions is not fully developed in young plants [32,33] making juvenile seedlings less efficient in the utilization of the absorbed light and more prone to photoinhibition by light intensities that usually do not harm mature plants [34,35].
External photoprotection mechanisms can include rapid responses such as changes in the needles angle to regulate the light interception. Biochemical adaptations such as the production of wax on the surface or changes in the chlorophyll content can be slower and relatively reversible responses that can change again if the conditions are further modified [36]. Morphological attributes such as needle size, needles distribution along the shoot, stomatal density and biomass allocation require more time [37] and are practically permanent regardless of further changes in the light conditions [38,39,40].
The environment in which a seedling grows determine their adaptation [37]. So called “shade” needles (developed under low light intensities) usually present higher concentrations of chlorophyll compared to “sun” needles (developed under high light intensities) since they need to absorb and process as much light as possible [41]. When exposed to direct sunlight, excessive irradiance can scorch “shade” needles and reduce their chlorophyll content [42]. Normally, shoots that have developed under low light intensities have less needles per area and these are mainly oriented at the sides of the shoot giving it a flat “umbrella” structure that allows more light interception at the top. In contrast, it has been observed that shoots growing under high light intensities have needles distributed in a more uniform orientation around the stem [40,43]. These adaptations seem to allow the seedling to disperse high radiant fluxes to the lower needles and avoid light saturation in the top [44].
Internal photoprotection mechanisms against high levels of Photosynthetically Active Radiation (PAR) and UV radiation consist mainly on repair and regeneration of important compounds [45]. Screening pigments and compounds absorbing UV light are mainly flavonoids and other phenolic compounds accumulated in the epidermis [31,46,47]. Under UV radiation stress, reactive oxygen species (ROS) are produced. These are chemically reactive substances containing oxygen, for example superoxide and hydrogen peroxide, that can cause damage to proteins, DNA and lipids [48]. When this happens, antioxidant enzymes are activated and initiated to scavenge the harmful radicals [28,49]. It has been observed that needles of conifer seedlings growing at ambient UV radiation contained significantly more phenolics compared to seedlings grown under UV exclusion screens [50,51].
Short-term exposure to UV light could contribute to the adaptation by forming protecting compounds in advance [52] and making the seedlings more tolerant when exposed to sunlight after outdoor transplanting [53]. However, it is important to determine the correct level of UV light to apply because excessive amounts could cause growth inhibition and cellular damage whereas insufficient amounts could produce only stress without delivering any benefits [49]. Since plant protective mechanisms against UV radiation and high PAR are partly overlapping [46], early exposure to higher light intensities could also prepare forest seedlings for outdoor conditions. If applied at the correct time, the treatment could as well influence the morphology and internal structure of the needles in an early stage, making them more adapted for direct sunlight exposure [45].
Regarding light shock stress when directly transplanting seedlings cultivated indoors under LEDs to outdoor conditions, two main aspects can be highlighted according to what has been stated:
- Lack of protective mechanisms against UV radiation since this is almost absent during the indoor cultivation phase. This could imply that plants need to accumulate UV absorbing compounds in order to cope with UV exposure outdoors [50,54,55].
- Lack of protective mechanisms against high light intensity. Light intensity levels during indoor cultivation are usually much lower than intensity levels outdoors. Hence, seedlings could be exposed to higher light intensity during parts of the indoor cultivation and perhaps also need to be transferred to outdoor conditions through an adaptation phase under shade cloths [56,57,58].
This study is to our knowledge one of the few within this field of forest research and will hopefully be instrumental for continuous research for future introduction of new cost efficient and environmentally friendly year-round cultivation regimes of forest seedlings. Given the climate limitation it is of importance that this study will be followed by additional research that will open the possibility to produce forest seedlings on a year-round basis in the boreal region.
The objective of this study was to identify cultivation protocols for Scots pine (Pinus sylvestris L.) and Norway spruce (Picea abies (L.) Karst) seedlings based on different light spectra, intensity and duration to reduce the risk of poor quality due to light shock stress when transplanting from indoor cultivation under LED lights to outdoor sunlight exposure. In addition, included in the objective is to estimate the energy consumption for the different treatments during the indoor cultivation.
2. Materials and Methods
2.1. Plant Material
The seeds of Norway spruce (Picea abies (L.) Karst) had a provenance of Vitebsk, Belarus (lat. 55.2°; long. 30.2°) with a germination energy of 96.5% measured after 7 days and a germination rate after 21 days of 99.0%. The seeds of Scots pine (Pinus sylvestris L.) came from the Gotthardsberg seed orchard in Sweden (lat. 58.4°; long. 16.6°) and had the same germination energy and germination rate corresponding to 99.8%.
Three separate sowings were carried out (5th May 2014, 17th June 2014 and 25th May 2015). For each species, four mini-plug trays (QP D 576 QuickPot®, Herkuplast-Kubern; Ering, Germany) with high container density were directly sown every time (tray size: 310 × 530 mm; density: 3500 seedlings per m2; 576 cells per tray; volume per cell: 3.5 cm3). In order to facilitate transplanting, the mini-plugs were filled with a stabilized peat containing a binding agent (Preforma PP01, Jiffy International AS; Kristiansand, Norway).
2.2. Indoor Cultivation
The cultivation was done in an indoor growth room facility with a controlled environment. The seedlings were maintained in this room for a total of six weeks from the time of sowing until the time of outdoor transplanting. This time corresponded to:
- One week for germination,
- Four weeks of vegetative growth,
- One week for indoor treatments.
During the first week, the ambient temperature was set to 20 ± 2 °C with an air relative humidity (RH) of 80 ± 10% in order to promote germination. The RH was reduced to 60 ± 10% for the following five weeks corresponding to the vegetative growth phase. The irrigation was done by flooding the substrate in the trays until saturation twice a week. The trays were rotated one position clockwise at the time of irrigation to maintain similar growing conditions.
The indoor cultivation was done solely under artificial lights using LED grow lamps (B100-AP67, Valoya OY; Helsinki, Finland) with a continuous spectra within the PAR region (400–700 nm) [25]. Throughout the first five weeks, the photosynthetic photon flux density (PPFD) at substrate level was adjusted to 100 ± 10 μmol·m−2·s−1 with a 16 h photoperiod. This roughly corresponds to a daily integrated PPFD of 5.8 mol·m−2·d−1 also known as daily light integral (DLI) [59]. The spectra and intensity of the lamps was measured at the beginning and at the end of each trial using a JAZ spectroradiometer (Ocean Optics; Largo FL, USA) to assure an even distribution over the entire growing area.
2.2.1. Indoor Treatments
During the 6th week of indoor growth without sunlight, trays of each species were randomly assigned to different treatment and placed in a separate area within the same growth room facility which was maintained at the same environmental conditions. The trays assigned to the control group remained under the same regime of 16 h photoperiod at a light intensity of 100 ± 10 μmol·m−2·s−1 (see Figure 1, “LED-control”).
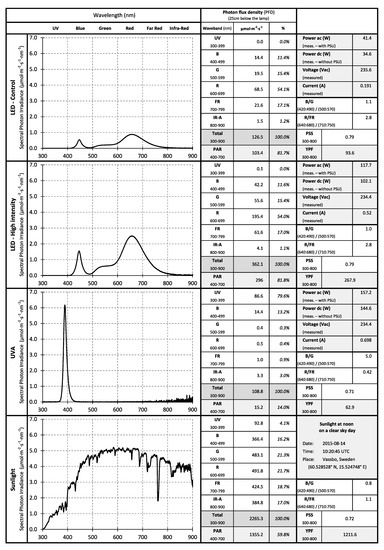
Figure 1.
Spectral characteristics of the light sources used, that is LED lamps at base level for indoor control cultivation (100 μmol·m−2·s−1), LED lamps for high intensity treatment (300 μmol· m−2·s−1) and LED lamp for ultraviolet A (UVA) treatment. The figure shows the Photon Flux Density (PFD), waveband distribution, Photosynthetically Active Radiation (PAR) and electrical characteristics when measured 25 cm directly below the lamps.
Based on recommendations for medium-light crops [60,61] and previous trials [24], the high light intensity treatment was adjusted to 300 ± 10 μmol·m−2·s−1 with a 16 h photoperiod (see Figure 1, “LED—High intensity”) producing a DLI of about 17 mol·m−2·d−1.
Although studies regarding the effects of UV light on conifer species have been made [50,52,62], few data were found on recommended UV exposure for indoor cultivation of forest seedlings. For this reason, two treatment durations of UV light exposure were chosen equivalent to 30 or 60 min. Ultraviolet A (UVA) radiation, defined as a part of the UV radiation within 315–400 nm [63], was applied simultaneously with the photosynthetic light. The UV instantaneous photon flux density (UV-PFD) was of 87 μmol·m−2·s−1 (see Figure 1, “UVA”) corresponding to a daily integrated UV photon flux (UV-DI) of 0.16 mol·m−2·d−1 for the 30 min treatment (UVA 30 min) and 0.31 mol·m−2·d−1 for the 60 min treatment (UVA 60 min).
After evaluating the outdoor conditions during the two sowings of 2014, it was observed that the measured natural UV light intensity had a median of 96.6 μmol·m−2·s−1 and corresponded well with the artificial UVA light intensity provided by the lamps. However, the median amount of natural UVA light integrated throughout the day was equivalent to 1.9 mol·m−2·d−1 which is more than 5 times higher than the indoor treatment. Therefore, during the sowing of 2015, only one UVA treatment was applied indoors and the duration of the exposure was increased to 240 min (UVA 240 min) delivering a UV-DI of 1.25 mol·m−2·d−1 making the indoor exposure level closer to the outdoor levels.
2.2.2. Light Sources
The LED grow lamps used for regular cultivation and for the “high intensity” treatment contained 11% blue (400–499 nm), 15% green (500–599 nm), 54% red (600–699 nm) and 17% far-red (700–799 nm) spectral photon irradiance (Figure 1). The blue/green ratio (B/G) of 1.1 was calculated using a band of ±35 nm around the peak wavelengths for blue light (centered at 455 nm) and green light (centered at 535 nm) [64]. The red/far-red ratio (R/FR) of 2.8 was calculated considering a band of ±20 nm around the peak wavelengths for red light (centered at 660 nm) and far-red light (centered at 730 nm) in accordance to [65].
The UV-LED luminaries used were developed by the same manufacturer (B100-UV, Valoya OY; Helsinki, Finland) with a peak irradiance at 389 nm. The spectrum contained 80% UV light (300–399 nm) and 14% blue light (400–499 nm). The rest was near infrared light (IR-A), mainly registered as heat.
Figure 1 contains a detailed description of the spectral characteristics of the light sources used in the trials including values for the Yield Photon Flux (YPF) and the Phytochrome Photostationary State (PSS) calculated according to [66], as well as electrical measurements done using a Fluke 45 True RMS multi-meter (Fluke Corporation; Everett WA, USA) as described in [24].
2.3. Outdoor Cultivation
After 6 weeks of indoor cultivation, including light intensity and UVA treatments, 120 seedlings from each treatment and species were randomly selected and transplanted into multi-pot containers (Hiko V93, BCC AB; Landskrona, Sweden) of bigger dimensions (tray size: 352 × 216 mm; density: 526 seedlings per m2; 40 cells per tray; volume per cell: 93 cm3) filled with peat substrate (Närkes miljöproduktion AB, Sweden). Three trays with 40 seedlings each were transplanted per treatment and species for every sowing.
The transplanted seedlings were placed outside of the research forest nursery facilities of Dalarna University at Vassbo, Sweden (lat. 60.53°; long. 15.53°; alt. 130 m). To avoid drought stress after transplanting, automatic irrigation was done daily with approximately 7 L of water per m2 (14 trays correspond to 1 m2). Manual fertilization was done twice a week using a complete mineral nutrient solution (Wallco, Sweden) dissolved in water. The weekly nitrogen supply was 3 g·m−2 over the growing area until the end of the vegetation period.
In this study, the term “transplanting” comprised as well the immediate transfer after indoor cultivation to outdoor conditions in the nursery for extended growth during the rest of the vegetation period. This to differentiate it from the concept of “outplanting” which includes the transport before delivery to the field and the planting in the forest [19]. Table 1 shows a summary of the sowing and transplanting dates, as well as the time spent outdoors before the attributes assessment.

Table 1.
Summary of important dates by sowing.
2.3.1. Outdoor Treatments
The outdoor treatments consisted of a transient phase using a shading cloth which could help reduce the stress and improve the acclimatization between the growth room facility and the outdoor conditions by reducing the solar irradiance during the first week(s) [58]. Unshaded control seedlings were placed directly under sunlight while the treated seedlings were placed under a climate screen SOLARO 3320 (AB Ludvig Svensson, Kinna, Sweden) 50 cm above the seedlings during one or three weeks. The climate screen reduced the light intensity by 30%. Regarding the spectral composition under the screen, tests showed no major differences compared to ambient sunlight [58].
A summary of the indoor and outdoor treatments studied in each sowing is shown in Table 2.
Table 2.
Treatments summary by sowing.
2.3.2. Solar Radiation and Ambient Temperature
The Photosynthetically Active Radiation (PAR) was measured every minute and logged in 15 min intervals using two quantum sensors SQ-110 (Apogee Instruments, Logan UT, USA) placed together with the trays at the same level as the substrate. One sensor was placed under the shading cloth and the other one outside the cloth. The ultraviolet (UV) radiation was measured likewise using two UV sensors SU-100 (Apogee Instruments, Logan UT, USA) with a spectral response between 250–400 nm. Finally, the ambient temperature was monitored using a weather station Vantage Pro2 (Davis Instruments, Hayward CA, USA).
Both years during which the study was carried out presented unusually high solar irradiance level in the region near the research station [67] compared to measurements for ambient temperatures and calculated PAR values reported by the Swedish Meteorological and Hydrological Institute (SMHI) [68,69]. The potential for light shock stress could therefore be considered high during both years. The data monitored at the nursery are presented in Figure 2 together with the historical range recorded by SMHI.
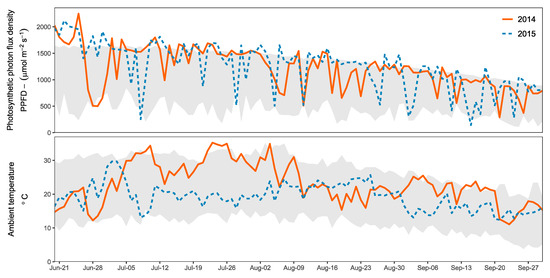
Figure 2.
Solar irradiance (PAR) together with ambient temperature during the vegetation periods of 2014 and 2015 at the research station in Vassbo, Sweden (lat. 60.53°; long. 15.53°). The lines for the corresponding years indicate the maximum daily values of instantaneous photon flux density for photosynthetic radiation (PPFD) expressed in μmol·m−2·s−1 and ambient temperature in °C. The grey bands show the range of historical values reported by the Swedish Meteorological and Hydrological Institute (SMHI) [68,69].
2.4. Seedling Measurements
At the end of the vegetation period after the outdoor cultivation, 60 seedlings per species were randomly selected from each sowing and measured to evaluate their growth development. The material attributes [70] measured were shoot height (mm) and stem diameter (mm), as well as the dry weight (g) (DW) of the shoot and roots. For the dry weights, the samples were dried in an oven for 24 h at 100 °C and then placed in a desiccator another 24 h before weighing the seedlings individually.
The seedling quality was evaluated based on their sturdiness calculated as the ratio of the shoot height to stem diameter (height:diameter ratio), and based on their shoot:root ratio [70] as an indicator of biomass balance between their photosynthetic and transpirational zone (shoot system) and their nutrient and water absorbing zone (root system) [71]. Irregularities in these ratios could evidence light stress damage on the shoot system which could affect the seedlings’ future performance in the field [70]. Figure 3 presents a graphical summary of the methodology followed in this study including the indoor treatments and the direct transplanting to outdoor conditions.
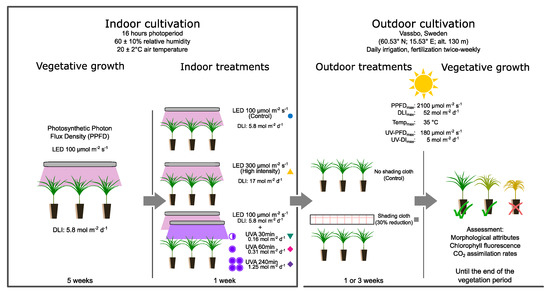
Figure 3.
Summary of indoor and outdoor treatments applied in this study. Indoor cultivation was done in a growth room facility under artificial lights and completely deprived from solar radiation. The outdoor cultivation phase followed immediately after transplanting from indoor treatments at the research facilities. For the purpose of reference and consistency, the color symbols next to the treatments correspond to the symbols used in the figures of the Results Section.
2.4.1. Chlorophyll Fluorescence
Chlorophyll fluorescence (ChlF) can measure the efficiency of the Photosystem II (PSII) which is in of charge of the light depending reactions in photosynthesis [72]. When the amount of light absorbed exceeds the amount of energy that the plant can utilize, the efficiency of PSII is reduced resulting in a delay of photosynthesis that affects the CO2 uptake [73]. Measuring ChlF is a straightforward method for detecting evidence of photodamage and evaluating seedling stress caused by excessive absorbed light energy [73]. ChlF has been suggested as a good estimator for seedling stress and possible performance in the field [74].
For the third sowing (S3), 15 random seedlings per treatment and species were selected for measurements of ChlF levels before and after transplanting. The seedlings were individually identified and followed during 35 days with measurements starting the day before and after transplanting followed by weekly measurements (days: 0,1,7,14,21, and 35) to trace the acclimation process. The ChlF levels of the seedlings under the shading cloth were also measured the day after removing the protective screen (day 8) to evaluate the impact of the transition phase.
The maximum quantum yield of the PSII (Fv/Fm) was measured using a portable Chlorophyll Fluorometer FMS 2 (Hansatech Instruments, UK). This device measures the efficiency at which the light that PSII absorbed is available for photochemistry in a dark-adapted sample when all reaction centers are open. The procedure used was carried out as described by [75] with a dark-adaption time of one hour. The top part of the shoot of each seedling was placed under the measuring light to obtain the minimal level of fluorescence F0. Finally, a saturating flash of light was applied to measure the maximum level of fluorescence in the dark-adapted state Fm. The maximum quantum yield of the PSII in the dark adapted state was calculated according to [76] as:
Fv/Fm = (Fm − F0)/Fm
2.4.2. Photosynthetic Light-Response Curves
A lower photosynthesis and a reduction in the CO2 uptake are direct consequences of photodamage caused by excessive radiation [31]. In order to evaluate these possible effects, the net CO2 assimilation at different light intensities was recorded to generate the photosynthetic light-response curves. Three seedlings of each treatment and species in S3 were randomly selected and their photosynthetic light-response curves were measured the day before transplanting. After 5 weeks outdoors an additional set of three seedlings per treatment and species were randomly sampled and analyzed.
The response of the seedlings to different PPFD was measured using an open gas exchange system CIRAS-3 (PP-Systems, USA) with an attached PLC3 conifer cuvette (Part No. CRS302) and a LED unit (Part No. CRS305) as light source. The gas exchange system was programmed to automatically start from a high light intensity and decrease in intervals until reaching darkness as suggested in [77]. The PPFD was maintained for at least 5 min in order to allow the seedling to acclimate and the photosynthesis level to stabilize. The CO2 concentration in the cuvette was 390 µmol·mol−1 with constant air flow of 300 mol·s−1. The chamber temperature was regulated at 20 °C and a relative humidity of 60%. After the gas exchange measurement, each seedling was dried in an oven for 24 h to measure the needles dry mass.
The net CO2 uptake was calculated and expressed as function of the needles dry mass (µmol CO2·kg−1·s−1) instead of projected needle area following the example of [78]. Since the complete shoot system was introduced in the cuvette, this method was considered more appropriate compared to the projected needle area. Moreover, mass-based gas exchange rates have found to be more consistent with the relative growth rate [79,80].
2.5. Data Analysis
The data analysis was performed using the software R-version 3.6.1 [81] and the results are graphically presented using the R package ggplot2 [82] following when possible the RDI principle showing individual Raw data points, Descriptive statistics and Inferential statistics in one plot as suggested in [83,84]. The spectral analysis was done using the r4photobiology suite [85] and the corresponding methods for photobiology calculations in R [86].
All indoor treatments in this study were done using the same set of LED lamps in the same growing room facilities. The environmental conditions were constantly controlled and the tests were repeated via three sowings using the same settings for indoor temperature and humidity.
Descriptive statistics (mean and standard error) for the measured morphological attributes are presented for completeness in the Appendix A, Table A1 for Norway Spruce and Table A2 for Scots pine. The means for morphological attributes of the treatments together with individual data points are presented in order to illustrate the data distribution in the format suggested by [71].
For the case of the ChlF data the analysis was done separately for each species following the structure of a repeated measures ANOVA with methodology described by [87,88] to study the effects of the treatments within subjects. The R package nlme [89] was used to generate a mixed effect model with both a random intercept and a random slope for each treatment to explicitly model the changes in ChlF for individual seedlings over time.
3. Results
Chlorophyll fluorescence allows a better understanding of the seedling’s physiological status especially in the early days after transplanting before the PSII has adapted to the outdoor conditions. When analyzing the measurements of the individual seedlings of S3, there was a visible effect of the treatment within each seedling’s ChlF level in respect to time.
Control seedlings of Norway spruce had the highest drop in ChlF during the first seven days being considerably lower compared to the other three treatments (see Figure 4). After the shading cloth was removed, the ChlF levels of both the control and the seedlings under the shading cloth were similar. For Scots pine seedlings, the differences were not so pronounced but still noticeable. The control seedlings evidenced the highest stress in the PSII followed by the seedlings in the UVA-240 min treatment. The seedlings treated under high light intensity and under the shading cloth showed the lowest signs of stress. This was true until the shading cloth was removed on the eighth day and the ChlF level of the seedlings under that treatment dropped.
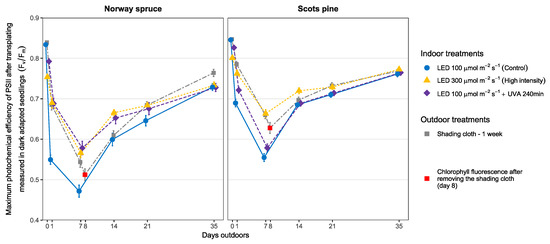
Figure 4.
Chlorophyll fluorescence (Fv/Fm) after transplanting outdoors for seedlings of Norway spruce and Scots pine cultivated indoors under LED lights. The same individual seedlings were repeatedly measured during the first 35 days of natural light exposure. An extra measurement was done only on the shading cloth treatment to measure the effect of removing the cloth on the 8th day (red square). The data points represent the mean (n = 15) for each treatment at that measuring time and the error bars represent the standard error of the sample mean.
After 14 days of outdoor conditions, the changes in ChlF for individual seedlings over time was not significant anymore. By the end of the vegetation period the survival rate was nearly 100% in all treatments and even the most affected seedling had managed to recover and produce new needles adapted to the outdoor conditions.
The net CO2 assimilation rates also varied between the measurement times. The seedlings of Norway spruce showed very small variations between treatments before transplanting compared to the seedlings of Scots pine which showed a reduced photosynthesis rate for the seedlings treated under the high light intensity (Figure 5). This trend was reverted five weeks after transplanting when the seedlings of Scots pine showed no marked differences between treatments but Norway spruce seedlings presented noticeable variations.
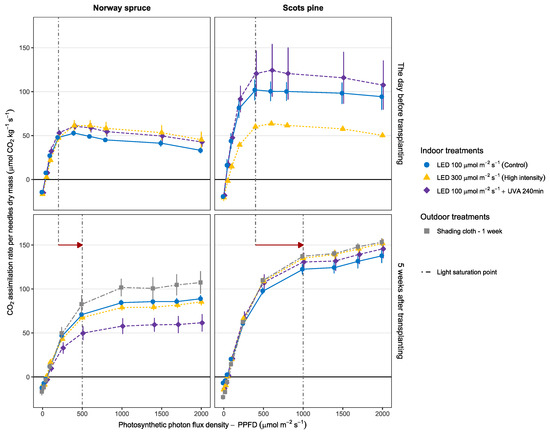
Figure 5.
Average light-response curves for seedlings of Norway spruce and Scots pine cultivated indoors under LED lights. The net CO2 assimilation was calculated relative to seedling’s needles dry mass as a function of the light intensity. The vertical dashed lines show the shift in the light saturation point after adapting to outdoor conditions. The error bars represent the standard error of the sample mean (n = 3).
For both species, the seedlings increased their assimilation rates on a dry-mass basis once they had adapted to natural light. The day before sunlight exposure, regardless of treatment, the light saturation point was at around 200 μmol·m−2·s−1 for Norway spruce seedlings and for Scots pine around 400 μmol·m−2·s−1. Five weeks after transplanting, the light saturation point had shifted to approximately 500 μmol m−2·s−1 for Norway spruce and was close to 1000 μmol·m−2·s−1 for Scots pine seedlings independently of the treatment (see red arrow in Figure 5).
The results of the gas exchange measurements shown in Figure 5 support the findings of the ChlF measurements (Figure 4). While the ChlF measures the direct stress on the photoreceptors in PSII, the photosynthetic light-response curves give a broader insight to the whole photosynthetic apparatus. The results of both the chlorophyll fluorescence and the CO2 assimilation rate showed an initial stress in the seedlings followed by an adaptation process to the outdoor light conditions.
At the end of the vegetation periods there were no noticeable differences in the morphological attributes between the treated and the control seedlings in any of the sowings for either of the species. There is neither a marked difference between the indoor and the outdoor treatments. In general, the seedlings of Norway spruce had a trend to be more elongated with respect to their stem diameter with average ratios around 75:1. Seedlings of Scots pine tended to be sturdier and the seedlings of S1 and S3 were close to 50:1 regarding their height:diameter ratio (Figure 6, presented in the format as suggested by [71]).
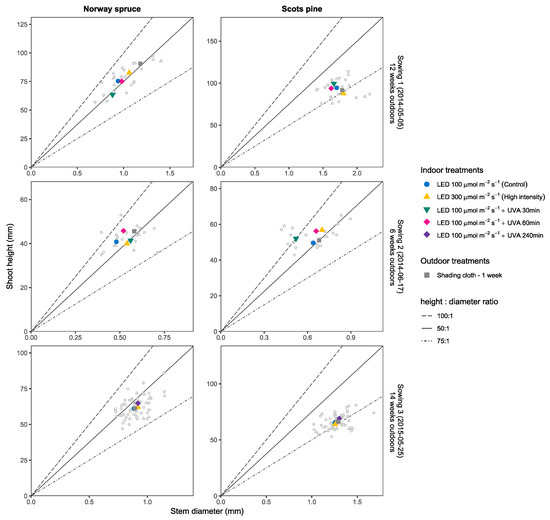
Figure 6.
Average sturdiness evaluated in function of the height:diameter ratio after the first vegetation period for seedlings of Norway Spruce (left) and Scots pine (right). Each panel row shows the results for one individual sowing with colored shapes representing the mean of each treatment in ordered pairs (x = stem diameter (mm), y = shoot height (mm)) and smaller points show the individual seedling measurements. Lines mark the different height:diameter ratios (100:1, 75:1, 50:1). For Sowing 1 and Sowing 2 the UVA treatments (30 and 60 min) were different from Sowing 3 which only included the UVA 240 min treatment as explained in the Materials and Methods Section.
Regarding the seedlings’ biomass distribution between the shoot and the root (shoot:root ratio), there is no major difference between the species and treatments nor between the sowings as shown in Figure 7 (also presented in the format suggested by [71]). The general trend is towards a 4:1 ratio for Norway spruce and between 3:1 and 2:1 for Scots pine seedlings.
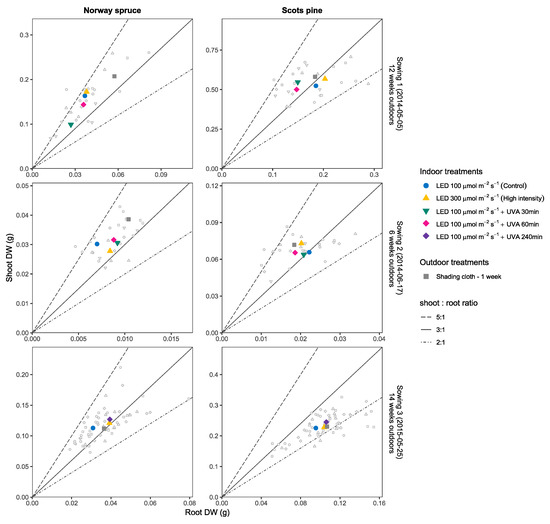
Figure 7.
Average biomass distribution evaluated in function of the shoot:root ratio after the first vegetation period for seedlings of Norway Spruce (left) and Scots pine (right). Each panel row shows the results for one individual sowing with colored shapes representing the mean of each treatment in ordered pairs (x = shoot DW (g), y = root DW (g)) and smaller points show the individual seedling measurements. Solid lines mark the different shoot:root ratios (5:1, 3:1, 2:1). For Sowing 1 and Sowing 2 the UVA treatments (30 min and 60 min) were different from Sowing 3 which only included the UVA 240 min treatment as explained in the Materials and Methods Section.
Finally, the energy consumption during the different indoor treatments are presented in Figure 8 showing a variation depending on the chosen treatment. The LED lamps in the control had a power consumption of 41 W for 16 h and 7 days. This amounts to 4.6 kWh per m2 of cultivation area. The high intensity treatment provided triple irradiance to the plants compared to the control with a power of 118 W, which is equal to 13.2 kWh per m2 of cultivation during the treatment phase.
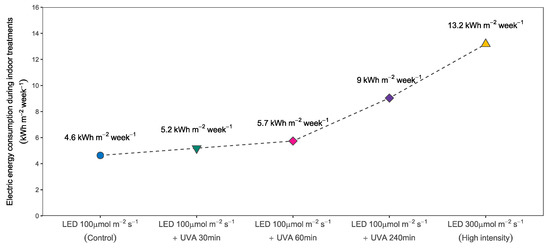
Figure 8.
Electric energy consumption by the lamps during the indoor treatment. The figure shows the energy consumption in each treatment for 7 days expressed as kWh per m2 of cultivation area.
Due to the higher energy of the photons produced and the lower efficiency of the chips, the UVA LED lamps had a considerably higher power requirement of 157 W. Treating the seedlings during 30 or 60 min daily during a week required 0.6 or 1.2 kWh per m2 of cultivation area respectively. When adopting a 4 h treatment as in S3 the energy consumption was 4.4 kWh per m2 of cultivation area. The seedlings assigned to the UVA treatments also required photosynthetic light during the treatment time and thus the energy required for the UVA lamps was added to the level of the control (see Figure 8).
The difference in energy consumption relative to the control level showed a direct relationship between the power of the lamps at the selected intensity and the amount of time they were used. Each hour of UVA lighting increased the energy consumption by roughly 24% compared to the control group. This means that adding 4 h of artificial UVA radiation almost doubled the energy consumption. Lastly, tripling the light intensity from 100 to 300 μmol·m−2·s−1 using the same LED lamps had a relative energy consumption of approximately 290% with respect to the control level.
4. Discussion
The successful acclimatization of forest seedlings cultivated solely under LED lights depends to a large extent on the differences between the indoor and outdoor conditions at the time of transplanting [28]. When the environment is drastically changed and the light intensity is significantly increased as in the case of an outdoor transplanting, it is likely that some photodamage will occur before the protective mechanisms are activated. If the damage is not severe, the seedling might recover and create new structures adapted to the new conditions. However, the ability of acclimatizing pre-existing needles and the rate at which this happens differs among species [28].
In northern latitudes, the natural sunlight conditions change considerably throughout the year with particularly high levels during spring and summer. During the monitoring period of this study, the PAR reached levels above 2000 μmol·m−2·s−1 and the UV radiation above 180 μmol m−2·s−1 during some days. The daily proportion of UV to PAR light ranged between 5% to 16% and were similar under the shading clothes. The year 2014 had a particularly warm and dry summer [67] with conditions that caused a higher risk for light shock stress. However, once the seedlings were adapted to those conditions, they were able to benefit from the constant sunny weather. This resulted in larger and sturdier seedlings after the vegetation period of 2014 compared to 2015 when looking at S1 and S3 which both had more than 10 weeks of outdoor growth (see Figure 6).
In this study, the light shock stress during the first days after transplanting was evidenced with a considerable drop in the maximum quantum yield of the PSII (Fv/Fm) within seedlings of both species and all treatments. The levels drastically fell below the recommended values of around 0.81–0.83 for healthy and non-stressed plants when measured in a dark adapted state [75,90,91,92]. Untreated seedlings of both species presented lower ChlF levels and a more pronounced drop when comparing them to seedlings of other treatments with respect to time of measurement.
For Norway spruce, the shading cloth seemed to provide similar protection levels as the natural mechanisms developed by seedlings treated indoors with higher light intensities or UVA for 240 min. However, on the eighth day when the shading cloth was removed, the ChlF levels dropped to the levels of the control seedlings. For Scots pine seedlings there were also changes at the various measuring times, especially during the first days after transplanting. The control seedlings had the steepest decline in ChlF levels followed by the seedlings treated with 240 min of UVA. As with Norway spruce, once the shading cloth was removed and the seedlings were exposed to direct sunlight, the value for the ChlF dropped. This could indicate that the transient phase under the cloths was too short for the seedlings to adapt and emphasizes the need for an adaption phase indoors in order to promote the internal generation of photoprotective mechanisms in the cells [57,58].
As time passed, the seedlings recovered from the stress and were able to repair the damage and create new needles adapted to the outdoor conditions. When measuring the maximum photochemical efficiency of PSII in top needles after three weeks, no differences were found among species or treatments. After 35 days the values had almost reached normal levels again. This apparent dilution of the treatments effect over time is usually expected as the seedlings acclimate and produce new needles adapted to the outdoor conditions [28].
Before transplanting, the seedlings were adapted to indoor light conditions and reached their maximum photosynthesis level at much lower light intensity. The seedlings of Norway spruce had a similar light response curve regardless of the treatment. Seedlings of Scots pine treated under high intensity lights exhibited a lower CO2 assimilation rate per dry mass compared to the other treatments partly because they had developed relatively more biomass. This matches well the results of previous experiments under different LED intensities [24]. It also agrees with other studies that evaluated gas-exchange measurements in function of the dry-mass [93] because seedlings grown under insufficient light conditions often develop elongated and water saturated stems with a lower dry-mass [80,94].
The maximum net CO2 uptake before transplanting for Norway spruce seedlings was at around 200 μmol m−2·s−1 and around 400 μmol·m−2·s−1 for Scots pine seedlings regardless of the treatment. After 35 days outdoors, Norway spruce seedlings had a light saturation point at approximately 500 μmol·m−2·s−1 and Scots pine seedlings had a maximum CO2 uptake at about 1000 μmol m−2·s−1 independently of treatment. As a consequence, once they had adapted to natural light, seedlings of both species increased their CO2 assimilation rates on a dry-mass basis. In general, species adapted to high light environments like Scots pine develop higher rates for capturing available resources and grow faster than those adapted to low light environments [80].
The shape of the light-response curves for seedlings of both species changed when comparing the measurements before transplanting and after 35 days outdoors. The light compensation point, defined as the light intensity at which the respiration matches the photosynthesis [95], moved slightly to the right due to a change in the initial slope of the curve. The main evidence of an adaptation however was the shift of the light saturation points towards higher light intensities for both species. The light saturation point in the CO2 assimilation curve indicates the moment when light is no longer the limiting factor and after which increasing the PAR intensity does not result in a linear increase in photosynthesis and can even produce stress in the photoreceptors [96].
While chlorophyll fluorescence measurements can detect a reduction in the efficiency of PSII and a decline in photosynthesis that affects the CO2 uptake [31], gas exchange measurements of the net CO2 assimilation allow to assess the reduction in efficiency of the whole photosynthesis process [96]. The results of both the chlorophyll fluorescence measurements and the CO2 assimilation rates (see Figure 4 and Figure 5) could indicate an initial stress in the seedlings followed by a physiological adaptation to the outdoor light conditions [28].
At the end of the vegetation period the seedlings had similar morphological attributes regardless of the treatment. The seedlings of Norway spruce tended to have more elongated stems with height:diameter ratios around 75:1 for all sowings. In contrast, Scots pine seedlings showed the trend of becoming sturdier with lower ratios closer to 50:1. Regarding the biomass distribution, seedlings of Norway spruce presented a high shoot:root ratio of around 4:1. This result agrees with studies that have shown that seedlings adapted to low light allocate more biomass to stems and less to roots in order to capture more light [79,80]. In contrast seedlings of Scots pine allocated more biomass to the root system reaching shoot:root ratios for S1 and S2 of around 3:1 and of 2:1 for S3. Assigning more resources to the root zone combined with a higher light tolerance can contribute to a faster establishment in the field [19,70].
The seedlings of Scots pine in this study adapted rapidly to the outdoor conditions and showed only slight visual signs of stress from the light shock. In contrast, the seedlings of Norway spruce were more affected by the change in conditions and possibly suffered photodamage showing some dry needles and visual signs of discoloration just a couple of days after transplanting. These differences can be explained by the natural adaptation of each species: Norway spruce is considered a shade-tolerant tree that naturally develops under the canopy of sheltered woods under low light conditions [97]. In contrast Scots pine is considered a pioneer species adapted to high light intensities that establishes well under full sunshine in clear sites and after forest fires [98,99].
This fundamental genetic differences between the species play a very important roll in the seedling’s success and the selection of light shock mitigation methods during cultivation. Although the results of this study suggest that the seedlings of both species managed to cope with the light shock stress and adapt to the outdoor conditions, additional studies within this field are required and of great importance. Future research should focus on possible treatments to mitigate the combined effects of other factors such as high temperature and drought stress together with sunlight exposure.
Finally, the energy consumption is an important factor to be considered in the outline of future cultivation protocols of a year-round production concept. Increasing the light intensity will increase the energy consumption proportionally. In this study, going from 100 to 300 μmol·m−2·s−1 for the treatment roughly triplicated the electricity per m2 needed during the last week. In comparison, every hour of UVA treatment requires 1.2 kWh per m2 of cultivation area. Taking this into account, it requires 46% more electricity per m2 of cultivation area to increase the PAR intensity to 300 μmol m−2·s−1 during the last week than to treat the seedlings with UVA light during 4 h each day.
Even if at first it could seem more energy efficient, the use of UVA treatments also implies the acquisition of additional UV-LED lamps instead of just increasing the intensity of the existing growing LED lamps. Moreover, UV-LED chips are not so commonly used and are not as developed as the LED chips for other wavelengths, resulting in lower efficiencies, higher production costs and much shorter lifetimes [100]. The UV luminaires used in this study had approximately four times more energy consumption per photon output when measured directly underneath the luminaire compared to the LED grow lamps. This is due to the lower efficiency of UV-LEDs chips and the fact that UV photons have higher energy wavelengths.
Mitigating transplant stress, light shock is specifically a topic of crucial importance for tree nurseries in the boreal climate region planning to adopt a year-round cultivation concept under LED lamps. If this concept is to be successfully implemented, it is necessary to find growth protocols that help the seedlings bridge the transition to sunlight exposure with less stress. The application of outdoor treatments such as shading cloths and climate screens in commercial nurseries imply more equipment, increased costs as well as extra labor. Therefore, the development of an indoor method that can be applied directly in the growth room facility to effectively mitigate the effects of the outdoor light shock is preferable.
5. Conclusions
- The main objective of the study, which was to identify successful protocols for light shock mitigation, was not reached. The applied treatments did not significantly improve the adaptation of the tree seedlings cultivated only under LED lights when transplanted to outdoor conditions. Nevertheless, there was a tendency that some preconditioning could reduce the light shock during the first days of transplanting, especially the high light intensity and the shading cloth treatments. Therefore, there is a need for additional studies with a broader approach of treatments that could mitigate the light shock stress.
- Both the spectral characteristics as well as the light intensity in the growth room facilities differ considerably from the natural outdoor conditions as seen in Figure 1. Further studies on the topic should focus on finding indoor treatments that adjust gradually the light intensity and spectrum including UV-light to levels that are closer to the outdoor conditions.
- Regardless of whether the seedlings had been treated or not, the chlorophyll fluorescence levels revealed signs of light shock stress and damage of the PSII after transplanting to direct sunlight. The most affected seedlings were those in the control group, especially Norway spruce, with a significant decrease in their maximum quantum yield of the PSII.
- Gas exchange measurements showed the acclimation of the seedlings from a more comprehensive perspective (not only the photoreceptor but the whole photosynthetic apparatus) and revealed a change in the light saturation points of the photosynthetic light-response curves of seedlings of both species after 35 days outdoors. This shift towards higher PPFD evidence an adaptation of the photosynthetic apparatus that allows the seedlings to cope with elevated light intensities and sustain higher CO2 uptake and faster growth in outdoor conditions.
- At the end of the vegetation period, seedlings from all treatments were able to withstand and recover from the light shock stress. The morphological attributes showed no differences between the treatments within each sowing (height:diameter and shoot:root ratio). Nevertheless, since seedlings of all treatments were affected, it is difficult to predict the full development potential if the light shock stress had been avoided.
- The properties of the indoor treatments (light intensity level or duration of the UV exposure) had a major impact on the energy consumption. Therefore, these factors should be further analyzed in future studies to continue developing the concept of year-round cultivation of forest seedlings in the boreal climate region.
Author Contributions
Conceptualization and methodology, A.M. and M.H.V.; data curation and visualization, M.H.V.; investigation and formal analysis, A.M. and M.H.V.; writing—original draft preparation, A.M. and M.H.V.; writing—review and editing, A.M.; supervision, project administration and funding acquisition, A.M. All authors have read and agreed to the published version of the manuscript.
Funding
This research project was supported by FP7 Environment [Grant Number ZEPHYR-Project ID: 308313].
Acknowledgments
STRÅNG data used here are from the Swedish Meteorological and Hydrological Institute (SMHI) and were produced with support from the Swedish Radiation Protection Authority and the Swedish Environmental Agency. The authors would like to thank Elisabeth Wallin (Swedish University of Agricultural Sciences) for the constructive comments on the experimental design as well as Sofia Lindblad (Uppsala University) for improvements in the language and style. This work would not have been possible without the dedicated help of Marianne Vemhäll, Filippos Bantis and Massimiliano Marani during the different measurement stages.
Conflicts of Interest
The authors declare no conflict of interest. The funders had no role in the design of the study; in the collection, analyses, or interpretation of data; in the writing of the manuscript, or in the decision to publish the results.
Appendix A
Table A1.
Material attributes of Norway spruce seedlings after one vegetation period.
Table A1.
Material attributes of Norway spruce seedlings after one vegetation period.
| Norway Spruce | Sowing 1 (2014-05-05) | Sowing 2 (2014-06-17) | Sowing 3 (2015-05-25) | ||||||||||||||||||||
|---|---|---|---|---|---|---|---|---|---|---|---|---|---|---|---|---|---|---|---|---|---|---|---|
| Indoor Treatments | Indoor Treatments | Indoor Treatments | |||||||||||||||||||||
| Attribute | Outdoor Treatments | Control | High Intensity | UVA 30 min | UVA 60 min | Control | High Intensity | UVA 30 min | UVA 60 min | Control | High Intensity | UVA 240 min | |||||||||||
| Shoot height (mm) | No shading cloth (control) | 75.4 | (3.7) | 82.6 | (4.0) | 63.4 | (3.0) | 75.2 | (2.7) | 40.8 | (1.5) | 40.0 | (1.2) | 41.4 | (2.5) | 45.8 | (0.7) | 61.1 | (2.5) | 62.1 | (1.5) | 64.9 | (2.0) |
| Shading cloth-1 week | 90.6 | (2.3) | 87.2 | (4.5) | 89.0 | (3.0) | 92.8 | (3.8) | 45.6 | (2.1) | 45.0 | (1.9) | 45.6 | (0.5) | 41.6 | (1.0) | 61.3 | (1.4) | |||||
| Shading cloth-3 weeks | 94.0 | (2.2) | 94.6 | (4.7) | 86.2 | (4.0) | 90.4 | (2.3) | 44.6 | (1.2) | 42.4 | (1.7) | 45.8 | (2.2) | 45.8 | (1.8) | |||||||
| Stem diameter (mm) | No shading cloth (control) | 0.94 | (0.05) | 1.06 | (0.09) | 0.88 | (0.07) | 0.98 | (0.04) | 0.48 | (0.02) | 0.54 | (0.02) | 0.56 | (0.05) | 0.52 | (0.04) | 0.88 | (0.03) | 0.92 | (0.02) | 0.92 | (0.02) |
| Shading cloth-1 week | 1.18 | (0.06) | 1.14 | (0.06) | 1.12 | (0.05) | 1.26 | (0.07) | 0.58 | (0.04) | 0.54 | (0.02) | 0.54 | (0.05) | 0.70 | (0.03) | 0.89 | (0.03) | |||||
| Shading cloth-3 weeks | 1.14 | (0.12) | 1.08 | (0.04) | 1.08 | (0.04) | 1.12 | (0.05) | 0.64 | (0.05) | 0.58 | (0.04) | 0.60 | (0.03) | 0.60 | (0.03) | |||||||
| Height: diameter | No shading cloth (control) | 81.0 | (5.2) | 79.0 | (3.4) | 73.0 | (3.2) | 77.1 | (3.9) | 85.2 | (2.1) | 74.6 | (3.5) | 76.1 | (6.9) | 89.8 | (6.3) | 69.3 | (2.4) | 67.9 | (1.6) | 70.7 | (2.0) |
| Shading cloth-1 week | 77.3 | (2.8) | 76.8 | (3.5) | 79.9 | (3.3) | 74.1 | (2.4) | 80.1 | (7.1) | 83.7 | (3.9) | 87.3 | (7.7) | 59.9 | (2.9) | 69.3 | (2.0) | |||||
| Shading cloth-3 weeks | 85.8 | (7.9) | 87.5 | (2.1) | 79.9 | (2.6) | 81.5 | (4.7) | 71.3 | (5.2) | 74.6 | (6.3) | 77.7 | (7.3) | 77.7 | (6.5) | |||||||
| Shoot DW (g) | No shading cloth (control) | 0.163 | (0.015) | 0.172 | (0.064) | 0.099 | (0.031) | 0.144 | (0.023) | 0.030 | (0.007) | 0.028 | (0.003) | 0.031 | (0.006) | 0.032 | (0.003) | 0.113 | (0.034) | 0.121 | (0.021) | 0.127 | (0.022) |
| Shading cloth-1 week | 0.207 | (0.019) | 0.201 | (0.013) | 0.217 | (0.044) | 0.235 | (0.059) | 0.039 | (0.008) | 0.037 | (0.005) | 0.037 | (0.004) | 0.033 | (0.004) | 0.112 | (0.026) | |||||
| Shading cloth-3 weeks | 0.260 | (0.014) | 0.219 | (0.017) | 0.219 | (0.033) | 0.227 | (0.039) | 0.040 | (0.002) | 0.033 | (0.006) | 0.034 | (0.002) | 0.033 | (0.005) | |||||||
| Root DW (g) | No shading cloth (control) | 0.037 | (0.003) | 0.038 | (0.006) | 0.027 | (0.006) | 0.036 | (0.002) | 0.007 | (0.001) | 0.008 | (0.001) | 0.009 | (0.001) | 0.009 | (0.001) | 0.031 | (0.002) | 0.039 | (0.002) | 0.039 | (0.003) |
| Shading cloth-1 week | 0.057 | (0.008) | 0.053 | (0.008) | 0.054 | (0.003) | 0.053 | (0.006) | 0.010 | (0.001) | 0.011 | (0.001) | 0.010 | (0.001) | 0.009 | (0.001) | 0.036 | (0.004) | |||||
| Shading cloth-3 weeks | 0.072 | (0.008) | 0.058 | (0.011) | 0.048 | (0.005) | 0.056 | (0.003) | 0.011 | (0.001) | 0.008 | (0.001) | 0.008 | (0.001) | 0.008 | (0.001) | |||||||
| Shoot: root | No shading cloth (control) | 4.69 | (0.78) | 4.60 | (0.34) | 4.12 | (0.51) | 4.01 | (0.16) | 4.41 | (0.39) | 3.45 | (0.41) | 3.33 | (0.17) | 3.67 | (0.35) | 3.68 | (0.15) | 3.15 | (0.14) | 3.36 | (0.19) |
| Shading cloth-1 week | 3.77 | (0.35) | 3.89 | (0.29) | 4.00 | (0.18) | 4.49 | (0.20) | 3.75 | (0.21) | 3.66 | (0.50) | 3.57 | (0.27) | 3.72 | (0.48) | 3.24 | (0.16) | |||||
| Shading cloth-3 weeks | 3.82 | (0.54) | 4.24 | (0.77) | 4.76 | (0.44) | 4.12 | (0.33) | 3.84 | (0.45) | 4.23 | (0.62) | 4.92 | (0.89) | 3.90 | (0.10) | |||||||
| Sample mean (SE), 12 weeks after transplanting, n = 5 | Sample mean (SE), 6 weeks after transplanting, n = 5 | Sample mean (SE), 14 weeks after transplanting, n = 15 | |||||||||||||||||||||
Table A2.
Material attributes of Scots pine seedlings after one vegetation period.
Table A2.
Material attributes of Scots pine seedlings after one vegetation period.
| Scots Pine | Sowing 1 (2014-05-05) | Sowing 2 (2014-06-17) | Sowing 3 (2015-05-25) | ||||||||||||||||||||
|---|---|---|---|---|---|---|---|---|---|---|---|---|---|---|---|---|---|---|---|---|---|---|---|
| Indoor Treatments | Indoor Treatments | Indoor Treatments | |||||||||||||||||||||
| Attribute | Outdoor Treatments | Control | High Intensity | UVA 30 min | UVA 60 min | Control | High Intensity | UVA 30 min | UVA 60 min | Control | High Intensity | UVA 240 min | |||||||||||
| Shoot height (mm) | No shading cloth (control) | 94.4 | (5.1) | 87.8 | (4.6) | 99.4 | (5.1) | 93.8 | (3.7) | 49.6 | (2.1) | 56.8 | (2.5) | 52.0 | (1.7) | 56.2 | (2.6) | 65.4 | (1.7) | 63.9 | (1.5) | 69.1 | (1.4) |
| Shading cloth-1 week | 91.8 | (5.6) | 88.8 | (3.1) | 89.2 | (1.7) | 104.2 | (5.5) | 51.0 | (1.7) | 52.6 | (1.4) | 53.6 | (2.7) | 57.2 | (1.4) | 66.3 | (1.8) | |||||
| Shading cloth-3 weeks | 91.2 | (7.1) | 83.2 | (4.9) | 94.4 | (5.5) | 96.4 | (3.6) | 52.6 | (3.1) | 55.6 | (3.5) | 55.0 | (3.6) | 52.6 | (2.5) | |||||||
| Stem diameter (mm) | No shading cloth (control) | 1.70 | (0.08) | 1.80 | (0.10) | 1.66 | (0.07) | 1.62 | (0.08) | 0.64 | (0.04) | 0.70 | (0.08) | 0.52 | (0.05) | 0.66 | (0.06) | 1.25 | (0.04) | 1.26 | (0.02) | 1.30 | (0.03) |
| Shading cloth-1 week | 1.78 | (0.12) | 1.54 | (0.09) | 1.44 | (0.05) | 1.82 | (0.06) | 0.68 | (0.05) | 0.72 | (0.04) | 0.78 | (0.02) | 0.74 | (0.07) | 1.29 | (0.03) | |||||
| Shading cloth-3 weeks | 1.76 | (0.11) | 1.64 | (0.07) | 1.66 | (0.08) | 1.66 | (0.07) | 0.88 | (0.05) | 0.72 | (0.09) | 0.80 | (0.03) | 0.90 | (0.03) | |||||||
| Height: diameter | No shading cloth (control) | 55.9 | (3.2) | 49.6 | (4.4) | 59.9 | (1.9) | 58.4 | (3.3) | 78.2 | (3.3) | 87.6 | (15.0) | 103.8 | (11.2) | 87.5 | (7.9) | 52.5 | (1.6) | 51.0 | (1.3) | 53.3 | (1.2) |
| Shading cloth-1 week | 52.2 | (3.8) | 58.2 | (2.8) | 62.2 | (1.9) | 57.6 | (4.1) | 76.5 | (5.8) | 73.9 | (4.3) | 69.0 | (4.5) | 80.0 | (7.5) | 51.7 | (1.4) | |||||
| Shading cloth-3 weeks | 52.2 | (3.8) | 51.2 | (4.0) | 57.2 | (3.3) | 58.2 | (1.4) | 60.6 | (5.4) | 85.5 | (18.2) | 69.7 | (6.8) | 58.5 | (2.0) | |||||||
| Shoot DW (g) | No shading cloth (control) | 0.524 | (0.026) | 0.568 | (0.064) | 0.547 | (0.031) | 0.500 | (0.023) | 0.066 | (0.007) | 0.073 | (0.003) | 0.064 | (0.006) | 0.065 | (0.003) | 0.226 | (0.034) | 0.228 | (0.021) | 0.245 | (0.022) |
| Shading cloth-1 week | 0.581 | (0.038) | 0.518 | (0.013) | 0.473 | (0.044) | 0.634 | (0.059) | 0.072 | (0.008) | 0.072 | (0.005) | 0.076 | (0.004) | 0.069 | (0.004) | 0.230 | (0.026) | |||||
| Shading cloth-3 weeks | 0.580 | (0.071) | 0.529 | (0.017) | 0.553 | (0.033) | 0.542 | (0.039) | 0.081 | (0.002) | 0.090 | (0.006) | 0.088 | (0.002) | 0.083 | (0.005) | |||||||
| Root DW (g) | No shading cloth (control) | 0.185 | (0.030) | 0.203 | (0.030) | 0.149 | (0.015) | 0.147 | (0.015) | 0.022 | (0.003) | 0.020 | (0.004) | 0.021 | (0.003) | 0.019 | (0.004) | 0.095 | (0.006) | 0.104 | (0.005) | 0.106 | (0.006) |
| Shading cloth-1 week | 0.184 | (0.024) | 0.162 | (0.041) | 0.121 | (0.004) | 0.176 | (0.018) | 0.018 | (0.002) | 0.023 | (0.002) | 0.020 | (0.001) | 0.020 | (0.002) | 0.107 | (0.008) | |||||
| Shading cloth-3 weeks | 0.135 | (0.020) | 0.156 | (0.024) | 0.173 | (0.012) | 0.176 | (0.009) | 0.020 | (0.003) | 0.029 | (0.004) | 0.022 | (0.003) | 0.017 | (0.002) | |||||||
| Shoot: root | No shading cloth (control) | 3.20 | (0.65) | 2.95 | (0.32) | 3.76 | (0.31) | 3.51 | (0.41) | 3.13 | (0.43) | 4.03 | (0.57) | 3.14 | (0.16) | 4.03 | (0.69) | 2.44 | (0.11) | 2.22 | (0.08) | 2.35 | (0.07) |
| Shading cloth-1 week | 3.35 | (0.42) | 3.87 | (0.80) | 3.87 | (0.20) | 3.72 | (0.36) | 4.14 | (0.51) | 3.32 | (0.48) | 3.79 | (0.30) | 3.50 | (0.17) | 2.26 | (0.13) | |||||
| Shading cloth-3 weeks | 4.39 | (0.18) | 3.58 | (0.39) | 3.23 | (0.22) | 3.06 | (0.26) | 4.28 | (0.42) | 3.27 | (0.25) | 4.10 | (0.41) | 4.99 | (0.48) | |||||||
| Sample mean (SE), 12 weeks after transplanting, n = 5 | Sample mean (SE), 6 weeks after transplanting, n = 5 | Sample mean (SE), 14 weeks after transplanting, n = 15 | |||||||||||||||||||||
References
- Mattsson, A.; Radoglou, K.; Kostopoulou, P.; Bellarosa, R.; Simeone, M.C.; Schirone, B. Use of innovative technology for the production of high-quality forest regeneration materials. Scand. J. For. Res. 2010, 25, 3–9. [Google Scholar] [CrossRef]
- Astolfi, S.; Marianello, C.; Grego, S.; Bellarosa, R. Preliminary investigation of LED lighting as growth light for seedlings from different tree species in growth chambers. Not. Bot. Hort. Agrobot. Cluj-Napoca 2012, 40, 31–38. [Google Scholar] [CrossRef]
- Landis, T.D.; Pinto, J.R.; Dumroese, R.K. Light emitting diodes (LED): Applications in forest and native plant nurseries. For. Nurs. Notes 2013, 33, 5–13. [Google Scholar]
- Apostol, K.G.; Dumroese, R.K.; Pinto, J.R.; Davis, A.S. Light-emitting diode lighting for forest nursery seedling production. In Proceedings of the 2014 Annual Meeting of the International Plant Propagators Society, Hickory, NC, USA, 27 October 2014; pp. 335–339. [Google Scholar]
- Riikonen, J.; Kettunen, N.; Gritsevich, M.; Hakala, T.; Särkkä, L.; Tahvonen, R. Growth and development of Norway spruce and Scots pine seedlings under different light spectra. Environ. Exp. Bot. 2016, 121, 112–120. [Google Scholar] [CrossRef]
- Bantis, F.; Radoglou, K. Morphology, development, and transplant potential of Prunus avium and Cornus sanguinea seedlings growing under different LED lights. Turk. J. Biol. 2017, 41, 314–321. [Google Scholar] [CrossRef]
- Massa, G.D.; Kim, H.-H.; Wheeler, R.M.; Mitchell, C.A. Plant productivity in response to LED lighting. HortScience 2008, 43, 1951–1956. [Google Scholar] [CrossRef]
- Morrow, R.C. LED lighting in horticulture. HortScience 2008, 43, 1947–1950. [Google Scholar] [CrossRef]
- Craver, J.K.; Lopez, R.G. Control of morphology by manipulating light quality and daily light integral using LEDs. In LED Lighting for Urban Agriculture; Springer: Berlin/Heidelberg, Germany, 2016; pp. 203–217. [Google Scholar]
- Pattison, P.M.; Tsao, J.Y.; Brainard, G.C.; Bugbee, B. LEDs for photons, physiology and food. Nature 2018, 563, 493–500. [Google Scholar] [CrossRef]
- Mitchell, C.A.; Dzakovich, M.P.; Gomez, C.; Lopez, R.; Burr, J.F.; Hernández, R.; Kubota, C.; Currey, C.J.; Meng, Q.; Runkle, E.S.; et al. Light-emitting diodes in horticulture. Hortic. Rev. 2015, 43, 1–88. [Google Scholar]
- Hernández, R.; Kubota, C. Physiological responses of cucumber seedlings under different blue and red photon flux ratios using LEDs. Environ. Exp. Bot. 2016, 121, 66–74. [Google Scholar] [CrossRef]
- Bantis, F.; Smirnakou, S.; Ouzounis, T.; Koukounaras, A.; Ntagkas, N.; Radoglou, K. Current status and recent achievements in the field of horticulture with the use of light-emitting diodes (LEDs). Sci. Hortic. 2018, 235, 437–451. [Google Scholar] [CrossRef]
- Riikonen, J.; Luoranen, J. Use of short-day treatment in the production of Norway spruce mini-plug seedlings under plant factory conditions. Scand. J. For. Res. 2018, 33, 625–632. [Google Scholar] [CrossRef]
- Wallin, E.; Gräns, D.; Stattin, E.; Verhoef, N.; Mikusiński, G.; Lindström, A. Evaluating methods for storability assessment and determination of vitality status of container grown Norway spruce transplants after frozen storage. Scand. J. For. Res. 2019, 34, 417–426. [Google Scholar] [CrossRef]
- Hernandez Velasco, M. Treatments for induction of cold hardiness in Picea abies (L.) Karst. and Pinus sylvestris L. seedlings pre-cultivated under light-emitting diodes—Impact of photoperiod and temperature including energy consumption and seedling quality after cold storage. Scand. J. For. Res. 2020, 1–13. [Google Scholar] [CrossRef]
- Lindström, A.; Hellqvist, C.; Stattin, E. Mini seedlings: A new forest regeneration system. In Proceedings of the Thin Green Line: A Symposium on the State-of-the-Art in Reforestation, Thunder Bay, ON, Canada, 26–28 July 2005; Colombo, S.J., Ed.; Ontario Forest Research Institute: Thunder Bay, ON, Canada, 2005; pp. 59–61. [Google Scholar]
- Landis, T.D. Miniplug transplants: Producing large plants quickly. In National Proceedings: Forest and Conservation Nursery Associations-2006; Proceedings RMRS-P-50; Riley, L.E., Dumroese, R.K., Landis, T.D., Eds.; US Department of Agriculture, Forest Service, Rocky Mountain Research Station: Fort Collins, CO, USA, 2007; Volume 50, pp. 46–53. [Google Scholar]
- Landis, T.D.; Dumroese, R.K.; Haase, D.L. Chapter 6: Outplanting. In Seedling Processing, Storage, and Outplanting—The Container Tree Nursery Manual; USDA Forest Service: Washington, DC, USA, 2010; Volume 7, pp. 154–194. [Google Scholar]
- Helenius, P.; Luoranen, J.; Rikala, R. Effect of Thawing Duration and Temperature on Field Performance of Frozen-Stored Norway Spruce Container Seedlings; Finnish Society of Forest Science: Helsinki, Finland, 2004; p. 38. [Google Scholar]
- Luoranen, J.; Pikkarainen, L.; Poteri, M.; Peltola, H.; Riikonen, J. Duration limits on field storage in closed cardboard boxes before planting of Norway spruce and Scots pine container seedlings in different planting seasons. Forests 2019, 10, 1126. [Google Scholar] [CrossRef]
- Riikonen, J. Pre-cultivation of Scots pine and Norway spruce transplant seedlings under four different light spectra did not affect their field performance. New For. 2016, 47, 607–619. [Google Scholar] [CrossRef]
- Smirnakou, S.; Ouzounis, T.; Radoglou, K. Effects of continuous spectrum LEDs used in indoor cultivation of two coniferous species Pinus sylvestris L. and Abies borisii-regis Mattf. Scand. J. For. Res. 2017, 32, 115–122. [Google Scholar] [CrossRef]
- Hernandez Velasco, M.; Mattsson, A. Light quality and intensity of light-emitting diodes during pre-cultivation of Picea abies (L.) Karst. and Pinus sylvestris L. seedlings—Impact on growth performance, seedling quality and energy consumption. Scand. J. For. Res. 2019, 34, 159–177. [Google Scholar] [CrossRef]
- McCree, K.J. The action spectrum, absorptance and quantum yield of photosynthesis in crop plants. Agric. Meteorol. 1971, 9, 191–216. [Google Scholar] [CrossRef]
- Bugbee, B. Effects of Radiation Quality, Intensity, and Duration on Photosynthesis and Growth; Plants, Soils, and Biometeorology Department Utah State University: Logan, UT, USA, 1994; p. 12. [Google Scholar]
- Robakowski, P. Species-specific acclimation to strong shade modifies susceptibility of conifers to photoinhibition. Acta Physiol. Plant 2005, 27, 255–263. [Google Scholar] [CrossRef]
- Close, D.C.; Beadle, C.L.; Brown, P.H. The physiological basis of containerised tree seedling ‘transplant shock’: A review. Aust. For. 2005, 68, 112–120. [Google Scholar] [CrossRef]
- Helenius, P.; Luoranen, J.; Rikala, R.; Leinonen, K. Effect of drought on growth and mortality of actively growing Norway spruce container seedlings planted in summer. Scand. J. For. Res. 2002, 17, 218–224. [Google Scholar] [CrossRef]
- Morales, F.; Abadía, A.; AbadÞa, J. Photoinhibition and photoprotection under nutrient deficiencies, drought and salinity. In Photoprotection, Photoinhibition, Gene Regulation, and Environment; Demmig-Adams, B., Iii, W.W.A., Mattoo, A.K., Eds.; Advances in Photosynthesis and Respiration; Springer: Dordrecht, The Netherlands, 2006; pp. 65–85. ISBN 978-1-4020-3564-7. [Google Scholar]
- Long, S.P.; Humphries, S.; Falkowski, P.G. Photoinhibition of photosynthesis in nature. Annu. Rev. Plant Physiol. Plant Mol. Biol. 1994, 45, 633–662. [Google Scholar] [CrossRef]
- Demmig-Adams, B.; Adams, W.W. Photoprotection and other responses of plants to high light stress. Annu. Rev. Plant Physiol. Plant Mol. Biol. 1992, 43, 599–626. [Google Scholar] [CrossRef]
- Gilmore, A.M.; Govindjee. How higher plants respond to excess light: Energy dissipation in Photosystem II. In Concepts in Photobiology: Photosynthesis and Photomorphogenesis; Singhal, G.S., Renger, G., Sopory, S.K., Irrgang, K.-D., Govindjee, Eds.; Springer: Dordrecht, The Netherlands, 1999; pp. 513–548. ISBN 978-94-011-4832-0. [Google Scholar]
- Krause, G.H.; Virgo, A.; Winter, K. High susceptibility to photoinhibition of young leaves of tropical forest trees. Planta 1995, 197, 583–591. [Google Scholar] [CrossRef]
- Bertamini, M.; Nedunchezhian, N. Photoinhibition of photosynthesis in mature and young leaves of grapevine (Vitis vinifera L.). Plant Sci. 2003, 164, 635–644. [Google Scholar] [CrossRef]
- Brooks, J.R.; Hinckley, T.M.; Sprugel, D.G. Acclimation responses of mature Abies amabilis sun foliage to shading. Oecologia 1994, 100, 316–324. [Google Scholar] [CrossRef] [PubMed]
- McDonald, M.S. Photosynthesis—Physiological and environmental factors. In Photobiology of Higher Plants; John Wiley & Sons: Hoboken, NJ, USA, 2003; pp. 113–147. ISBN 978-0-470-85523-2. [Google Scholar]
- Carter, G.A.; Smith, W.K. Influence of shoot structure on light interception and photosynthesis in conifers. Plant Physiol. 1985, 79, 1038–1043. [Google Scholar] [CrossRef]
- Sprugel, D.G.; Brooks, J.R.; Hinckley, T.M. Effects of light on shoot geometry and needle morphology in Abies amabilis. Tree Physiol. 1996, 16, 91–98. [Google Scholar] [CrossRef]
- Stenberg, P.; Palmroth, S.; Bond, B.J.; Sprugel, D.G.; Smolander, H. Shoot structure and photosynthetic efficiency along the light gradient in a Scots pine canopy. Tree Physiol. 2001, 21, 805–814. [Google Scholar] [CrossRef]
- Pallardy, S.G. Physiology of Woody Plants; Academic Press: Cambridge, MA, USA, 2010; ISBN 0-08-056871-8. [Google Scholar]
- Edmond, J.B.; Edmond, J.B.; Senn, T.L.; Andrews, F.S. Fundamental of Horticulture, 4th ed.; McGraw-Hill Book Company: New York, NY, USA, 1978. [Google Scholar]
- Stenberg, P.; Kangas, T.; Smolander, H.; Linder, S. Shoot structure, canopy openness, and light interception in Norway spruce. Plant Cell Environ. 1999, 22, 1133–1142. [Google Scholar] [CrossRef]
- Leverenz, J.W.; Hinckley, T.M. Shoot structure, leaf area index and productivity of evergreen conifer stands. Tree Physiol. 1990, 6, 135–149. [Google Scholar] [CrossRef] [PubMed]
- Robinson, S.; Watling, J.; Bittisnich, D.; Fukai, S.; Beadle, C.; Clearwater, M.; Kriedemann, P. Sunlight and plant production. In Plants in Action: Adaptation in Nature, Performance in Cultivation; Greer, D.H., Ed.; Macmillan Education AU: New York, NY, USA, 2018; ISBN 978-0-7329-4439-1. [Google Scholar]
- McDonald, M.S. Light and pigments. In Photobiology of Higher Plants; John Wiley & Sons: Hoboken, NJ, USA, 2003; pp. 1–31. ISBN 978-0-470-85523-2. [Google Scholar]
- Aphalo, P.J.; Albert, A.; Björn, L.O.; McLeod, A.R.; Robson, T.M.; Rosenqvist, E. Beyond the Visible: A Handbook of Best Practice in Plant UV Photobiology; Helsingin Yliopisto: Helsinki, Finland, 2012. [Google Scholar]
- Das, K.; Roychoudhury, A. Reactive oxygen species (ROS) and response of antioxidants as ROS-scavengers during environmental stress in plants. Front. Environ. Sci. 2014, 2, 53. [Google Scholar] [CrossRef]
- Tevini, M. UV-effects on plants. In Concepts in Photobiology: Photosynthesis and Photomorphogenesis; Singhal, G.S., Renger, G., Sopory, S.K., Irrgang, K.-D., Govindjee, Eds.; Springer Netherlands: Dordrecht, The Netherlands, 1999; pp. 588–613. ISBN 978-94-011-4832-0. [Google Scholar]
- Turunen, M.; Heller, W.; Stich, S.; Sandermann, H.; Sutinen, M.-L.; Norokorpi, Y. The effects of UV exclusion on the soluble phenolics of young Scots pine seedlings in the subarctic. Environ. Pollut. 1999, 106, 219–228. [Google Scholar] [CrossRef]
- Martz, F.; Sutinen, M.-L.; Derome, K.; Wingsle, G.; Julkunen-Tiitto, R.; Turunen, M. Effects of ultraviolet (UV) exclusion on the seasonal concentration of photosynthetic and UV-screening pigments in Scots pine needles. Glob. Chang. Biol. 2007, 13, 252–265. [Google Scholar] [CrossRef]
- Laakso, K.; Huttunen, S. Effects of the ultraviolet-B radiation (UV-B) on conifers: A review. Environ. Pollut. 1998, 99, 319–328. [Google Scholar] [CrossRef]
- Aikala, L.; Kivimaki, I. Method and Means for Acclimatizing Seedlings for Outdoor Life. U.S. Patent 13/520,805, 13 August 2015. [Google Scholar]
- Kotilainen, T.; Tegelberg, R.; Julkunen-Tiitto, R.; Lindfors, A.; Aphalo, P.J. Metabolite specific effects of solar UV-A and UV-B on alder and birch leaf phenolics. Glob. Chang. Biol. 2008, 14, 1294–1304. [Google Scholar] [CrossRef]
- Ohlsson, A.B.; Segerfeldt, P.; Lindström, A.; Borg-Karlson, A.-K.; Berglund, T. UV-B exposure of indoor-grown Picea abies seedlings causes an epigenetic effect and selective emission of terpenes. Z. Nat. C 2014, 68, 139–147. [Google Scholar]
- Turunen, M.T.; Vogelmann, T.C.; Smith, W.K. UV screening in lodgepole pine (Pinus contorta ssp. latifolia) cotyledons and needles. Int. J. Plant Sci. 1999, 160, 315–320. [Google Scholar] [CrossRef]
- Close, D.C.; Beadle, C.L.; Holz, G.K.; Brown, P.H. Effect of shadecloth tree shelters on cold-induced photoinhibition, foliar anthocyanin and growth of Eucalyptus globulus and E. nitens seedlings during establishment. Aust. J. Bot. 2002, 50, 15–20. [Google Scholar] [CrossRef]
- Kotilainen, T.; Robson, T.M.; Hernández, R. Light quality characterization under climate screens and shade nets for controlled-environment agriculture. PLoS ONE 2018, 13, e0199628. [Google Scholar] [CrossRef] [PubMed]
- Faust, J.E.; Logan, J. Daily light integral: A research review and high-resolution maps of the United States. HortScience 2018, 53, 1250–1257. [Google Scholar] [CrossRef]
- Faust, J.E. Light. In Ball RedBook: Crop production; Hamrick, D., Ed.; Ball Publishing: Batavia, Indonesia, 2003; Volume 2, pp. 71–84. ISBN 978-1-883052-35-5. [Google Scholar]
- Torres, A.P.; Lopez, R.G. Measuring Daily Light Integral in a Greenhouse; Purdue University Extension; Purdue Department of Horticulture and Landscape Architecture: West Lafayette, IN, USA, 2010; p. 7. [Google Scholar]
- Hoque, E.; Remus, G. Natural UV-screening mechanisms of Norway spruce (Picea abies [L.] Karst.) needles. Photochem. Photobiol. 1999, 69, 177–192. [Google Scholar] [PubMed]
- ISO. ISO 21348:2007—Space Environment (Natural and Artificial)—Process for Determining Solar Irradiances; International Organization for Standardization: Geneva, Switzerland, 2007; p. 12. [Google Scholar]
- Sellaro, R.; Crepy, M.; Trupkin, S.A.; Karayekov, E.; Buchovsky, A.S.; Rossi, C.; Casal, J.J. Cryptochrome as a sensor of the blue/green ratio of natural radiation in Arabidopsis. Plant Physiol. 2010, 154, 401–409. [Google Scholar] [CrossRef] [PubMed]
- Both, A.-J.; Bugbee, B.; Kubota, C.; Lopez, R.G.; Mitchell, C.; Runkle, E.S.; Wallace, C. Proposed product label for electric lamps used in the plant sciences. HortTechnology 2017, 27, 544–549. [Google Scholar] [CrossRef]
- Sager, J.C.; McFarlane, J.C. Radiation. In Plant Growth Chamber Handbook; Langhans, R.W., Tibbitts, T.W., Eds.; Iowa Agriculture and Home Economics Experiment Station Special Report No. 99 (SR-99) and North Central Regional Research Publication No. 340; NC-101 Regional Committee on Controlled Environment Technology and Use: Raleigh, NC, USA, 1997; Volume 99, pp. 1–29. [Google Scholar]
- Augusti 2014—Extremt Regnig I Västra GÖTALAND|SMHI. Available online: https://www.smhi.se/klimat/klimatet-da-och-nu/manadens-vader-och-vatten-sverige/manadens-vader-i-sverige/augusti-2014-extremt-regnig-i-vastra-gotaland-1.76746 (accessed on 16 January 2020).
- Swedish Meteorological and Hydrological Institute SMHI Öppna Data|Meteorologiska Observationer. Available online: http://opendata-download-metobs.smhi.se/explore/ (accessed on 4 September 2017).
- Landelius, T.; Josefsson, W.; Persson, T. STRÅNG—A System for Modelling Solar Radiation Parameters with Mesoscale Spatial Resolution; RMK; Swedish Meteorological and Hydrological Institute SMHI: Nordköping, Sweden, 2001; p. 52.
- Mattsson, A. Predicting field performance using seedling quality assessment. New For. 1997, 13, 227–252. [Google Scholar] [CrossRef]
- Haase, D.L. Understanding forest seedling quality: Measurements and interpretation. Tree Plant. Notes 2008, 52, 24–30. [Google Scholar]
- Mohammed, G.H.; Binder, W.D.; Gillies, S.L. Chlorophyll fluorescence: A review of its practical forestry applications and instrumentation. Scand. J. For. Res. 1995, 10, 383–410. [Google Scholar] [CrossRef]
- Huner, N.P.A.; Ivanov, A.G.; Sane, P.V.; Pocock, T.; Król, M.; Balseris, A.; Rosso, D.; Savitch, L.V.; Hurry, V.M.; Öquist, G. Photoprotection of Photosystem II: Reaction center quenching versus antenna quenching. In Photoprotection, Photoinhibition, Gene Regulation, and Environment; Demmig-Adams, B., Iii, W.W.A., Mattoo, A.K., Eds.; Advances in Photosynthesis and Respiration; Springer Netherlands: Dordrecht, The Netherlands, 2006; pp. 155–173. ISBN 978-1-4020-3564-7. [Google Scholar]
- L’Hirondelle, S.J.; Simpson, D.G.; Binder, W.D. Chlorophyll fluorescence, root growth potential, and stomatal conductance as estimates of field performance potential in conifer seedlings. New For. 2007, 34, 235–251. [Google Scholar] [CrossRef]
- Murchie, E.H.; Lawson, T. Chlorophyll fluorescence analysis: A guide to good practice and understanding some new applications. J. Exp. Bot. 2013, 64, 3983–3998. [Google Scholar] [CrossRef]
- Genty, B.; Briantais, J.-M.; Baker, N.R. The relationship between the quantum yield of photosynthetic electron transport and quenching of chlorophyll fluorescence. Biochim. Biophys. Acta-Gen. Subj. 1989, 990, 87–92. [Google Scholar] [CrossRef]
- Dang, Q.L. Improving the quality and reliability of gas exchange measurements. J. Plant Physiol. Pathol. 2013, 2, 2. [Google Scholar]
- Mitchell, K.A.; Bolstad, P.V.; Vose, J.M. Interspecific and environmentally induced variation in foliar dark respiration among eighteen southeastern deciduous tree species. Tree Physiol. 1999, 19, 861–870. [Google Scholar] [CrossRef] [PubMed]
- Walters, M.B.; Kruger, E.L.; Reich, P.B. Growth, biomass distribution and CO2 exchange of northern hardwood seedlings in high and low light: Relationships with successional status and shade tolerance. Oecologia 1993, 94, 7–16. [Google Scholar] [CrossRef] [PubMed]
- Reich, P.B.; Tjoelker, M.G.; Walters, M.B.; Vanderklein, D.W.; Buschena, C. Close association of RGR, leaf and root morphology, seed mass and shade tolerance in seedlings of nine boreal tree species grown in high and low light. Funct. Ecol. 1998, 12, 327–338. [Google Scholar] [CrossRef]
- R Core Team. R: A Language and Environment for Statistical Computing; R Foundation for Statistical Computing: Vienna, Austria, 2019. [Google Scholar]
- Wickham, H. Ggplot2: Elegant Graphics for Data Analysis; Springer: New York, NY, USA, 2009; ISBN 978-0-387-98140-6. [Google Scholar]
- Vaux, D.L.; Fidler, F.; Cumming, G. Replicates and repeats—What is the difference and is it significant? A brief discussion of statistics and experimental design. EMBO Rep. 2012, 13, 291–296. [Google Scholar] [CrossRef]
- Phillips, N.D. YaRrr! The Pirate’s Guide to R. APS Observer. 2017. Available online: https://www.psychologicalscience.org/observer/yarrr-the-pirates-guide-to-r (accessed on 1 February 2020).
- Aphalo, P.J. The r4photobiology suite: Spectral irradiance. UV4Plants Bull. 2015, 2015, 21–29. [Google Scholar]
- Aphalo, P.J. Using R for Photobiological Calculations. 2015. Available online: https://www.researchgate.net/publication/281627610_Using_R_for_photobiological_calculations (accessed on 1 February 2020).
- Mangiafico, S.S. Repeated Measures ANOVA. In Summary and Analysis of Extension Program Evaluation in R; Rutgers Cooperative Extension: New Brunswick, NJ, USA, 2016; pp. 653–663. [Google Scholar]
- Schwarz, C.J. Two-factor split-plot designs. In Course Notes for Intermediate Ecological Statistics; Department of Statistics and Actuarial Science, Simon Fraser University: Burnaby, BC, Canada, 2019. [Google Scholar]
- Pinheiro, J.; Bates, D.; DebRoy, S.; Sarkar, D. Nlme: Linear and Nonlinear Mixed Effects Models; R Core Team: Vienna, Austria, 2019. [Google Scholar]
- Maxwell, K.; Johnson, G.N. Chlorophyll fluorescence—A practical guide. J. Exp. Bot. 2000, 51, 659–668. [Google Scholar] [CrossRef]
- Demmig-Adams, B.; Adams, W.W.; Winter, K.; Meyer, A.; Schreiber, U.; Pereira, J.S.; Krüger, A.; Czygan, F.-C.; Lange, O.L. Photochemical efficiency of photosystem II, photon yield of O2 evolution, photosynthetic capacity, and carotenoid composition during the midday depression of net CO2 uptake in Arbutus unedo growing in Portugal. Planta 1989, 177, 377–387. [Google Scholar] [CrossRef]
- Björkman, O.; Demmig, B. Photon yield of O2 evolution and chlorophyll fluorescence characteristics at 77 K among vascular plants of diverse origins. Planta 1987, 170, 489–504. [Google Scholar] [CrossRef]
- Reich, P.B.; Walters, M.B.; Tjoelker, M.G.; Vanderklein, D.; Buschena, C. Photosynthesis and respiration rates depend on leaf and root morphology and nitrogen concentration in nine boreal tree species differing in relative growth rate. Funct. Ecol. 1998, 12, 395–405. [Google Scholar] [CrossRef]
- Chapman, S.R.; Carter, L.P. Crop Production: Principles and Practices; W.H. Freeman & Co Ltd.: San Francisco, CA, USA, 1976; ISBN 978-0-7167-0581-9. [Google Scholar]
- Farquhar, G.D.; von Caemmerer, S.; Berry, J.A. A biochemical model of photosynthetic CO2 assimilation in leaves of C3 species. Planta 1980, 149, 78–90. [Google Scholar] [CrossRef] [PubMed]
- Long, S.P.; Bernacchi, C.J. Gas exchange measurements, what can they tell us about the underlying limitations to photosynthesis? Procedures and sources of error. J. Exp. Bot. 2003, 54, 2393–2401. [Google Scholar] [CrossRef] [PubMed]
- Baker, F.S. Principles of Silviculture; McGraw-Hill Book Company: New York, NY, USA, 1950; p. 414. [Google Scholar]
- Oldeman, R.A.A. Silvatic mosaics. In Forests: Elements of Silvology; Springer: Berlin/Heidelberg, Germany, 1990; pp. 388–558. ISBN 978-3-642-75213-1. [Google Scholar]
- Egbäck, S. Growth of Genetically Improved Stands of Norway Spruce, Scots Pine and Loblolly Pine. Ph.D. Thesis, Swedish University of Agricultural Sciences, Alnarp, Sweden, 2016. [Google Scholar]
- Nelson, J.A.; Bugbee, B. Economic analysis of greenhouse lighting: Light emitting diodes vs. high intensity discharge fixtures. PLoS ONE 2014, 9, e99010. [Google Scholar] [CrossRef] [PubMed]
© 2020 by the authors. Licensee MDPI, Basel, Switzerland. This article is an open access article distributed under the terms and conditions of the Creative Commons Attribution (CC BY) license (http://creativecommons.org/licenses/by/4.0/).