Transcriptomic Analysis Reveals the Mechanism of Picea crassifolia Survival for Alpine Treeline Condition

 , and
, and
Abstract
1. Introduction
2. Materials and Methods
2.1. Site Description
2.2. Sample Collection
2.3. Non-Structural Carbohydrate Analysis
2.4. RNA-Seq Library Construction, Sequencing, and Mapping
2.5. Identifying and Clustering of DEGs
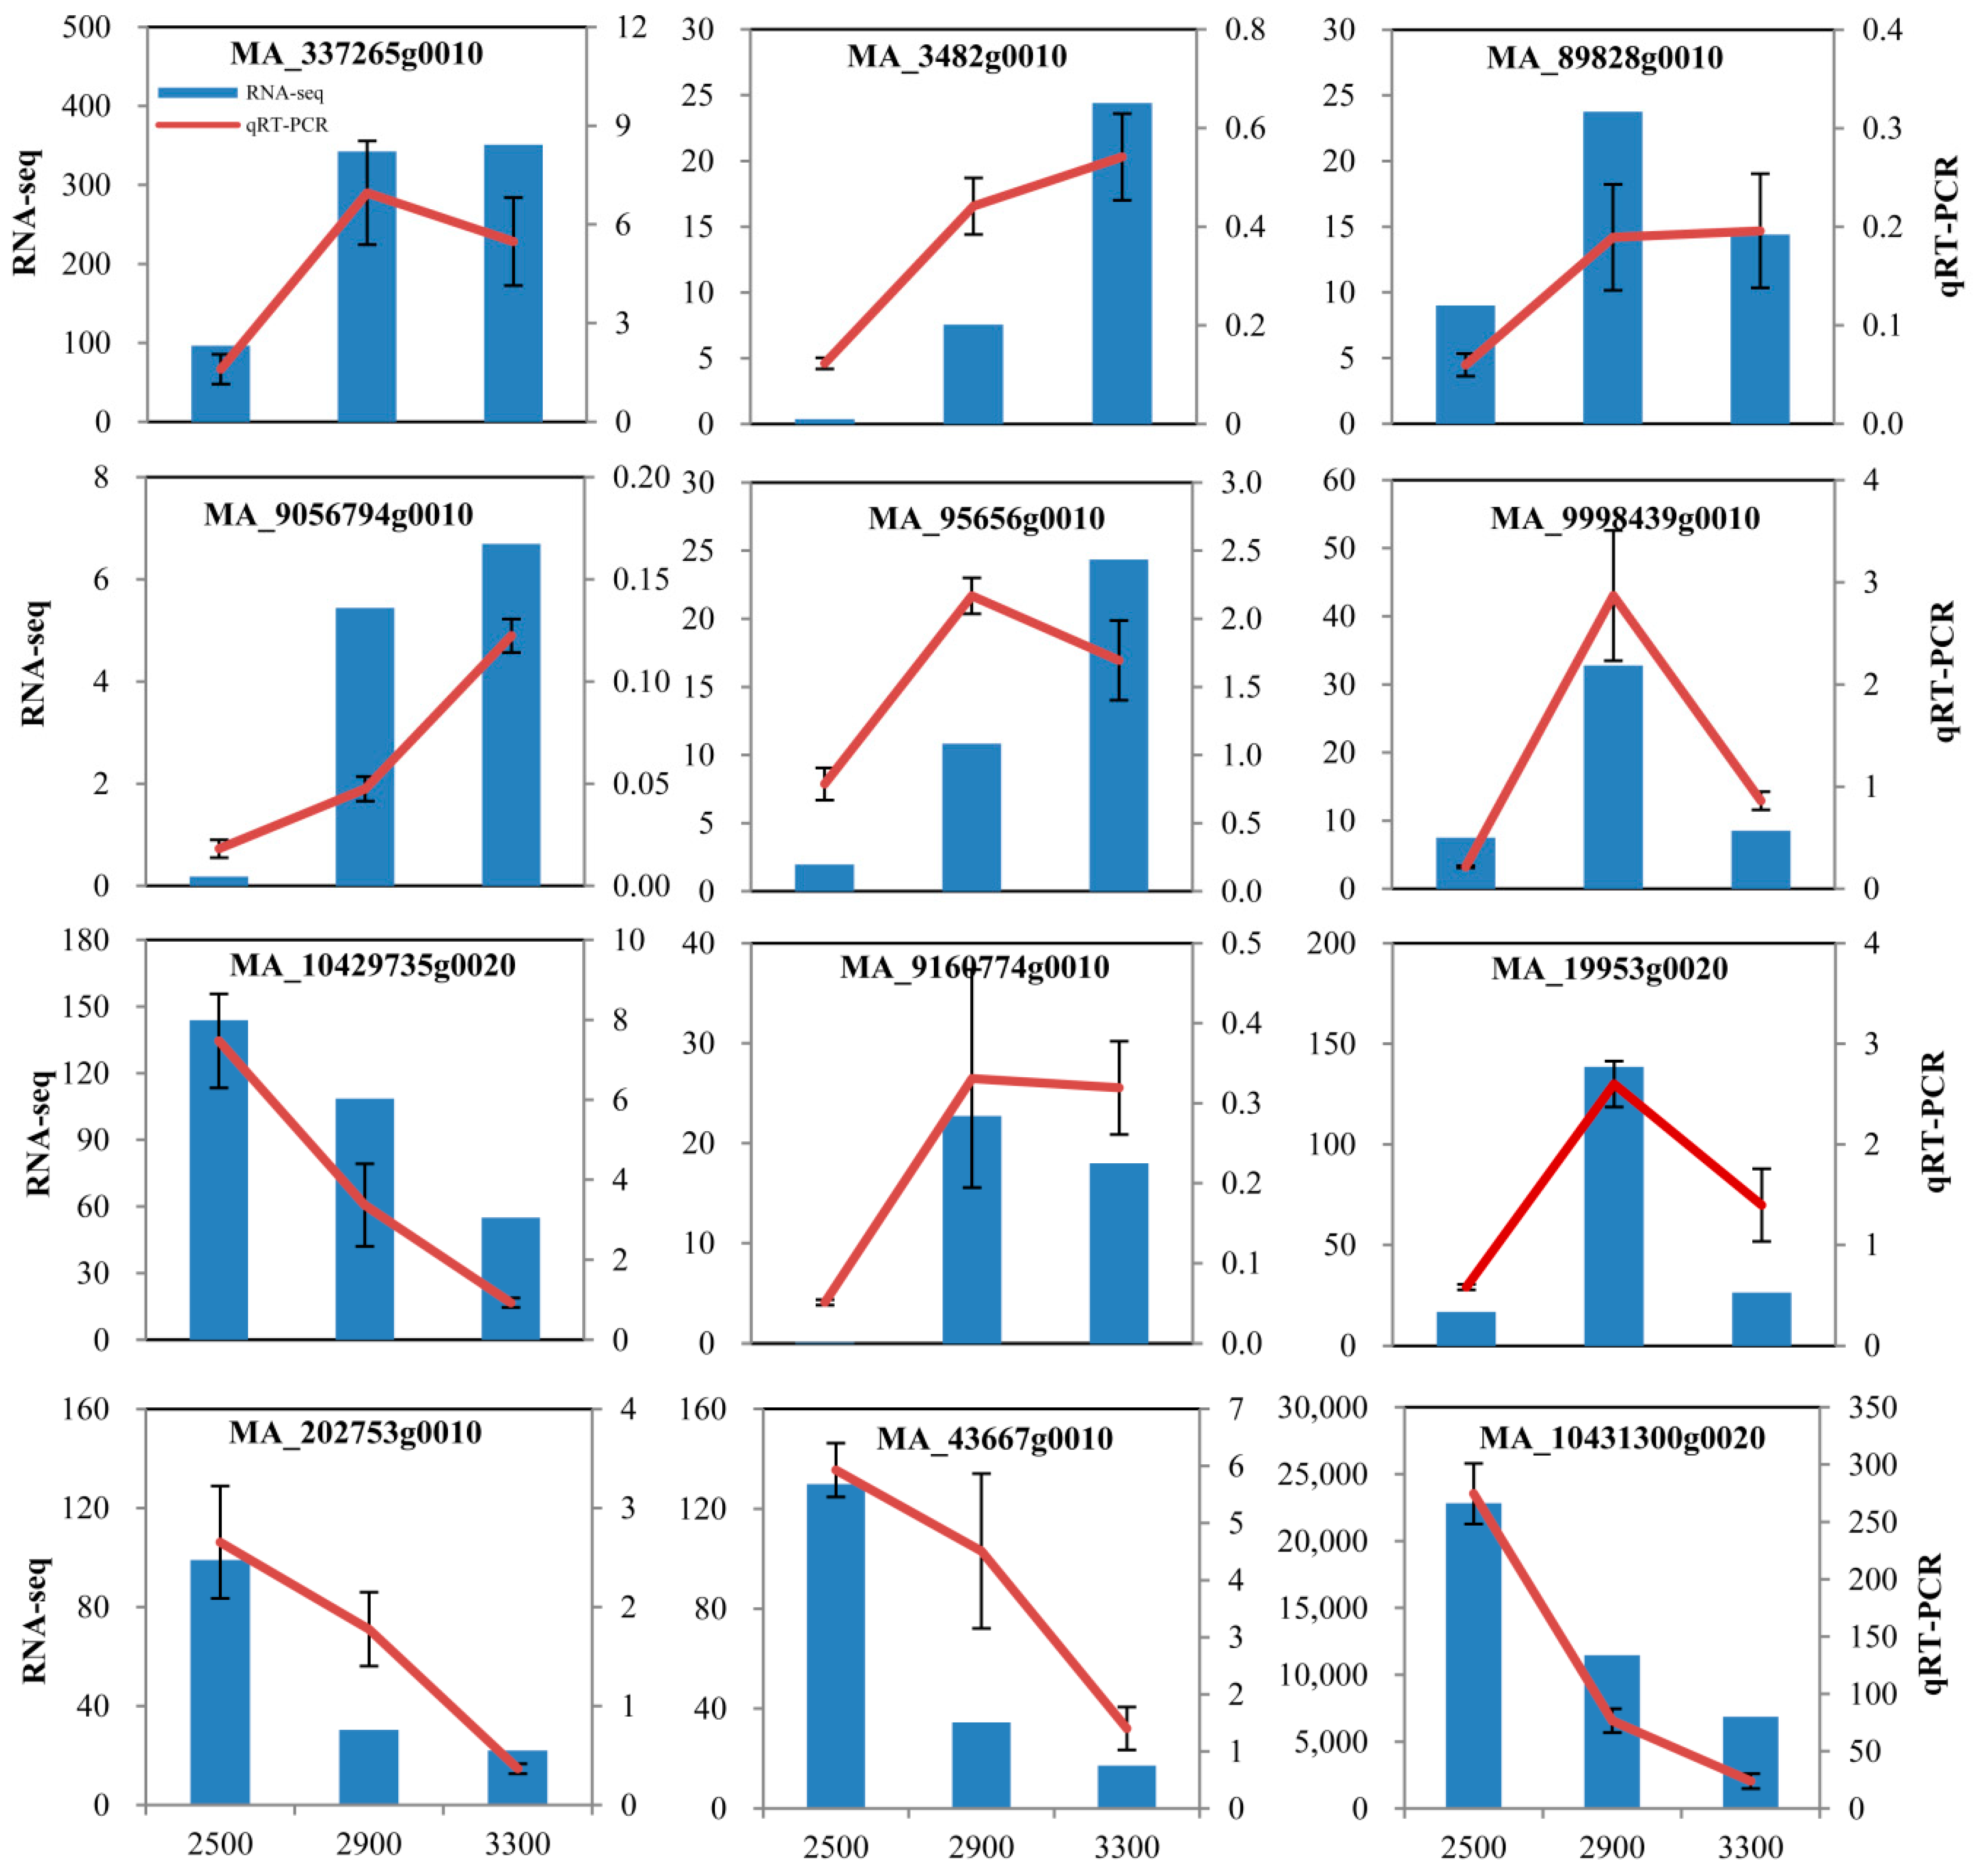
2.6. Quantitative Real-Time PCR (qRT-PCR)
2.7. Statistical Analysis
3. Results
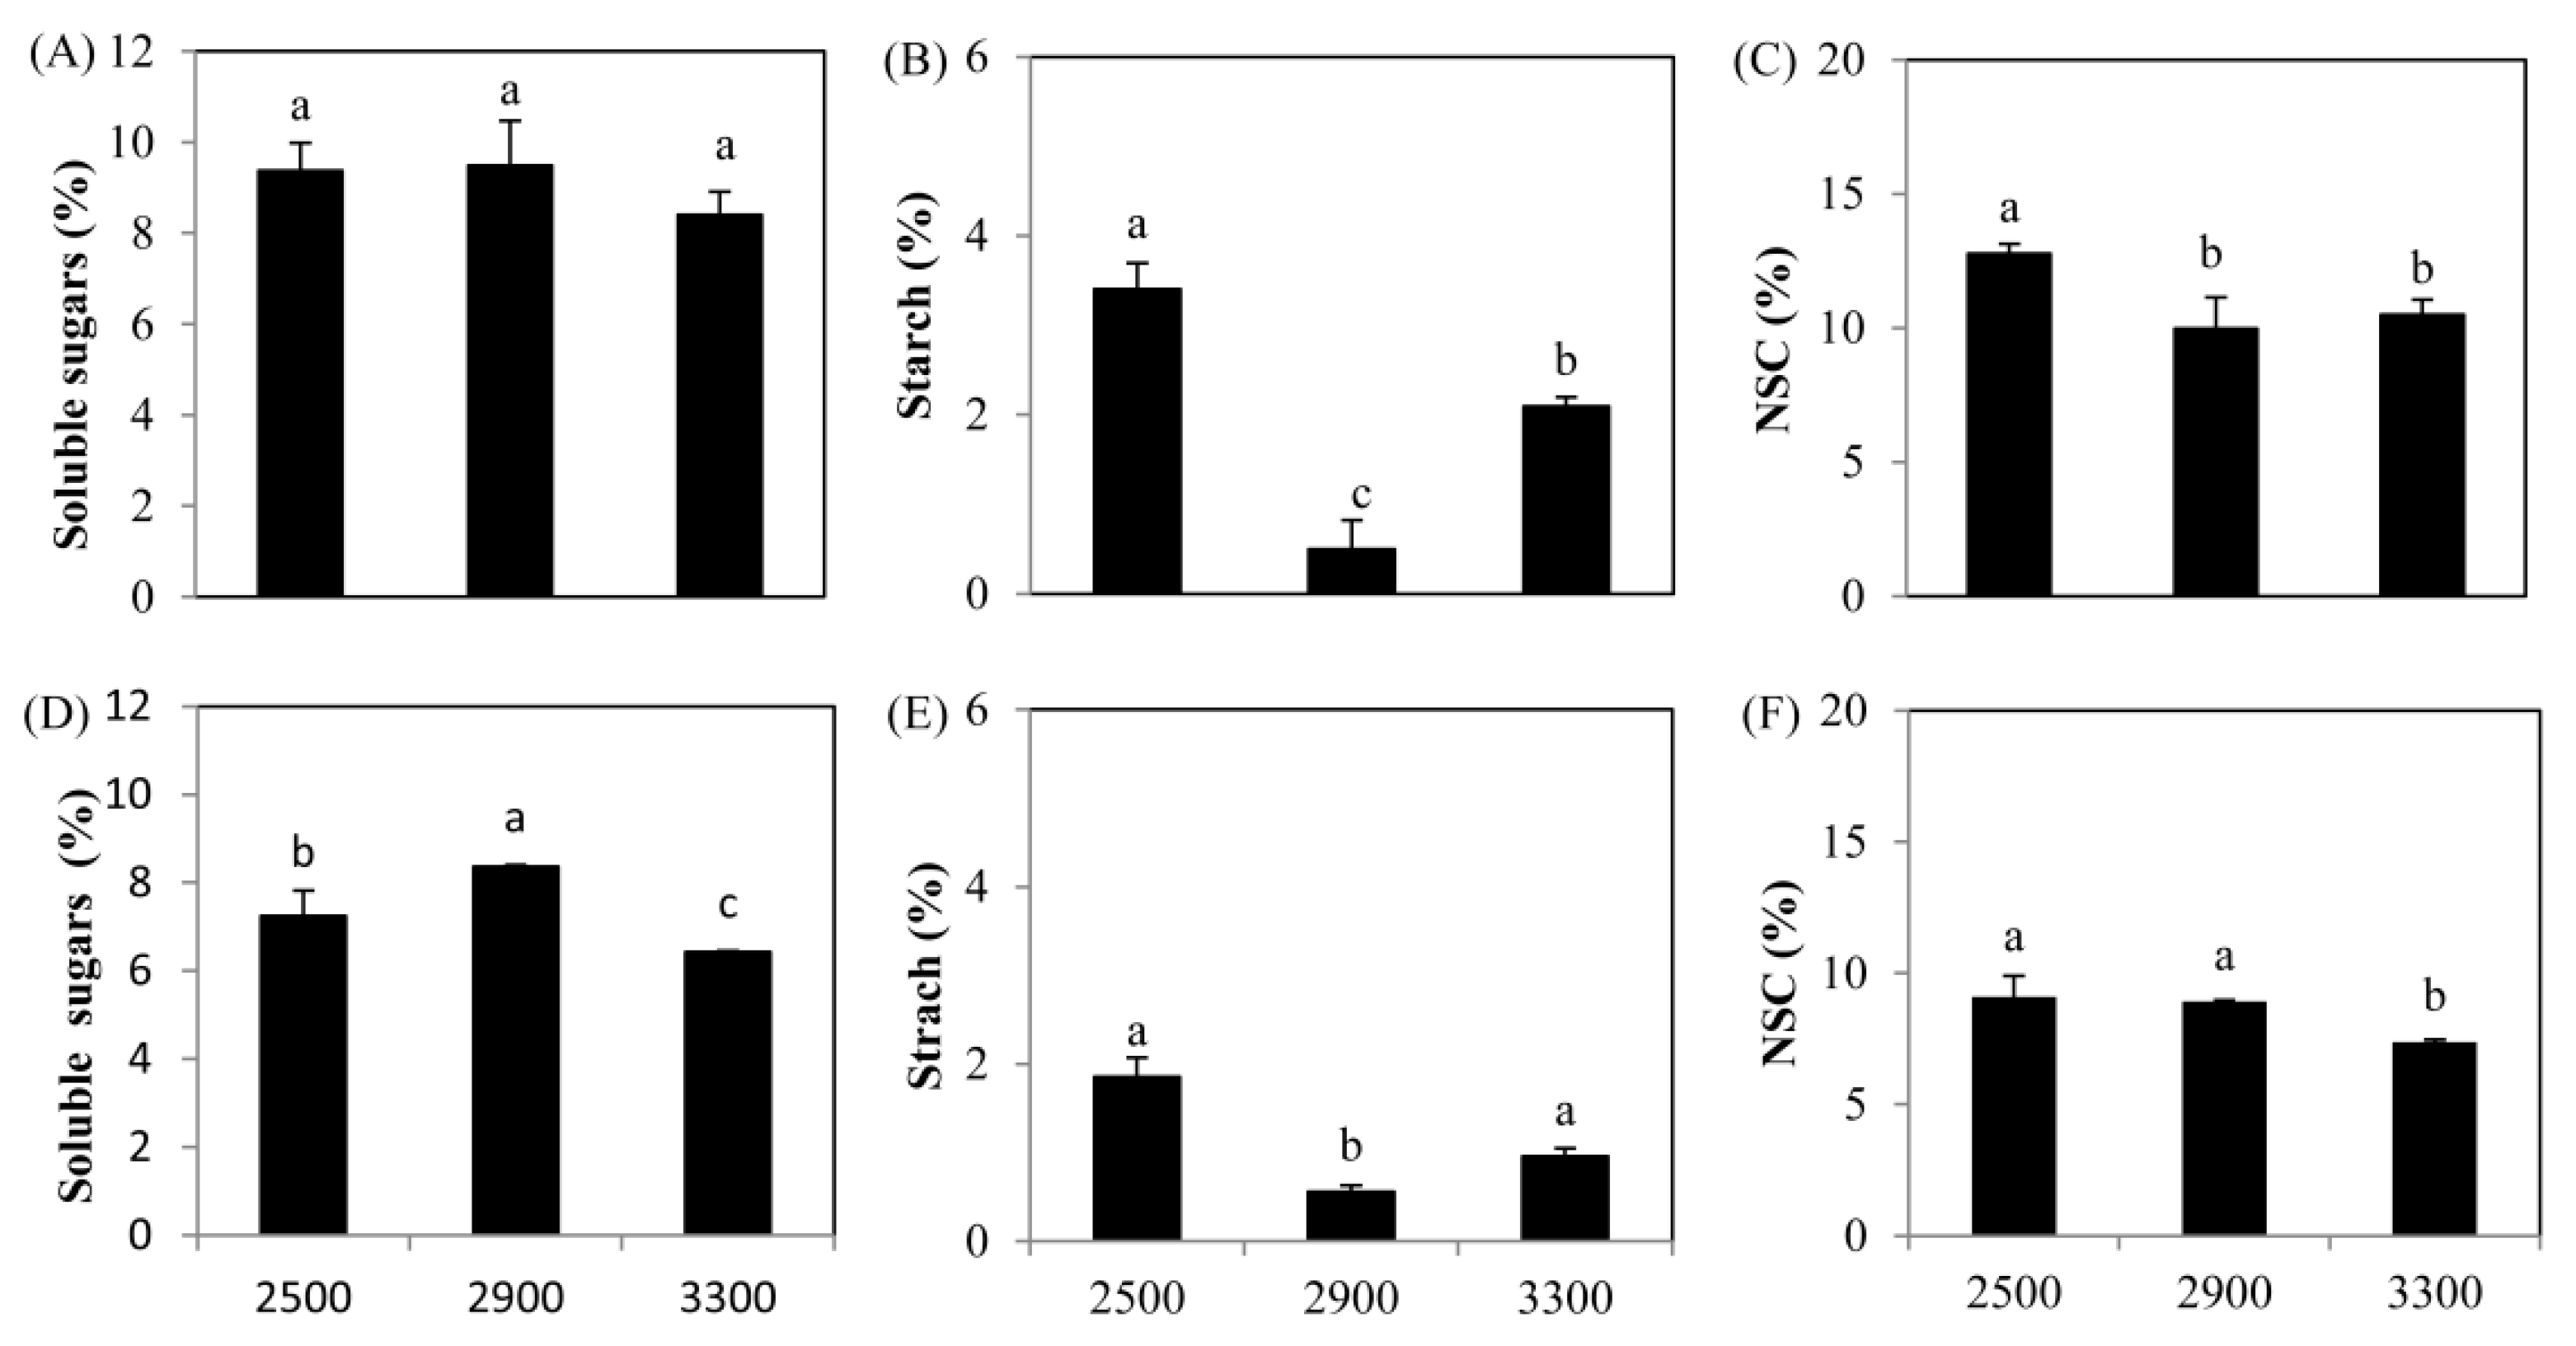
3.1. Changes of NSC and Total N content with Altitudes
3.2. Identification of Differentially Expressed Genes in P. crassifolia at Different Elevations by RNA-Seq
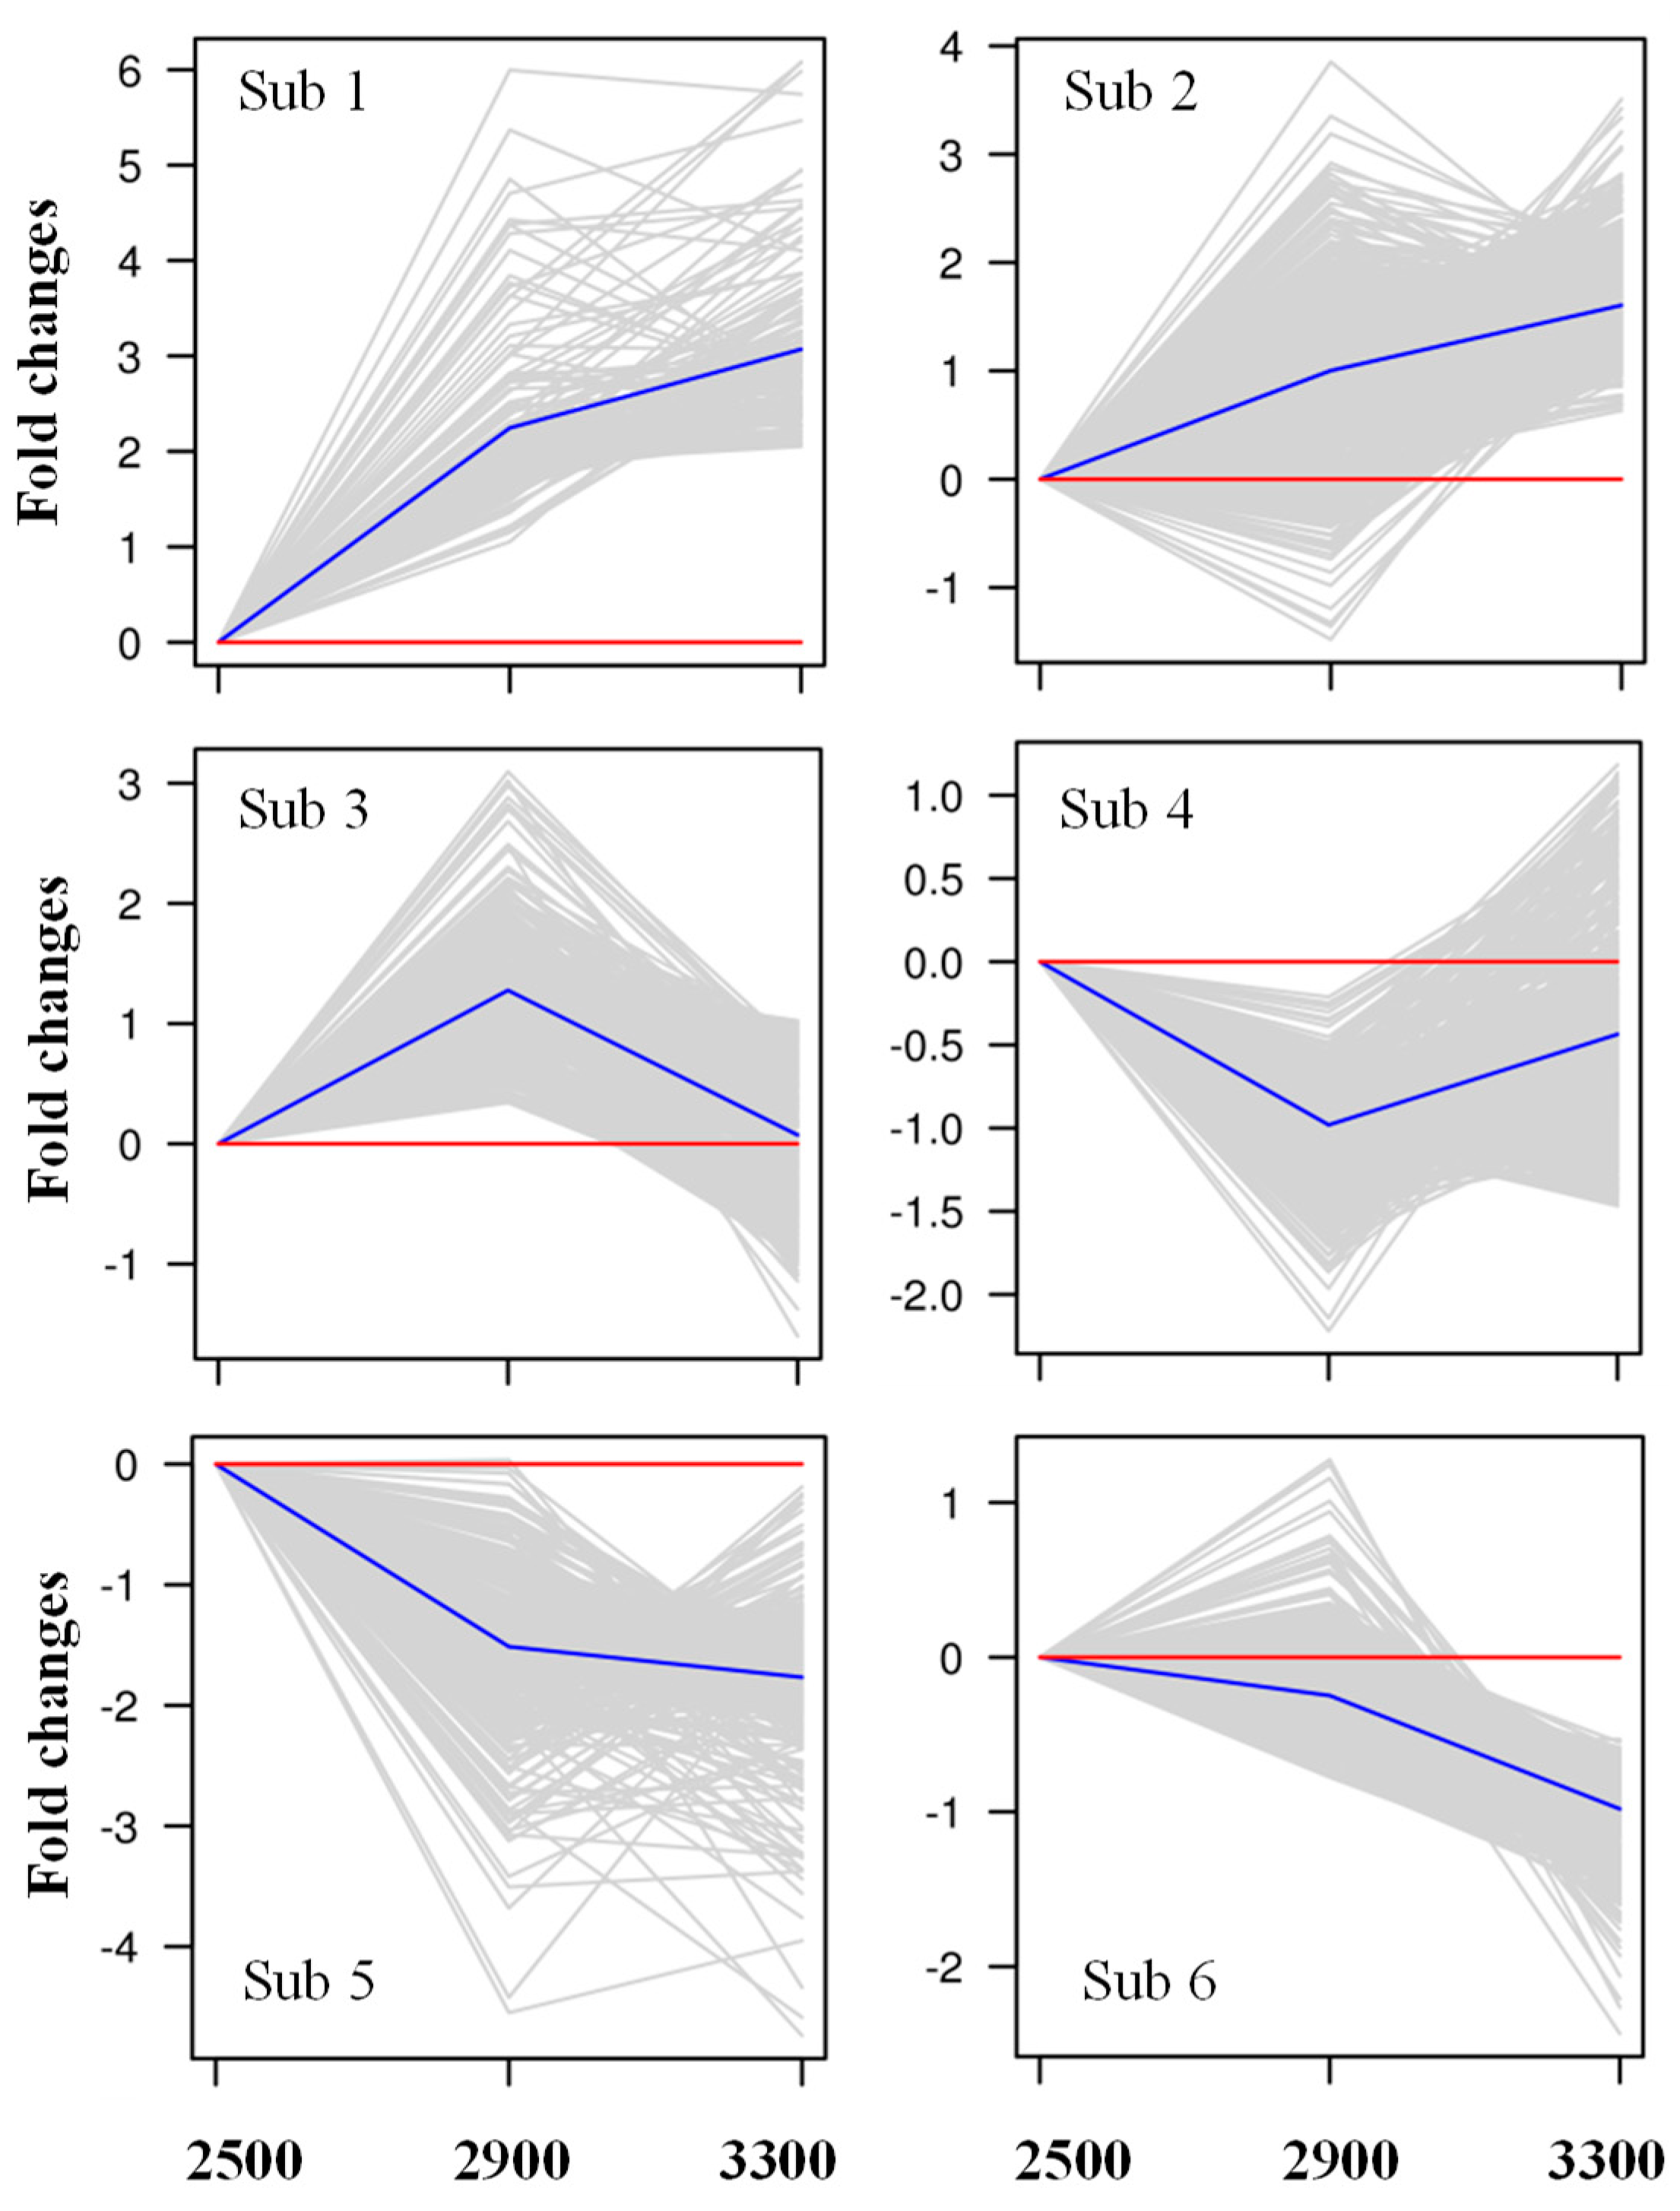
3.3. Analysis of Gene Expression Pattern
3.4. DEGs Involved in Carbon Assimilation and Energy Metabolism
3.5. DEGs Involved in Non-Struct(ural Carbon Metabolism
3.6. DEGs Involved in Nitrogen Metabolism
4. Discussion
4.1. Response of NSC and N to the Increasing Elevations
4.2. Changes of Genes Involved in C Assimilation and Metabolism in P. crassifolia with Increasing Elevations
5. Conclusions
Supplementary Materials
Author Contributions
Funding
Acknowledgments
Conflicts of Interest
Deposited Data
References
- Körner, C. Carbon Limitation in Trees. J. Ecol. 2003, 91, 4–17. [Google Scholar] [CrossRef]
- Harsch, M.A.; Bader, M.Y. Treeline Form—A Potential Key to Understanding Treeline Dynamics. Glob. Ecol. Biogeogr. 2011, 20, 582–596. [Google Scholar] [CrossRef]
- Körner, C.; Paulsen, J. A World-Wide Study of High Altitude Treeline Temperatures. J. Biogeogr. 2004, 31, 713–732. [Google Scholar] [CrossRef]
- Dolezal, J.; Kopecky, M.; Dvorsky, M.; Macek, M.; Rehakova, K.; Capkova, K.; Borovec, J.; Schweingruber, F.; Liancourt, P.; Altman, J. Sink Limitation of Plant Growth Determines Tree Line in the Arid Himalayas. Funct. Ecol. 2019, 33, 553–565. [Google Scholar] [CrossRef]
- Körner, C. A Re-Assessment of High Elevation Treeline Positions and Their Explanation. Oecologia 1998, 115, 445–459. [Google Scholar] [CrossRef] [PubMed]
- Neuner, G. Frost Resistance in Alpine Woody Plants. Front. Plant Sci. 2014, 5, 654–667. [Google Scholar] [CrossRef] [PubMed]
- Gardingen, P.R.; Grace, J.; Jeffree, C.E. Abrasive Damage by Wind to the Needle Surfaces of Picea Sitchensis (Bong.) Carr. And Pinus Sylvestris L. Plant Cell Environ. 1991, 14, 185–193. [Google Scholar] [CrossRef]
- Perkins, T.D.; Adams, G.T. Rapid Freezing Induces Winter Injury Symptomatology in Red Spruce Foliage. Tree Physiol. 1995, 15, 259–266. [Google Scholar] [CrossRef]
- Sigdel, S.R.; Wang, Y.; Camarero, J.J.; Zhu, H.; Liang, E.; Peñuelas, J. Moisture-Mediated Responsiveness of Treeline Shifts to Global Warming in the Himalayas. Glob. Chang. Boil. 2018, 24, 5549–5559. [Google Scholar] [CrossRef]
- Li, M.; Xiao, W.; Shi, P.; Wang, S.; Zhong, Y.-D.; Liu, X.-L.; Wang, X.-D.; Cai, X.-H.; Shi, Z.-M. Nitrogen and Carbon Source-Sink Relationships in Trees at the Himalayan Treelines Compared With Lower Elevations. Plant Cell Environ. 2008, 31, 1377–1387. [Google Scholar] [CrossRef]
- Dang, H.S.; Zhang, K.R.; Zhang, Q.F.; Xu, Y.M.; Leegood, R. Temporal Variations of Mobile Carbohydrates in Abuesfargesii at the Upper Tree Limits. Plant Biol. 2015, 17, 106–113. [Google Scholar] [CrossRef] [PubMed]
- Fajardo, A.; Piper, F.I.; Lohengrin, A.C. Distinguishing Local from Global Climate Influences in the Variation of Carbon Status With Altitude in a Tree Line Species. Glob. Ecol. Biogeogr. 2011, 20, 307–318. [Google Scholar] [CrossRef]
- Hoch, G.; Körner, C. Global Patterns of Mobile Carbon Stores in Trees at the High-Elevation Treeline. Glob. Ecol. Biogeogr. 2012, 21, 861–871. [Google Scholar] [CrossRef]
- Shi, P.; Korner, C.; Hoch, G. A Test of the Growth-Limitation Theory for Alpine Tree Line Formation in Evergreen and Deciduous Taxa of the Eastern Himalayas. Funct. Ecol. 2008, 22, 213–220. [Google Scholar] [CrossRef]
- Fajardo, A.; Piper, F.I. An Assessment of Carbon and Nutrient Limitations in the Formation of the Southern Andes Tree Line. J. Ecol. 2017, 105, 517–527. [Google Scholar] [CrossRef]
- Wang, Q.-W.; Qi, L.; Zhou, W.; Liu, C.-G.; Yu, D.; Dai, L. Carbon Dynamics in the Deciduous Broadleaf Tree Erman’s Birch (Betula Ermanii) at the Subalpine Treeline on Changbai Mountain, Northeast China. Am. J. Bot. 2018, 105, 42–49. [Google Scholar] [CrossRef]
- Ellison, S.B.Z.; Sullivan, P.F.; Cahoon, S.M.P.; Hewitt, R.E. Poor Nutrition As a Potential Cause of Divergent Tree Growth Near the Arctic Treeline in Northern Alaska. Ecology 2019, 100, e02878. [Google Scholar] [CrossRef]
- Wang, Q.-W.; Liu, C.-G.; Zhou, W.; Qi, L.; Zhou, L.; Yu, D.; Dai, L. Mobile Carbon Supply in Trees and Shrubs at the Alpine Treeline Ecotone. Veg. 2018, 219, 467–479. [Google Scholar] [CrossRef]
- Xu, M.; Wang, G.; Li, X.; Cai, X.; Li, X.; Christie, P.; Zhang, J. The Key Factor Limiting Plant Growth in Cold and Humid Alpine Areas Also Plays a Dominant Role in Plant Carbon Isotope Discrimination. Front. Plant Sci. 2015, 6, 425. [Google Scholar] [CrossRef]
- Li, M.-H.; Jiang, Y.; Wang, A.; Li, X.; Zhu, W.; Yan, C.-F.; Du, Z.; Shi, Z.; Lei, J.; Schönbeck, L.; et al. Active Summer Carbon Storage for Winter Persistence in Trees at the Cold Alpine Treeline. Tree Physiol. 2018, 38, 1345–1355. [Google Scholar] [CrossRef]
- Weber, R.; Gessler, A.; Hoch, G. High Carbon Storage in Carbon-Limited Trees. New Phytol. 2019, 222, 171–182. [Google Scholar] [CrossRef] [PubMed]
- Zheng, L.; Meng, Y.; Ma, J.; Zhao, X.; Cheng, T.; Ji, J.; Chang, E.; Meng, C.; Deng, N.; Chen, L.; et al. Transcriptomic Analysis Reveals Importance of ROS and Phytohormones in Response to Short-Term Salinity Stress in Populus Tomentosa. Front. Plant Sci. 2015, 6, 433. [Google Scholar] [CrossRef] [PubMed]
- Dudhate, A.; Shinde, H.; Tsugama, D.; Liu, S.; Takano, T. Transcriptomic Analysis Reveals the Differentially Expressed Genes and Pathways Involved in Drought Tolerance in Pearl Millet [Pennisetum Glaucum (L.) R. Br]. PLoS ONE 2018, 13, e0195908. [Google Scholar] [CrossRef] [PubMed]
- Ma, L.; Sun, X.; Kong, X.; Galván, J.V.; Li, X.; Yang, S.; Yang, Y.; Yang, Y.; Hu, X. Physiological, Biochemical and Proteomics Analysis Reveals the Adaptation Strategies of the Alpine Plant Potentilla Saundersiana at Altitude Gradient of the Northwestern Tibetan Plateau. J. Proteom. 2015, 112, 63–82. [Google Scholar] [CrossRef]
- Yu, J.G.; Wang, E.Z. Modern Practical Instrument Analysis Method, 1st ed.; China Forestry Publishing: Beijing, China, 1994; pp. 83–84. [Google Scholar]
- Shi, Z.; Bai, D.Z.; Zhang, W.C.; Xiao, W.F. Variation of Nonstructural Carbohydrate (NSC) in Picea Crassifolia at the Alpine Treeline of Qilian Mountains before and After Dormancy. Forest Res. 2017, 30, 908–915. [Google Scholar]
- Liu, F.L.; Dai, H.J. Food Physicochemical Analysis Method, 1st ed.; Light Industry Press: Beijing, China, 1987; pp. 65–66. [Google Scholar]
- Trapnell, C.; Pachter, L.; Salzberg, S.L. TopHat: Discovering Splice Junctions With RNA-Seq. Bioinformatics 2009, 25, 1105–1111. [Google Scholar] [CrossRef]
- Trapnell, C.; Williams, B.A.; Pertea, G.; Mortazavi, A.; Kwan, G.; Van Baren, M.J.; Salzberg, S.L.; Wold, B.J.; Pachter, L. Transcript Assembly and Quantification by RNA-Seq Reveals Unannotated Transcripts and Isoform Switching During Cell Differentiation. Nat. Biotechnol. 2010, 28, 511–515. [Google Scholar] [CrossRef]
- Anders, S.; Huber, W. Differential Expression Analysis for Sequence Count Data. Genome Biol. 2010, 11, R106. [Google Scholar] [CrossRef]
- Young, M.D.; Wakefield, M.J.; Smyth, G.K.; Oshlack, A. Gene Ontology Analysis for RNA-Seq: Accounting for Selection Bias. Genome Boil. 2010, 11, R14. [Google Scholar] [CrossRef]
- Kanehisa, M.; Araki, M.; Goto, S.; Hattori, M.; Hirakawa, M.; Itoh, M.; Katayama, T.; Kawashima, S.; Okuda, S.; Tokimatsu, T.; et al. KEGG for Linking Genomes to Life and the Environment. Nucleic Acids Res. 2008, 36, 480–484. [Google Scholar] [CrossRef]
- Yakovlev, I.A.; Fossdal, C.-G.; Johnsen, Ø.; Junttila, O.; Skrøppa, T. Analysis of Gene Expression During Bud Burst Initiation in Norway Spruce via ESTs from Subtracted CDNA Libraries. Tree Genet. Genomes 2006, 2, 39–52. [Google Scholar] [CrossRef]
- Palacio, S.; Camarero, J.J.; Maestro, M.; Alla, A.Q.; Lahoz, E.; Montserrat-Martí, G. Are Storage and Tree Growth Related? Seasonal Nutrient and Carbohydrate Dynamics in Evergreen and Deciduous Mediterranean Oaks. Trees 2018, 32, 777–790. [Google Scholar] [CrossRef]
- Ogren, E. Relationship Between Temperature, Respiratory Loss of Sugar and Premature De Hardening in Dormant Scots Pine Seedlings. Tree Physiol. 1997, 17, 47–51. [Google Scholar] [CrossRef] [PubMed]
- Morin, X.; Améglio, T.; Ahas, R.; Kurz-Besson, C.; Lanta, V.; LeBourgeois, F.; Miglietta, F.; Chuine, I. Variation in Cold Hardiness and Carbohydrate Concentration from Dormancy Induction to Bud Burst Among Provenances of Three European Oak Species. Tree Physiol. 2007, 27, 817–825. [Google Scholar] [CrossRef] [PubMed]
- Hoch, G.; Popp, M.; Körner, C. Altitudinal Increase of Mobile Carbon Pools in Pinus Cembra Suggests Sink Limitation of Growth at the Swiss Treeline. Oikos 2002, 98, 361–374. [Google Scholar] [CrossRef]
- Wang, Z.; Xia, C.; Yu, D.; Wu, Z. Low-Temperature Induced Leaf Elements Accumulation in Aquatic Macrophytes across Tibetan Plateau. Ecol. Eng. 2015, 75, 1–8. [Google Scholar] [CrossRef]
- Hong, J.; Wang, X.; Wu, J. Stoichiometry of Root and Leaf Nitrogen and Phosphorus in a Dry Alpine Steppe on the Northern Tibetan Plateau. PLoS ONE 2014, 9, 109052. [Google Scholar] [CrossRef]
- Reich, P.B.; Oleksyn, J. Global Patterns of Plant Leaf N and P in Relation to Temperature and Latitude. Proc. Natl. Acad. Sci. 2004, 101, 11001–11006. [Google Scholar] [CrossRef]
- Millard, P.; Proe, M.F. Storage and Internal Cycling of Nitrogen in Relation to Seasonal Growth of Sitka Spruce. Tree Physiol. 1992, 10, 33–43. [Google Scholar] [CrossRef]
- Millard, P.; Grelet, G.-A. Nitrogen Storage and Remobilization by Trees: Ecophysiological Relevance in a Changing World. Tree Physiol. 2010, 30, 1083–1095. [Google Scholar] [CrossRef]
- Goulas, E.; Schubert, M.; Kieselbach, T.; Kleczkowski, L.A.; Gardeström, P.; Schröder, W.; Hurry, V. The Chloroplast Lumen and Stromal Proteomes of Arabidopsis Thaliana Show Differential Sensitivity to Short-and Long-Term Exposure to Low Temperature. Plant J. 2006, 47, 720–734. [Google Scholar] [CrossRef] [PubMed]
- Friesen, P.C.; Sage, R.F. Photosynthetic Responses to Chilling in a Chilling-Tolerant and Chilling-Sensitive Miscanthus Hybrid. Plant Cell Environ. 2016, 39, 1420–1431. [Google Scholar] [CrossRef] [PubMed]
- Liu, R.; Xu, Y.; Jiang, S.; Lu, K.; Lu, Y.; Feng, X. The Light-Harvesting Chlorophyll a/B-Binding Proteins, Positively Involved in a Bscisic Acid Signaling, Require a Transcription Repressor, WRKY40, to Balance Their Function. J. Exp. Bot. 2013, 64, 5443–5456. [Google Scholar] [CrossRef] [PubMed]
- Liu, Y.; Ji, D.; Turgeon, R.; Chen, J.; Lin, T.; Huang, J.; Luo, J.; Zhu, Y.; Zhang, C.; Lv, Z. Physiological and Proteomic Responses of Mulberry Trees (Morus Alba. L.) to Combined Salt and Drought Stress. Int. J. Mol. Sci. 2019, 20, 2486. [Google Scholar] [CrossRef] [PubMed]
- Pennycooke, J.C.; Jones, M.L.; Stushnoff, C. Down-Regulating α-Galactosidase Enhances Freezing Tolerance in Transgenic Petunia1. Plant Physiol. 2003, 133, 901–909. [Google Scholar] [CrossRef]
- Vinocur, B.; Altman, A. Recent Advances in Engineering Plant Tolerance to Abiotic Stress: Achievements and Limitations. Curr. Opin. Biotechnol. 2005, 16, 123–132. [Google Scholar] [CrossRef]
- Rowland, O.; Zheng, H.; Hepworth, S.R.; Lam, P.; Jetter, R.; Kunst, L. CER4 Encodes an Alcohol-Forming Fatty Acyl-Coenzyme A Reductase Involved in Cuticular Wax Production in Arabidopsis1[W]. Plant Physiol. 2006, 142, 866–877. [Google Scholar] [CrossRef]
- He, J.; Tang, S.; Yang, D.; Chen, Y.; Ling, L.; Zou, Y.; Zhou, M.; Xu, X. Chemical and Transcriptomic Analysis of Cuticle Lipids under Cold Stress in the Llungiella Salsuginea. Inter. J. Mol. Sci. 2019, 20, e4519. [Google Scholar] [CrossRef]
- Lee, S.B.; Suh, M.C. Advances in the Understanding of Cuticular Waxes in Arabidopsis Thaliana and Crop Species. Plant Cell Rep. 2015, 34, 557–572. [Google Scholar] [CrossRef]
- Domínguez, E.; Heredia-Guerrero, J.A.; Heredia, A. The Biophysical Design of Plant Cuticles: A View. New Phytol. 2011, 189, 938–949. [Google Scholar]
- Todd, J.; Post-Beittenmiller, D.; Jaworski, J.G. KCS1encodes a Fatty Acid Elongase 3-Ketoacyl-CoA Synthase Affecting Wax Biosynthesis In Arabidopsis Thaliana. Plant J. 1999, 17, 119–130. [Google Scholar] [CrossRef] [PubMed]
- Xue, D.; Zhang, X.; Lu, X.; Chen, G.; Chen, Z.-H. Molecular and Evolutionary Mechanisms of Cuticular Wax for Plant Drought Tolerance. Front. Plant Sci. 2017, 8, 2115. [Google Scholar] [CrossRef] [PubMed]
- Zhang, C.-L.; Mao, K.; Zhou, L.-J.; Wang, G.-L.; Zhang, Y.-L.; Li, Y.-Y.; Hao, Y.-J. Genome-Wide Identification and Characterization of Apple Long-Chain Acyl-CoA Synthetases and Expression Analysis under Different Stresses. Plant Physiol. Biochem. 2018, 132, 320–332. [Google Scholar] [CrossRef] [PubMed]
- Cao, Y.; Han, Y.; Meng, D.; Abdullah, M.; Yu, J.; Li, D.; Jin, Q.; Lin, Y.; Cai, Y. Expansion and Evolutionary Patterns of GDSL-Type esterases/Lipases in Rosaceae Genomes. Funct. Integr. Genom. 2018, 18, 673–684. [Google Scholar] [CrossRef] [PubMed]
- Peng, X.; Wu, H.; Chen, H.; Zhang, Y.; Qiu, D.; Zhang, Z. Transcriptome Profiling Reveals Candidate Flavonol-Related Genes of Tetrastigma Hemsleyanum under Cold Stress. BMC Genom. 2019, 20, 687. [Google Scholar] [CrossRef] [PubMed]
- Jia, Y.; Li, B.; Zhang, Y.; Zhang, X.; Xu, Y.; Li, C. Evolutionary Dynamic Analyses on Monocot Flavonoid 3′-Hydroxylase Gene Family Reveal Evidence of Plant-Environment Interaction. BMC Plant Boil. 2019, 19, 347. [Google Scholar] [CrossRef]
- Martínez-Lüscher, J.; Delrot, S.; Aguirreolea, J.; Pascual, I.; Gomes, E.; Sánchez-Díaz, M.; Gomès, E. Ultraviolet-B Radiation and Water Deficit Interact to Alter Flavonol and Anthocyanin Profiles in Grapevine Berries through Transcriptomic Regulation. Plant Cell Physiol. 2014, 55, 1925–1936. [Google Scholar] [CrossRef]


| Gene | Log2(2900/2500) | Log2(3300/2500) | Gene ID | Annotation | Accession |
|---|---|---|---|---|---|
| Photosynthetic Carbon Assimilation | |||||
| CLH2 | 1.8 | 1.9 | MA_337265g0010 | Chlorophyllase-2 | sp|Q9M7I7|CLH2_ARATH |
| LHCA4 | −0.6 | −1.0 | MA_65346g0010 | Chlorophyll a-b binding protein 4 | sp|P27521|CA4_ARATH |
| LHCB4C | −0.6 | −1.0 | MA_129206g0010 | Chlorophyll a-b binding protein CP29.3 | sp|Q9S7W1|CB4C_ARATH |
| LHCB2A | −0.6 | −1.3 | MA_97315g0010 | Chlorophyll a-b binding protein type 2 member 1A | sp|P15193|CB2A_PINSY |
| LHCB22 | 0.9 | 1.8 | MA_1315g0010 | Chlorophyll a-b binding protein type 2 member 1B | sp|P15194|CB2B_PINSY |
| LHCB21 | −0.9 | −1.3 | MA_10431300g0030 | Chlorophyll a-b binding protein type 2 member 2 | sp|P15192|CB22_PINSY |
| LHCB21 | −1.1 | −1.9 | MA_10431300g0010 | Chlorophyll a-b binding protein type I | sp|P10049|CB21_PINTH |
| LHCB21 | −1.0 | −1.7 | MA_10431300g0020 | Chlorophyll a-b binding protein type I | sp|P10049|CB21_PINTH |
| LHCB21 | −1.0 | −1.7 | MA_267089g0010 | Chlorophyll a-b binding protein type I | sp|P10049|CB21_PINTH |
| PSAD | −0.5 | −1.0 | MA_9169733g0010 | Photosystem I reaction center subunit II, chloroplastic | sp|P32869|PSAD_CUCSA |
| PSAF | −0.8 | −1.5 | MA_10090427g0010 | Photosystem I reaction center subunit III, chloroplastic | sp|P46486|PSAF_FLATR |
| PSAN | 4.0 | 5.7 | MA_3482g0010 | Photosystem I reaction center subunit N, chloroplastic | sp|P49107|PSAN_ARATH |
| PSAG | −0.5 | −1.1 | MA_100910g0020 | Photosystem I reaction center subunit V, chloroplastic | sp|Q9S7N7|PSAG_ARATH |
| PSAL | −0.5 | −1.0 | MA_3403026g0010 | Photosystem I reaction center subunit XI, chloroplastic | sp|P23993|PSAL_HORVU |
| PSAO | −0.6 | −1.0 | MA_893g0010 | Photosystem I subunit | sp|Q949Q5|PSAO_ARATH |
| PSAO | −0.5 | −1.0 | MA_7732837g0010 | Photosystem I subunit | sp|Q949Q5|PSAO_ARATH |
| PSBR | −1.1 | −1.1 | MA_282261g0010 | Photosystem II 10 kDa polypeptide, chloroplastic | sp|P06183|PSBR_SOLTU |
| PST2 | −0.6 | −1.2 | MA_17217g0020 | Photosystem II 5 kDa protein, chloroplastic | sp|P31336|PST2_GOSHI |
| PSBY | −0.7 | −1.2 | MA_12201g0010 | Photosystem II core complex proteins psbY, chloroplastic | sp|P80470|PSBY_SPIOL |
| PSBO | −0.4 | −1.3 | MA_491379g0010 | Photosystem II oxygen-evolving enhancer protein 1, chloroplastic | sp|O49079|PSBO_FRIAG |
| PSBP | −0.7 | −1.0 | MA_3005g0010 | Photosystem II oxygen-evolving enhancer protein 2, chloroplastic | sp|Q9SLQ8|PSBP_CUCSA |
| PSBQ1 | −0.5 | −1.0 | MA_218996g0010 | Photosystem II oxygen-evolving enhancer protein 3-1, chloroplastic | sp|Q9XFT3|PSBQ1_ARATH |
| RBCS | 1.4 | 2.9 | MA_476g0010 | Ribulose bisphosphate carboxylase small chain, chloroplastic | sp|P16031|RBS_LARLA |
| FRO7 | −0.3 | −1.1 | MA_79239g0010 | Ferric reduction oxidase 7, chloroplastic | sp|Q3KTM0|FRO7_ARATH |
| Energy Metabolism | |||||
| F16P | −0.2 | −1.0 | MA_10432295g0010 | Fructose-1,6-bisphosphatase, chloroplastic | sp|Q07204|F16P1_BRANA |
| KPRS1 | −0.7 | −1.1 | MA_10431983g0010 | Ribose-phosphate pyrophosphokinase 1 | sp|Q9XG98|KPRS1_SPIOL |
| G3PC | −1.1 | −0.1 | MA_10426544g0010 | Glyceraldehyde-3-phosphate dehydrogenase, cytosolic | sp|P34924|G3PC_PINSY |
| G3PC | −1.1 | −0.7 | MA_8215705g0010 | Glyceraldehyde-3-phosphate dehydrogenase, cytosolic | sp|P34924|G3PC_PINSY |
| ALD | 1.1 | 1.7 | MA_259175g0010 | Aldose 1-epimerase | sp|Q5EA79|GALM_BOVIN |
| SDHA | 0.7 | 1.4 | MA_10427069g0010 | Succinate dehydrogenase [ubiquinone] flavoprotein subunit, mitochondrial | sp|Q6ZDY8|SDHA_ORYSJ |
| GAD | 2.0 | 2.3 | MA_161013g0010 | Glutamate decarboxylase | sp|Q07346|GAD_PETHY |
| GAD | 1.4 | 0.7 | MA_89828g0010 | Glutamate decarboxylase | sp|Q07346|GAD_PETHY |
| Gene | Log2(2900/2500) | Log2(3300/2500) | Gene ID | Annotation | Accession |
|---|---|---|---|---|---|
| Soluble Sugars | |||||
| AGLU | 2.3 | 2.5 | MA_10431114g0020 | Alpha-glucosidase | sp|O04893|AGLU_SPIOL |
| AGAL | 2.7 | 3.5 | MA_10434513g0010 | Alpha-galactosidase mel1 | sp|Q9URZ0|AGAL_SCHPO |
| GOLS1 | −1.0 | −1.9 | MA_67331g0010 | Galactinol synthase | sp|Q9XGN4|GOLS1_AJURE |
| GAOA | −0.4 | −1.4 | MA_10429735g0020 | Galactose oxidase | sp|I1S2N3|GAOA_GIBZE |
| GAOA | −0.6 | −2.9 | MA_10429735g0010 | Galactose oxidase | sp|I1S2N3|GAOA_GIBZE |
| GAOA | −1.4 | −1.8 | MA_10437233g0040 | Galactose oxidase | sp|P0CS93|GAOA_GIBZA |
| RFS5 | −0.1 | 1.4 | MA_5981g0010 | Probable galactinol--sucrose galactosyltransferase 5 | sp|Q9FND9|RFS5_ARATH |
| RFS6 | 1.5 | 0.0 | MA_18317g0010 | Probable galactinol--sucrose galactosyltransferase 6 | sp|Q8RX87|RFS6_ARATH |
| Fatty Acids | |||||
| TSC10A | 2.9 | 6.5 | MA_18495g0010 | 3-dehydrosphinganine reductase TSC10A | sp|Q0WRJ2|TSC10A_ARATH |
| TSC10B | 1.6 | 3.0 | MA_681548g0010 | 3-dehydrosphinganine reductase TSC10B | sp|F4JZN6|TSC10B_ARATH |
| KCS1 | 1.8 | 3.1 | MA_10426663g0020 | 3-ketoacyl-CoA synthase 1 | sp|Q9MAM3|KCS1_ARATH |
| KCS10 | 2.3 | 3.2 | MA_91011g0010 | 3-ketoacyl-CoA synthase 10 | sp|Q570B4|KCS10_ARATH |
| KCS4 | 2.2 | 4.0 | MA_56709g0010 | 3-ketoacyl-CoA synthase 4 | sp|Q9LN49|KCS4_ARATH |
| KCS6 | 0.9 | 1.7 | MA_10605g0020 | 3-ketoacyl-CoA synthase 6 | sp|Q9XF43|KCS6_ARATH |
| KCS9 | 1.8 | 2.0 | MA_339700g0010 | 3-ketoacyl-CoA synthase 9 | sp|Q9SIX1|KCS9_ARATH |
| KASC1 | 1.4 | 2.2 | MA_127500g0010 | 3-oxoacyl-[acyl-carrier-protein] synthase I, chloroplastic | sp|P52410|KASC1_ARATH |
| FAR2 | 3.9 | 4.9 | MA_59202g0010 | Fatty acyl-CoA reductase 2 | sp|Q08891|FAR2_ARATH |
| FAR2 | 2.9 | 5.7 | MA_95531g0010 | Fatty acyl-CoA reductase 2 | sp|Q08891|FAR2_ARATH |
| FAR2 | 2.6 | 3.5 | MA_182956g0010 | Fatty acyl-CoA reductase 2 | sp|Q08891|FAR2_ARATH |
| AOC3 | 1.4 | 1.1 | MA_137604g0010 | Allene oxide cyclase 3, chloroplastic | sp|Q9LS01|AOC3_ARATH |
| DOX1 | −1.9 | 0.1 | MA_879270g0010 | Alpha-dioxygenase 1 | sp|Q9SGH6|DOX1_ARATH |
| AGAL | 2.7 | 3.5 | MA_10434513g0010 | Alpha-galactosidase mel1 | sp|Q9URZ0|AGAL_SCHPO |
| ACCC1 | 0.9 | 1.4 | MA_8514g0010 | Biotin carboxylase 1, chloroplastic | sp|B9HBA8|ACCC1_POPTR |
| GONS3 | 1.7 | 2.8 | MA_10432234g0010 | GDP-mannose transporter GONST3 | sp|Q9S845|GONS3_ARATH |
| GDL6 | −0.8 | 2.1 | MA_405425g0010 | GDSL esterase/lipase 6 | sp|Q9C996|GDL6_ARATH |
| GDL1 | 1.3 | 2.1 | MA_27394g0010 | GDSL esterase/lipase At1g06990 | sp|Q9LMJ3|GDL1_ARATH |
| GDL11 | −2.5 | −0.6 | MA_108996g0010 | GDSL esterase/lipase At1g28650 | sp|Q3E7I6|GDL11_ARATH |
| GDL34 | 1.7 | 2.8 | MA_502586g0010 | GDSL esterase/lipase At2g04570 | sp|Q9SJB4|GDL34_ARATH |
| GDL34 | 1.0 | 2.0 | MA_127753g0010 | GDSL esterase/lipase At2g04570 | sp|Q9SJB4|GDL34_ARATH |
| GDL42 | 3.0 | 4.0 | MA_10200362g0010 | GDSL esterase/lipase At2g30310 | sp|O22927|GDL42_ARATH |
| GDL59 | −1.5 | −2.2 | MA_569398g0010 | GDSL esterase/lipase At3g53100 | sp|Q0WPI9|GDL59_ARATH |
| GDL61 | 4.3 | 4.6 | MA_9056794g0010 | GDSL esterase/lipase At4g01130 | sp|Q9M153|GDL61_ARATH |
| GDL61 | 1.4 | 2.1 | MA_7763761g0010 | GDSL esterase/lipase At4g01130 | sp|Q9M153|GDL61_ARATH |
| GDL61 | 2.4 | 2.4 | MA_10426064g000 | GDSL esterase/lipase At4g01130 | sp|Q9M153|GDL61_ARATH |
| GDL62 | −1.6 | −0.4 | MA_829166g0010 | GDSL esterase/lipase At4g10955 | sp|Q680C0|GDL62_ARATH |
| GDL62 | 1.4 | 0.8 | MA_10212g0010 | GDSL esterase/lipase At4g10955 | sp|Q680C0|GDL62_ARATH |
| GDL64 | 1.5 | 2.8 | MA_10432722g000 | GDSL esterase/lipase At4g16230 | sp|O23470|GDL64_ARATH |
| GDL66 | 1.7 | 2.2 | MA_127685g0010 | GDSL esterase/lipase At4g26790 | sp|Q8VY93|GDL66_ARATH |
| GDL71 | −2.2 | −0.8 | MA_5838g0010 | GDSL esterase/lipase At5g03610 | sp|Q9LZS7|GDL71_ARATH |
| GDL72 | 4.4 | 5.1 | MA_152453g0010 | GDSL esterase/lipase At5g03810 | sp|Q9FFN0|GDL72_ARATH |
| GDL73 | 1.0 | 1.6 | MA_429323g0010 | GDSL esterase/lipase At5g03820 | sp|Q9LZC5|GDL73_ARATH |
| GDL73 | 5.8 | 6.1 | MA_101465g0010 | GDSL esterase/lipase At5g03820 | sp|Q9LZC5|GDL73_ARATH |
| GDL78 | 2.4 | 3.6 | MA_95656g0010 | GDSL esterase/lipase At5g22810 | sp|Q9FFC6|GDL78_ARATH |
| GDL79 | 1.3 | 1.7 | MA_10426867g000 | GDSL esterase/lipase At5g33370 | sp|Q8LB81|GDL79_ARATH |
| GDL79 | 1.5 | 2.2 | MA_65830g0010 | GDSL esterase/lipase At5g33370 | sp|Q8LB81|GDL79_ARATH |
| LOX1 | −1.6 | −1.4 | MA_6186g0010 | Linoleate 9S-lipoxygenase 1 | sp|Q76I22|LOX1_ORYSJ |
| LOX5 | −1.5 | −3.1 | MA_10436100g000 | Linoleate 9S-lipoxygenase 5, chloroplastic | sp|Q9LUW0|LOX5_ARATH |
| LACS2 | 1.1 | 2.1 | MA_113173g0010 | Long chain acyl-CoA synthetase 2 | sp|Q9XIA9|LACS2_ARATH |
| LACS4 | 2.4 | 3.0 | MA_10432761g000 | Long chain acyl-CoA synthetase 4 | sp|Q9T0A0|LACS4_ARATH |
| LACS5 | 2.3 | 3.0 | MA_839621g0010 | Long chain acyl-CoA synthetase 5 | sp|Q9T009|LACS5_ARATH |
| WAXS1 | −0.8 | −2.3 | MA_185166g0020 | Long-chain-alcohol O-fatty-acyltransferase | sp|Q9XGY6|WAXS1_SIMCH |
| HHT1 | −1.1 | 1.7 | MA_7233g0010 | Omega-hydroxypalmitate O-feruloyl transferase | sp|Q94CD1|HHT1_ARATH |
| HHT1 | 1.4 | 2.7 | MA_56269g0010 | Omega-hydroxypalmitate O-feruloyl transferase | sp|Q94CD1|HHT1_ARATH |
| FATB | 1.7 | 1.5 | MA_10197220g0010 | Palmitoyl-acyl carrier protein thioesterase, chloroplastic | sp|Q39513|FATB_CUPHO |
| AIM1 | −1.2 | −1.5 | MA_17817g0010 | Peroxisomal fatty acid beta-oxidation multifunctional protein | sp|Q9ZPI6|AIM1_ARATH |
| MFP | −1.1 | −1.4 | MA_92062g0010 | Peroxisomal fatty acid beta-oxidation multifunctional protein | sp|Q8W1L6|MFP_ORYSJ |
| SDR1 | −1.7 | −0.6 | MA_8431623g000 | Short-chain type dehydrogenase/reductase | sp|Q08632|SDR1_PICAB |
| HACD | 1.8 | 2.9 | MA_57869g0010 | Very-long-chain (3R)-3-hydroxyacyl-CoA dehydratase 2 | sp|Q8VZB2|HACD_ARAH |
| HACD | 1.6 | 2.6 | MA_125121g0010 | Very-long-chain (3R)-3-hydroxyacyl-CoA dehydratase 2 | sp|Q8VZB2|HACD_ARAH |
| ADH3 | 1.2 | 1.9 | MA_30381g0010 | Alcohol dehydrogenase 3 | sp|P14675|ADH3_SOLTU |
| ADH | 1.3 | 1.8 | MA_10430026g0010 | Alcohol dehydrogenase | sp|P48977|ADH_MALDO |
| ADHL3 | 2.1 | 2.8 | MA_173093g0010 | Alcohol dehydrogenase-like 3 | sp|A1L4Y2|ADHL3_ARATH |
| ADHL3 | 2.3 | 1.0 | MA_10430588g0010 | Alcohol dehydrogenase-like 3 | sp|A1L4Y2|ADHL3_ARATH |
| ADHL4 | 2.1 | 0.2 | MA_9998439g0010 | Alcohol dehydrogenase-like 4 | sp|Q8VZ49|ADHL4_ARATH |
| ADHL6 | 1.2 | 1.7 | MA_409626g0010 | Alcohol dehydrogenase-like 6 | sp|Q8LEB2|ADHL6_ARATH |
| AL2B7 | 1.9 | 1.8 | MA_10436762g0010 | Aldehyde dehydrogenase family 2 member B7 | sp|Q8S528|AL2B7_ARATH |
| AL3F1 | 1.0 | 1.8 | MA_10014137g0010 | Aldehyde dehydrogenase family 3 member F1 | sp|Q70E96|AL3F1_ARATH |
| AL3F1 | 1.2 | 2.1 | MA_97566g0010 | Aldehyde dehydrogenase family 3 member F1 | sp|Q70E96|AL3F1_ARATH |
| Flavonoids | |||||
| PALY | −0.4 | −1.0 | MA_10429279g0010 | Phenylalanine ammonia-lyase | sp|Q42667|PALY_CITLI |
| TCMO | −1.7 | −2.2 | MA_202753g0010 | Trans-cinnamate 4-monooxygenase | sp|P48522|TCMO_CATRO |
| TCMO | −1.6 | −1.8 | MA_130482g0010 | Trans-cinnamate 4-monooxygenase | sp|Q96423|TCMO_GLYEC |
| TCMO | 2.4 | 0.7 | MA_10435536g0010 | Trans-cinnamate 4-monooxygenase | sp|Q43054|TCMO_POPKI |
| COMT1 | −0.5 | −1.2 | MA_15892g0020 | Caffeic acid 3-O-methyltransferase | sp|Q8W013|COMT1_CATRO |
| COMT1 | −0.5 | −1.0 | MA_15892g0010 | Caffeic acid 3-O-methyltransferase | sp|Q43239|COMT1_ZINVI |
| CAMT | 1.3 | 1.7 | MA_9065834g0010 | Caffeoyl-CoA O-methyltransferase | sp|O04854|CAMT_EUCGU |
| CAMT | −1.1 | 0.1 | MA_4674g0010 | Caffeoyl-CoA O-methyltransferase | sp|Q41720|CAMT_ZINVI |
| CSE | 1.2 | 2.6 | MA_93032g0010 | Caffeoylshikimate esterase | sp|Q9C942|CSE_ARATH |
| CSE | −0.4 | −2.3 | MA_38618g0020 | Caffeoylshikimate esterase | sp|Q9C942|CSE_ARATH |
| CHSY | −1.0 | −1.8 | MA_401848g0010 | Chalcone synthase | sp|O65872|CHSY_PINST |
| F3′H | 5.1 | 5.0 | MA_10434848g0010 | Flavonoid 3′-monooxygenase | sp|Q9SD85|F3′H_ARATH |
| F3′H | −0.1 | 2.0 | MA_76780g0010 | Flavonoid 3′-monooxygenase | sp|Q9SBQ9|F3′H_PETHY |
| F3′H | −1.3 | −1.4 | MA_10430254g0010 | Flavonoid 3′-monooxygenase | sp|Q9SD85|F3′H_ARATH |
| F3′H | −1.5 | −5.5 | MA_252610g0010 | Flavonoid 3′-monooxygenase | sp|Q9SBQ9|F3′H_PETHY |
| F3′5′H | −4.0 | −1.4 | MA_281597g0010 | Flavonoid 3′,5′-hydroxylase | sp|Q96418|F3′5′H_EUSER |
| F3′5′H | −0.3 | 1.9 | MA_633198g0010 | Flavonoid 3′,5′-hydroxylase | sp|P37120|F3′5′H_SOLME |
| DFRA | 0.0 | −2.3 | MA_6840966g0010 | Dihydroflavonol-4-reductase | sp|P51104|DFRA_DIACA |
| DFRA | 1.5 | 1.8 | MA_10430209g0020 | Dihydroflavonol-4-reductase | sp|P51105|DFRA_GERHY |
| DFRA | 1.3 | 1.8 | MA_23704g0010 | Dihydroflavonol-4-reductase | sp|P51105|DFRA_GERHY |
| DFRA | 2.5 | 3.4 | MA_10433570g0010 | Dihydroflavonol-4-reductase | sp|P51105|DFRA_GERHY |
| DFRA | −1.7 | −1.2 | MA_10432784g0010 | Dihydroflavonol-4-reductase | sp|P51106|DFRA_HORVU |
| DFRA | 0.0 | −1.2 | MA_10432862g0010 | Dihydroflavonol-4-reductase | sp|P51106|DFRA_HORVU |
| FLS | −0.8 | −2.1 | MA_10431216g0010 | Flavonol synthase/flavanone 3-hydroxylase | sp|Q9M547|FLS_EUSER |
| LDOX | −2.3 | 0.7 | MA_4447g0010 | Leucoanthocyanidin dioxygenase | sp|P51091|LDOX_MALDO |
| 5GT1 | −0.9 | −1.4 | MA_5871698g0010 | Anthocyanidin 3-O-glucoside 5-O-glucosyltransferase 1 | sp|Q9ZR27|5GT1_PERFR |
| UFGT | 2.1 | 3.2 | MA_477384g0010 | Anthocyanidin 3-O-glucosyltransferase | sp|Q43716|UFGT_PETHY |
| ANR | 0.5 | 2.1 | MA_927736g0010 | Anthocyanidin reductase | sp|Q9SEV0|ANR_ARATH |
| ANR | −0.5 | −1.5 | MA_6784553g0010 | Anthocyanidin reductase | sp|Q9SEV0|ANR_ARATH |
| Gene | Log2(2900/2500) | Log2(3300/2500) | Gene ID | Annotation | Accession |
|---|---|---|---|---|---|
| Nitrogen Assimilation | |||||
| NR | −0.5 | −2.1 | MA_2389043g0010 | Nitrate reductase | sp|P27969|NR_HORVU |
| NR | −0.8 | −1.6 | MA_10432360g0020 | Nitrate reductase [NADH] (Fragment) | sp|P43101|NR_CICIN |
| NR | −1.0 | −1.0 | MA_10432360g0010 | Nitrate reductase [NADH] | sp|P17569|NR_CUCM |
| NIR | −1.6 | −3.4 | MA_22510g0010 | Ferredoxin--nitrite reductase, chloroplastic | sp|Q39161|NIR_ARATH |
| NRT1 | -0.7 | −1.5 | MA_4273216g0010 | Protein NRT1/ PTR FAMILY 2.13 | sp|Q8RX77|PTR21_ARATH |
| NRT1 | −0.5 | −2.0 | MA_167141g0010 | Protein NRT1/ PTR FAMILY 2.13 | sp|Q9SX20|PTR18_ARATH |
| NRT1 | −0.2 | 1.2 | MA_122722g0010 | Protein NRT1/ PTR FAMILY 3.1 | sp|Q9SX20|PTR18_ARATH |
| AMT31 | 1.4 | 0.7 | MA_55379g0010 | Ammonium transporter 3 member 1 | sp|Q84KJ6|AMT31_ORYSJ |
| Amino Acid Metabolism | |||||
| GLMS | 0.8 | −1.2 | MA_46900g0010 | Glutamine--fructose-6-phosphate aminotransferase | sp|Q8AAB1|GLMS_BACTN |
| METE | −1.1 | −1.1 | MA_10436788g0010 | 5-methyltetrahydropteroyltriglutamate--homocysteine methyltransferase | sp|Q42662|METE_PLESU |
| ARGI1 | 0.4 | 1.6 | MA_10426056g0010 | Arginase 1, mitochondrial | sp|P46637|ARGI1_ARATH |
| ARGI1 | 0.8 | 1.8 | MA_10435722g0010 | Arginase 1, mitochondrial | sp|B8AU84|ARGI1_ORYSI |
| AROD2 | −1.5 | −2.0 | MA_864553g0010 | Arginase 1, mitochondria6 | sp|Q9SSE7|AROD2_ARATH |
| AROD6 | −1.9 | −2.9 | MA_43667g0010 | Arogenate dehydratase/prephenate dehydratase 6, | sp|Q9SGD6|AROD6_ARATH |
| AAT5 | −0.8 | −2.0 | MA_17674g0010 | Aspartate aminotransferase 5, chloroplastic | sp|P46248|AAT5_ARATH |
| GAD | 1.4 | 0.7 | MA_89828g0010 | Glutamate decarboxylase | sp|Q07346|GAD_PETHY |
| HMT1 | −0.2 | −0.7 | MA_7286g0010 | Homocysteine S-methyltransferase 1 | sp|Q9SDL7|HMT1_ARATH |
| CAS1 | −1.1 | −1.4 | MA_6291g0010 | L-3-cyanoalanine synthase 1, mitochondrial | sp|Q1KLZ2|CAS1_MALDO |
| PALY | −0.4 | −1.0 | MA_10429279g0010 | Phenylalanine ammonia-lyase | sp|Q42667|PALY_CITLI |
| AROF | −0.3 | −1.2 | MA_10437122g0020 | Phospho-2-dehydro-3-deoxyheptonate aldolase 1 | sp|P27608|AROF_TOBAC |
| AROF | −0.8 | −1.4 | MA_10142969g0010 | Phospho-2-dehydro-3-deoxyheptonate aldolase 1 | sp|P21357|AROF_SOLTU |
| AROF | −1.0 | −1.2 | MA_10436001g0020 | Phospho-2-dehydro-3-deoxyheptonate aldolase 1 | sp|P21357|AROF_SOLTU |
| SDC1 | 1.3 | 1.5 | MA_39829g0020 | Serine decarboxylase 1 | sp|Q6ESZ9|SDC1_ORYSJ |
| GLYM1 | −0.6 | −1.2 | MA_7027365g0010 | Serine hydroxymethyl transferase 1, mitochondrial | sp|Q9SZJ5|GLYM1_ARATH |
| GLYM | −0.6 | −1.3 | MA_905984g0010 | Serine hydroxymethyltransferase, mitochondrial | sp|P34899|GLYM_PEA |
| SPD1 | 2.5 | 2.4 | MA_136411g0010 | Spermidine synthase 1 | sp|Q96556|SPD1_DATST |
© 2020 by the authors. Licensee MDPI, Basel, Switzerland. This article is an open access article distributed under the terms and conditions of the Creative Commons Attribution (CC BY) license (http://creativecommons.org/licenses/by/4.0/).
Share and Cite
Shi, Z.; Deng, X.; Bai, D.; Lei, J.; Li, M.; Zeng, L.; Xiao, W. Transcriptomic Analysis Reveals the Mechanism of Picea crassifolia Survival for Alpine Treeline Condition. Forests 2020, 11, 156. https://doi.org/10.3390/f11020156
Shi Z, Deng X, Bai D, Lei J, Li M, Zeng L, Xiao W. Transcriptomic Analysis Reveals the Mechanism of Picea crassifolia Survival for Alpine Treeline Condition. Forests. 2020; 11(2):156. https://doi.org/10.3390/f11020156
Chicago/Turabian StyleShi, Zheng, Xiuxiu Deng, Dengzhong Bai, Jingpin Lei, Maihe Li, Lixiong Zeng, and Wenfa Xiao. 2020. "Transcriptomic Analysis Reveals the Mechanism of Picea crassifolia Survival for Alpine Treeline Condition" Forests 11, no. 2: 156. https://doi.org/10.3390/f11020156
APA StyleShi, Z., Deng, X., Bai, D., Lei, J., Li, M., Zeng, L., & Xiao, W. (2020). Transcriptomic Analysis Reveals the Mechanism of Picea crassifolia Survival for Alpine Treeline Condition. Forests, 11(2), 156. https://doi.org/10.3390/f11020156